In silico study on β-aminoketone derivatives as thyroid ... · In silico study on ... CoMFA CoMSIA...
16
In silico study on β-aminoketone derivatives as thyroid hormone receptor inhibitors: a combined 3D-QSAR and molecular docking study Fang-Fang Wang a , Wei Yang b , Yong-Hui Shi c , Guo-Wei Le a,c, * a The State Key Laboratory of Food Science and Technology, Jiangnan University, Wuxi, 214122, China. b Department of Biochemistry and Molecular Biology, Faculty of Medicine, Monash University, Melbourne, VIC 3800, Australia. c The Institution of Food Nutrition and Safety, School of Food Science and Technology, Jiangnan University, Wuxi, 214122, China. * Corresponding author: Tel.: +86-510-8591-7789; Fax: + 86-510-8591-7789. E-mail: [email protected] Table S1. Molecular structures of Indane Derivatives and their TRβ binding affinity values (pIC50). Compound Structure TRβ1 pKi TRα1 pKi 1 4.7825 - 2 5.1487 - 3 5.3979 - 4 5.7696 - 5 5.6383 - 6 5.7959 - 7 5.5686 -
Transcript of In silico study on β-aminoketone derivatives as thyroid ... · In silico study on ... CoMFA CoMSIA...
In silico study on β-aminoketone derivatives as thyroid hormone receptor
inhibitors: a combined 3D-QSAR and molecular docking study
Fang-Fang Wanga, Wei Yangb, Yong-Hui Shic, Guo-Wei Lea,c,*
a The State Key Laboratory of Food Science and Technology, Jiangnan University, Wuxi, 214122,
China.
b Department of Biochemistry and Molecular Biology, Faculty of Medicine, Monash University,
Melbourne, VIC 3800, Australia.
c The Institution of Food Nutrition and Safety, School of Food Science and Technology, Jiangnan
University, Wuxi, 214122, China.
* Corresponding author: Tel.: +86-510-8591-7789; Fax: + 86-510-8591-7789.
E-mail: [email protected]
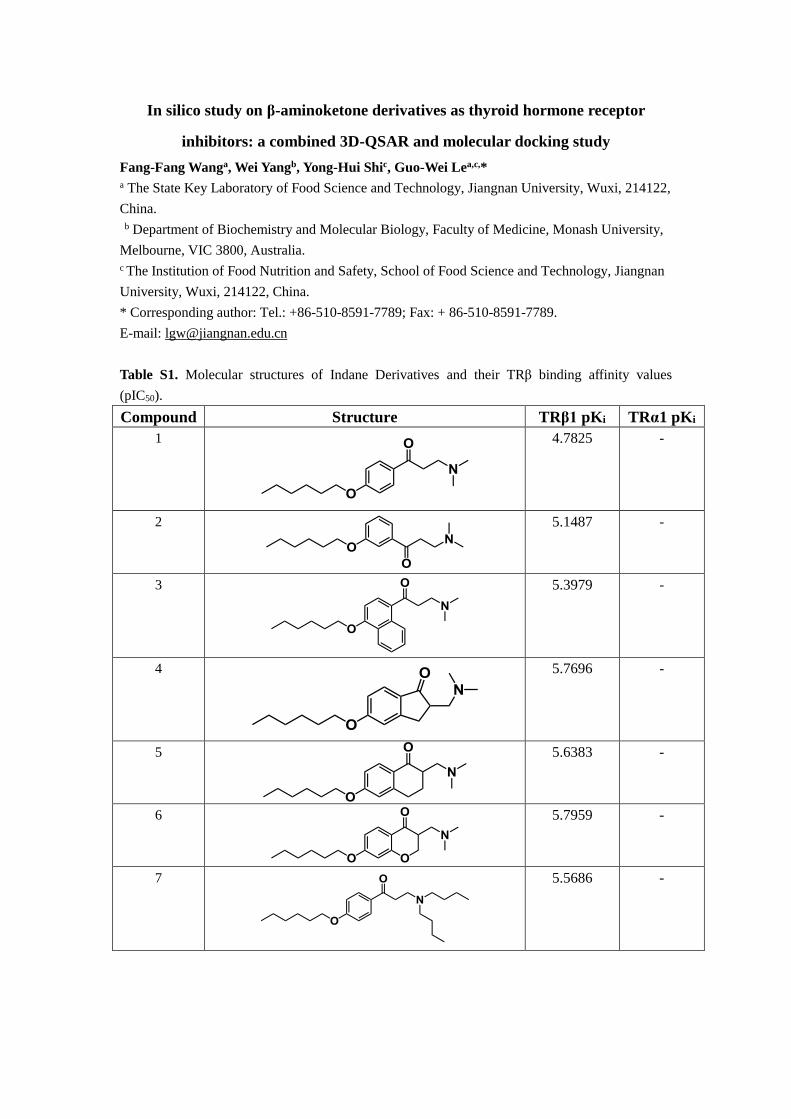
Table S1. Molecular structures of Indane Derivatives and their TRβ binding affinity values
(pIC50).
Compound Structure TRβ1 pKi TRα1 pKi
1
4.7825 -
2
5.1487 -
3
5.3979
-
4
5.7696
-
5
5.6383
-
6
5.7959
-
7
5.5686
-
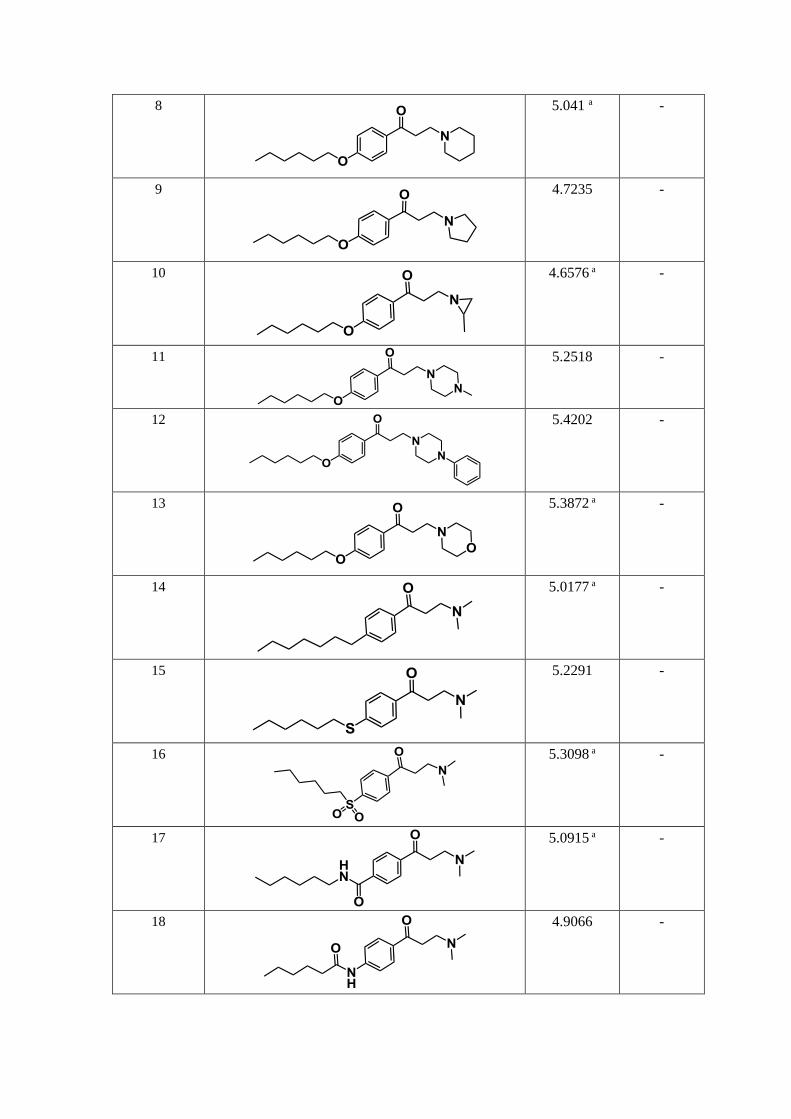
8
5.041 a
-
9
4.7235
-
10
4.6576 a
-
11
5.2518
-
12
5.4202
-
13
5.3872 a
-
14
5.0177 a
-
15
5.2291
-
16
5.3098 a
-
17
5.0915 a
-
18
4.9066
-
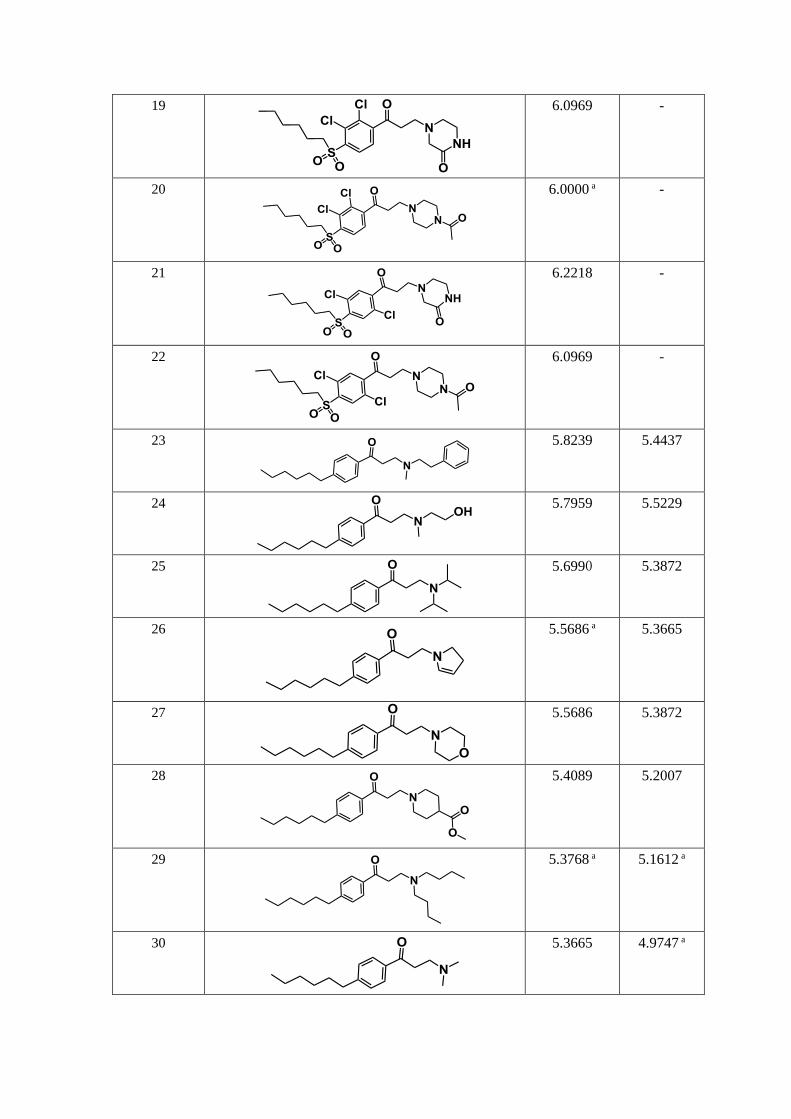
19
6.0969
-
20
6.0000 a
-
21
6.2218
-
22
6.0969
-
23
5.8239
5.4437
24
5.7959
5.5229
25
5.6990 5.3872
26
5.5686 a
5.3665
27
5.5686
5.3872
28
5.4089
5.2007
29
5.3768 a
5.1612 a
30
5.3665
4.9747 a
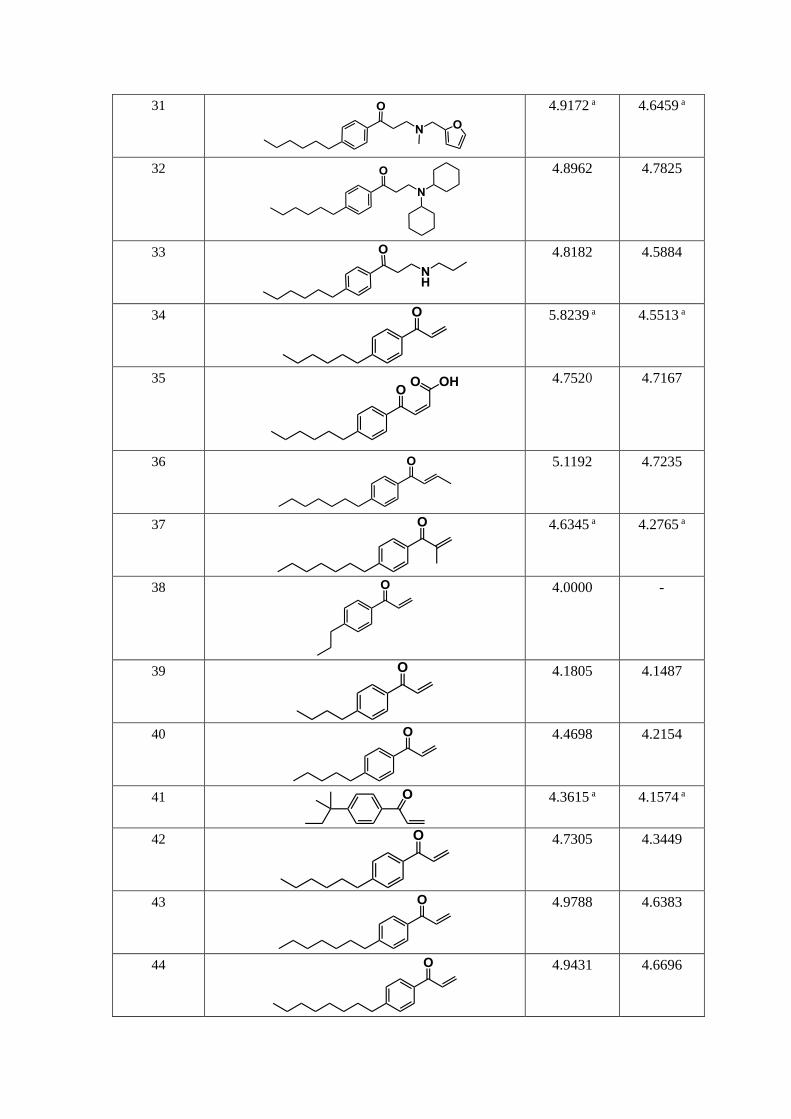
31
4.9172 a
4.6459 a
32
4.8962
4.7825
33
4.8182
4.5884
34
5.8239 a
4.5513 a
35
4.7520 4.7167
36
5.1192
4.7235
37
4.6345 a
4.2765 a
38
4.0000 -
39
4.1805
4.1487
40
4.4698
4.2154
41
4.3615 a
4.1574 a
42
4.7305
4.3449
43
4.9788
4.6383
44
4.9431
4.6696
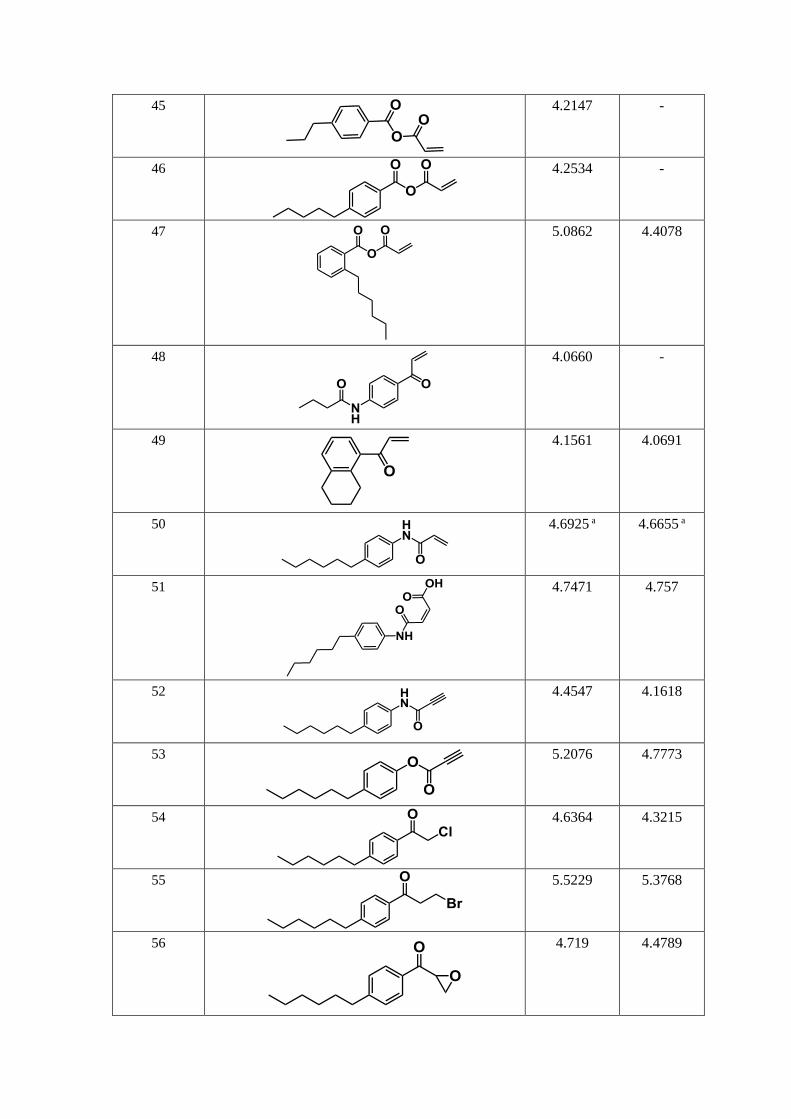
45
4.2147
-
46
4.2534
-
47
5.0862
4.4078
48
4.0660
-
49
4.1561
4.0691
50
4.6925 a
4.6655 a
51
4.7471
4.757
52
4.4547
4.1618
53
5.2076
4.7773
54
4.6364
4.3215
55
5.5229
5.3768
56
4.719
4.4789
a represents the test set.
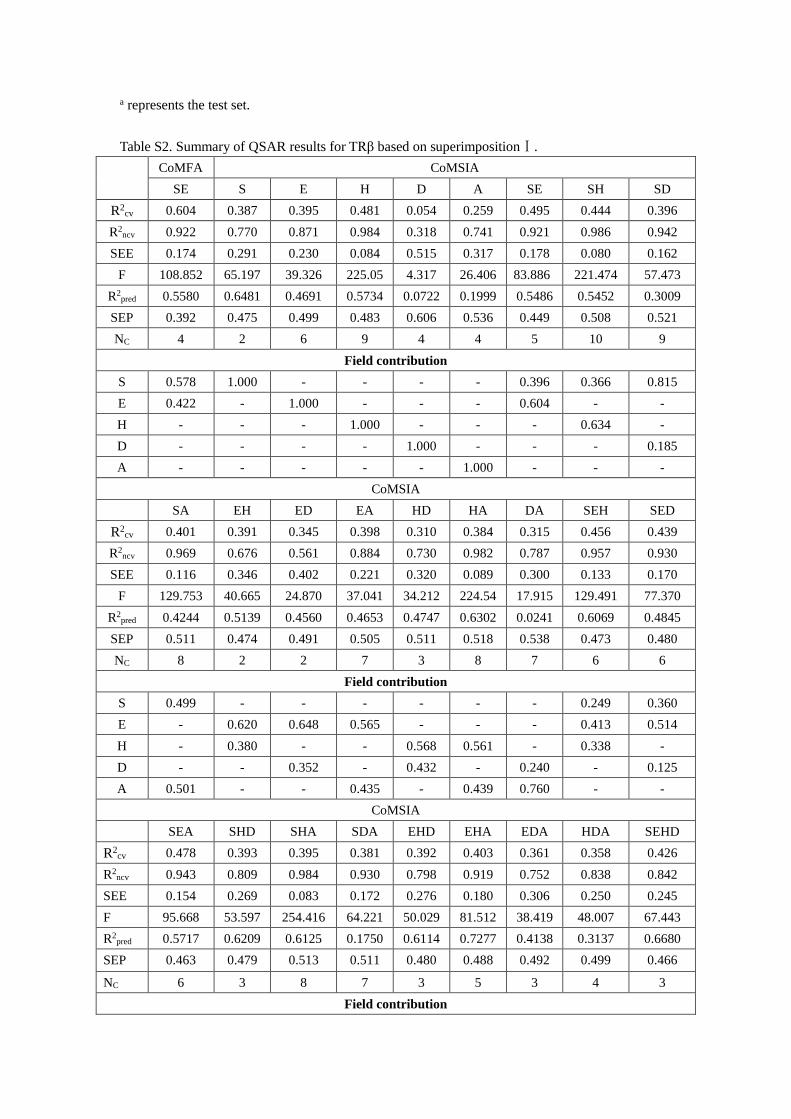
Table S2. Summary of QSAR results for TRβ based on superimpositionⅠ.
CoMFA CoMSIA
SE S E H D A SE SH SD
R2cv 0.604 0.387 0.395 0.481 0.054 0.259 0.495 0.444 0.396
R2ncv 0.922 0.770 0.871 0.984 0.318 0.741 0.921 0.986 0.942
SEE 0.174 0.291 0.230 0.084 0.515 0.317 0.178 0.080 0.162
F 108.852 65.197 39.326 225.05 4.317 26.406 83.886 221.474 57.473
R2pred 0.5580 0.6481 0.4691 0.5734 0.0722 0.1999 0.5486 0.5452 0.3009
SEP 0.392 0.475 0.499 0.483 0.606 0.536 0.449 0.508 0.521
NC 4 2 6 9 4 4 5 10 9
Field contribution
S 0.578 1.000 - - - - 0.396 0.366 0.815
E 0.422 - 1.000 - - - 0.604 - -
H - - - 1.000 - - - 0.634 -
D - - - - 1.000 - - - 0.185
A - - - - - 1.000 - - -
CoMSIA
SA EH ED EA HD HA DA SEH SED
R2cv 0.401 0.391 0.345 0.398 0.310 0.384 0.315 0.456 0.439
R2ncv 0.969 0.676 0.561 0.884 0.730 0.982 0.787 0.957 0.930
SEE 0.116 0.346 0.402 0.221 0.320 0.089 0.300 0.133 0.170
F 129.753 40.665 24.870 37.041 34.212 224.54 17.915 129.491 77.370
R2pred 0.4244 0.5139 0.4560 0.4653 0.4747 0.6302 0.0241 0.6069 0.4845
SEP 0.511 0.474 0.491 0.505 0.511 0.518 0.538 0.473 0.480
NC 8 2 2 7 3 8 7 6 6
Field contribution
S 0.499 - - - - - - 0.249 0.360
E - 0.620 0.648 0.565 - - - 0.413 0.514
H - 0.380 - - 0.568 0.561 - 0.338 -
D - - 0.352 - 0.432 - 0.240 - 0.125
A 0.501 - - 0.435 - 0.439 0.760 - -
CoMSIA
SEA SHD SHA SDA EHD EHA EDA HDA SEHD
R2cv 0.478 0.393 0.395 0.381 0.392 0.403 0.361 0.358 0.426
R2ncv 0.943 0.809 0.984 0.930 0.798 0.919 0.752 0.838 0.842
SEE 0.154 0.269 0.083 0.172 0.276 0.180 0.306 0.250 0.245
F 95.668 53.597 254.416 64.221 50.029 81.512 38.419 48.007 67.443
R2pred 0.5717 0.6209 0.6125 0.1750 0.6114 0.7277 0.4138 0.3137 0.6680
SEP 0.463 0.479 0.513 0.511 0.480 0.488 0.492 0.499 0.466
NC 6 3 8 7 3 5 3 4 3
Field contribution
S 0.283 0.256 0.253 0.399 - - - - 0.188
E 0.412 - - - 0.373 0.355 0.404 - 0.306
H - 0.404 0.393 - 0.353 0.343 - 0.391 0.276
D - 0.340 - 0.181 0.274 - 0.271 0.261 0.230
A 0.305 - 0.354 0.420 - 0.302 0.325 0.348 -
CoMSIA
SEHA SEDA SHDA EHDA SEHDA
R2cv 0.447 0.435 0.394 0.391 0.413
R2ncv 0.969 0.897 0.870 0.846 0.832
SEE 0.115 0.203 0.225 0.244 0.252
F 151.282 62.523 61.959 50.871 62.786
R2pred 0.6599 0.4685 0.3728 0.5946 0.6330
SEP 0.484 0.475 0.485 0.486 0.471
NC 7 5 4 4 3
Field contribution
S 0.191 0.235 0.196 - 0.147
E 0.301 0.355 - 0.285 0.245
H 0.276 - 0.297 0.278 0.214
D - 0.141 0.233 0.198 0.198
A 0.232 0.268 0.274 0.240 0.197
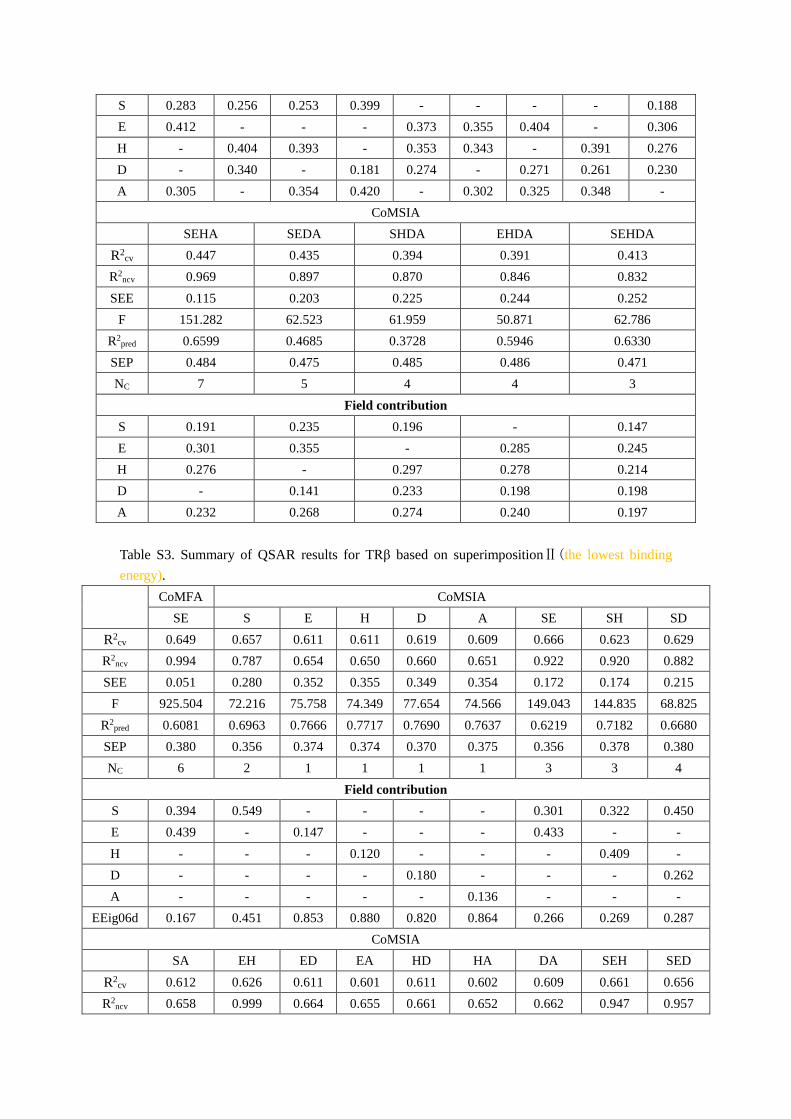
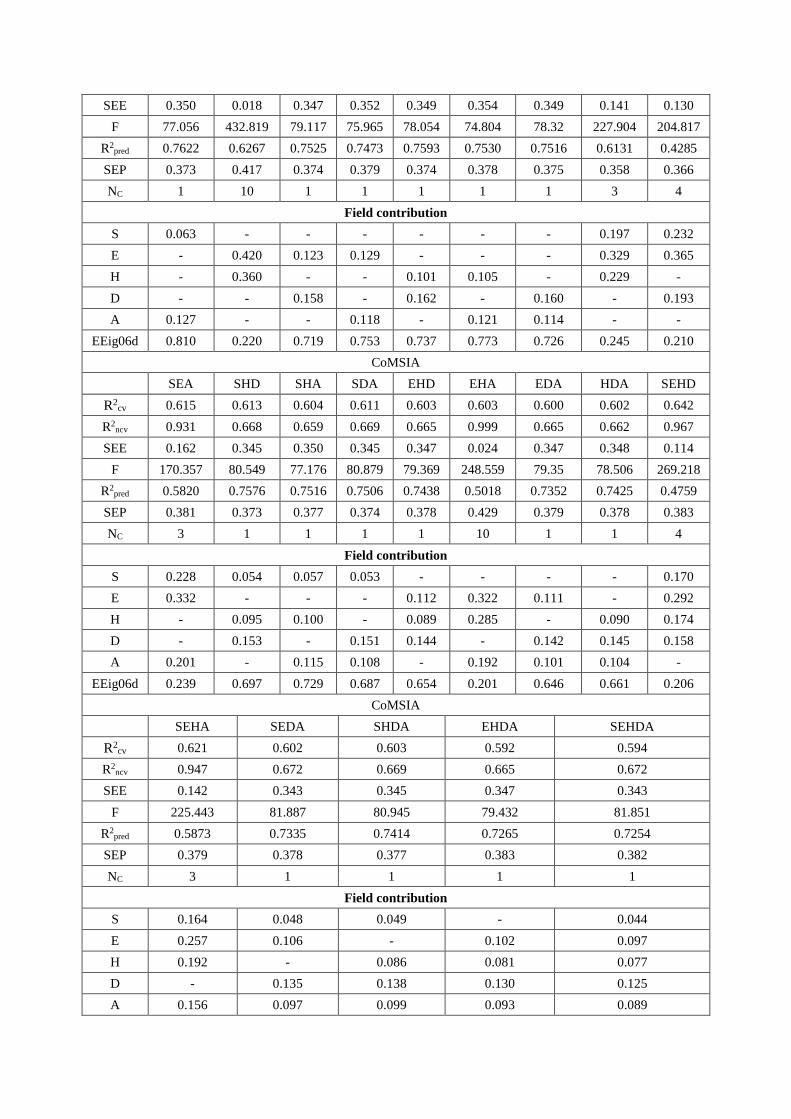
Table S3. Summary of QSAR results for TRβ based on superimpositionⅡ(the lowest binding
energy).
CoMFA CoMSIA
SE S E H D A SE SH SD
R2cv 0.649 0.657 0.611 0.611 0.619 0.609 0.666 0.623 0.629
R2ncv 0.994 0.787 0.654 0.650 0.660 0.651 0.922 0.920 0.882
SEE 0.051 0.280 0.352 0.355 0.349 0.354 0.172 0.174 0.215
F 925.504 72.216 75.758 74.349 77.654 74.566 149.043 144.835 68.825
R2pred 0.6081 0.6963 0.7666 0.7717 0.7690 0.7637 0.6219 0.7182 0.6680
SEP 0.380 0.356 0.374 0.374 0.370 0.375 0.356 0.378 0.380
NC 6 2 1 1 1 1 3 3 4
Field contribution
S 0.394 0.549 - - - - 0.301 0.322 0.450
E 0.439 - 0.147 - - - 0.433 - -
H - - - 0.120 - - - 0.409 -
D - - - - 0.180 - - - 0.262
A - - - - - 0.136 - - -
EEig06d 0.167 0.451 0.853 0.880 0.820 0.864 0.266 0.269 0.287
CoMSIA
SA EH ED EA HD HA DA SEH SED
R2cv 0.612 0.626 0.611 0.601 0.611 0.602 0.609 0.661 0.656
R2ncv 0.658 0.999 0.664 0.655 0.661 0.652 0.662 0.947 0.957
SEE 0.350 0.018 0.347 0.352 0.349 0.354 0.349 0.141 0.130
F 77.056 432.819 79.117 75.965 78.054 74.804 78.32 227.904 204.817
R2pred 0.7622 0.6267 0.7525 0.7473 0.7593 0.7530 0.7516 0.6131 0.4285
SEP 0.373 0.417 0.374 0.379 0.374 0.378 0.375 0.358 0.366
NC 1 10 1 1 1 1 1 3 4
Field contribution
S 0.063 - - - - - - 0.197 0.232
E - 0.420 0.123 0.129 - - - 0.329 0.365
H - 0.360 - - 0.101 0.105 - 0.229 -
D - - 0.158 - 0.162 - 0.160 - 0.193
A 0.127 - - 0.118 - 0.121 0.114 - -
EEig06d 0.810 0.220 0.719 0.753 0.737 0.773 0.726 0.245 0.210
CoMSIA
SEA SHD SHA SDA EHD EHA EDA HDA SEHD
R2cv 0.615 0.613 0.604 0.611 0.603 0.603 0.600 0.602 0.642
R2ncv 0.931 0.668 0.659 0.669 0.665 0.999 0.665 0.662 0.967
SEE 0.162 0.345 0.350 0.345 0.347 0.024 0.347 0.348 0.114
F 170.357 80.549 77.176 80.879 79.369 248.559 79.35 78.506 269.218
R2pred 0.5820 0.7576 0.7516 0.7506 0.7438 0.5018 0.7352 0.7425 0.4759
SEP 0.381 0.373 0.377 0.374 0.378 0.429 0.379 0.378 0.383
NC 3 1 1 1 1 10 1 1 4
Field contribution
S 0.228 0.054 0.057 0.053 - - - - 0.170
E 0.332 - - - 0.112 0.322 0.111 - 0.292
H - 0.095 0.100 - 0.089 0.285 - 0.090 0.174
D - 0.153 - 0.151 0.144 - 0.142 0.145 0.158
A 0.201 - 0.115 0.108 - 0.192 0.101 0.104 -
EEig06d 0.239 0.697 0.729 0.687 0.654 0.201 0.646 0.661 0.206
CoMSIA
SEHA SEDA SHDA EHDA SEHDA
R2cv 0.621 0.602 0.603 0.592 0.594
R2ncv 0.947 0.672 0.669 0.665 0.672
SEE 0.142 0.343 0.345 0.347 0.343
F 225.443 81.887 80.945 79.432 81.851
R2pred 0.5873 0.7335 0.7414 0.7265 0.7254
SEP 0.379 0.378 0.377 0.383 0.382
NC 3 1 1 1 1
Field contribution
S 0.164 0.048 0.049 - 0.044
E 0.257 0.106 - 0.102 0.097
H 0.192 - 0.086 0.081 0.077
D - 0.135 0.138 0.130 0.125
A 0.156 0.097 0.099 0.093 0.089
EEig06d 0.232 0.615 0.629 0.593 0.567
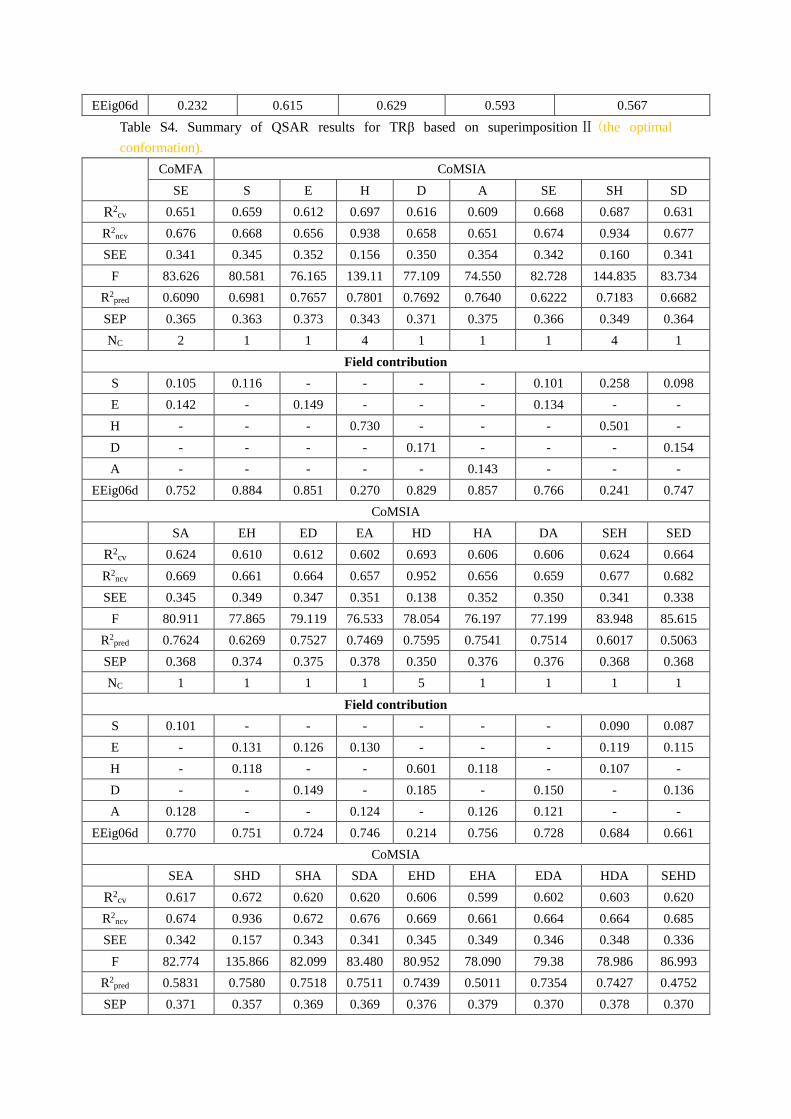
Table S4. Summary of QSAR results for TRβ based on superimpositionⅡ (the optimal
conformation).
CoMFA CoMSIA
SE S E H D A SE SH SD
R2cv 0.651 0.659 0.612 0.697 0.616 0.609 0.668 0.687 0.631
R2ncv 0.676 0.668 0.656 0.938 0.658 0.651 0.674 0.934 0.677
SEE 0.341 0.345 0.352 0.156 0.350 0.354 0.342 0.160 0.341
F 83.626 80.581 76.165 139.11 77.109 74.550 82.728 144.835 83.734
R2pred 0.6090 0.6981 0.7657 0.7801 0.7692 0.7640 0.6222 0.7183 0.6682
SEP 0.365 0.363 0.373 0.343 0.371 0.375 0.366 0.349 0.364
NC 2 1 1 4 1 1 1 4 1
Field contribution
S 0.105 0.116 - - - - 0.101 0.258 0.098
E 0.142 - 0.149 - - - 0.134 - -
H - - - 0.730 - - - 0.501 -
D - - - - 0.171 - - - 0.154
A - - - - - 0.143 - - -
EEig06d 0.752 0.884 0.851 0.270 0.829 0.857 0.766 0.241 0.747
CoMSIA
SA EH ED EA HD HA DA SEH SED
R2cv 0.624 0.610 0.612 0.602 0.693 0.606 0.606 0.624 0.664
R2ncv 0.669 0.661 0.664 0.657 0.952 0.656 0.659 0.677 0.682
SEE 0.345 0.349 0.347 0.351 0.138 0.352 0.350 0.341 0.338
F 80.911 77.865 79.119 76.533 78.054 76.197 77.199 83.948 85.615
R2pred 0.7624 0.6269 0.7527 0.7469 0.7595 0.7541 0.7514 0.6017 0.5063
SEP 0.368 0.374 0.375 0.378 0.350 0.376 0.376 0.368 0.368
NC 1 1 1 1 5 1 1 1 1
Field contribution
S 0.101 - - - - - - 0.090 0.087
E - 0.131 0.126 0.130 - - - 0.119 0.115
H - 0.118 - - 0.601 0.118 - 0.107 -
D - - 0.149 - 0.185 - 0.150 - 0.136
A 0.128 - - 0.124 - 0.126 0.121 - -
EEig06d 0.770 0.751 0.724 0.746 0.214 0.756 0.728 0.684 0.661
CoMSIA
SEA SHD SHA SDA EHD EHA EDA HDA SEHD
R2cv 0.617 0.672 0.620 0.620 0.606 0.599 0.602 0.603 0.620
R2ncv 0.674 0.936 0.672 0.676 0.669 0.661 0.664 0.664 0.685
SEE 0.342 0.157 0.343 0.341 0.345 0.349 0.346 0.348 0.336
F 82.774 135.866 82.099 83.480 80.952 78.090 79.38 78.986 86.993
R2pred 0.5831 0.7580 0.7518 0.7511 0.7439 0.5011 0.7354 0.7427 0.4752
SEP 0.371 0.357 0.369 0.369 0.376 0.379 0.370 0.378 0.370
NC 1 4 1 1 1 10 1 1 1
Field contribution
S 0.089 0.203 0.091 0.088 - - - - 0.079
E 0.118 - - - 0.114 0.117 0.113 - 0.105
H - 0.398 0.108 - 0.102 0.104 - 0.102 0.094
D - 0.197 - 0.137 0.134 - 0.133 0.135 0.124
A 0.113 - 0.115 0.111 - 0.111 0.108 0.109 -
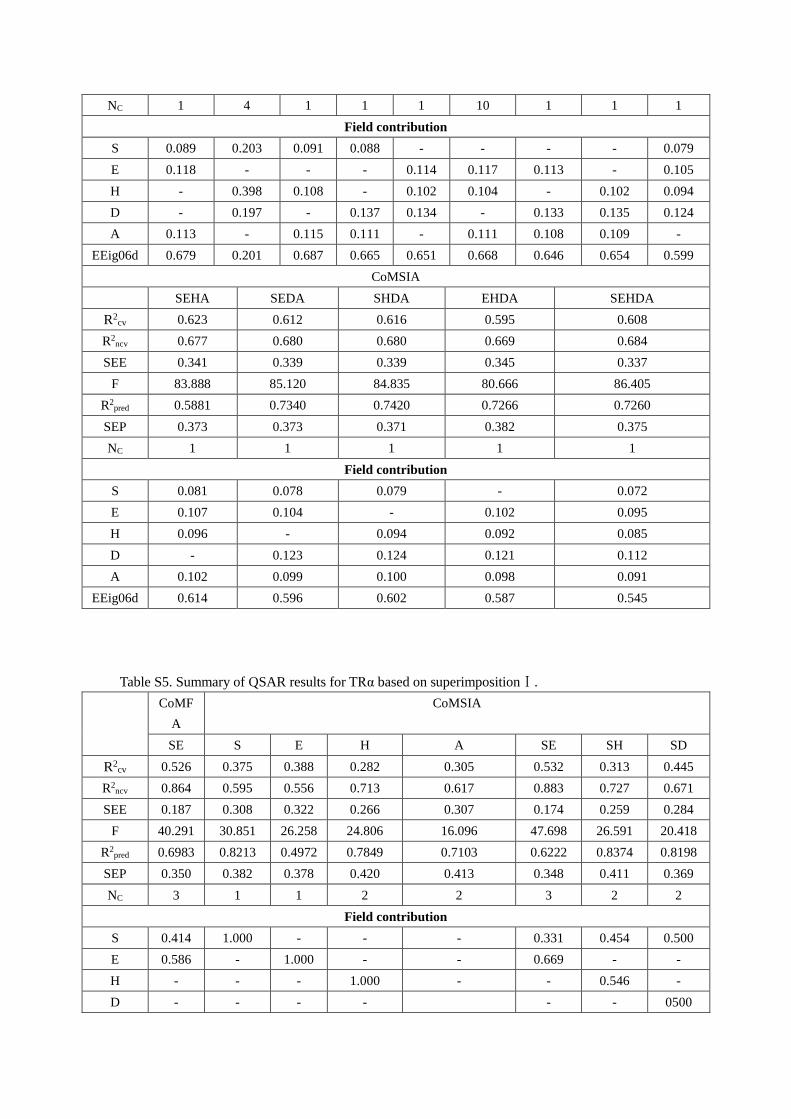
EEig06d 0.679 0.201 0.687 0.665 0.651 0.668 0.646 0.654 0.599
CoMSIA
SEHA SEDA SHDA EHDA SEHDA
R2cv 0.623 0.612 0.616 0.595 0.608
R2ncv 0.677 0.680 0.680 0.669 0.684
SEE 0.341 0.339 0.339 0.345 0.337
F 83.888 85.120 84.835 80.666 86.405
R2pred 0.5881 0.7340 0.7420 0.7266 0.7260
SEP 0.373 0.373 0.371 0.382 0.375
NC 1 1 1 1 1
Field contribution
S 0.081 0.078 0.079 - 0.072
E 0.107 0.104 - 0.102 0.095
H 0.096 - 0.094 0.092 0.085
D - 0.123 0.124 0.121 0.112
A 0.102 0.099 0.100 0.098 0.091
EEig06d 0.614 0.596 0.602 0.587 0.545
Table S5. Summary of QSAR results for TRα based on superimpositionⅠ.
CoMF
A
CoMSIA
SE S E H A SE SH SD
R2cv 0.526 0.375 0.388 0.282 0.305 0.532 0.313 0.445
R2ncv 0.864 0.595 0.556 0.713 0.617 0.883 0.727 0.671
SEE 0.187 0.308 0.322 0.266 0.307 0.174 0.259 0.284
F 40.291 30.851 26.258 24.806 16.096 47.698 26.591 20.418
R2pred 0.6983 0.8213 0.4972 0.7849 0.7103 0.6222 0.8374 0.8198
SEP 0.350 0.382 0.378 0.420 0.413 0.348 0.411 0.369
NC 3 1 1 2 2 3 2 2
Field contribution
S 0.414 1.000 - - - 0.331 0.454 0.500
E 0.586 - 1.000 - - 0.669 - -
H - - - 1.000 - - 0.546 -
D - - - - - - 0500
A - - - - 1.000 - - -
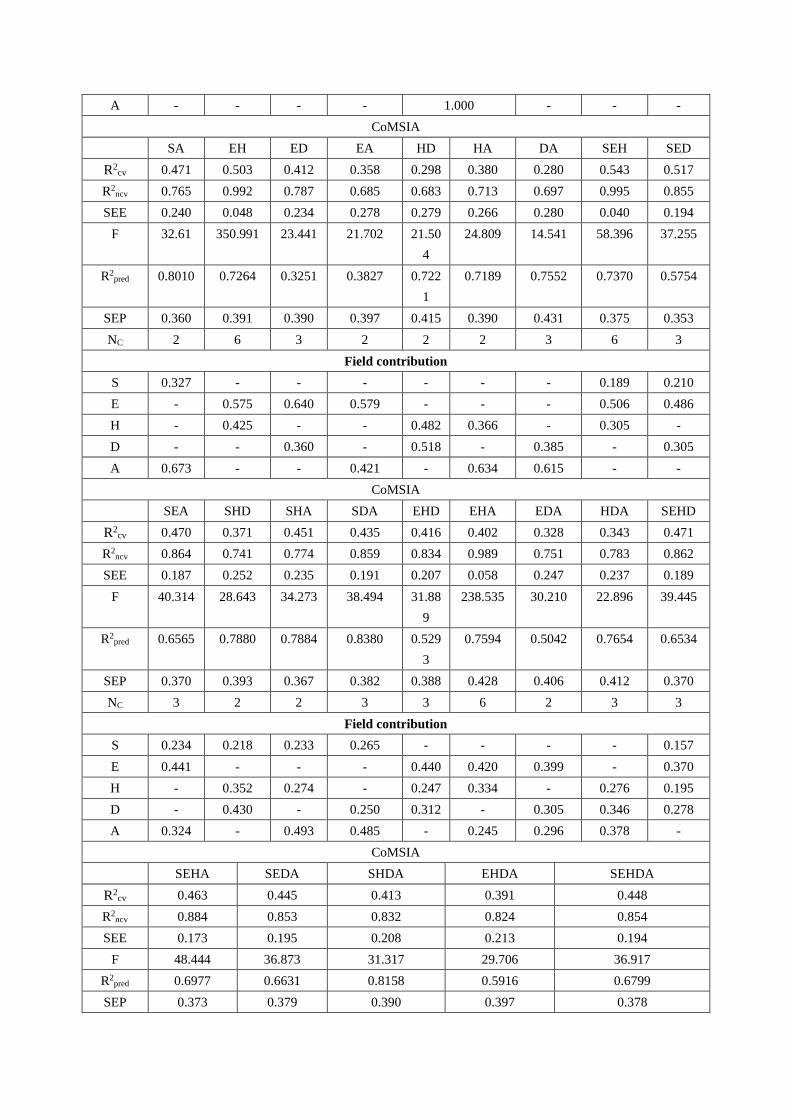
CoMSIA
SA EH ED EA HD HA DA SEH SED
R2cv 0.471 0.503 0.412 0.358 0.298 0.380 0.280 0.543 0.517
R2ncv 0.765 0.992 0.787 0.685 0.683 0.713 0.697 0.995 0.855
SEE 0.240 0.048 0.234 0.278 0.279 0.266 0.280 0.040 0.194
F 32.61 350.991 23.441 21.702 21.50
4
24.809 14.541 58.396 37.255
R2pred 0.8010 0.7264 0.3251 0.3827 0.722
1
0.7189 0.7552 0.7370 0.5754
SEP 0.360 0.391 0.390 0.397 0.415 0.390 0.431 0.375 0.353
NC 2 6 3 2 2 2 3 6 3
Field contribution
S 0.327 - - - - - - 0.189 0.210
E - 0.575 0.640 0.579 - - - 0.506 0.486
H - 0.425 - - 0.482 0.366 - 0.305 -
D - - 0.360 - 0.518 - 0.385 - 0.305
A 0.673 - - 0.421 - 0.634 0.615 - -
CoMSIA
SEA SHD SHA SDA EHD EHA EDA HDA SEHD
R2cv 0.470 0.371 0.451 0.435 0.416 0.402 0.328 0.343 0.471
R2ncv 0.864 0.741 0.774 0.859 0.834 0.989 0.751 0.783 0.862
SEE 0.187 0.252 0.235 0.191 0.207 0.058 0.247 0.237 0.189
F 40.314 28.643 34.273 38.494 31.88
9
238.535 30.210 22.896 39.445
R2pred 0.6565 0.7880 0.7884 0.8380 0.529
3
0.7594 0.5042 0.7654 0.6534
SEP 0.370 0.393 0.367 0.382 0.388 0.428 0.406 0.412 0.370
NC 3 2 2 3 3 6 2 3 3
Field contribution
S 0.234 0.218 0.233 0.265 - - - - 0.157
E 0.441 - - - 0.440 0.420 0.399 - 0.370
H - 0.352 0.274 - 0.247 0.334 - 0.276 0.195
D - 0.430 - 0.250 0.312 - 0.305 0.346 0.278
A 0.324 - 0.493 0.485 - 0.245 0.296 0.378 -
CoMSIA
SEHA SEDA SHDA EHDA SEHDA
R2cv 0.463 0.445 0.413 0.391 0.448
R2ncv 0.884 0.853 0.832 0.824 0.854
SEE 0.173 0.195 0.208 0.213 0.194
F 48.444 36.873 31.317 29.706 36.917
R2pred 0.6977 0.6631 0.8158 0.5916 0.6799
SEP 0.373 0.379 0.390 0.397 0.378
NC 3 3 3 3 3
Field contribution
S 0.177 0.163 0.167 - 0.126
E 0.359 0.351 - 0.320 0.279
H 0.199 - 0.215 0.182 0.151
D - 0.230 0.300 0.263 0.235
A 0.265 0.255 0.317 0.235 0.208
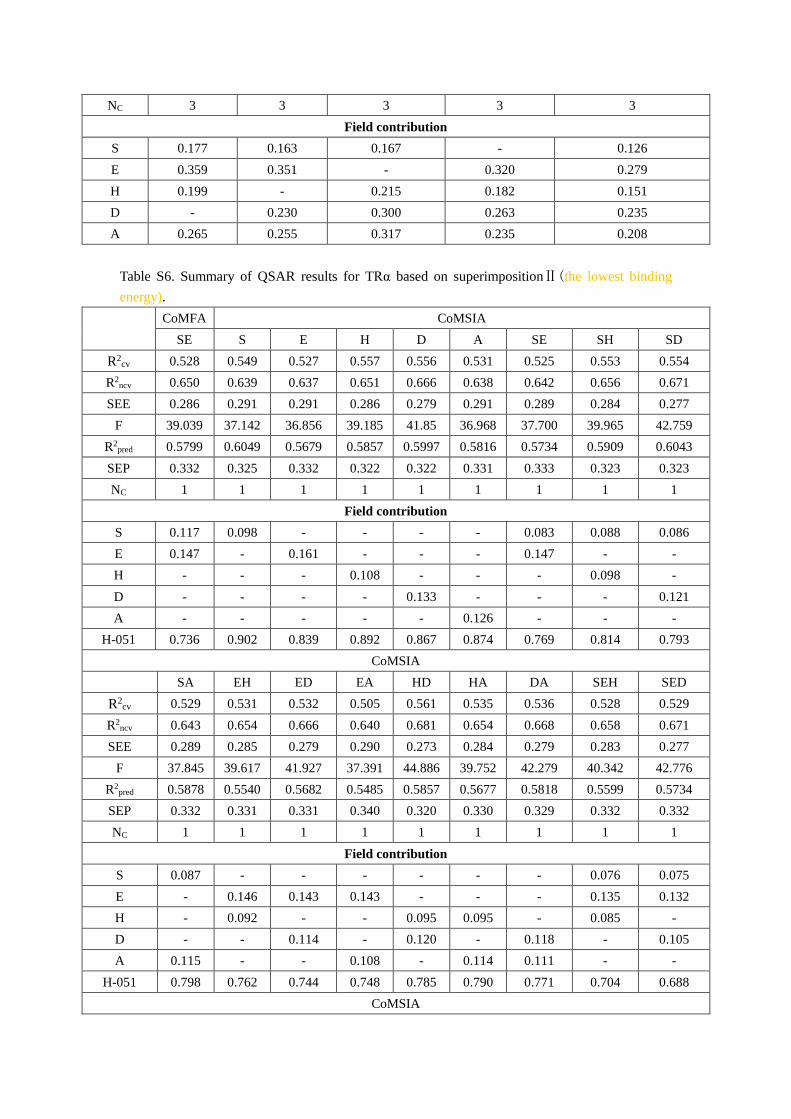
Table S6. Summary of QSAR results for TRα based on superimpositionⅡ(the lowest binding
energy).
CoMFA CoMSIA
SE S E H D A SE SH SD
R2cv 0.528 0.549 0.527 0.557 0.556 0.531 0.525 0.553 0.554
R2ncv 0.650 0.639 0.637 0.651 0.666 0.638 0.642 0.656 0.671
SEE 0.286 0.291 0.291 0.286 0.279 0.291 0.289 0.284 0.277
F 39.039 37.142 36.856 39.185 41.85 36.968 37.700 39.965 42.759
R2pred 0.5799 0.6049 0.5679 0.5857 0.5997 0.5816 0.5734 0.5909 0.6043
SEP 0.332 0.325 0.332 0.322 0.322 0.331 0.333 0.323 0.323
NC 1 1 1 1 1 1 1 1 1
Field contribution
S 0.117 0.098 - - - - 0.083 0.088 0.086
E 0.147 - 0.161 - - - 0.147 - -
H - - - 0.108 - - - 0.098 -
D - - - - 0.133 - - - 0.121
A - - - - - 0.126 - - -
H-051 0.736 0.902 0.839 0.892 0.867 0.874 0.769 0.814 0.793
CoMSIA
SA EH ED EA HD HA DA SEH SED
R2cv 0.529 0.531 0.532 0.505 0.561 0.535 0.536 0.528 0.529
R2ncv 0.643 0.654 0.666 0.640 0.681 0.654 0.668 0.658 0.671
SEE 0.289 0.285 0.279 0.290 0.273 0.284 0.279 0.283 0.277
F 37.845 39.617 41.927 37.391 44.886 39.752 42.279 40.342 42.776
R2pred 0.5878 0.5540 0.5682 0.5485 0.5857 0.5677 0.5818 0.5599 0.5734
SEP 0.332 0.331 0.331 0.340 0.320 0.330 0.329 0.332 0.332
NC 1 1 1 1 1 1 1 1 1
Field contribution
S 0.087 - - - - - - 0.076 0.075
E - 0.146 0.143 0.143 - - - 0.135 0.132
H - 0.092 - - 0.095 0.095 - 0.085 -
D - - 0.114 - 0.120 - 0.118 - 0.105
A 0.115 - - 0.108 - 0.114 0.111 - -
H-051 0.798 0.762 0.744 0.748 0.785 0.790 0.771 0.704 0.688
CoMSIA
SEA SHD SHA SDA EHD EHA EDA HDA SEHD
R2cv 0.502 0.558 0.532 0.533 0.535 0.507 0.509 0.539 0.532
R2ncv 0.645 0.685 0.659 0.673 0.681 0.656 0.668 0.682 0.684
SEE 0.288 0.271 0.282 0.277 0.273 0.284 0.279 0.272 0.272
F 38.210 45.648 40.507 43.161 44.729 39.987 42.167 45.104 45.448
R2pred 0.5546 0.5904 0.5738 0.5878 0.5539 0.5345 0.5475 0.5679 0.5597
SEP 0.341 0.322 0.331 0.330 0.330 0.339 0.339 0.328 0.331
NC 1 1 1 1 1 1 1 1 1
Field contribution
S 0.075 0.079 0.079 0.077 - - - - 0.069
E 0.133 - - - 0.131 0.131 0.129 - 0.122
H - 0.087 0.088 - 0.082 0.083 - 0.085 0.077
D - 0.111 - 0.109 0.104 - 0.103 0.108 0.097
A 0.100 - 0.105 0.103 - 0.099 0.097 0.102 -
H-051 0.692 0.724 0.728 0.711 0.683 0.686 0.672 0.705 0.636
CoMSIA
SEHA SEDA SHDA EHDA SEHDA
R2cv 0.505 0.506 0.536 0.511 0.508
R2ncv 0.660 0.672 0.686 0.681 0.684
SEE 0.282 0.277 0.271 0.273 0.272
F 40.696 42.998 45.851 44.773 45.486
R2pred 0.5409 0.5545 0.5736 0.5341 0.5404
SEP 0.340 0.340 0.329 0.338 0.339
NC 1 1 1 1 1
Field contribution
S 0.069 0.068 0.071 - 0.063
E 0.122 0.120 - 0.119 0.111
H 0.077 - 0.079 0.075 0.070
D - 0.096 0.100 0.095 0.089
A 0.092 0.091 0.095 0.090 0.084
H-051 0.639 0.626 0.655 0.621 0.582
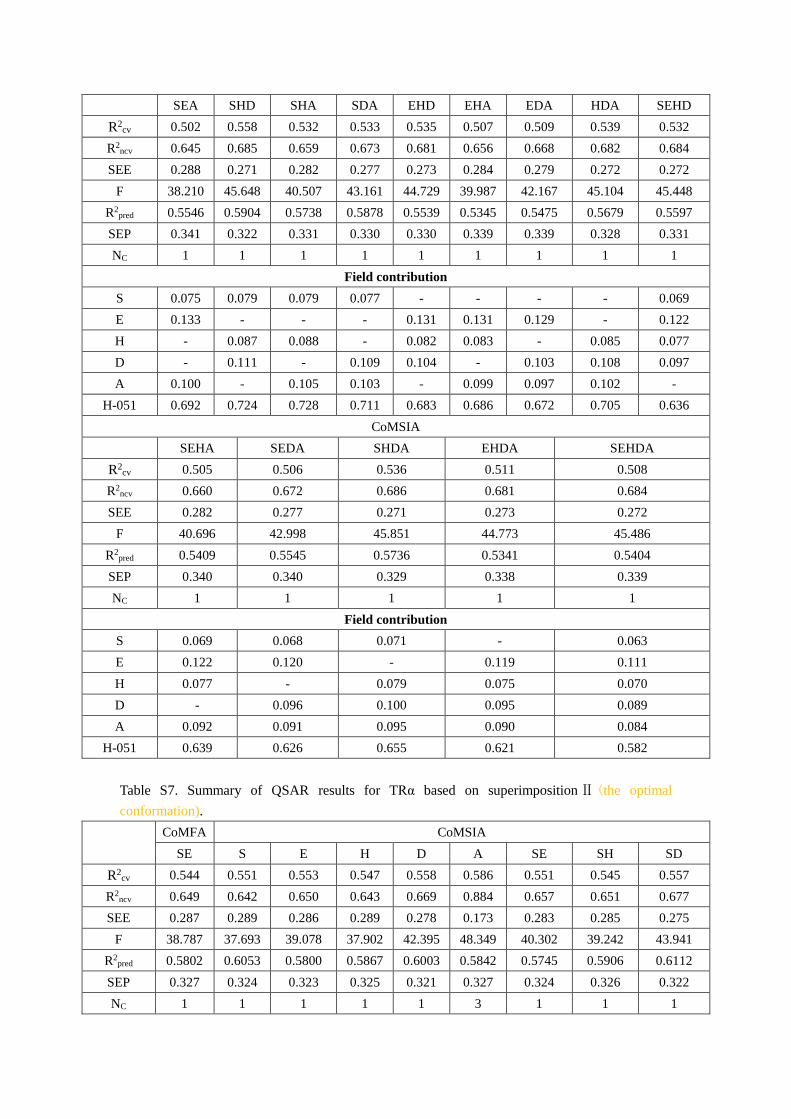
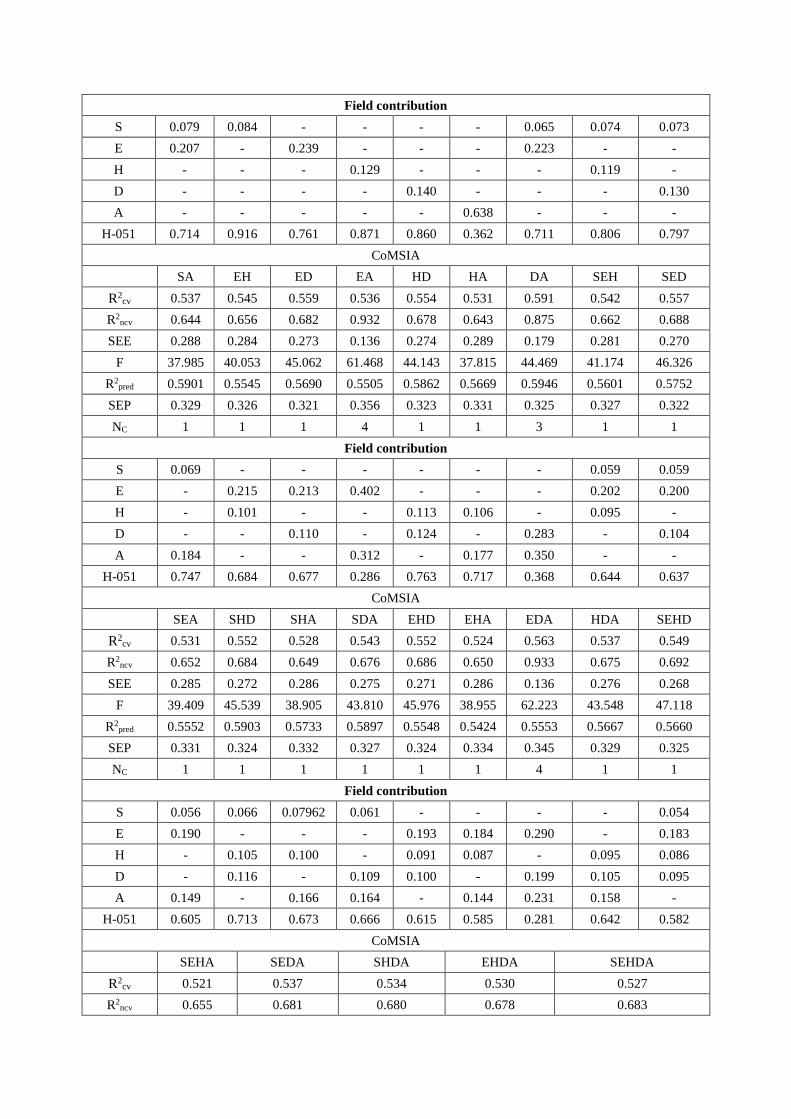
Table S7. Summary of QSAR results for TRα based on superimpositionⅡ (the optimal
conformation).
CoMFA CoMSIA
SE S E H D A SE SH SD
R2cv 0.544 0.551 0.553 0.547 0.558 0.586 0.551 0.545 0.557
R2ncv 0.649 0.642 0.650 0.643 0.669 0.884 0.657 0.651 0.677
SEE 0.287 0.289 0.286 0.289 0.278 0.173 0.283 0.285 0.275
F 38.787 37.693 39.078 37.902 42.395 48.349 40.302 39.242 43.941
R2pred 0.5802 0.6053 0.5800 0.5867 0.6003 0.5842 0.5745 0.5906 0.6112
SEP 0.327 0.324 0.323 0.325 0.321 0.327 0.324 0.326 0.322
NC 1 1 1 1 1 3 1 1 1
Field contribution
S 0.079 0.084 - - - - 0.065 0.074 0.073
E 0.207 - 0.239 - - - 0.223 - -
H - - - 0.129 - - - 0.119 -
D - - - - 0.140 - - - 0.130
A - - - - - 0.638 - - -
H-051 0.714 0.916 0.761 0.871 0.860 0.362 0.711 0.806 0.797
CoMSIA
SA EH ED EA HD HA DA SEH SED
R2cv 0.537 0.545 0.559 0.536 0.554 0.531 0.591 0.542 0.557
R2ncv 0.644 0.656 0.682 0.932 0.678 0.643 0.875 0.662 0.688
SEE 0.288 0.284 0.273 0.136 0.274 0.289 0.179 0.281 0.270
F 37.985 40.053 45.062 61.468 44.143 37.815 44.469 41.174 46.326
R2pred 0.5901 0.5545 0.5690 0.5505 0.5862 0.5669 0.5946 0.5601 0.5752
SEP 0.329 0.326 0.321 0.356 0.323 0.331 0.325 0.327 0.322
NC 1 1 1 4 1 1 3 1 1
Field contribution
S 0.069 - - - - - - 0.059 0.059
E - 0.215 0.213 0.402 - - - 0.202 0.200
H - 0.101 - - 0.113 0.106 - 0.095 -
D - - 0.110 - 0.124 - 0.283 - 0.104
A 0.184 - - 0.312 - 0.177 0.350 - -
H-051 0.747 0.684 0.677 0.286 0.763 0.717 0.368 0.644 0.637
CoMSIA
SEA SHD SHA SDA EHD EHA EDA HDA SEHD
R2cv 0.531 0.552 0.528 0.543 0.552 0.524 0.563 0.537 0.549
R2ncv 0.652 0.684 0.649 0.676 0.686 0.650 0.933 0.675 0.692
SEE 0.285 0.272 0.286 0.275 0.271 0.286 0.136 0.276 0.268
F 39.409 45.539 38.905 43.810 45.976 38.955 62.223 43.548 47.118
R2pred 0.5552 0.5903 0.5733 0.5897 0.5548 0.5424 0.5553 0.5667 0.5660
SEP 0.331 0.324 0.332 0.327 0.324 0.334 0.345 0.329 0.325
NC 1 1 1 1 1 1 4 1 1
Field contribution
S 0.056 0.066 0.07962 0.061 - - - - 0.054
E 0.190 - - - 0.193 0.184 0.290 - 0.183
H - 0.105 0.100 - 0.091 0.087 - 0.095 0.086
D - 0.116 - 0.109 0.100 - 0.199 0.105 0.095
A 0.149 - 0.166 0.164 - 0.144 0.231 0.158 -
H-051 0.605 0.713 0.673 0.666 0.615 0.585 0.281 0.642 0.582
CoMSIA
SEHA SEDA SHDA EHDA SEHDA
R2cv 0.521 0.537 0.534 0.530 0.527
R2ncv 0.655 0.681 0.680 0.678 0.683
SEE 0.284 0.273 0.273 0.274 0.272
F 39.885 44.836 44.659 44.247 45.181
R2pred 0.5431 0.5556 0.5734 0.5346 0.5432
SEP 0.335 0.329 0.330 0.331 0.333
NC 1 1 1 1 1
Field contribution
S 0.051 0.051 0.056 - 0.047
E 0.174 0.173 - 0.168 0.160
H 0.082 - 0.090 0.079 0.075
D - 0.090 0.099 0.087 0.083
A 0.137 0.136 0.150 0.132 0.126
H-051 0.555 0.551 0.606 0.534 0.509
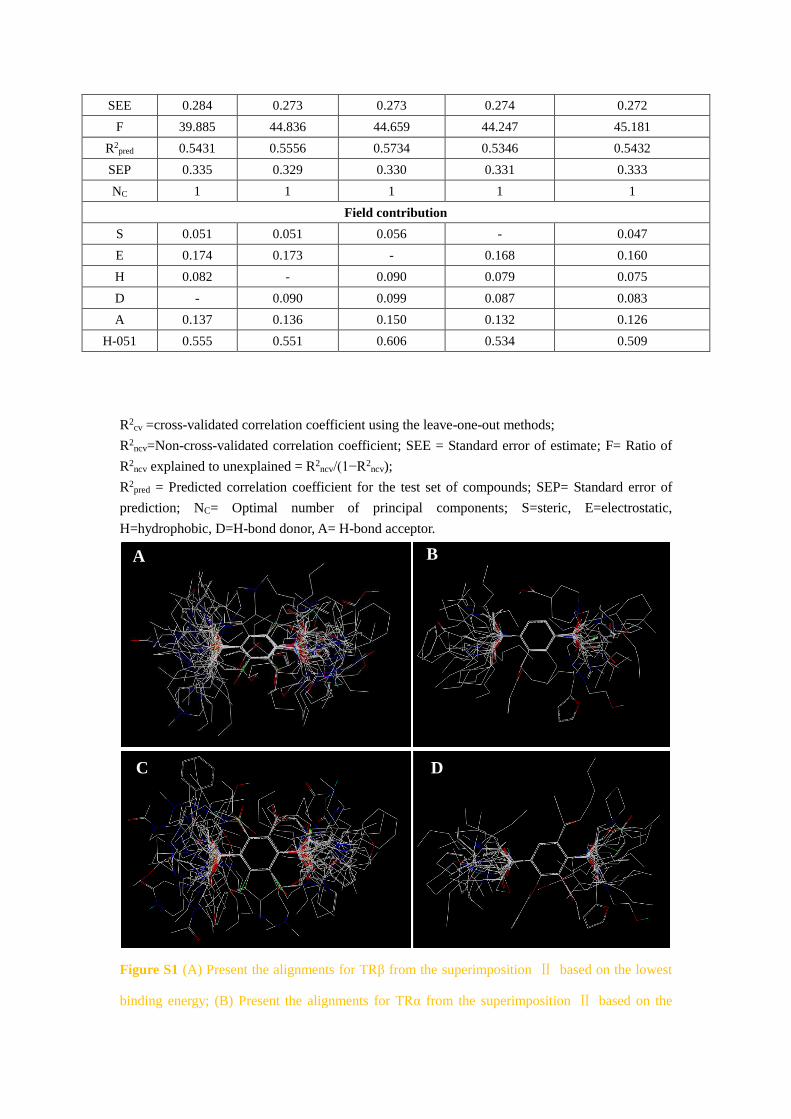
R2cv =cross-validated correlation coefficient using the leave-one-out methods;
R2ncv=Non-cross-validated correlation coefficient; SEE = Standard error of estimate; F= Ratio of
R2ncv explained to unexplained = R2
ncv/(1−R2ncv);
R2pred = Predicted correlation coefficient for the test set of compounds; SEP= Standard error of
prediction; NC= Optimal number of principal components; S=steric, E=electrostatic,
H=hydrophobic, D=H-bond donor, A= H-bond acceptor.
C D
A B
Figure S1 (A) Present the alignments for TRβ from the superimposition Ⅱ based on the lowest
binding energy; (B) Present the alignments for TRα from the superimposition Ⅱ based on the

lowest binding energy; (C) Present the alignments for TRβ from the superimposition Ⅱ based on
the optimal conformation; (D) Present the alignments for TRα from the superimposition Ⅱ based
on the optimal conformation.