Identification of Source Time Function for Train-induced … · 2008-09-19 · (3) time history ......
8
17th World Conference on Nondestructive Testing, 25-28 Oct 2008, Shanghai, China Identification of Source Time Function for Train-induced Vibration of Underground Tunnels Juin-Fu CHAI 1 and Tsung-Jen TENG 1 1 National Center for Research on Earthquake Engineering, Taipei, Chinese Taiwan E-mail: [email protected], [email protected] Abstract The objective of this paper is to identify the dynamic source time function for the train-induced vibration of underground tunnels. Under the consideration of the gaps between adjacent slabs and the constraint from equal-spacing fasteners, the vertical force loaded by the moving train is modelled by a periodical source time function. Consequently, the induced vibration at any specified observation point on the inner wall of the embedded waveguide can be determined on the basis of the transition matrix (T-matrix) method. On the other hand, thanks to the Taipei Rapid Transit Corporation for the permission of an in-situ test, the train-induced vibration on the inner wall of underground tunnels was measured to validate the proposed periodical source time function and further, to identify the associated loading parameters. It can be found that the vibration responses determined numerically by the identified model, both the waveform in time domain and the Fourier spectrum in frequency domain, are in good agreement with the measured signals. Keywords: train-induced vibration, underground tunnel, T-matrix, dynamic source time function 1. Introduction The vibrations of underground tunnels or highway bridges caused by the traffic loading will propagate outwardly through the surrounding soil layers, and then, the nearby structures will be affected significantly by the induced vibrations or noises. The analysis of ground motions and the associated structural vibrations due to underground trains is very complicated [1, 2] (Lin and Krylov, 2000; Metrikine and Vrouwenvelder, 2000), however, it can be simplified by three topics: (1) the analysis of the train-induced vibration of tunnels embedded in an infinite domain, (2) the analysis of transient waves scattered from the tunnels in the surrounding soil layers, and (3) time history analysis of buildings on the basis of the input of the train-induced ground accelerations [3] (Gardien and Stuit, 2003). In this paper, the tunnel is assumed to be an infinite hollow cylindrical waveguide embedded in an infinite elastic domain. Neither the interaction between tunnels nor the boundary conditions between soil layers is considered. Hence, based on the transition matrix (T-matrix) method, the induced vibration of the embedded waveguide and the scattered wave field in the surrounding
Transcript of Identification of Source Time Function for Train-induced … · 2008-09-19 · (3) time history ......
17th World Conference on Nondestructive Testing, 25-28 Oct 2008, Shanghai, China
Identification of Source Time Function for Train-induced Vibration of Underground Tunnels
Juin-Fu CHAI 1 and Tsung-Jen TENG 11 National Center for Research on Earthquake Engineering, Taipei, Chinese Taiwan
E-mail: [email protected], [email protected]
Abstract
The objective of this paper is to identify the dynamic source time function for the train-induced vibration of underground tunnels. Under the consideration of the gaps between adjacent slabs and the constraint from equal-spacing fasteners, the vertical force loaded by the moving train is modelled by a periodical source time function. Consequently, the induced vibration at any specified observation point on the inner wall of the embedded waveguide can be determined on the basis of the transition matrix (T-matrix) method. On the other hand, thanks to the Taipei Rapid Transit Corporation for the permission of an in-situ test, the train-induced vibration on the inner wall of underground tunnels was measured to validate the proposed periodical source time function and further, to identify the associated loading parameters. It can be found that the vibration responses determined numerically by the identified model, both the waveform in time domain and the Fourier spectrum in frequency domain, are in good agreement with the measured signals.
Keywords: train-induced vibration, underground tunnel, T-matrix, dynamic source time function
1. Introduction
The vibrations of underground tunnels or highway bridges caused by the traffic loading will
propagate outwardly through the surrounding soil layers, and then, the nearby structures will be
affected significantly by the induced vibrations or noises. The analysis of ground motions and
the associated structural vibrations due to underground trains is very complicated[1, 2] (Lin and
Krylov, 2000; Metrikine and Vrouwenvelder, 2000), however, it can be simplified by three
topics: (1) the analysis of the train-induced vibration of tunnels embedded in an infinite domain,
(2) the analysis of transient waves scattered from the tunnels in the surrounding soil layers, and
(3) time history analysis of buildings on the basis of the input of the train-induced ground
accelerations[3] (Gardien and Stuit, 2003).
In this paper, the tunnel is assumed to be an infinite hollow cylindrical waveguide embedded
in an infinite elastic domain. Neither the interaction between tunnels nor the boundary conditions
between soil layers is considered. Hence, based on the transition matrix (T-matrix) method, the
induced vibration of the embedded waveguide and the scattered wave field in the surrounding
soil can be solved in terms of the external loading function due to the moving trains. Under the
consideration of the gaps between adjacent slabs and the constraint from equal-spacing fasteners,
the vertical force loaded by the moving train onto the tunnel can be modeled by a periodic source
time function. In order to verify the proposed periodic source time function and to identify the
associated loading parameters, the train-induced vibration on the inner wall of underground
tunnels was measured by an in-situ test of the Taipei Rapid Transit system. It can be found that
the vibration responses determined numerically by the proposed model as well as the identified
parameters, both the waveform in time domain and the Fourier spectrum in frequency domain,
are in good agreement with the measured signals.
Based on the proposed source time function as well as the identified loading parameters, the
train-induced wave field scattered from the tunnel in the surrounding soil can be also determined
by the T-matrix method. Then, in the next stage, instead of the infinite surrounding medium, the
case of soil layers will be considered and modelled by a layered half-space, and the
aforementioned wave field can be applied to define the perturbation source within the upper soil
layer. Subsequently, under the boundary conditions of continuity at the interface and traction free
on the ground surface, the induced ground vibration can be determined by means of the
transmission and reflection coefficient matrices of scattered waves at the interface and free
ground. Based on the simulated ground acceleration, the time history analysis can be performed
to evaluate the structural vibration caused by the trains moving in underground tunnels.
2. Source Time Function and Tunnel Vibration
2.1 Transition Matrix and Train-induced Tunnel Vibration
As shown in Fig. 1, the underground tunnel is modelled by an infinite hollow cylindrical
waveguide surrounded by infinite soil. The 3D cylindrical coordinate system (r-θ-y coordinates)
is defined such that y-axis is coincident with the axis of the tunnel and the point y=0 is defined at
the middle point of one slab. Based on the radiation conditions at infinity (r→∞) as well as the symmetry about the vertical axis, the scalar potentials mφ , mψ and mχ with non-negative
integer m corresponding to P-, SV- and SH- waves, respectively, can be solved and expressed in
the frequency domain as
( ) ( )( ) ( )( ) ( )∫
∫
∫
∞
∞−
−
∞
∞−
−
∞
∞−
−
⋅=
⋅=
⋅=
yyik
smmm
yyik
smmm
yyik
pmmm
dkerkHmyr
dkerkHmyr
dkerkHmyr
y
y
y
cos2
1;,,
sin2
1;,,
cos2
1;,,
*)2(
*)2(
*)2(
θεπ
ωθχ
θεπ
ωθψ
θεπ
ωθφ
(1)
Herein, )2(
mH is the mth-order Hankel function of the second kind, εm is the Neumann factor
(εm=1 for m=0 or εm=2 for m≥1), *pk and *
sk are defined by
22*22* ; syspyp kkikkkik −−=−−= (2)
where kp=ω/Cp and ks=ω/Cs are the wavenumbers of the longitudinal and shear waves,
respectively. Then, based on the scalar potentials, the basis functions of the displacement vectors in the 3D domain ( )ωθ ;,, yrα
mu can be determined by
( ) ( )y(3)my
(2)m
(1)m eueuu m
s
mm kχψφ ×∇×∇=×∇=∇= 1
;; (3)
Furthermore, the mth-order Hankel function of the second kind )2(mH can be replaced by the
mth-order Bessel function Jm to define the regular part of the basis functions ( )ωθ ;,,ˆ yrα
mu . It
should be noted that the basis functions represent the outgoing waves and the regular parts
represent the standing waves.
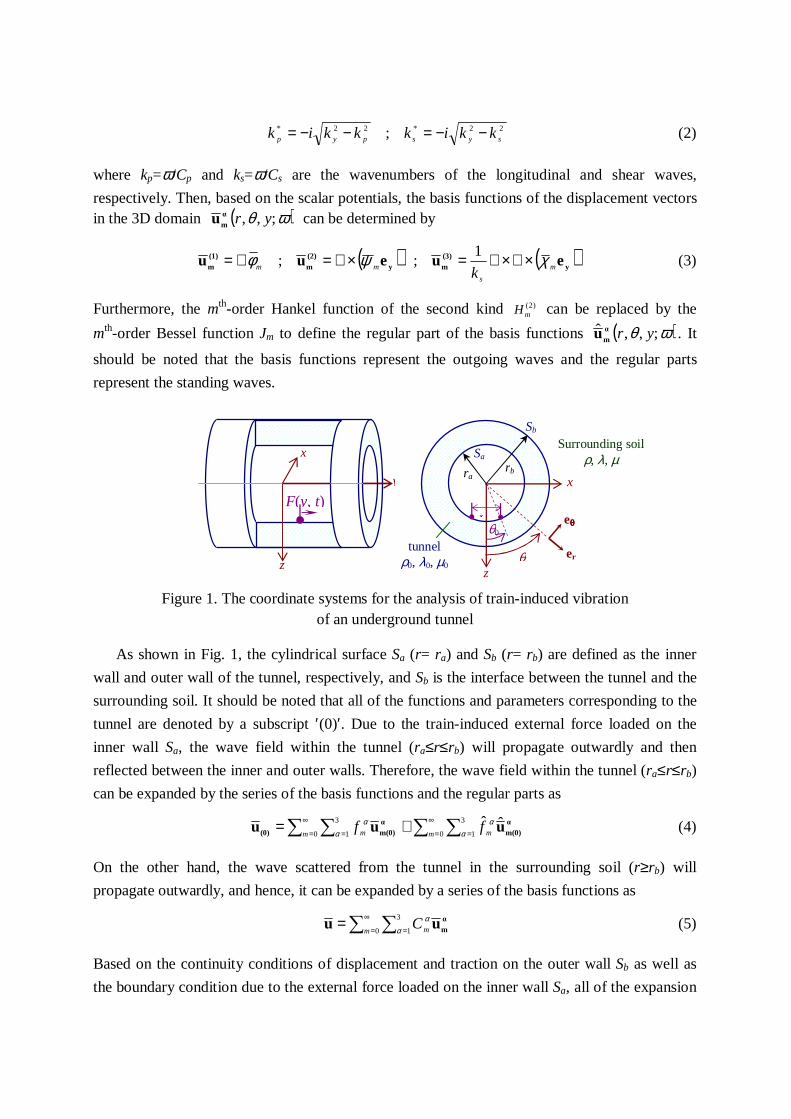
Figure 1. The coordinate systems for the analysis of train-induced vibration of an underground tunnel
As shown in Fig. 1, the cylindrical surface Sa (r= ra) and Sb (r= rb) are defined as the inner
wall and outer wall of the tunnel, respectively, and Sb is the interface between the tunnel and the
surrounding soil. It should be noted that all of the functions and parameters corresponding to the
tunnel are denoted by a subscript ′(0)′. Due to the train-induced external force loaded on the
inner wall Sa, the wave field within the tunnel (ra≤r≤rb) will propagate outwardly and then
reflected between the inner and outer walls. Therefore, the wave field within the tunnel (ra≤r≤rb)
can be expanded by the series of the basis functions and the regular parts as
∑ ∑∑ ∑∞
= =
∞
= = +=0
3
10
3
1ˆˆ
m mm m ff αα
αα α
m(0)α
m(0)(0) uuu (4)
On the other hand, the wave scattered from the tunnel in the surrounding soil (r≥rb) will
propagate outwardly, and hence, it can be expanded by a series of the basis functions as
∑ ∑∞
= ==0
3
1m mCαα α
muu (5)
Based on the continuity conditions of displacement and traction on the outer wall Sb as well as
the boundary condition due to the external force loaded on the inner wall Sa, all of the expansion
θ er
eθθθθ
rarb
Sa
Sb
Surrounding soilρ, λ, µ
tunnelρ0, λ0, µ0
Wθ0
x
z
y
F(y, t)
z
x
coefficients αmf , α
mf and αmC can be determined. Furthermore, it should be noted that the
external traction vector loaded on the inner wall Sa can be expressed in frequency domain as
( ) ∑ ∫∞
=
∞
∞−
−
=0
~
2
1;,,
my
yik
a dkeyr yamm
a tDtπ
ωθ with
=θ
θθ
εm
m
m
m
cos00
0sin0
00cos
mD (6)
Then, all of the expansion coefficients αmf , αmf and α
mC can be expressed in terms of the
loading vector amt
~, and further, the time history of the induced vibration ua (ra,θ,y;t) on the inner
wall Sa can be expressed by
( ) ( )∑∞
==0
;,,;,,m aa tyrtyr θθ a
ma uu with ( ) ∫ ∫
∞
∞−
+−∞
∞−= ω
πθ ω ddketyr y
tiyika
y
2
~
4
1;,, a
mamm
am tTDu (7)
Herein, amT is the mth-order transition matrix, all of the elements can be determined and
expressed explicitly.
2.2 Periodic Source Time Function
In this paper, the train is assumed to move along the positive y-axis with a constant speed c,
and the first set of wheels will pass the point y=0 at t=0 coincidently. Furthermore, as shown in
Fig. 1, each set of the wheels consists of two wheels with a width of W. Therefore, the r- and θ- components of the external traction vector ( )tyra ;,,θat loaded by the first set of wheels onto
the inner wall can be expressed by
( ) ( ) ( )[ ] ( ) ( ) ( )[ ] 000000 sin,;cos, θθθδθθδθθθδθθδ θ ++−−⋅=++−⋅= tyFttyFt aar (8)
Where θ 0=sin-1(W/2a) is the angle between the contact point and the vertical axis (see Fig. 1),
and F(y, t) is the contact force. Under the consideration of the gaps between adjacent slabs and
the constraint from equal-spacing fasteners, the vertical contact force F(y, t) can be defined by
( ) ( )ctytQtyF −⋅= δ),( with ( ) ( )ttQtQ coscos1 22110 ΩγΩγ ++= (9)
Herein, δ(y-ct) is to define the location of the wheels along y-axis, and Q(t) is a periodic function
representing the amplitude of contact force. Q0 is the averaged contact pressure, Ω1 and γ1 are the
angular frequency and amplitude ratio of the force due to the gaps between adjacent slabs, and
Ω2 and γ2 are corresponding to the fasteners. In addition, the angular frequencies Ω1 and Ω2 can
be determined by the length of slab Ls and the spacing of fasteners Lf as well as the moving speed
c as Ω1=2πc/Ls and Ω2=2πc/Lf, respectively. It can be found that [δ(θ-θ0)+δ(θ+θ0)] and
[-δ(θ-θ0)+δ(θ+θ0)] are the even and odd functions of θ, respectively, and can be expanded by the
series of cos mθ and sin mθ as
( ) ( )[ ]( ) ( )[ ] ∑
∑
=++−−
=++−
mmm
mmm
mb
ma
θεθθδθθδ
θεθθδθθδ
sin
cos
00
00
with
0
0
sin
cos
θπε
θπε
mb
ma
m
m
m
m
−=
= (10)
Therefore, the external traction vector loaded on the inner wall Sa can be expressed in the
frequency domain as
( ) ∑ ∫∞
=
∞
∞−
−
=0
~
2
1;,,
my
yik
a dkeyr yamm
a tDtπ
ωθ with
=
0sincos
),(~~
0
0
θθ
ω m
m
y ba
kFamt (11)
From Eq. (9), we have
( ) ( ) ( ) ( )∫ ∫ ∑∞
∞−
∞
∞− =
−
−++−−+−== 2
10 222 ),(,
~i yi
iyi
iy
tiyik
y ckckckQdydtetyFkF y ΩωδγΩωδγωδπω ω
(12)
Based on the loading vector amt
~ as expressed by Eqs. (11) and (12), the vibration a
W1u (ra,θ,y;t)
on the inner wall induced by the first set of wheels can be determined by Eq. (7). For the nth set
of wheels with a distance Ln from the first set of wheels, the source time function can be defined
by F(y, t-Ln/c), and hence, the associated response can be determined from that caused by the
first set of wheels with the specific time delay Ln/c and multiplied by a weighting Wn. Therefore,
the total response can be defined by
( ) ( )∑=
−=N
nnana cLtyrWtyr
1
,,,,,, θθ aW1
a uu (13)
3. In-situ Measurement and Identification of Source Time Function
In order to verify the proposed periodic source time function and to identify the loading
parameters, an in-situ test was organized to measure the train-induced vibration on the inner wall
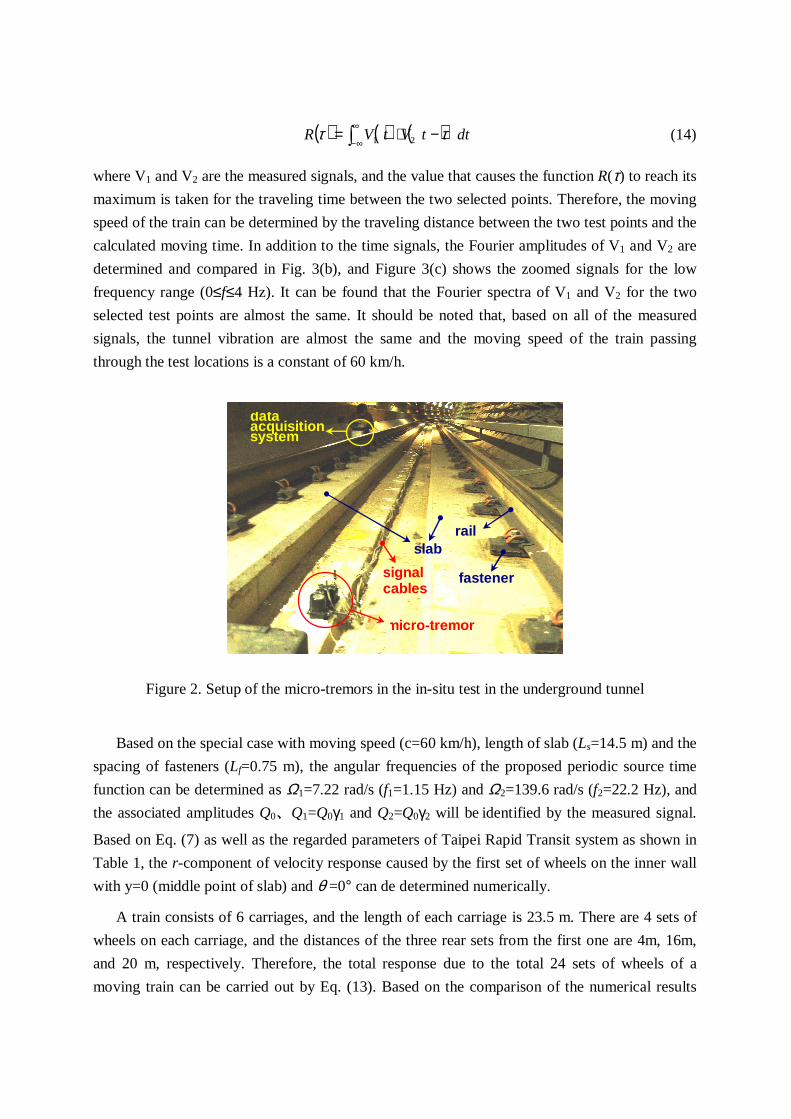
of an underground tunnel (Taipei Rapid Transit). As shown in Fig. 2, the micro-tremors were
setup at the middle points of two adjacent slabs, and they were fixed onto the tunnel ground
between the rails with θ =0°.
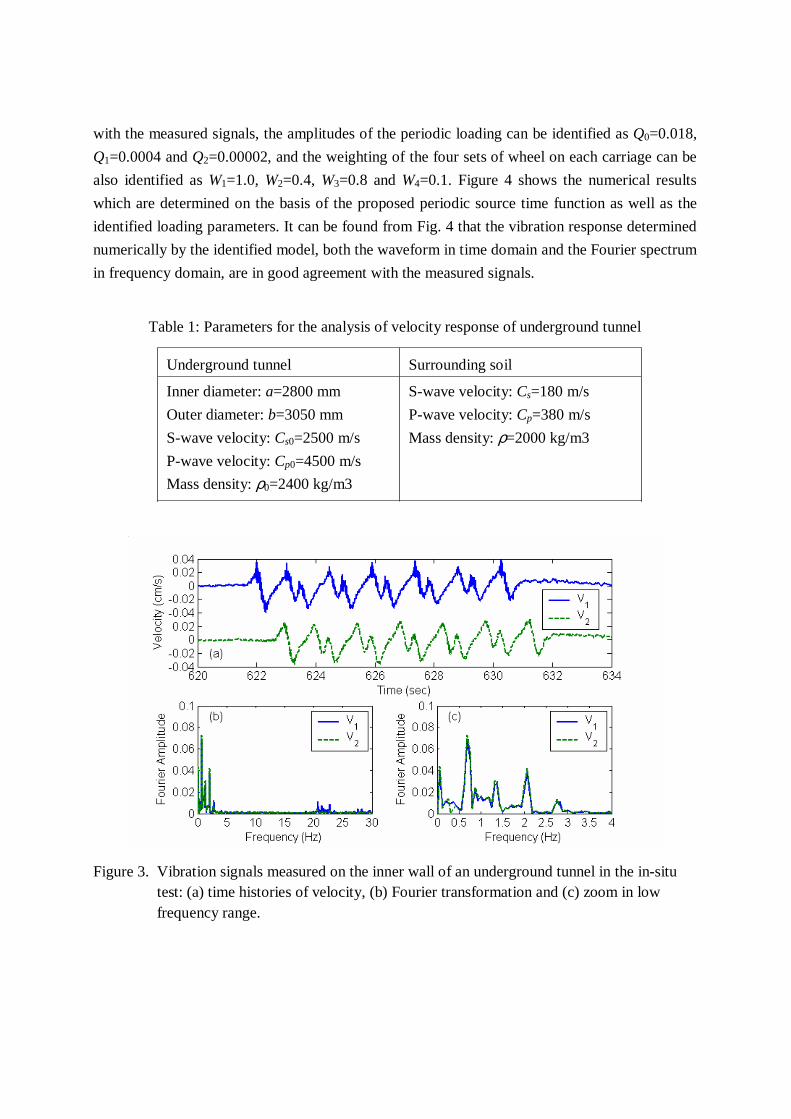
As the train passes, the train-induced vibrations at the selected two measurement locations
can be measured simultaneously, and Figure 3(a) shows the typical velocity signals (vertical
component). Because the selected test points are both located at the middle point of one slab, the
waveform of the measured signals V1 and V2 are much similar to each other and a time delay
exists between the two signals V1 and V2. This time delay represents the moving time of the train
passing through the selected two test points, and can be determined on the basis of the cross
correlation function. The cross correlation function is defined by
( ) ( ) ( )∫∞
∞−−⋅= dttVtVR 21 ττ (14)
where V1 and V2 are the measured signals, and the value that causes the function R(τ) to reach its
maximum is taken for the traveling time between the two selected points. Therefore, the moving
speed of the train can be determined by the traveling distance between the two test points and the
calculated moving time. In addition to the time signals, the Fourier amplitudes of V1 and V2 are
determined and compared in Fig. 3(b), and Figure 3(c) shows the zoomed signals for the low
frequency range (0≤f≤4 Hz). It can be found that the Fourier spectra of V1 and V2 for the two
selected test points are almost the same. It should be noted that, based on all of the measured
signals, the tunnel vibration are almost the same and the moving speed of the train passing
through the test locations is a constant of 60 km/h.
Figure 2. Setup of the micro-tremors in the in-situ test in the underground tunnel
Based on the special case with moving speed (c=60 km/h), length of slab (Ls=14.5 m) and the
spacing of fasteners (Lf=0.75 m), the angular frequencies of the proposed periodic source time
function can be determined as Ω1=7.22 rad/s (f1=1.15 Hz) and Ω2=139.6 rad/s (f2=22.2 Hz), and
the associated amplitudes Q0 Q1=Q0γ1 and Q2=Q0γ2 will be identified by the measured signal.
Based on Eq. (7) as well as the regarded parameters of Taipei Rapid Transit system as shown in
Table 1, the r-component of velocity response caused by the first set of wheels on the inner wall
with y=0 (middle point of slab) and θ =0° can de determined numerically.
A train consists of 6 carriages, and the length of each carriage is 23.5 m. There are 4 sets of
wheels on each carriage, and the distances of the three rear sets from the first one are 4m, 16m,
and 20 m, respectively. Therefore, the total response due to the total 24 sets of wheels of a
moving train can be carried out by Eq. (13). Based on the comparison of the numerical results
micro-tremor
s
fastener
rail
signal cables
slab
data acquisition system
with the measured signals, the amplitudes of the periodic loading can be identified as Q0=0.018,
Q1=0.0004 and Q2=0.00002, and the weighting of the four sets of wheel on each carriage can be
also identified as W1=1.0, W2=0.4, W3=0.8 and W4=0.1. Figure 4 shows the numerical results
which are determined on the basis of the proposed periodic source time function as well as the
identified loading parameters. It can be found from Fig. 4 that the vibration response determined
numerically by the identified model, both the waveform in time domain and the Fourier spectrum
in frequency domain, are in good agreement with the measured signals.
Table 1: Parameters for the analysis of velocity response of underground tunnel
Underground tunnel Surrounding soil
Inner diameter: a=2800 mm
Outer diameter: b=3050 mm
S-wave velocity: Cs0=2500 m/s
P-wave velocity: Cp0=4500 m/s
Mass density: ρ0=2400 kg/m3
S-wave velocity: Cs=180 m/s
P-wave velocity: Cp=380 m/s
Mass density: ρ=2000 kg/m3
Figure 3. Vibration signals measured on the inner wall of an underground tunnel in the in-situ test: (a) time histories of velocity, (b) Fourier transformation and (c) zoom in low frequency range.
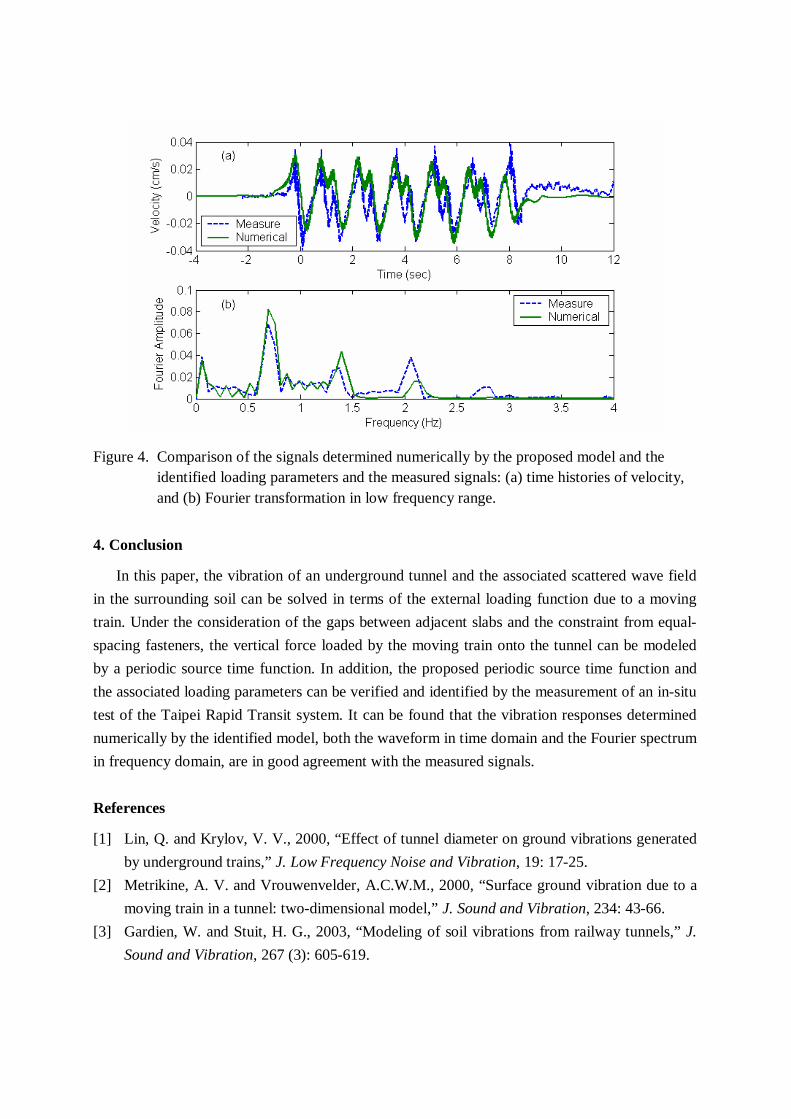
Figure 4. Comparison of the signals determined numerically by the proposed model and the identified loading parameters and the measured signals: (a) time histories of velocity, and (b) Fourier transformation in low frequency range.
4. Conclusion
In this paper, the vibration of an underground tunnel and the associated scattered wave field
in the surrounding soil can be solved in terms of the external loading function due to a moving
train. Under the consideration of the gaps between adjacent slabs and the constraint from equal-
spacing fasteners, the vertical force loaded by the moving train onto the tunnel can be modeled
by a periodic source time function. In addition, the proposed periodic source time function and
the associated loading parameters can be verified and identified by the measurement of an in-situ
test of the Taipei Rapid Transit system. It can be found that the vibration responses determined
numerically by the identified model, both the waveform in time domain and the Fourier spectrum
in frequency domain, are in good agreement with the measured signals.
References
[1] Lin, Q. and Krylov, V. V., 2000, “Effect of tunnel diameter on ground vibrations generated
by underground trains,” J. Low Frequency Noise and Vibration, 19: 17-25.
[2] Metrikine, A. V. and Vrouwenvelder, A.C.W.M., 2000, “Surface ground vibration due to a
moving train in a tunnel: two-dimensional model,” J. Sound and Vibration, 234: 43-66.
[3] Gardien, W. and Stuit, H. G., 2003, “Modeling of soil vibrations from railway tunnels,” J.
Sound and Vibration, 267 (3): 605-619.