Geoid Surfaces and Theory - National Geodetic Survey - NOAA
27
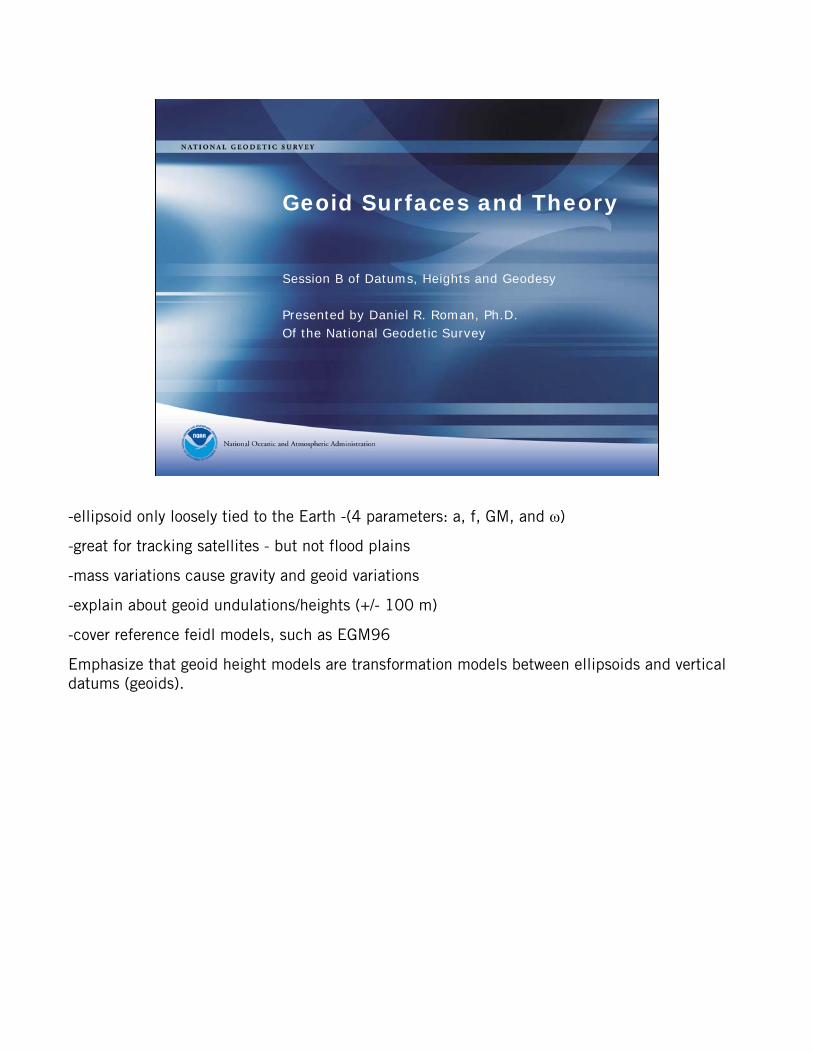
Geoid Surfaces and Theory Session B of Datums, Heights and Geodesy Presented by Daniel R. Roman, Ph.D. Of the National Geodetic Survey -ellipsoid only loosely tied to the Earth -(4 parameters: a, f, GM, and ω) -great for tracking satellites - but not flood plains -mass variations cause gravity and geoid variations -explain about geoid undulations/heights (+/- 100 m) -cover reference feidl models, such as EGM96 Emphasize that geoid height models are transformation models between ellipsoids and vertical datums (geoids).
Transcript of Geoid Surfaces and Theory - National Geodetic Survey - NOAA
Geoid Surfaces and Theory
Session B of Datums, Heights and Geodesy
Presented by Daniel R. Roman, Ph.D. Of the National Geodetic Survey
-ellipsoid only loosely tied to the Earth -(4 parameters: a, f, GM, and ω)
-great for tracking satellites - but not flood plains
-mass variations cause gravity and geoid variations
-explain about geoid undulations/heights (+/- 100 m)
-cover reference feidl models, such as EGM96
Emphasize that geoid height models are transformation models between ellipsoids and vertical datums (geoids).
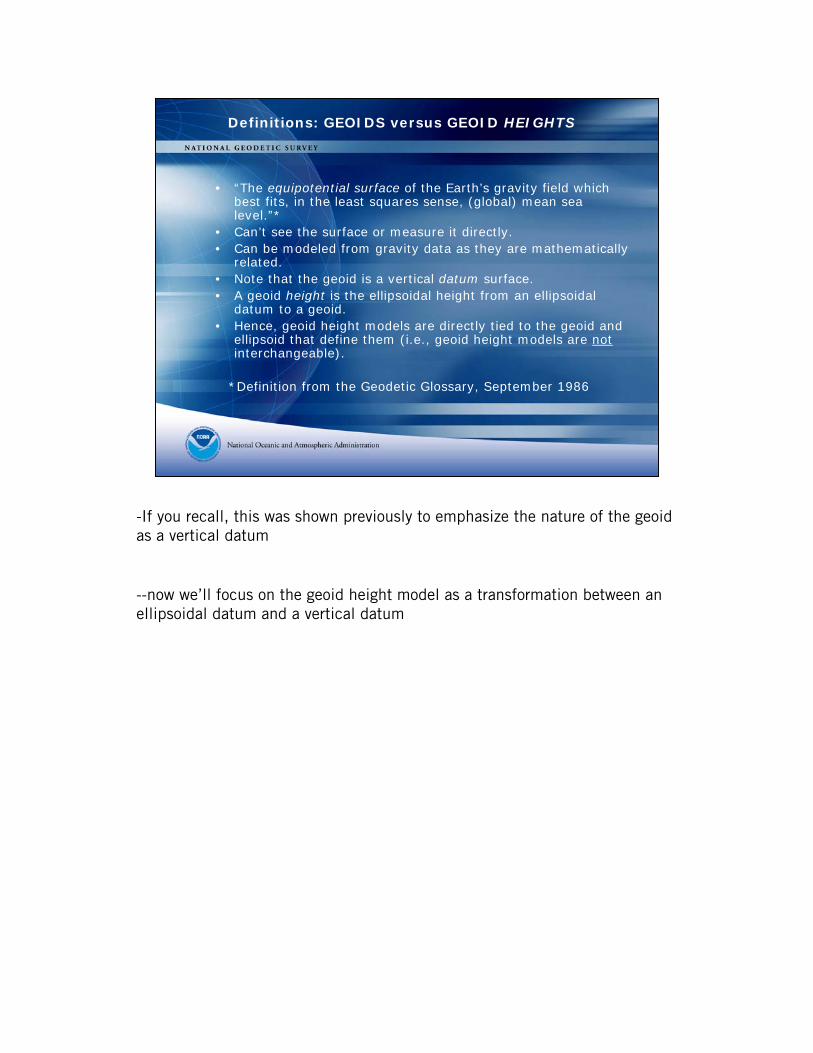
Definitions: GEOIDS versus GEOID HEIGHTS
• “The equipotential surface of the Earth’s gravity field which best fits, in the least squares sense, (global) mean sea level.”*
• Can’t see the surface or measure it directly.• Can be modeled from gravity data as they are mathematically
related.• Note that the geoid is a vertical datum surface.• A geoid height is the ellipsoidal height from an ellipsoidal
datum to a geoid.• Hence, geoid height models are directly tied to the geoid and
ellipsoid that define them (i.e., geoid height models are notinterchangeable).
*Definition from the Geodetic Glossary, September 1986
-If you recall, this was shown previously to emphasize the nature of the geoid as a vertical datum
--now we’ll focus on the geoid height model as a transformation between an ellipsoidal datum and a vertical datum
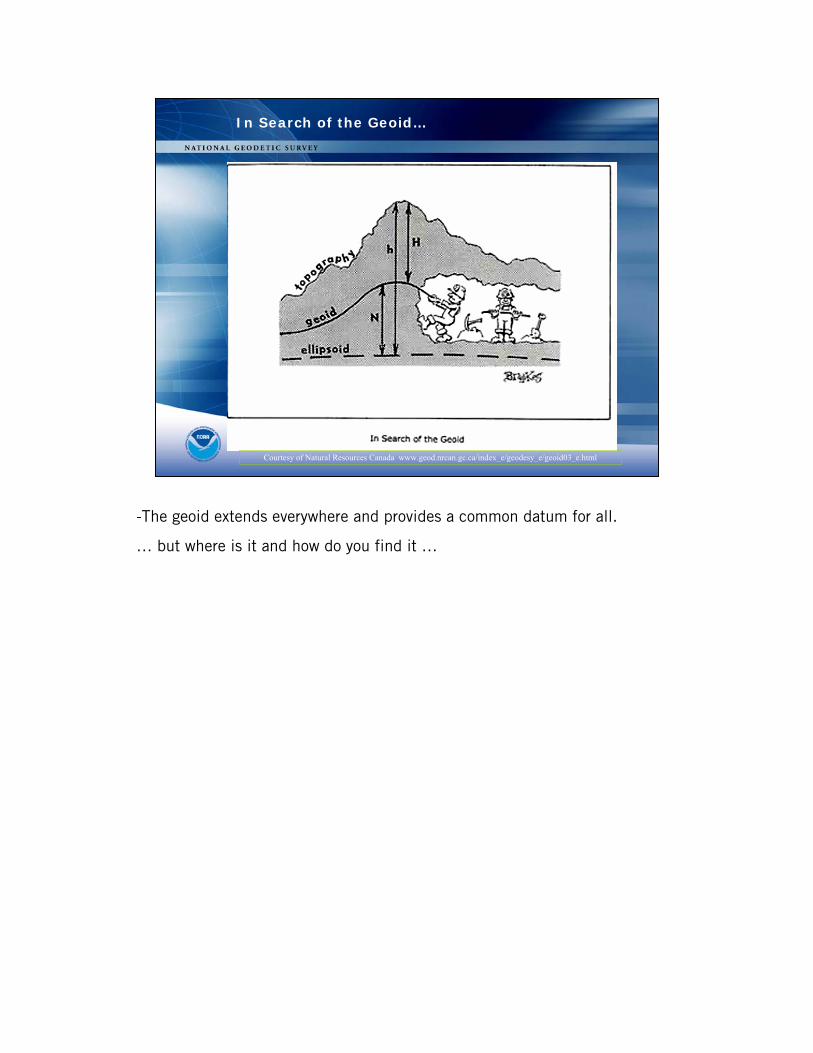
In Search of the Geoid…
Courtesy of Natural Resources Canada www.geod.nrcan.gc.ca/index_e/geodesy_e/geoid03_e.html
-The geoid extends everywhere and provides a common datum for all.
… but where is it and how do you find it …
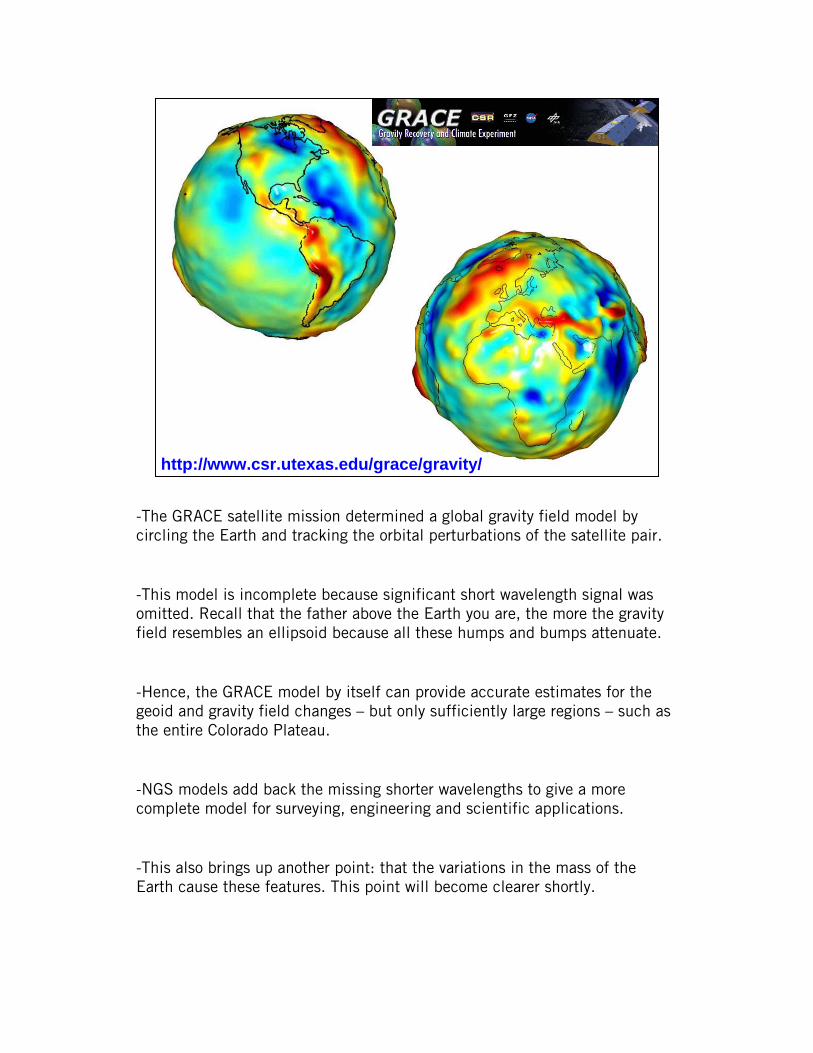
http://www.csr.utexas.edu/grace/gravity/
-The GRACE satellite mission determined a global gravity field model by circling the Earth and tracking the orbital perturbations of the satellite pair.
-This model is incomplete because significant short wavelength signal was omitted. Recall that the father above the Earth you are, the more the gravity field resembles an ellipsoid because all these humps and bumps attenuate.
-Hence, the GRACE model by itself can provide accurate estimates for the geoid and gravity field changes – but only sufficiently large regions – such as the entire Colorado Plateau.
-NGS models add back the missing shorter wavelengths to give a more complete model for surveying, engineering and scientific applications.
-This also brings up another point: that the variations in the mass of the Earth cause these features. This point will become clearer shortly.
geoid
C0
C1
C2
C3
C4
C5
g1 g2
H1
H2
g*1
g*2
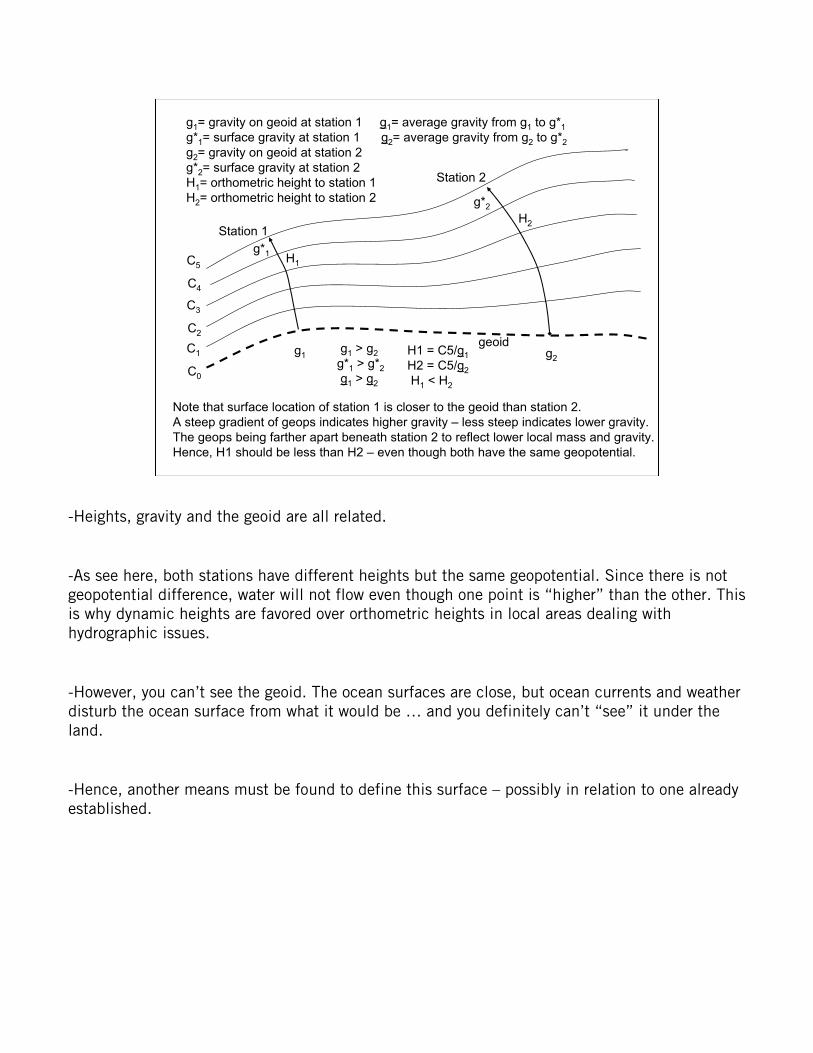
g1= gravity on geoid at station 1 g1= average gravity from g1 to g*1g*1= surface gravity at station 1 g2= average gravity from g2 to g*2g2= gravity on geoid at station 2 g*2= surface gravity at station 2H1= orthometric height to station 1H2= orthometric height to station 2
g1 > g2g*1 > g*2g1 > g2
H1 = C5/g1H2 = C5/g2H1 < H2
Note that surface location of station 1 is closer to the geoid than station 2.A steep gradient of geops indicates higher gravity – less steep indicates lower gravity.The geops being farther apart beneath station 2 to reflect lower local mass and gravity.Hence, H1 should be less than H2 – even though both have the same geopotential.
Station 1
Station 2
-Heights, gravity and the geoid are all related.
-As see here, both stations have different heights but the same geopotential. Since there is not geopotential difference, water will not flow even though one point is “higher” than the other. This is why dynamic heights are favored over orthometric heights in local areas dealing with hydrographic issues.
-However, you can’t see the geoid. The ocean surfaces are close, but ocean currents and weather disturb the ocean surface from what it would be … and you definitely can’t “see” it under the land.
-Hence, another means must be found to define this surface – possibly in relation to one already established.
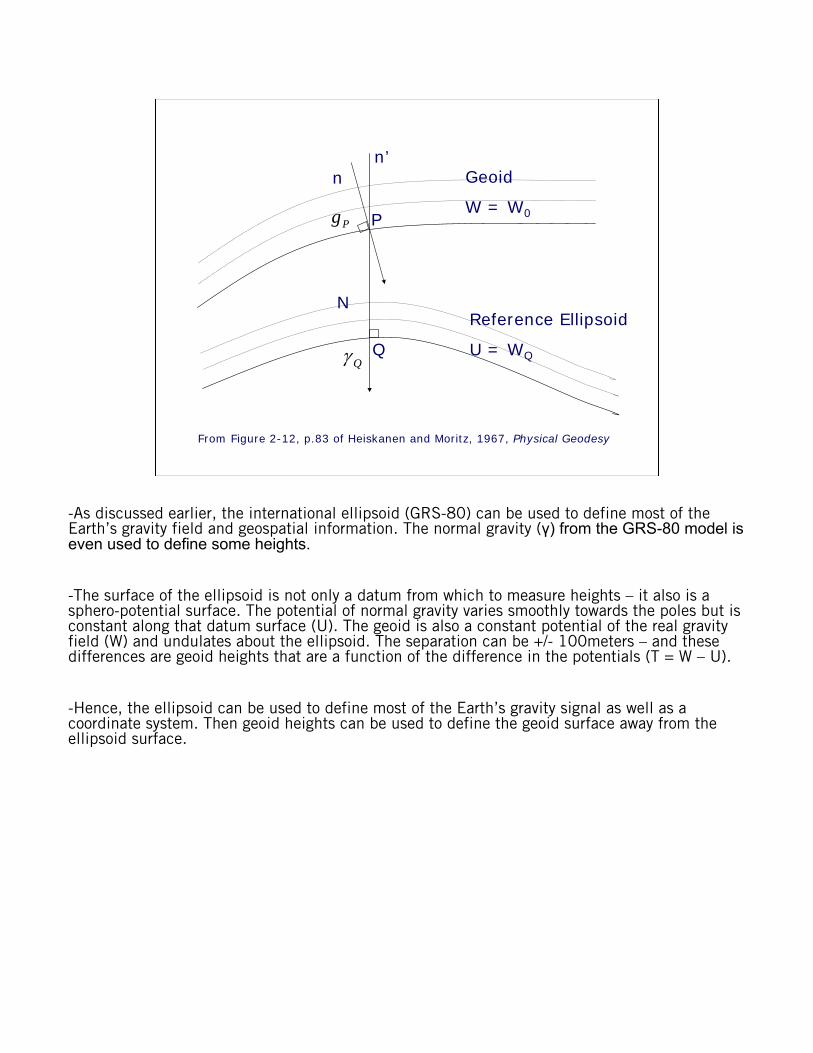
From Figure 2-12, p.83 of Heiskanen and Moritz, 1967, Physical Geodesy
n’n
Reference Ellipsoid
U = WQ
Geoid
W = W0
N
Q
PPg
Qγ
-As discussed earlier, the international ellipsoid (GRS-80) can be used to define most of the Earth’s gravity field and geospatial information. The normal gravity (γ) from the GRS-80 model is even used to define some heights.
-The surface of the ellipsoid is not only a datum from which to measure heights – it also is a sphero-potential surface. The potential of normal gravity varies smoothly towards the poles but is constant along that datum surface (U). The geoid is also a constant potential of the real gravity field (W) and undulates about the ellipsoid. The separation can be +/- 100meters – and these differences are geoid heights that are a function of the difference in the potentials (T = W – U).
-Hence, the ellipsoid can be used to define most of the Earth’s gravity signal as well as a coordinate system. Then geoid heights can be used to define the geoid surface away from the ellipsoid surface.
Well, OK, maybe a few formulas …
( ) σψπ σ
dgSG
RN ∫∫∆=4
( ) ⎟⎠⎞
⎜⎝⎛ +−−+⎟
⎠⎞
⎜⎝⎛−
⎟⎠⎞⎜
⎝⎛
=2
sin2
sinlncos3cos512
sin6
2sin
1 2 ψψψψψψ
ψS
PP UWT −=
Stokes’ Formula:
where:
Disturbing Potential:
γTN=Bruns Formula:
Height Relationships: NHh +=
RT
rTgg QP
2−
∂∂
−=−=∆ γGravity Anomalies:
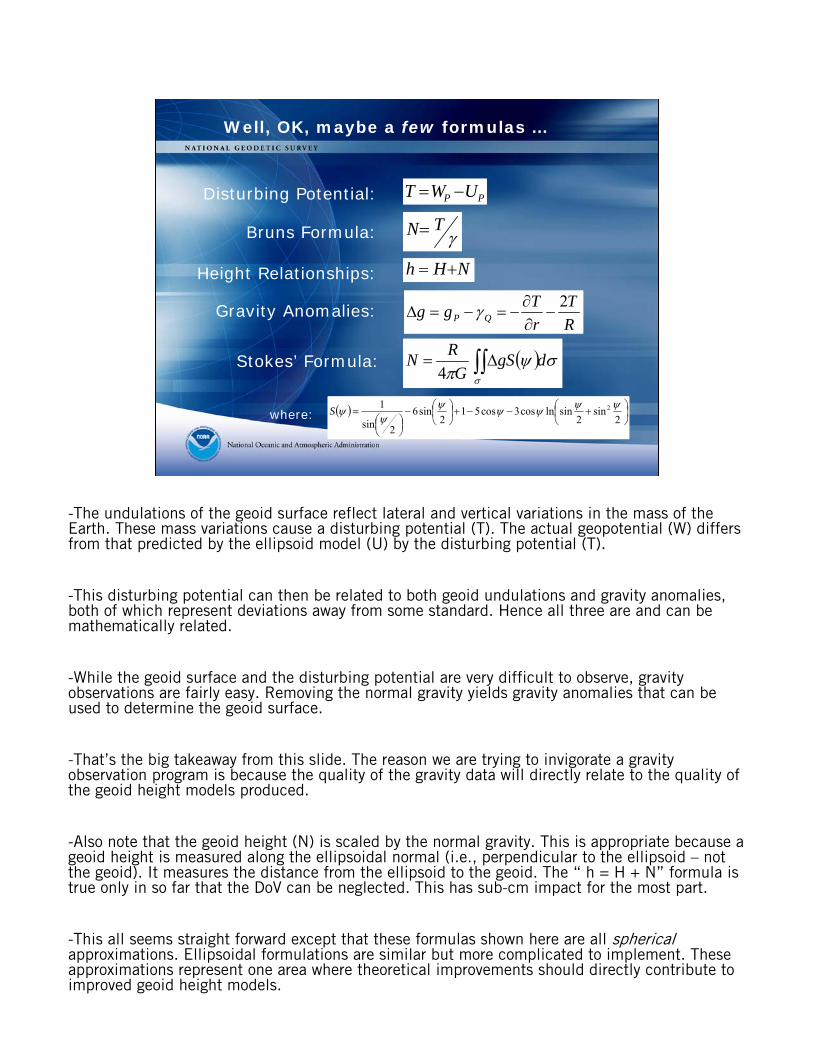
-The undulations of the geoid surface reflect lateral and vertical variations in the mass of the Earth. These mass variations cause a disturbing potential (T). The actual geopotential (W) differs from that predicted by the ellipsoid model (U) by the disturbing potential (T).
-This disturbing potential can then be related to both geoid undulations and gravity anomalies, both of which represent deviations away from some standard. Hence all three are and can be mathematically related.
-While the geoid surface and the disturbing potential are very difficult to observe, gravity observations are fairly easy. Removing the normal gravity yields gravity anomalies that can be used to determine the geoid surface.
-That’s the big takeaway from this slide. The reason we are trying to invigorate a gravity observation program is because the quality of the gravity data will directly relate to the quality of the geoid height models produced.
-Also note that the geoid height (N) is scaled by the normal gravity. This is appropriate because a geoid height is measured along the ellipsoidal normal (i.e., perpendicular to the ellipsoid – not the geoid). It measures the distance from the ellipsoid to the geoid. The “ h = H + N” formula is true only in so far that the DoV can be neglected. This has sub-cm impact for the most part.
-This all seems straight forward except that these formulas shown here are all sphericalapproximations. Ellipsoidal formulations are similar but more complicated to implement. These approximations represent one area where theoretical improvements should directly contribute to improved geoid height models.
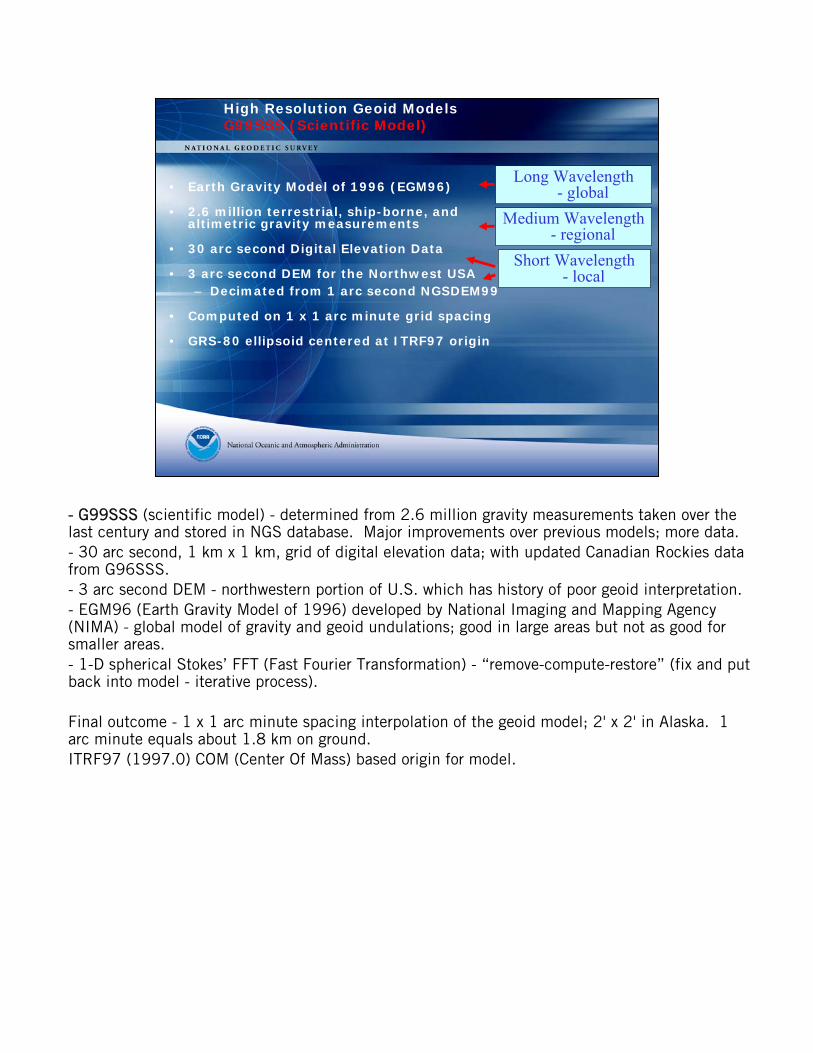
• Earth Gravity Model of 1996 (EGM96)
• 2.6 million terrestrial, ship-borne, and altimetric gravity measurements
• 30 arc second Digital Elevation Data
• 3 arc second DEM for the Northwest USA– Decimated from 1 arc second NGSDEM99
• Computed on 1 x 1 arc minute grid spacing
• GRS-80 ellipsoid centered at ITRF97 origin
Long Wavelength - global
High Resolution Geoid ModelsG99SSS (Scientific Model)
Medium Wavelength - regional
Short Wavelength - local
- G99SSS (scientific model) - determined from 2.6 million gravity measurements taken over thelast century and stored in NGS database. Major improvements over previous models; more data.- 30 arc second, 1 km x 1 km, grid of digital elevation data; with updated Canadian Rockies data from G96SSS.- 3 arc second DEM - northwestern portion of U.S. which has history of poor geoid interpretation.- EGM96 (Earth Gravity Model of 1996) developed by National Imaging and Mapping Agency (NIMA) - global model of gravity and geoid undulations; good in large areas but not as good for smaller areas.- 1-D spherical Stokes’ FFT (Fast Fourier Transformation) - “remove-compute-restore” (fix and put back into model - iterative process).
Final outcome - 1 x 1 arc minute spacing interpolation of the geoid model; 2' x 2' in Alaska. 1 arc minute equals about 1.8 km on ground.ITRF97 (1997.0) COM (Center Of Mass) based origin for model.
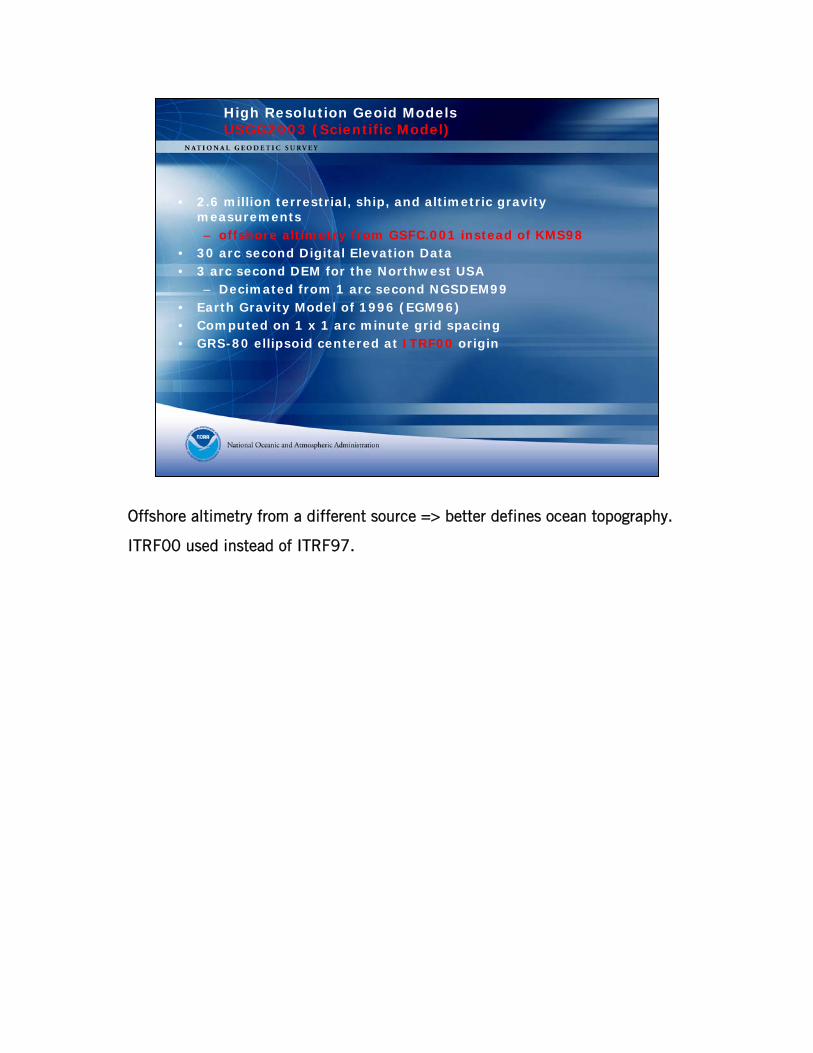
High Resolution Geoid ModelsUSGG2003 (Scientific Model)
• 2.6 million terrestrial, ship, and altimetric gravity measurements– offshore altimetry from GSFC.001 instead of KMS98
• 30 arc second Digital Elevation Data• 3 arc second DEM for the Northwest USA
– Decimated from 1 arc second NGSDEM99• Earth Gravity Model of 1996 (EGM96)• Computed on 1 x 1 arc minute grid spacing• GRS-80 ellipsoid centered at ITRF00 origin
Offshore altimetry from a different source => better defines ocean topography.
ITRF00 used instead of ITRF97.
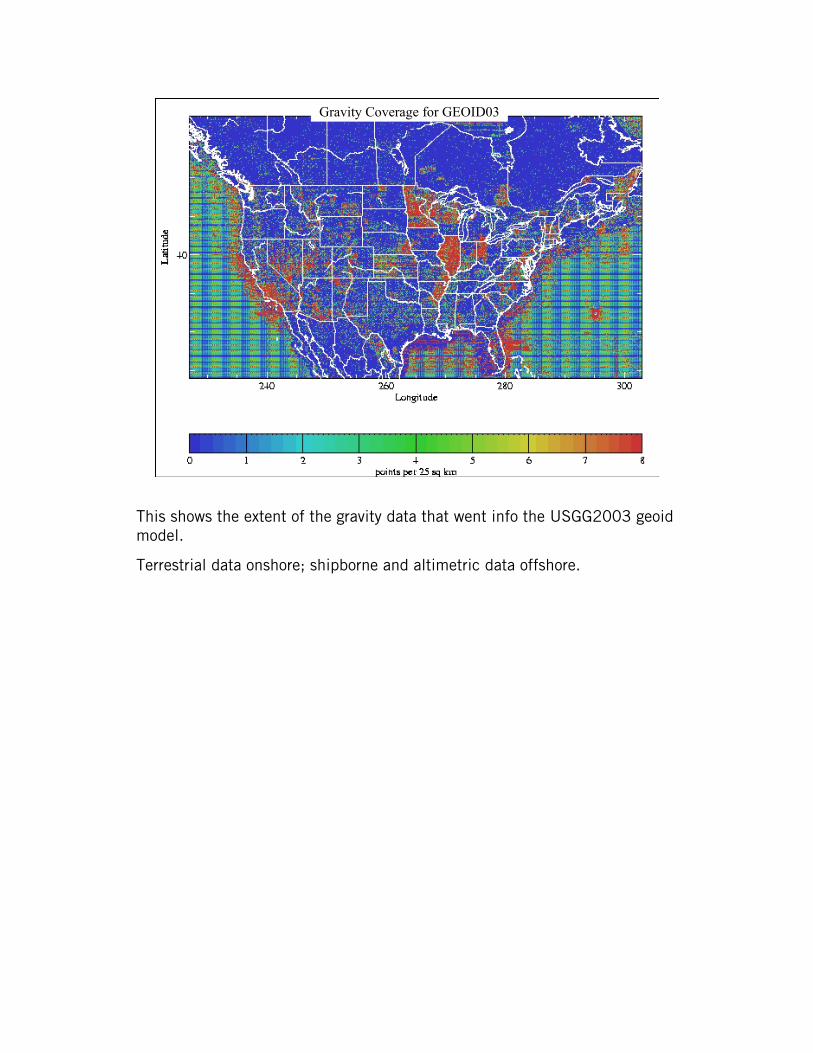
Gravity Coverage for GEOID03
This shows the extent of the gravity data that went info the USGG2003 geoid model.
Terrestrial data onshore; shipborne and altimetric data offshore.
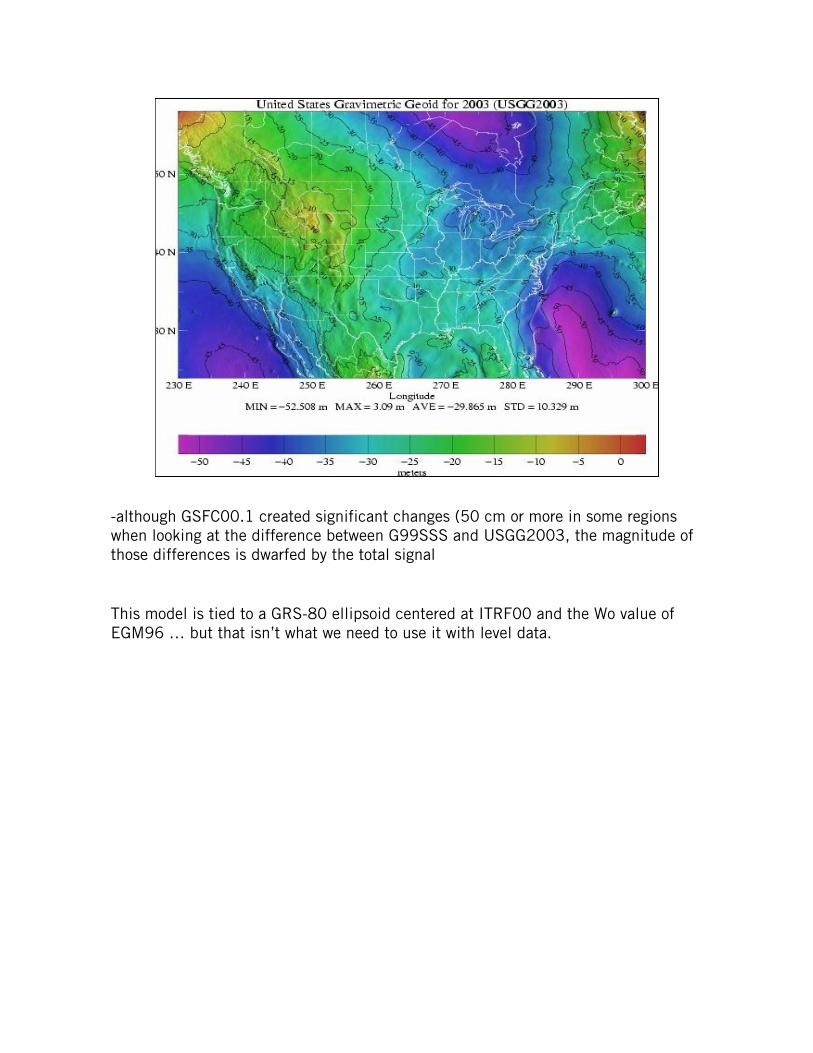
-although GSFC00.1 created significant changes (50 cm or more in some regions when looking at the difference between G99SSS and USGG2003, the magnitude of those differences is dwarfed by the total signal
This model is tied to a GRS-80 ellipsoid centered at ITRF00 and the Wo value of EGM96 … but that isn’t what we need to use it with level data.
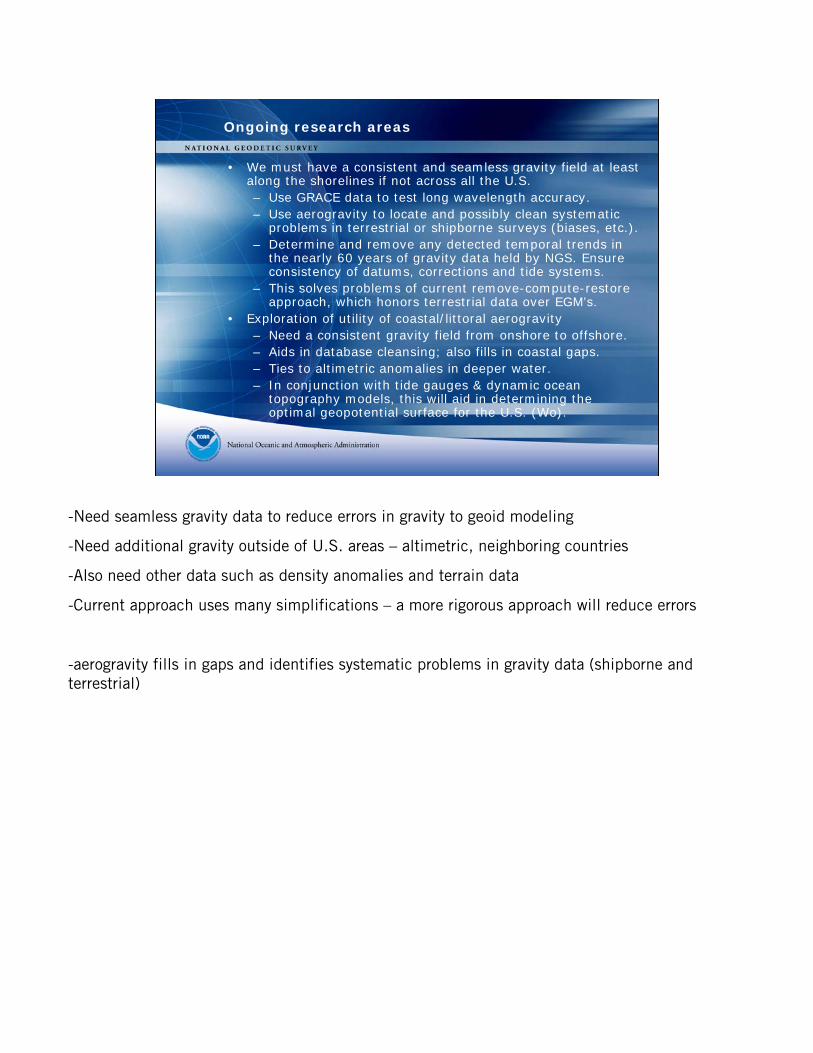
• We must have a consistent and seamless gravity field at least along the shorelines if not across all the U.S.– Use GRACE data to test long wavelength accuracy.– Use aerogravity to locate and possibly clean systematic
problems in terrestrial or shipborne surveys (biases, etc.).– Determine and remove any detected temporal trends in
the nearly 60 years of gravity data held by NGS. Ensure consistency of datums, corrections and tide systems.
– This solves problems of current remove-compute-restore approach, which honors terrestrial data over EGM’s.
• Exploration of utility of coastal/littoral aerogravity– Need a consistent gravity field from onshore to offshore.– Aids in database cleansing; also fills in coastal gaps.– Ties to altimetric anomalies in deeper water.– In conjunction with tide gauges & dynamic ocean
topography models, this will aid in determining the optimal geopotential surface for the U.S. (Wo).
Ongoing research areas
-Need seamless gravity data to reduce errors in gravity to geoid modeling
-Need additional gravity outside of U.S. areas – altimetric, neighboring countries
-Also need other data such as density anomalies and terrain data
-Current approach uses many simplifications – a more rigorous approach will reduce errors
-aerogravity fills in gaps and identifies systematic problems in gravity data (shipborne and terrestrial)
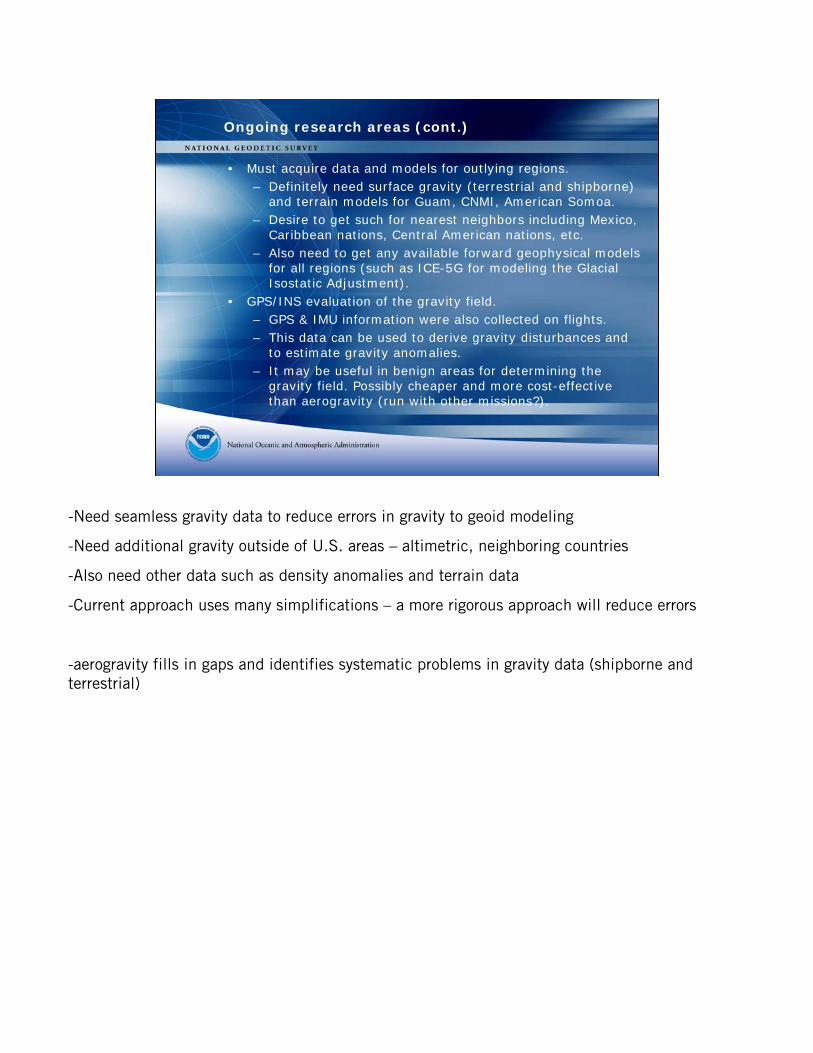
• Must acquire data and models for outlying regions.– Definitely need surface gravity (terrestrial and shipborne)
and terrain models for Guam, CNMI, American Somoa.– Desire to get such for nearest neighbors including Mexico,
Caribbean nations, Central American nations, etc.– Also need to get any available forward geophysical models
for all regions (such as ICE-5G for modeling the Glacial Isostatic Adjustment).
• GPS/INS evaluation of the gravity field.– GPS & IMU information were also collected on flights.– This data can be used to derive gravity disturbances and
to estimate gravity anomalies.– It may be useful in benign areas for determining the
gravity field. Possibly cheaper and more cost-effective than aerogravity (run with other missions?).
Ongoing research areas (cont.)
-Need seamless gravity data to reduce errors in gravity to geoid modeling
-Need additional gravity outside of U.S. areas – altimetric, neighboring countries
-Also need other data such as density anomalies and terrain data
-Current approach uses many simplifications – a more rigorous approach will reduce errors
-aerogravity fills in gaps and identifies systematic problems in gravity data (shipborne and terrestrial)
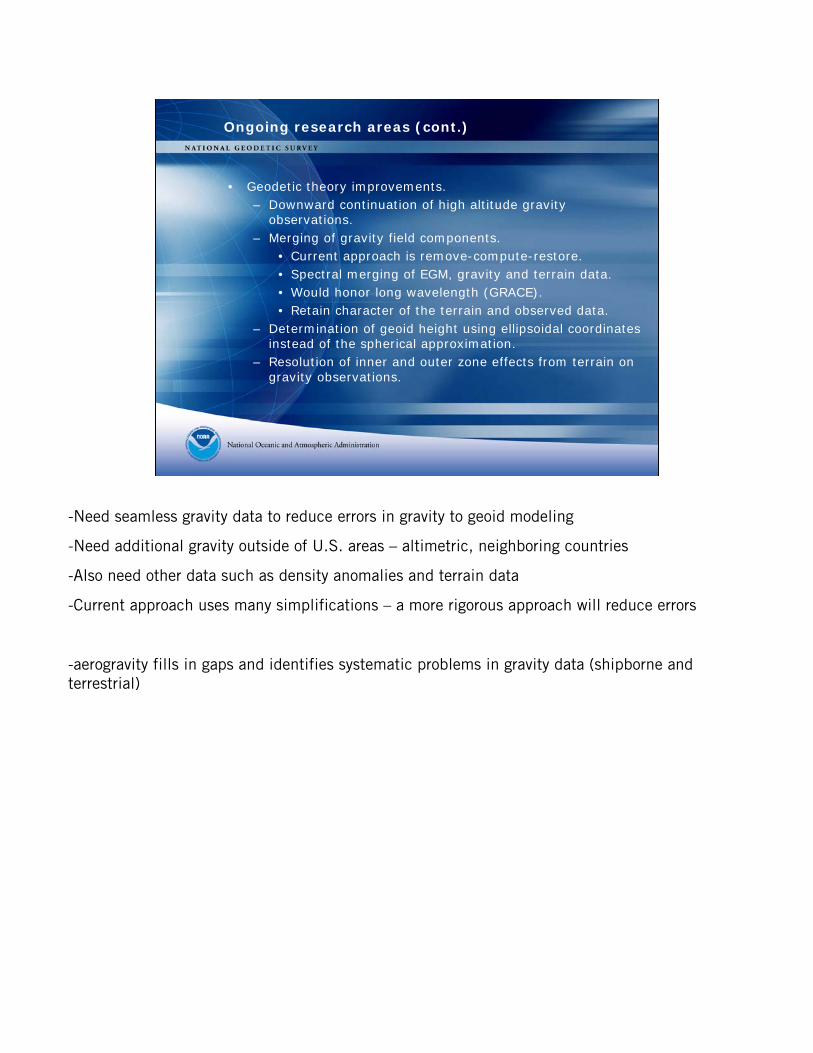
• Geodetic theory improvements.– Downward continuation of high altitude gravity
observations.– Merging of gravity field components.
• Current approach is remove-compute-restore.• Spectral merging of EGM, gravity and terrain data.• Would honor long wavelength (GRACE).• Retain character of the terrain and observed data.
– Determination of geoid height using ellipsoidal coordinates instead of the spherical approximation.
– Resolution of inner and outer zone effects from terrain on gravity observations.
Ongoing research areas (cont.)
-Need seamless gravity data to reduce errors in gravity to geoid modeling
-Need additional gravity outside of U.S. areas – altimetric, neighboring countries
-Also need other data such as density anomalies and terrain data
-Current approach uses many simplifications – a more rigorous approach will reduce errors
-aerogravity fills in gaps and identifies systematic problems in gravity data (shipborne and terrestrial)
Geoid
Ellipsoid
Earth’sSurface
Coast
Ellipsoid HtFrom GPS
How “high above sealevel” am I? (FEMA, USACE, Surveying and Mapping)
OceanSurface
From Satellite Altimetry
How large are near-shorehydrodynamic processes?(Coast Survey, CSC,CZM)
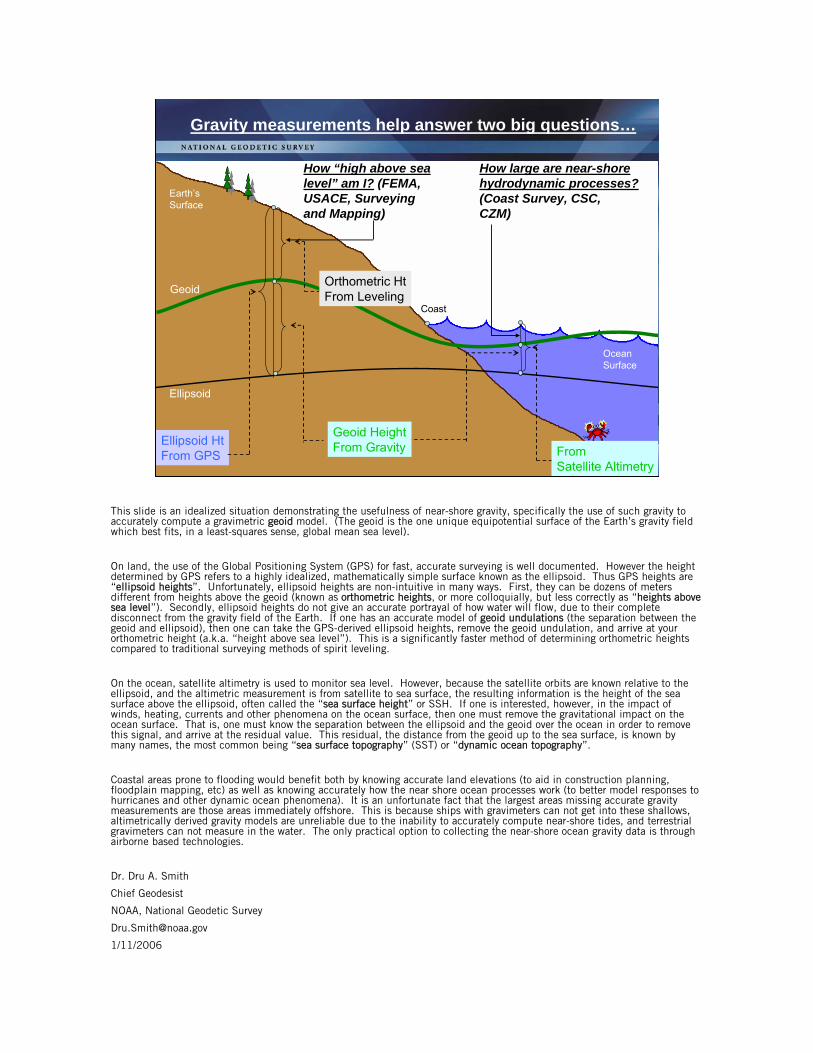
Gravity measurements help answer two big questions…
Geoid HeightFrom Gravity
Orthometric HtFrom Leveling
This slide is an idealized situation demonstrating the usefulness of near-shore gravity, specifically the use of such gravity to accurately compute a gravimetric geoid model. (The geoid is the one unique equipotential surface of the Earth’s gravity field which best fits, in a least-squares sense, global mean sea level).
On land, the use of the Global Positioning System (GPS) for fast, accurate surveying is well documented. However the height determined by GPS refers to a highly idealized, mathematically simple surface known as the ellipsoid. Thus GPS heights are “ellipsoid heights”. Unfortunately, ellipsoid heights are non-intuitive in many ways. First, they can be dozens of meters different from heights above the geoid (known as orthometric heights, or more colloquially, but less correctly as “heights above sea level”). Secondly, ellipsoid heights do not give an accurate portrayal of how water will flow, due to their complete disconnect from the gravity field of the Earth. If one has an accurate model of geoid undulations (the separation between the geoid and ellipsoid), then one can take the GPS-derived ellipsoid heights, remove the geoid undulation, and arrive at your orthometric height (a.k.a. “height above sea level”). This is a significantly faster method of determining orthometric heights compared to traditional surveying methods of spirit leveling.
On the ocean, satellite altimetry is used to monitor sea level. However, because the satellite orbits are known relative to theellipsoid, and the altimetric measurement is from satellite to sea surface, the resulting information is the height of the sea surface above the ellipsoid, often called the “sea surface height” or SSH. If one is interested, however, in the impact of winds, heating, currents and other phenomena on the ocean surface, then one must remove the gravitational impact on the ocean surface. That is, one must know the separation between the ellipsoid and the geoid over the ocean in order to remove this signal, and arrive at the residual value. This residual, the distance from the geoid up to the sea surface, is known by many names, the most common being “sea surface topography” (SST) or “dynamic ocean topography”.
Coastal areas prone to flooding would benefit both by knowing accurate land elevations (to aid in construction planning, floodplain mapping, etc) as well as knowing accurately how the near shore ocean processes work (to better model responses to hurricanes and other dynamic ocean phenomena). It is an unfortunate fact that the largest areas missing accurate gravity measurements are those areas immediately offshore. This is because ships with gravimeters can not get into these shallows, altimetrically derived gravity models are unreliable due to the inability to accurately compute near-shore tides, and terrestrial gravimeters can not measure in the water. The only practical option to collecting the near-shore ocean gravity data is through airborne based technologies.
Dr. Dru A. Smith
Chief Geodesist
NOAA, National Geodetic Survey
1/11/2006
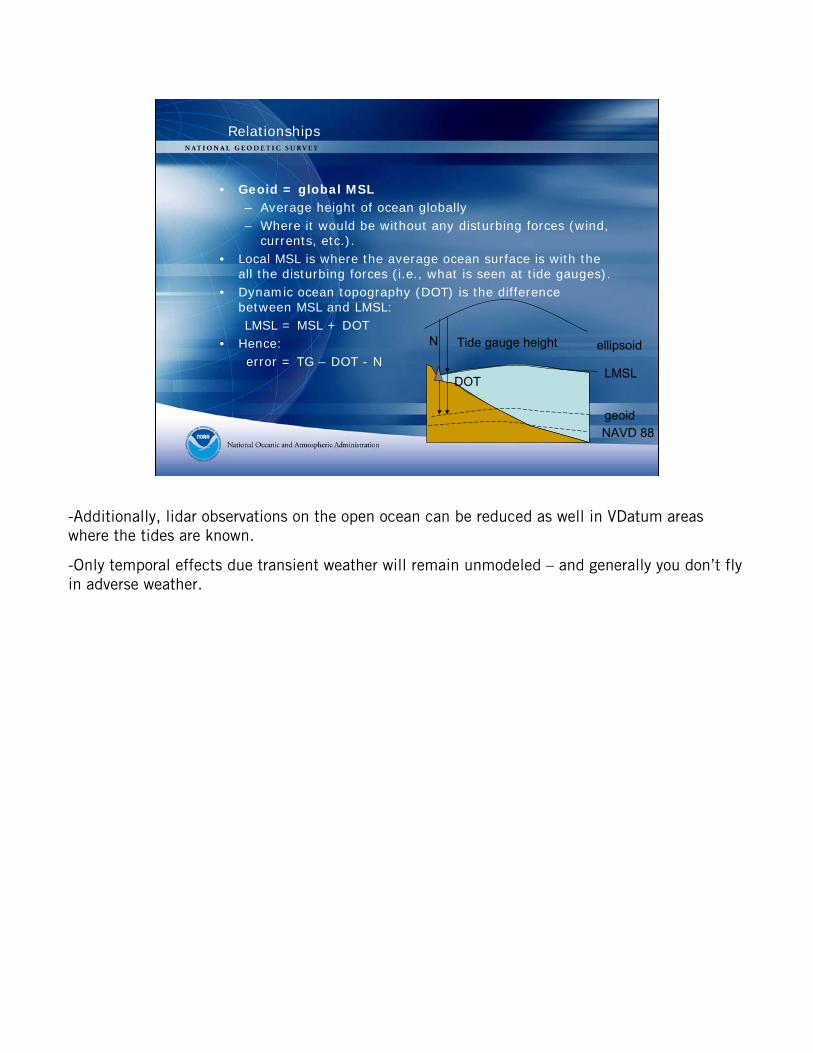
Relationships
• Geoid = global MSL– Average height of ocean globally – Where it would be without any disturbing forces (wind,
currents, etc.).• Local MSL is where the average ocean surface is with the
all the disturbing forces (i.e., what is seen at tide gauges).• Dynamic ocean topography (DOT) is the difference
between MSL and LMSL: LMSL = MSL + DOT
• Hence: error = TG – DOT - N
ellipsoid
LMSL
geoid
N Tide gauge height
DOT
NAVD 88
-Additionally, lidar observations on the open ocean can be reduced as well in VDatum areas where the tides are known.
-Only temporal effects due transient weather will remain unmodeled – and generally you don’t fly in adverse weather.
M1
M2
M3
M4
M5
M6
M7
M8
M10
M9
M11
M12
M13
M14
M15
M16
M17
M18
M20
M19
M21
M22
M23
M24
M25
M26
M27
M28
M30
M29
J1J2J3J4J5J6J7J8J10J9J11J12J13J14J15J16J17J18
J20J19
J21J22J23J24J25J26
T1
T2
T3
T4
T5
T6
T7
T8
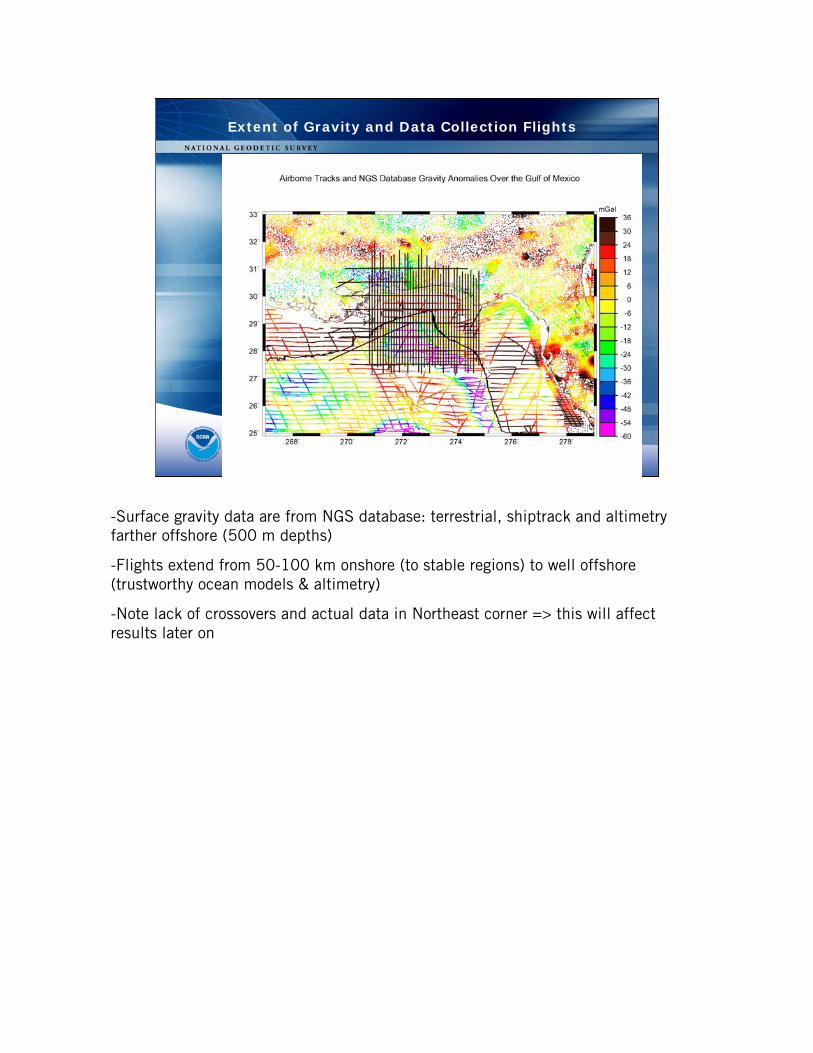
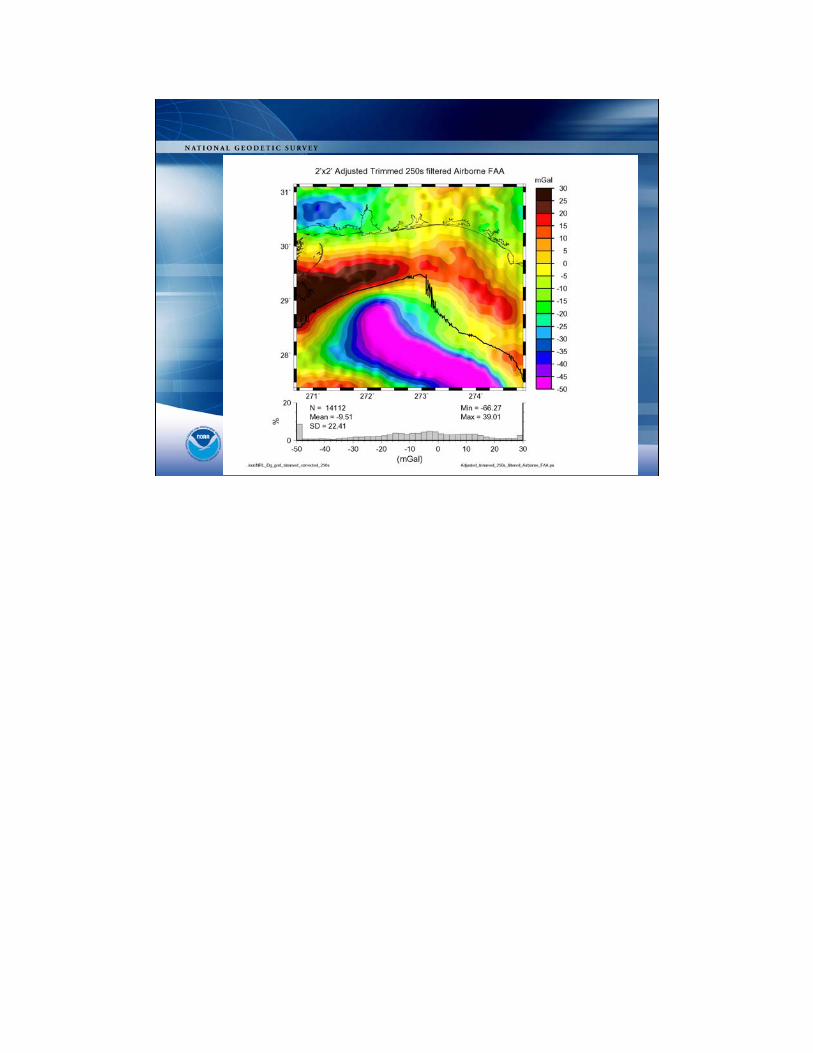
Extent of Gravity and Data Collection Flights
-Surface gravity data are from NGS database: terrestrial, shiptrack and altimetry farther offshore (500 m depths)
-Flights extend from 50-100 km onshore (to stable regions) to well offshore (trustworthy ocean models & altimetry)
-Note lack of crossovers and actual data in Northeast corner => this will affect results later on
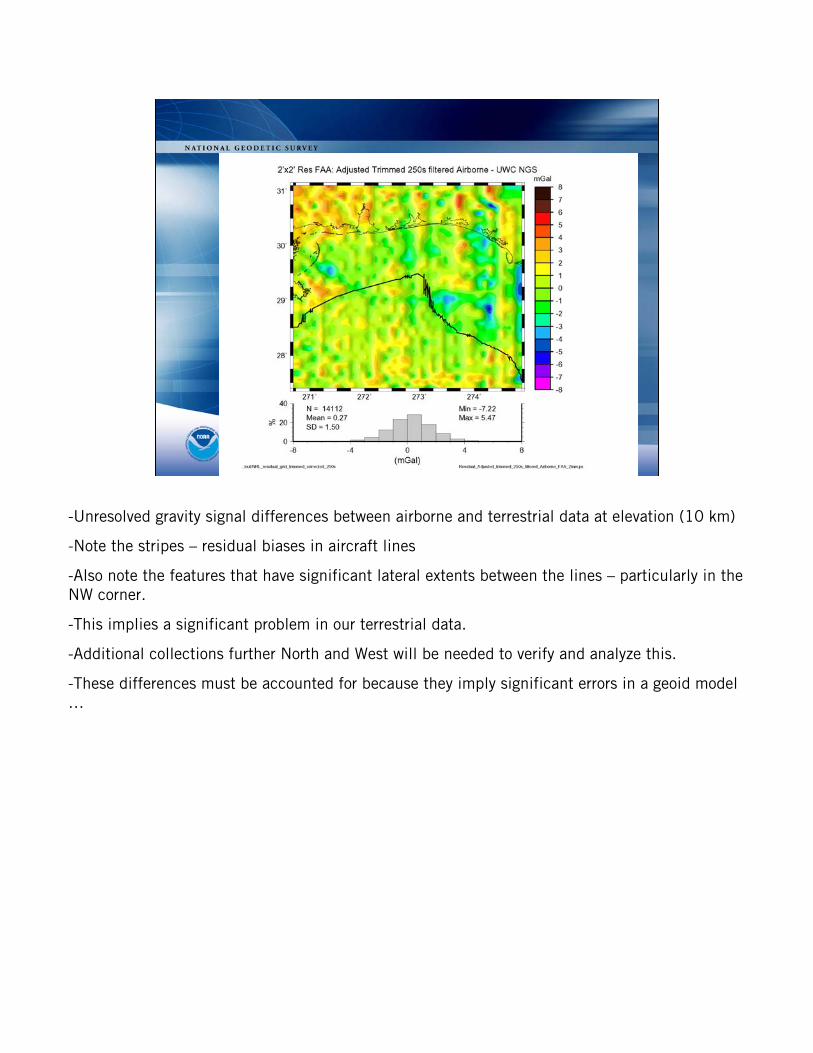
-Unresolved gravity signal differences between airborne and terrestrial data at elevation (10 km)
-Note the stripes – residual biases in aircraft lines
-Also note the features that have significant lateral extents between the lines – particularly in the NW corner.
-This implies a significant problem in our terrestrial data.
-Additional collections further North and West will be needed to verify and analyze this.
-These differences must be accounted for because they imply significant errors in a geoid model …
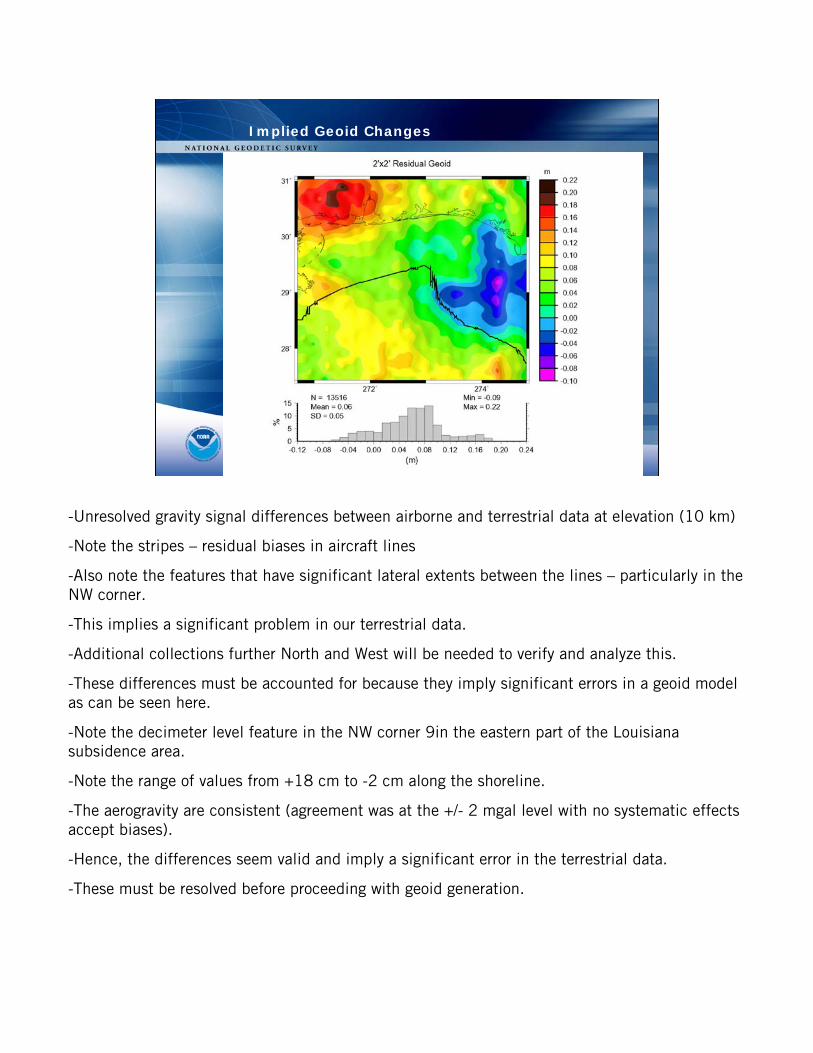
Implied Geoid Changes
-Unresolved gravity signal differences between airborne and terrestrial data at elevation (10 km)
-Note the stripes – residual biases in aircraft lines
-Also note the features that have significant lateral extents between the lines – particularly in the NW corner.
-This implies a significant problem in our terrestrial data.
-Additional collections further North and West will be needed to verify and analyze this.
-These differences must be accounted for because they imply significant errors in a geoid model as can be seen here.
-Note the decimeter level feature in the NW corner 9in the eastern part of the Louisiana subsidence area.
-Note the range of values from +18 cm to -2 cm along the shoreline.
-The aerogravity are consistent (agreement was at the +/- 2 mgal level with no systematic effects accept biases).
-Hence, the differences seem valid and imply a significant error in the terrestrial data.
-These must be resolved before proceeding with geoid generation.
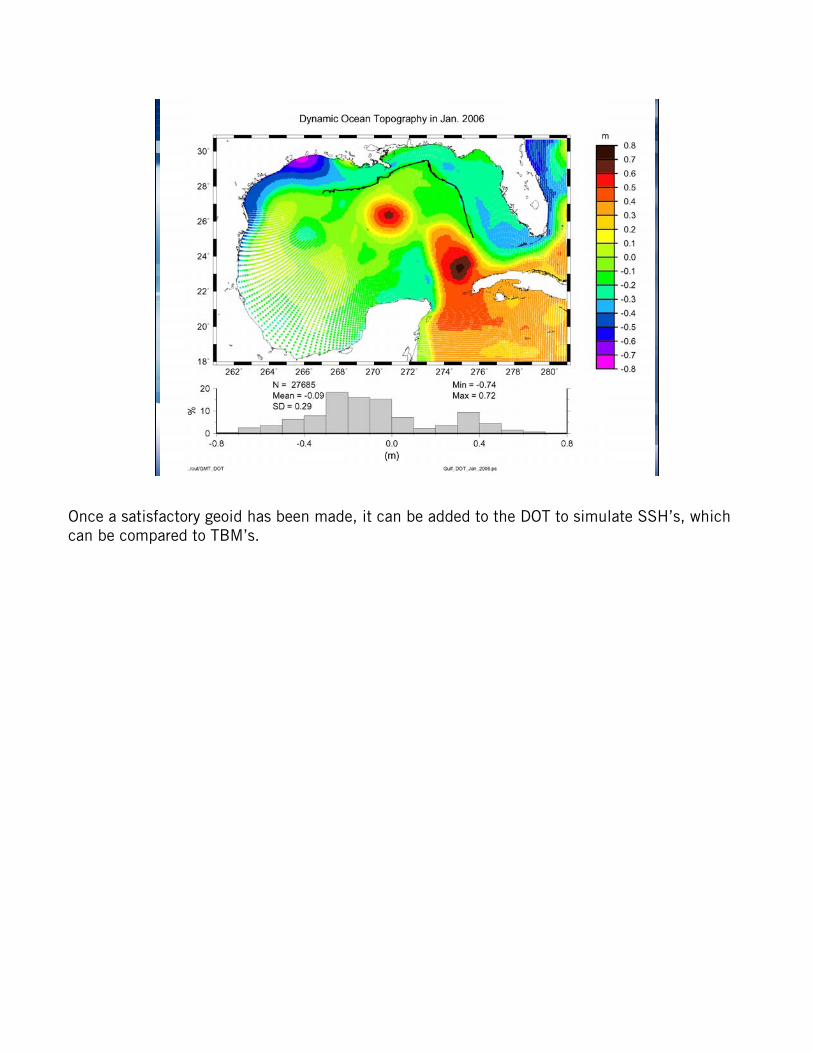
Once a satisfactory geoid has been made, it can be added to the DOT to simulate SSH’s, which can be compared to TBM’s.
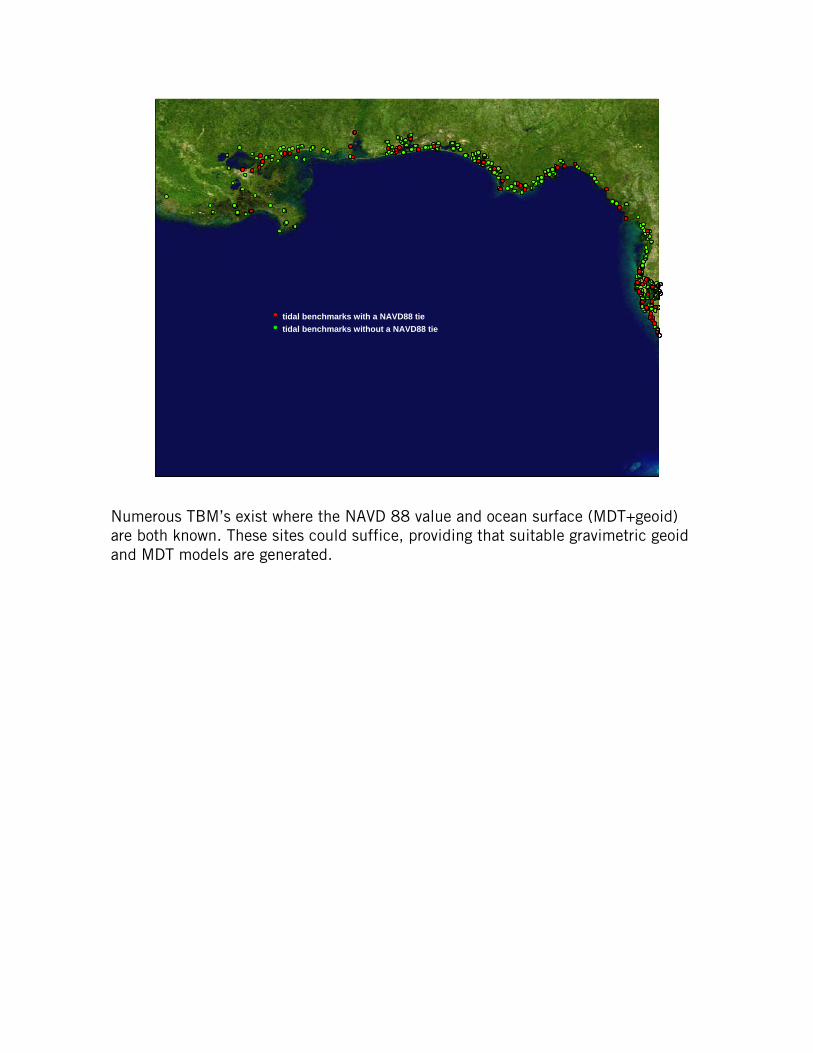
tidal benchmarks with a NAVD88 tietidal benchmarks without a NAVD88 tie
Numerous TBM’s exist where the NAVD 88 value and ocean surface (MDT+geoid) are both known. These sites could suffice, providing that suitable gravimetric geoid and MDT models are generated.
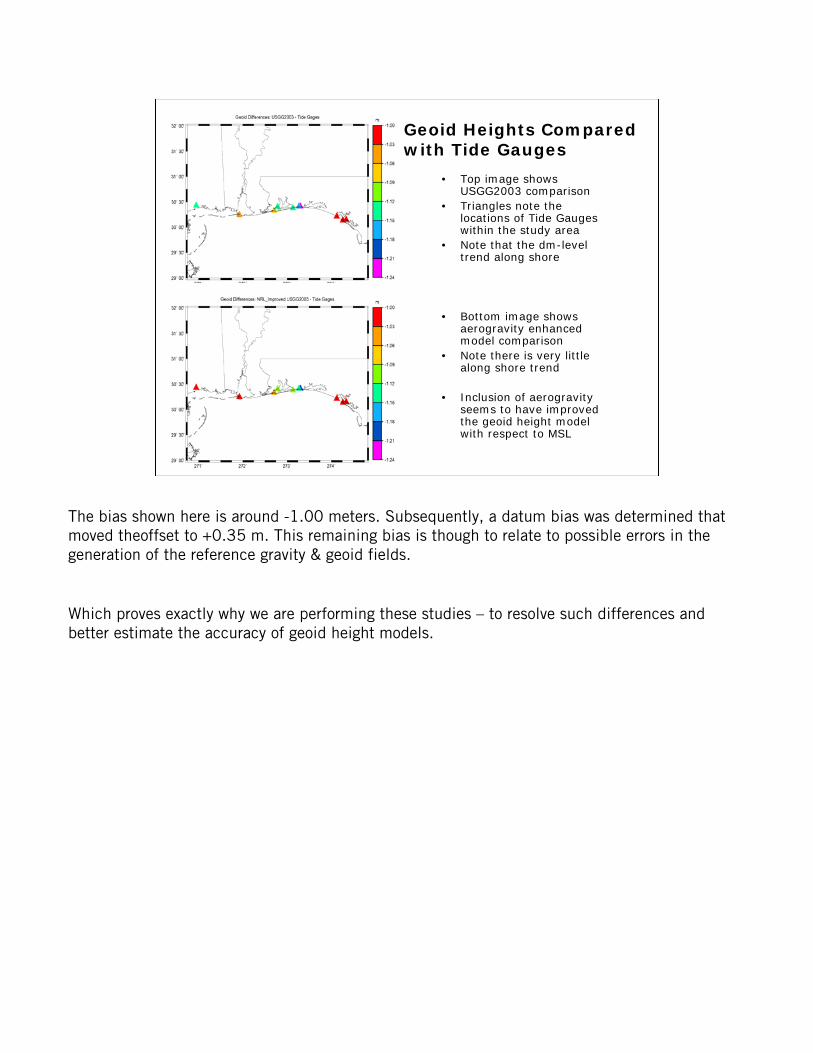
Geoid Heights Compared with Tide Gauges
• Top image shows USGG2003 comparison
• Triangles note the locations of Tide Gauges within the study area
• Note that the dm-level trend along shore
• Bottom image shows aerogravity enhanced model comparison
• Note there is very little along shore trend
• Inclusion of aerogravity seems to have improved the geoid height model with respect to MSL
The bias shown here is around -1.00 meters. Subsequently, a datum bias was determined that moved theoffset to +0.35 m. This remaining bias is though to relate to possible errors in the generation of the reference gravity & geoid fields.
Which proves exactly why we are performing these studies – to resolve such differences and better estimate the accuracy of geoid height models.
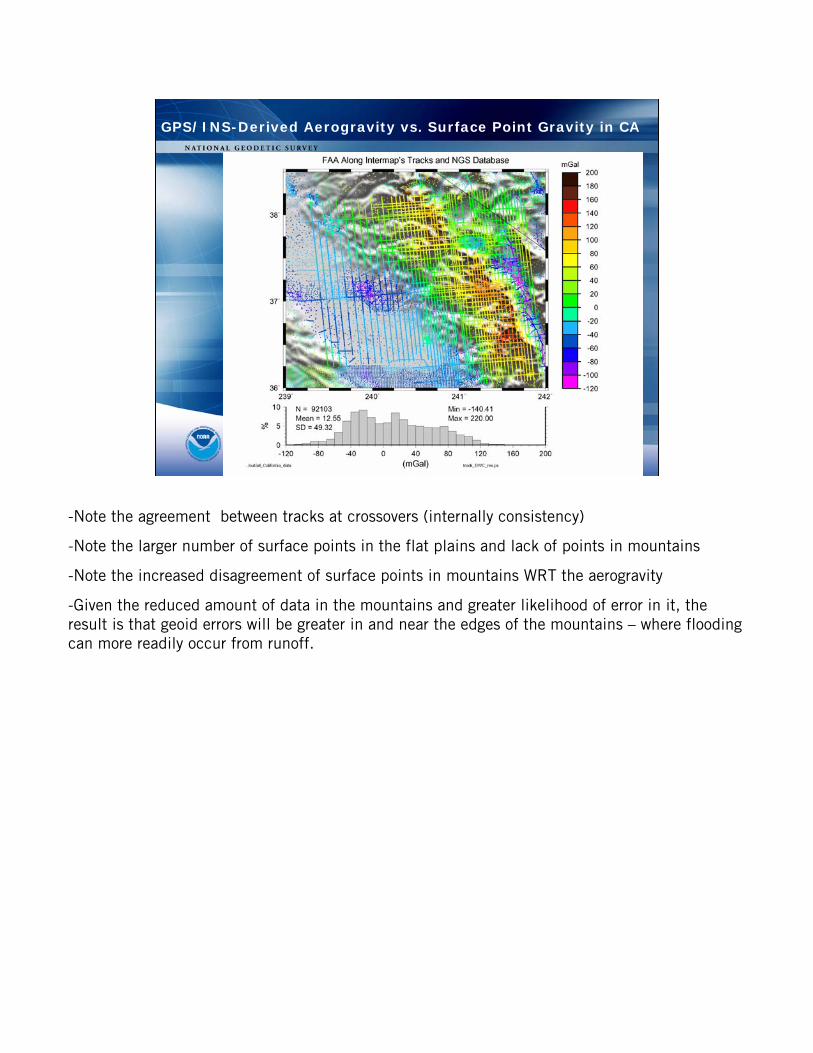
GPS/INS-Derived Aerogravity vs. Surface Point Gravity in CA
-Note the agreement between tracks at crossovers (internally consistency)
-Note the larger number of surface points in the flat plains and lack of points in mountains
-Note the increased disagreement of surface points in mountains WRT the aerogravity
-Given the reduced amount of data in the mountains and greater likelihood of error in it, the result is that geoid errors will be greater in and near the edges of the mountains – where flooding can more readily occur from runoff.
• A Consistent vertical datum between all U.S. states and territories as well as our neighbors in the region. – Reduce confusion between neighboring jurisdictions.– Local accuracy but national consistency.
• This provides a consistent datum for disaster management.– Storm surge, tsunamis, & coastal storms.– Disasters aren’t bound by political borders.
• Heights that can be directly related to oceanic and hydrologic models (coastal and inland flooding problems).
• The resulting improvements to flood maps will better enable decision making for who does & doesn’t need flood insurance.
• Updates to the model can be made more easily, if needed, to reflect any temporal changes in the geoid/gravity.
• Finally, offshore models of ocean topography will be improved and validated. These models will provide better determination of offshore water flow (useful for evaluating the movement of an oil slick).
Expected Results
QUESTIONS?
Geoid Research Team:•Dr. Daniel R. Roman, research geodesist
[email protected]•Dr. Yan Ming Wang, research geodesist
[email protected]•Jarir Saleh, ERT contractor, gravity database analysis•William Waickman, programming & database access•Ajit Sing, Datum Transformation Expert•Website: http://www.ngs.noaa.gov/GEOID/•Phone: 301-713-3202