Forensic analysis of glass by μ-XRF, SN-ICP-MS, LA-ICP-MS and LA-ICP-OES: evaluation of the...
13
Forensic analysis of glass by m-XRF, SN-ICP-MS, LA-ICP-MS and LA-ICP-OES: evaluation of the performance of different criteria for comparing elemental composition Tatiana Trejos, a Robert Koons, b Peter Weis, c Stefan Becker, c Ted Berman, d Claude Dalpe, e Marc Duecking, c JoAnn Buscaglia, f Tiffany Eckert-Lumsdon, g Troy Ernst, h Christopher Hanlon, i Alex Heydon, j Kim Mooney, g Randall Nelson, k Kristine Olsson, l Emily Schenk, a Christopher Palenik, m Edward Chip Pollock, n David Rudell, j Scott Ryland, d Anamary Tarifa, a Melissa Valadez, o Andrew van Es, p Vincent Zdanowicz q and Jose Almirall * a Four interlaboratory tests were designed to evaluate the performance of match criteria for forensic comparisons of elemental composition of glass by m-XRF, solution nebulization SN-ICP-MS, LA-ICP-OES and LA-ICP-MS. A total of 24 analysts in 18 laboratories participated in the tests. Glass specimens were selected to study the capabilities of the techniques to discriminate glass produced in the same manufacturing plant at different time intervals and to associate samples that originated from a single source. The assessment of the effectiveness of several match criteria included: confidence interval (6s, 5s, 4s, 3s, 2s), modified confidence interval, t-test, range overlap, and Hotelling's T 2 . Error rates are reported for each of these criteria. Recommended match criteria were those found to produce the lowest combinations of type 1 and type 2 error rates. Performance of the studied match criteria was dependent on the homogeneity of the glass sources, the repeatability between analytical measurements, and the number of elements that were measured. The best results for m-XRF data were obtained using spectral overlay followed by a 3s confidence interval or range overlap. For ICP-based measurements, a wider match criterion, such as a modified confidence interval based on a fixed minimum relative standard deviation (4s, >3–5% RSD), is recommended due to the inherent precision of those methods (typically <1–5% RSD) and the greater number of elements measured. Glass samples that were manufactured in different plants, or at the same plant weeks or months apart, were readily differentiated by elemental composition when analyzed by these sensitive methods. Introduction Elemental composition when combined with optical and physical properties has been shown to provide excellent discrimination between glass samples originating from different manufacturing sources. 1–10 A number of analytical methods are used for the elemental composition of glass for forensic purposes, including scanning a Florida International University, International Forensic Research Institute, 11200 SW 8 th St, Miami, FL 33199, USA. E-mail: almirall@u.edu; Fax: +1 305 3484485; Tel: +1 305 3483917 b Federal Bureau of Investigation, Laboratory Division, Counterterrorism and Forensic Science Research Unit, 2501 Investigation Parkway, Quantico, VA 22135, USA c Bundeskriminalamt (BKA), Forensic Science Institute, 65173 Wiesbaden, Germany d Florida Department of Law Enforcement, Orlando Regional Operations Center, 500 West Robinson Street, Orlando, Florida 32801, USA e Royal Canadian Mounted Police Department, Forensic Science and Identication Services, 1200 Vanier Parkway, Ottawa, ON, Canada f Federal Bureau of Investigation, Laboratory Division, Counterterrorism and Forensic Science Research Unit, 2501 Investigation Parkway, Quantico, VA 22135, USA g US Army Criminal Investigation Laboratory, 4930 N 31 st St, Forest Park, GA 30297- 5202, USA h Michigan State Police-Grand Rapids Laboratory, 720 Fuller Ave NE, Grand Rapids, MI 49503, USA i Miami Dade Police Department, Forensic Science Services Bureau, 91105 Nw 25 th St, Miami, FL, 33172, USA j Center of Forensic Sciences, 25 Grosvenor St, Toronto, ON M7A268, Canada k Tennessee Bureau of Investigation, Forensic Services Division, 901 R.S Gass blvd, Nashville, TN, 37216, USA l Johnson County Crime Laboratory, 6000 Lamar Ave, Mission, KS, 66202, USA m Microtrace LLC, 790 Fletcher Drive, Elgin, IL, 60123, USA n Laboratory of Forensic Science, Sacramento, California, USA o Texas Department of Public Safety Crime Laboratory, 5800 Guadalupe, Austin, TX, 78752, USA p Netherlands Forensic Institute, Laan van Ypenburg, 2497 6B The Hague, The Netherlands q Department of Homeland Security, CBP Research Laboratory, 7501 Boston Blvd, Springeld, VA 22153, USA Cite this: J. Anal. At. Spectrom., 2013, 28, 1270 Received 6th April 2013 Accepted 10th June 2013 DOI: 10.1039/c3ja50128k www.rsc.org/jaas 1270 | J. Anal. At. Spectrom., 2013, 28, 1270–1282 This journal is ª The Royal Society of Chemistry 2013 JAAS PAPER Published on 11 June 2013. Downloaded by University of Leeds on 20/08/2013 11:37:58. View Article Online View Journal | View Issue
Transcript of Forensic analysis of glass by μ-XRF, SN-ICP-MS, LA-ICP-MS and LA-ICP-OES: evaluation of the...
JAAS
PAPER
Publ
ishe
d on
11
June
201
3. D
ownl
oade
d by
Uni
vers
ity o
f L
eeds
on
20/0
8/20
13 1
1:37
:58.
View Article OnlineView Journal | View Issue
aFlorida International University, Internatio
SW 8th St, Miami, FL 33199, USA. E-m
3484485; Tel: +1 305 3483917bFederal Bureau of Investigation, Labora
Forensic Science Research Unit, 2501 Inves
USAcBundeskriminalamt (BKA), Forensic SciencedFlorida Department of Law Enforcement, Or
West Robinson Street, Orlando, Florida 328eRoyal Canadian Mounted Police Departme
Services, 1200 Vanier Parkway, Ottawa, ONfFederal Bureau of Investigation, Labora
Forensic Science Research Unit, 2501 Inves
USAgUS Army Criminal Investigation Laboratory
5202, USA
Cite this: J. Anal. At. Spectrom., 2013,28, 1270
Received 6th April 2013Accepted 10th June 2013
DOI: 10.1039/c3ja50128k
www.rsc.org/jaas
1270 | J. Anal. At. Spectrom., 2013, 2
Forensic analysis of glass by m-XRF, SN-ICP-MS, LA-ICP-MSand LA-ICP-OES: evaluation of the performance ofdifferent criteria for comparing elemental composition
Tatiana Trejos,a Robert Koons,b Peter Weis,c Stefan Becker,c Ted Berman,d
Claude Dalpe,e Marc Duecking,c JoAnn Buscaglia,f Tiffany Eckert-Lumsdon,g
Troy Ernst,h Christopher Hanlon,i Alex Heydon,j Kim Mooney,g Randall Nelson,k
Kristine Olsson,l Emily Schenk,a Christopher Palenik,m Edward Chip Pollock,n
David Rudell,j Scott Ryland,d Anamary Tarifa,a Melissa Valadez,o Andrew van Es,p
Vincent Zdanowiczq and Jose Almirall*a
Four interlaboratory tests were designed to evaluate the performance of match criteria for forensic
comparisons of elemental composition of glass by m-XRF, solution nebulization SN-ICP-MS, LA-ICP-OES
and LA-ICP-MS. A total of 24 analysts in 18 laboratories participated in the tests. Glass specimens were
selected to study the capabilities of the techniques to discriminate glass produced in the same
manufacturing plant at different time intervals and to associate samples that originated from a single
source. The assessment of the effectiveness of several match criteria included: confidence interval
(�6s, �5s, �4s, �3s, �2s), modified confidence interval, t-test, range overlap, and Hotelling's T2. Error
rates are reported for each of these criteria. Recommended match criteria were those found to produce
the lowest combinations of type 1 and type 2 error rates. Performance of the studied match criteria
was dependent on the homogeneity of the glass sources, the repeatability between analytical
measurements, and the number of elements that were measured. The best results for m-XRF data were
obtained using spectral overlay followed by a �3s confidence interval or range overlap. For ICP-based
measurements, a wider match criterion, such as a modified confidence interval based on a fixed
minimum relative standard deviation (�4s, >3–5% RSD), is recommended due to the inherent precision
of those methods (typically <1–5% RSD) and the greater number of elements measured. Glass samples
that were manufactured in different plants, or at the same plant weeks or months apart, were readily
differentiated by elemental composition when analyzed by these sensitive methods.
Introduction
Elemental composition when combined with optical andphysical properties has been shown to provide excellent
nal Forensic Research Institute, 11200
ail: [email protected]; Fax: +1 305
tory Division, Counterterrorism and
tigation Parkway, Quantico, VA 22135,
Institute, 65173 Wiesbaden, Germany
lando Regional Operations Center, 500
01, USA
nt, Forensic Science and Identication
, Canada
tory Division, Counterterrorism and
tigation Parkway, Quantico, VA 22135,
, 4930 N 31st St, Forest Park, GA 30297-
8, 1270–1282
discrimination between glass samples originating fromdifferent manufacturing sources.1–10
A number of analytical methods are used for the elementalcomposition of glass for forensic purposes, including scanning
hMichigan State Police-Grand Rapids Laboratory, 720 Fuller Ave NE, Grand Rapids,
MI 49503, USAiMiami Dade Police Department, Forensic Science Services Bureau, 91105 Nw 25th
St, Miami, FL, 33172, USAjCenter of Forensic Sciences, 25 Grosvenor St, Toronto, ON M7A268, CanadakTennessee Bureau of Investigation, Forensic Services Division, 901 R.S Gass blvd,
Nashville, TN, 37216, USAlJohnson County Crime Laboratory, 6000 Lamar Ave, Mission, KS, 66202, USAmMicrotrace LLC, 790 Fletcher Drive, Elgin, IL, 60123, USAnLaboratory of Forensic Science, Sacramento, California, USAoTexas Department of Public Safety Crime Laboratory, 5800 Guadalupe, Austin, TX,
78752, USApNetherlands Forensic Institute, Laan van Ypenburg, 2497 6B The Hague, The
NetherlandsqDepartment of Homeland Security, CBP Research Laboratory, 7501 Boston Blvd,
Springeld, VA 22153, USA
This journal is ª The Royal Society of Chemistry 2013
Paper JAAS
Publ
ishe
d on
11
June
201
3. D
ownl
oade
d by
Uni
vers
ity o
f L
eeds
on
20/0
8/20
13 1
1:37
:58.
View Article Online
electron microscopy-X-ray spectroscopy (SEM-EDX),7,13,14 X-rayuorescence spectroscopy (XRF),2,15 inductively coupled plasmaoptical emission spectroscopy (ICP-OES),5,10,13–16 inductivelycoupled plasma mass spectrometry (ICP-MS)18–21 and laserablation methods coupled to ICP-MS or to optical emissionspectrometers (LA-ICP-MS17,18,22,23 and LIBS23,24).
With the increasing use of methods of elemental compari-sons of glass fragments by forensic laboratories, the need forconsistent analytical protocols and interpretive criteria hasbeen recognized.25 The Elemental Analysis Working Group(EAWG), made up of forensic glass examiners and researchscientists, was formed to develop robust analytical protocolsand to assess the accuracy of various criteria used for sourcecomparison. The tests concerning development of analyticalprotocols have been addressed in a separate paper.15 Analyticalprotocols using m-XRF and ICP-based methods that providequantitative data for 6 to 18 elements or intensity ratios wereassessed. In order to make a decision as to whether theelemental compositions of two fragments are analyticallyindistinguishable, a match criterion must rst be selected. Inthis study, if the known and the questioned glasses are found tobe signicantly different by the selected criterion in at least oneof the monitored element concentrations or intensity ratios,then it can be concluded that the two samples did not originatefrom the same broken source. Conversely, a lack of signicantdifferences in the elemental compositions suggests that thesamples could have originated from the same broken source.This paper describes the results of interlaboratory tests thatmeasured the error rates obtained when using a variety ofselected match criteria on glasses having similar elementalcompositions.
Several match criteria have been used to compare theelemental compositions of two or more glass fragments todetermine if they could have originated from the same brokenglass source.12,27–34 Match criteria evaluated in this study arebriey described below.
Spectral overlay is typically one of the rst steps used incomparisons of m-XRF spectra. Reproducible differences in theelemental peaks present or marked differences in their relativepeak heights indicate that the samples have different sources.The benets of this technique are its simplicity and the abilityto recognize the presence of unusual elements, such as Mo,which may be present at measurable concentrations. It is,however, somewhat subjective in that the ability to differentiateamong visually similar spectra depends upon the similarity ofbackground shapes, the signal to noise levels, and the experi-ence of the person making the comparison. Moreover the glassspecimens used for m-XRF comparisons should be of similarsize, shape, and thickness to each other to avoid false exclusionsderived from take-off-angle and critical depth effects.40 Onedisadvantage to spectral overlap is that its use does not providea measure of the statistical signicance when the result is thattwo samples are indistinguishable.
Range overlap is a relatively simple assessment that consistsof determining whether or not the overall range of values of ameasured parameter from one sample overlaps the range ofvalues of that parameter in another sample. The range is
This journal is ª The Royal Society of Chemistry 2013
calculated as the range between the highest and the lowest valuein a data set. If the two measured ranges for all of the measuredvariables overlap, it may be concluded that the two samples couldhave originated from the same source. Advantages of rangeoverlap are that there is no need for the assumption that the dataare normally distributed and it is easy to explain to a jury. On theother hand, the statistical signicance of any observed overlapmay be difficult to determine since the distributions of theobserved measurements may not be known, particularly whenthe number of measurements is small.35
The other criteria for comparison of elemental compositionsthat were evaluated in this study can conveniently be groupedinto two general approaches. The rst consists of tests of thehypothesis of equality of means of two sets of measurements.Examples of this approach are Student's t-test and its multivar-iate version, Hotelling's T 2 test. One advantage of the t-testcomparison is that the statement regarding a match can besupported with a signicance or probability value. Forensicpractitioners have utilized various signicance levels for thet-test. When using a t-test successively for each of a number ofmeasured elements, a probability adjustment, such as the Bon-ferroni correction, can be applied to limit a cumulative increasein the family-wise error rate for multivariate comparisons.
Hotelling's T 2-test is a multivariate equivalent of Student'st-test.35–37 It has the limitation that the number of measure-ments must be at least two greater than the number of variables.For example, if the concentrations of 18 elements are deter-mined during the analysis, then Hotelling's T 2-test requires atotal of at least 20 replicate measurements on the two samples.This is not always practical, depending on the analytical tech-nique used and/or the sample size.
For comparisons of more than two samples or groups,Analysis of Variance (ANOVA) provides a statistical test ofwhether or not the means of several samples are all signicantlydifferent. ANOVA estimates differences between and within thesamples, which is referred to as the variance.35
The second approach is designed to more closely reect thecommon forensic situation where many measurements can bemade on one sample (the known sample, K, typically a largefragment of a broken glass object from a known source) but onlya few measurements can be made on the other sample (thequestioned sample, Q, usually a small fragment recovered froma crime scene or suspect). The measurements from the brokenobject are used to characterize an acceptance interval for eachelement or intensity ratio using the mean and some measure ofdispersion of measurements about that mean obtained frommultiple measurements. The smaller number of measurementsmade from each recovered glass fragment are used to ndmeanvalues for that fragment which can then be compared to theacceptance interval. The glass samples are considered indis-tinguishable only when mean concentrations of each of theelements or element intensity ratios of the questioned samplefall within the matching known sample acceptance intervals.Conversely, if one or more of the measured values for the Qsample fall outside of their acceptance intervals, then K can beexcluded as the source of that Q sample. When the data arenormally distributed about the mean, a condence interval and
J. Anal. At. Spectrom., 2013, 28, 1270–1282 | 1271
JAAS Paper
Publ
ishe
d on
11
June
201
3. D
ownl
oade
d by
Uni
vers
ity o
f L
eeds
on
20/0
8/20
13 1
1:37
:58.
View Article Online
a corresponding signicance level can be assigned. Intervals of�2, 3, 4, 5 and 6 standard deviations about the mean wereexamined in this study. Of course this approach does not applyto all situations. If the Q sample consists of a sufficient numberand size of fragments that can reasonably be assumed to befrom one source, it too can be characterized like the brokenobject and their acceptance intervals compared to see if theyoverlap.
For LA-ICP-MS measurements, the standard deviations ofconcentration values determined for a given piece of glass aresometimes so small that an unacceptably high rate of falseexclusions can occur. To correct for this effect, it has beensuggested that the acceptance interval should be set to theappropriate multiple times the greater of either the actualstandard deviation or a value equal to 3% to 5% of the meanconcentration for each element in the known sample.33
Regardless of which match criterion is used, there are twotypes of errors that can occur, either incorrect exclusion ofsamples from the same source (type 1) or incorrect associationof samples from different sources (type 2). Two comprehensivestudies have recently been reported for the evaluation of errorrates for several match criteria for univariate refractive indexdata38 and for multi-elemental concentration data.33
The aim of the research presented here is to determinedirectly the error rates associated with various match criteriausing data obtained by several of the elemental techniquescurrently being used for the forensic analysis of glass. Thisstudy involved elemental analysis of glass fragments via fourinterlaboratory tests with each part of the study designed basedon the previous interlaboratory test. The data for these studieswas obtained by the participants using analytical instrumenta-tion in current use in their laboratories. The development ofstandardized analytical protocols was described in a previouspaper.26 The blind testing of glass fragments under several casescenarios was conducted in the last three collaborative tests andthese results are described in this paper. Topics discussedinclude blind test results for individual laboratories using theirtesting and interpretation criteria, evaluation of several matchcriteria by determination of the number of type 1 and type 2errors that result when each criterion is applied to the dataprovided by the participants, and a homogeneity study of one ofthe glass sheets used in these studies. These interlaboratorytests were designed to determine which match criteria areappropriate for the interpretation of the data generated fromthe elemental analysis of glass and whether results obtainedusing these criteria are dependent on the technique used toacquire the data. This study represents an effort towards thestandardization of the match criteria and sampling strategiesused by glass examiners, and represents another step towardsassessing the signicance of glass associations.
ExperimentalInstrumentation and measurement parameters
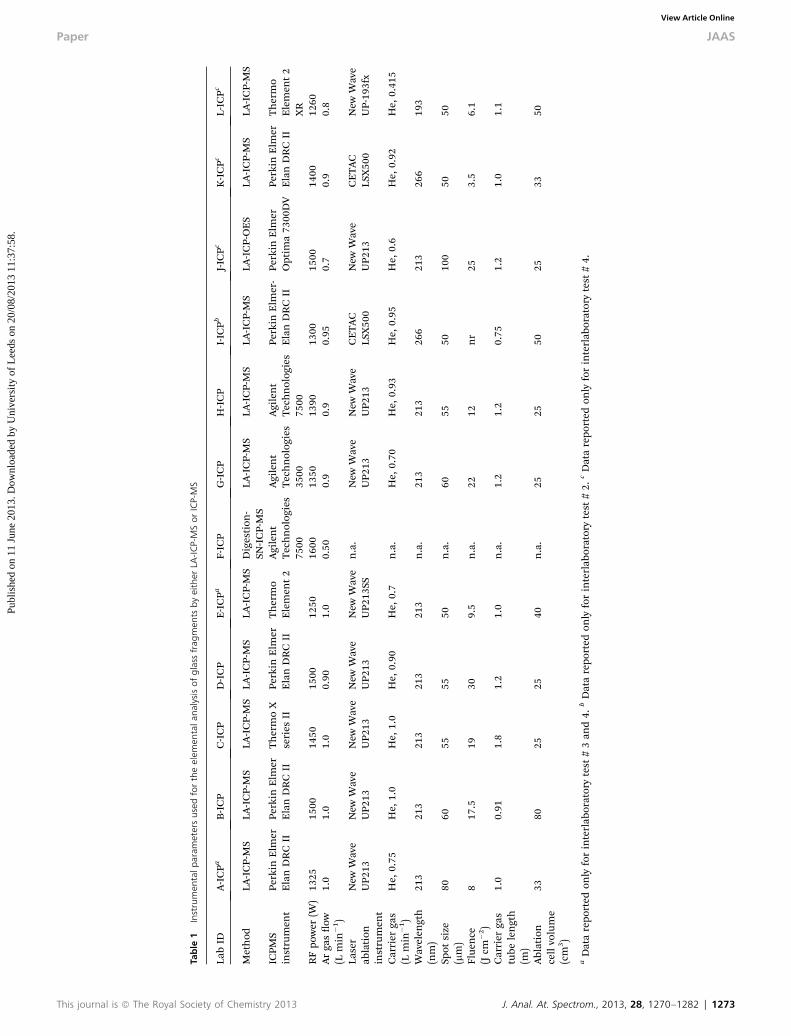
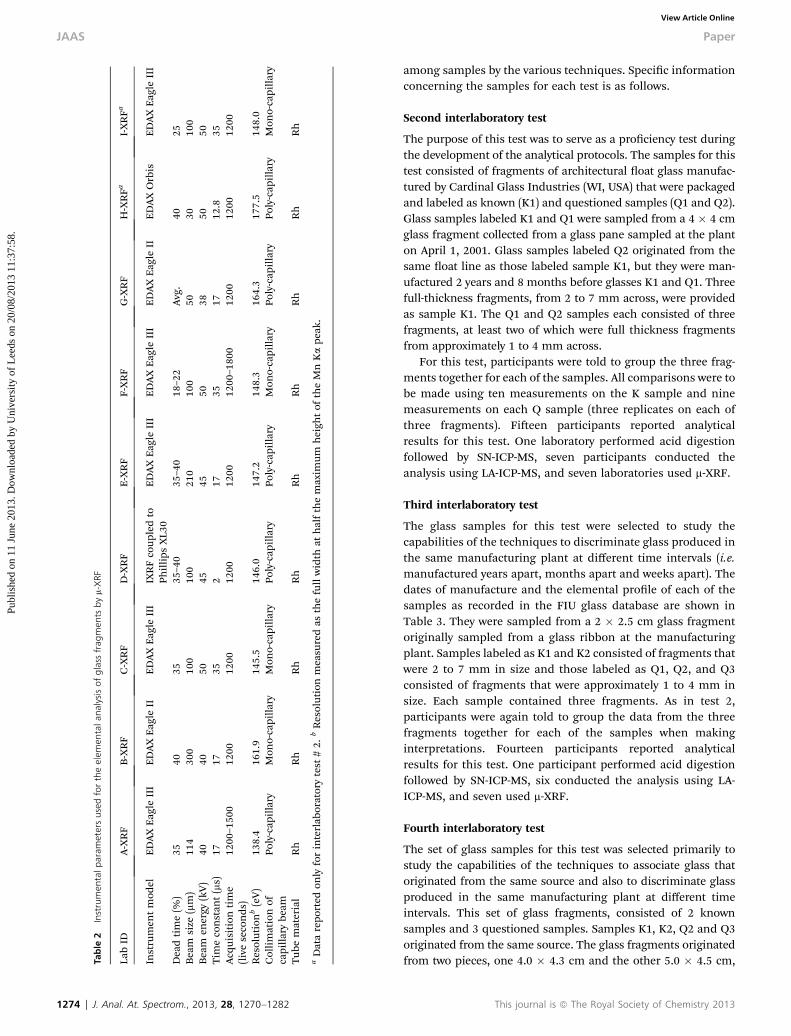
Several different instruments were used for the interlaboratorytests. The m-XRF, SN-ICP-MS, LA-ICP-MS and LA-ICP-OESinstruments and analytical parameters used in this study are
1272 | J. Anal. At. Spectrom., 2013, 28, 1270–1282
reported in Tables 1 and 2. Typical intensity ratios reported bym-XRF users included Ca/Mg, Ti/Ca, Ca/Fe, Sr/Zr, Ca/K, andseveral other minor elements, when detectable. Participantsusing ICP-based methods reported between 10 and 18 elementconcentrations from the following list: Li, Mg, Al, K, Ca, Fe, Ti,Mn, Rb, Sr, Zr, Sn, Ba, La, Ce, Nd, Hf, and Pb.
Standards and glass samples
The standard reference materials SRM NIST 612 and SRM NIST1831 (National Institute of Standards and Technology, Gai-thersburg, MD, USA) were provided to each participant for theinterlaboratory tests. The SRM NIST 1831 standard wasprovided as full thickness fragments of 5 to 12 mm across to beused for evaluation of the analytical performance of eachlaboratory and also to normalize the m-XRF data across partic-ipants. Thematrix-matched oat glass standards FGS 1 and FGS2 (Bundeskriminalamt, Wiesbaden, Germany) were included ininterlaboratory test 2.
Glass test samples were submitted as mock casework items.Those samples were selected from a collection of glass samplesfrom different sources collected and analyzed by Florida Inter-national University researchers between 1998 and 2010.Samples with similar refractive indices but distinctiveelemental compositions were selected for these exercises. Thesamples were carefully broken and grouped by size to insurethat all participants had a series of fragments of similar size andshape. Each sample was prepared in a separate clean area toavoid potential cross contamination. Typically, one of theoriginal at surfaces of glass manufactured by the oat processis enriched in tin as a result of the direct contact with tin baths.1
This can also produce depletion of other elements near the oatsurface. For this reason, the participants were instructed toorient the glass fragments avoiding a oat original glass surfaceto prevent false exclusions derived from sampling strategiesrather than signicant differences in the bulk composition ofthe glass.1
The project consisted of four interlaboratory tests conductedby the EAWG members. The rst and second tests weredesigned to develop and characterize the m-XRF and LA-ICP-MSanalytical protocols. The results of these tests are detailed in aseparate paper.26 The second, third, and fourth tests containedsample fragments that each participant analyzed and comparedto determine which ones could be distinguished as having comefrom different sources. In every case, participants made threemeasurements on each of three fragments provided for eachsample. The participants were not told of the sources of thesamples for these blind tests. Each participant was instructed toconduct elemental analysis in order to compare each of thequestioned items with the know item to determine if any of thequestioned items could have originated from the same brokensource as the known standard. Previous analytical resultsobtained at FIU for the samples included in these tests areshown in Table 3. Due to space limitations, the data in Table 3are shown without analytical uncertainties. The information isgiven to show the general differences between the samples andshow which elements are most likely to be distinguishable
This journal is ª The Royal Society of Chemistry 2013
Table
1Instrumen
talp
aram
etersusedfortheelem
entala
nalysisofglass
frag
men
tsbyeither
LA-ICP-MSorICP-MS
LabID
A-ICPa
B-ICP
C-ICP
D-ICP
E-ICPa
F-ICP
G-ICP
H-ICP
I-ICPb
J-ICPc
K-ICPc
L-ICPc
Method
LA-ICP-MS
LA-ICP-MS
LA-ICP-MS
LA-ICP-MS
LA-ICP-MS
Digestion
-SN
-ICP-MS
LA-ICP-MS
LA-ICP-MS
LA-ICP-MS
LA-ICP-OES
LA-ICP-MS
LA-ICP-MS
ICPM
Sinstrumen
tPe
rkin
Elm
erElanDRCII
Perkin
Elm
erElanDRCII
ThermoX
series
IIPe
rkin
Elm
erElanDRCII
Thermo
Elemen
t2
Agilent
Technolog
ies
7500
Agilent
Technolog
ies
3500
Agilent
Technolog
ies
7500
Perkin
Elm
er-
ElanDRCII
Perkin
Elm
erOptim
a73
00DV
Perkin
Elm
erElanDRCII
Thermo
Elemen
t2
XR
RFpo
wer
(W)
1325
1500
1450
1500
1250
1600
1350
1390
1300
1500
1400
1260
Arga
sow
(Lmin
�1 )
1.0
1.0
1.0
0.90
1.0
0.50
0.9
0.9
0.95
0.7
0.9
0.8
Laser
ablation
instrumen
t
New
Wave
UP2
13New
Wave
UP2
13New
Wave
UP2
13New
Wave
UP2
13New
Wave
UP2
13SS
n.a.
New
Wave
UP2
13New
Wave
UP2
13CETAC
LSX50
0New
Wave
UP2
13CETAC
LSX50
0New
Wave
UP-19
3fx
Carrier
gas
(Lmin
�1 )
He,
0.75
He,
1.0
He,
1.0
He,
0.90
He,
0.7
n.a.
He,
0.70
He,
0.93
He,
0.95
He,
0.6
He,
0.92
He,
0.41
5
Wavelen
gth
(nm)
213
213
213
213
213
n.a.
213
213
266
213
266
193
Spot
size
(mm)
8060
5555
50n.a.
6055
5010
050
50
Flue
nce
(Jcm
�2)
817
.519
309.5
n.a.
2212
nr
253.5
6.1
Carrier
gas
tube
length
(m)
1.0
0.91
1.8
1.2
1.0
n.a.
1.2
1.2
0.75
1.2
1.0
1.1
Ablation
cellvolume
(cm
3 )
3380
2525
40n.a.
2525
5025
3350
aDatarepo
rted
only
forinterlab
oratorytest
#3an
d4.
bDatarepo
rted
only
forinterlab
oratorytest
#2.
cDatarepo
rted
only
forinterlab
oratorytest
#4.
This journal is ª The Royal Society of Chemistry 2013 J. Anal. At. Spectrom., 2013, 28, 1270–1282 | 1273
Paper JAAS
Publ
ishe
d on
11
June
201
3. D
ownl
oade
d by
Uni
vers
ity o
f L
eeds
on
20/0
8/20
13 1
1:37
:58.
View Article Online
Table
2Instrumen
talp
aram
etersusedfortheelem
entala
nalysisofglass
frag
men
tsbym-XRF
LabID
A-XRF
B-XRF
C-XRF
D-XRF
E-XRF
F-XRF
G-XRF
H-XRFa
I-XRFa
Instrumen
tmod
elEDAXEag
leIII
EDAXEag
leII
EDAXEag
leIII
IXRFcoup
ledto
Phillips
XL3
0EDAXEag
leIII
EDAXEag
leIII
EDAXEag
leII
EDAXOrbis
EDAXEag
leIII
Deadtime(%
)35
4035
35–40
35–40
18–22
Avg.
4025
Beam
size
(mm)
114
300
100
100
210
100
5030
100
Beam
energy
(kV)
4040
5045
4550
3850
50Tim
econstan
t(ms)
1717
352
1735
1712
.835
Acq
uisition
time
(liveseconds
)12
00–150
012
0012
0012
0012
0012
00–180
012
0012
0012
00
Resolution
b(eV)
138.4
161.9
145.5
146.0
147.2
148.3
164.3
177.5
148.0
Collimationof
capilla
rybe
amPo
ly-cap
illary
Mon
o-capilla
ryMon
o-capilla
ryPo
ly-cap
illary
Poly-cap
illary
Mon
o-capilla
ryPo
ly-cap
illary
Poly-cap
illary
Mon
o-capilla
ry
Tube
material
Rh
Rh
Rh
Rh
Rh
Rh
Rh
Rh
Rh
aDatarepo
rted
only
forinterlab
oratorytest
#2.
bResolution
measu
redas
thefullwidth
athalfthemaxim
umheigh
tof
theMnKape
ak.
1274 | J. Anal. At. Spectrom., 2013, 28, 1270–1282
JAAS Paper
Publ
ishe
d on
11
June
201
3. D
ownl
oade
d by
Uni
vers
ity o
f L
eeds
on
20/0
8/20
13 1
1:37
:58.
View Article Online
among samples by the various techniques. Specic informationconcerning the samples for each test is as follows.
Second interlaboratory test
The purpose of this test was to serve as a prociency test duringthe development of the analytical protocols. The samples for thistest consisted of fragments of architectural oat glass manufac-tured by Cardinal Glass Industries (WI, USA) that were packagedand labeled as known (K1) and questioned samples (Q1 and Q2).Glass samples labeled K1 and Q1 were sampled from a 4 � 4 cmglass fragment collected from a glass pane sampled at the planton April 1, 2001. Glass samples labeled Q2 originated from thesame oat line as those labeled sample K1, but they were man-ufactured 2 years and 8 months before glasses K1 and Q1. Threefull-thickness fragments, from 2 to 7 mm across, were providedas sample K1. The Q1 and Q2 samples each consisted of threefragments, at least two of which were full thickness fragmentsfrom approximately 1 to 4 mm across.
For this test, participants were told to group the three frag-ments together for each of the samples. All comparisons were tobe made using ten measurements on the K sample and ninemeasurements on each Q sample (three replicates on each ofthree fragments). Fieen participants reported analyticalresults for this test. One laboratory performed acid digestionfollowed by SN-ICP-MS, seven participants conducted theanalysis using LA-ICP-MS, and seven laboratories used m-XRF.
Third interlaboratory test
The glass samples for this test were selected to study thecapabilities of the techniques to discriminate glass produced inthe same manufacturing plant at different time intervals (i.e.manufactured years apart, months apart and weeks apart). Thedates of manufacture and the elemental prole of each of thesamples as recorded in the FIU glass database are shown inTable 3. They were sampled from a 2 � 2.5 cm glass fragmentoriginally sampled from a glass ribbon at the manufacturingplant. Samples labeled as K1 and K2 consisted of fragments thatwere 2 to 7 mm in size and those labeled as Q1, Q2, and Q3consisted of fragments that were approximately 1 to 4 mm insize. Each sample contained three fragments. As in test 2,participants were again told to group the data from the threefragments together for each of the samples when makinginterpretations. Fourteen participants reported analyticalresults for this test. One participant performed acid digestionfollowed by SN-ICP-MS, six conducted the analysis using LA-ICP-MS, and seven used m-XRF.
Fourth interlaboratory test
The set of glass samples for this test was selected primarily tostudy the capabilities of the techniques to associate glass thatoriginated from the same source and also to discriminate glassproduced in the same manufacturing plant at different timeintervals. This set of glass fragments, consisted of 2 knownsamples and 3 questioned samples. Samples K1, K2, Q2 and Q3originated from the same source. The glass fragments originatedfrom two pieces, one 4.0 � 4.3 cm and the other 5.0 � 4.5 cm,
This journal is ª The Royal Society of Chemistry 2013
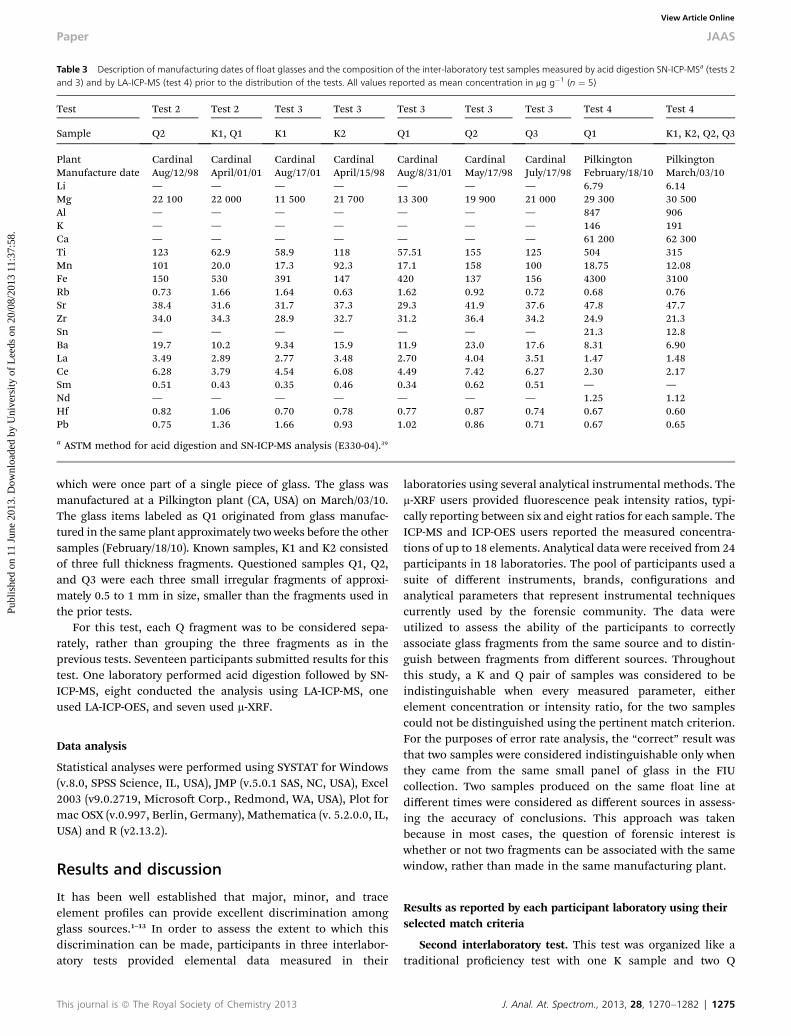
Table 3 Description of manufacturing dates of float glasses and the composition of the inter-laboratory test samples measured by acid digestion SN-ICP-MSa (tests 2and 3) and by LA-ICP-MS (test 4) prior to the distribution of the tests. All values reported as mean concentration in mg g�1 (n ¼ 5)
Test Test 2 Test 2 Test 3 Test 3 Test 3 Test 3 Test 3 Test 4 Test 4
Sample Q2 K1, Q1 K1 K2 Q1 Q2 Q3 Q1 K1, K2, Q2, Q3
Plant Cardinal Cardinal Cardinal Cardinal Cardinal Cardinal Cardinal Pilkington PilkingtonManufacture date Aug/12/98 April/01/01 Aug/17/01 April/15/98 Aug/8/31/01 May/17/98 July/17/98 February/18/10 March/03/10Li — — — — — — — 6.79 6.14Mg 22 100 22 000 11 500 21 700 13 300 19 900 21 000 29 300 30 500Al — — — — — — — 847 906K — — — — — — — 146 191Ca — — — — — — — 61 200 62 300Ti 123 62.9 58.9 118 57.51 155 125 504 315Mn 101 20.0 17.3 92.3 17.1 158 100 18.75 12.08Fe 150 530 391 147 420 137 156 4300 3100Rb 0.73 1.66 1.64 0.63 1.62 0.92 0.72 0.68 0.76Sr 38.4 31.6 31.7 37.3 29.3 41.9 37.6 47.8 47.7Zr 34.0 34.3 28.9 32.7 31.2 36.4 34.2 24.9 21.3Sn — — — — — — — 21.3 12.8Ba 19.7 10.2 9.34 15.9 11.9 23.0 17.6 8.31 6.90La 3.49 2.89 2.77 3.48 2.70 4.04 3.51 1.47 1.48Ce 6.28 3.79 4.54 6.08 4.49 7.42 6.27 2.30 2.17Sm 0.51 0.43 0.35 0.46 0.34 0.62 0.51 — —Nd — — — — — — — 1.25 1.12Hf 0.82 1.06 0.70 0.78 0.77 0.87 0.74 0.67 0.60Pb 0.75 1.36 1.66 0.93 1.02 0.86 0.71 0.67 0.65
a ASTM method for acid digestion and SN-ICP-MS analysis (E330-04).39
Paper JAAS
Publ
ishe
d on
11
June
201
3. D
ownl
oade
d by
Uni
vers
ity o
f L
eeds
on
20/0
8/20
13 1
1:37
:58.
View Article Online
which were once part of a single piece of glass. The glass wasmanufactured at a Pilkington plant (CA, USA) on March/03/10.The glass items labeled as Q1 originated from glass manufac-tured in the same plant approximately two weeks before the othersamples (February/18/10). Known samples, K1 and K2 consistedof three full thickness fragments. Questioned samples Q1, Q2,and Q3 were each three small irregular fragments of approxi-mately 0.5 to 1 mm in size, smaller than the fragments used inthe prior tests.
For this test, each Q fragment was to be considered sepa-rately, rather than grouping the three fragments as in theprevious tests. Seventeen participants submitted results for thistest. One laboratory performed acid digestion followed by SN-ICP-MS, eight conducted the analysis using LA-ICP-MS, oneused LA-ICP-OES, and seven used m-XRF.
Data analysis
Statistical analyses were performed using SYSTAT for Windows(v.8.0, SPSS Science, IL, USA), JMP (v.5.0.1 SAS, NC, USA), Excel2003 (v9.0.2719, Microso Corp., Redmond, WA, USA), Plot formac OSX (v.0.997, Berlin, Germany), Mathematica (v. 5.2.0.0, IL,USA) and R (v2.13.2).
Results and discussion
It has been well established that major, minor, and traceelement proles can provide excellent discrimination amongglass sources.1–13 In order to assess the extent to which thisdiscrimination can be made, participants in three interlabor-atory tests provided elemental data measured in their
This journal is ª The Royal Society of Chemistry 2013
laboratories using several analytical instrumental methods. Them-XRF users provided uorescence peak intensity ratios, typi-cally reporting between six and eight ratios for each sample. TheICP-MS and ICP-OES users reported the measured concentra-tions of up to 18 elements. Analytical data were received from 24participants in 18 laboratories. The pool of participants used asuite of different instruments, brands, congurations andanalytical parameters that represent instrumental techniquescurrently used by the forensic community. The data wereutilized to assess the ability of the participants to correctlyassociate glass fragments from the same source and to distin-guish between fragments from different sources. Throughoutthis study, a K and Q pair of samples was considered to beindistinguishable when every measured parameter, eitherelement concentration or intensity ratio, for the two samplescould not be distinguished using the pertinent match criterion.For the purposes of error rate analysis, the “correct” result wasthat two samples were considered indistinguishable only whenthey came from the same small panel of glass in the FIUcollection. Two samples produced on the same oat line atdifferent times were considered as different sources in assess-ing the accuracy of conclusions. This approach was takenbecause in most cases, the question of forensic interest iswhether or not two fragments can be associated with the samewindow, rather than made in the same manufacturing plant.
Results as reported by each participant laboratory using theirselected match criteria
Second interlaboratory test. This test was organized like atraditional prociency test with one K sample and two Q
J. Anal. At. Spectrom., 2013, 28, 1270–1282 | 1275
JAAS Paper
Publ
ishe
d on
11
June
201
3. D
ownl
oade
d by
Uni
vers
ity o
f L
eeds
on
20/0
8/20
13 1
1:37
:58.
View Article Online
samples. One deciency detected early in these studies was thatthe participants did not have a standardized match criterion toreach their conclusions. However, it is noteworthy that allmethods gave correct results in this rather simple test. Thisresult was anticipated, since, as shown in Table 3, the concen-trations of Ti, Mn, Fe, and Rb are quite different between K1 andQ2. With these results, the protocols for both m-XRF and LA-ICP-MS were considered robust and further, more difficult testswere designed to evaluate the performance of different matchcriteria and to work towards standardization of statistical datatreatment.
Third interlaboratory test. The purpose of this study was toevaluate the capabilities of each method to discriminatesamples manufactured at the same plant at different timeintervals (weeks, months and years apart from each other).
There were three pairs of samples that were produced overthree years apart; K1/Q2, K1/Q3, and K2/Q1. Based on theresults of pre-distribution analysis shown in Table 3, thesesample pairs have differences in elemental compositions thatwere expected to be recognized using sensitive analyticalmethods.
All fourteen respondents correctly reported that items K2and Q1, and items K1 and Q2, manufactured more than 3 yearsapart were distinguishable. Thirteen of the fourteen respon-dents correctly reported that items K1 and Q3, samples thatwere manufactured 3 years and 1 month apart were distin-guishable. The participant that used SN-ICP-MS reported aninconclusive result due to some uncontrolled problems duringthe digestion of sample Q3. Thus, each of the participants thatcompleted the analysis was able to correctly discriminatebetween samples that were manufactured approximately 3 yearsapart in the same manufacturing plant, despite their indistin-guishable refractive indices and physical properties.
The match criteria that were used by the participatingforensic glass examiners included spectral overlay, range over-lap, several different forms of condence intervals, the t-test,and ANOVA. These criteria were used in various forms eitherindividually or in combinations.
Test 3 also contained three pairs of samples that wereproduced several weeks to months apart; K1/Q1, K2/Q2, andK2/Q3. The results of pre-distribution analysis shown in Table 3indicate that these sample pairs have very similar elementalcompositions with relatively small differences in the concen-trations of some elements. It was expected that these differ-ences could only be detected by those techniques that have goodprecision of the measurements and low limits of detection.
Only four of the fourteen respondents reported signicantdifferences between items manufactured in the same plant 2weeks apart (K1 vs. Q1). These four respondents used LA-ICP-MS methods to arrive at that conclusion. The discriminatingelements reported by the few laboratories that found signicantdifferences between K1 and Q1 were Ba (by three of the fourlaboratories using LA-ICP-MS) andMn, K, Zr, Fe, Sr, Sn or Rb. Ofthe latter, the only other element that was common to two of thelaboratories was Zr. Table 3 shows that these elements werepresent in those samples at concentrations ranging from <2 to30 mg g�1 and therefore only sensitive methods with excellent
1276 | J. Anal. At. Spectrom., 2013, 28, 1270–1282
precision between measurements would be able to detect thosedifferences in concentration. For example, the reported Baconcentration difference between the two samples is approxi-mately 2.5 mg g�1. Iron, the trace element having the largestdifference in concentration, was reported as signicantlydifferent in the two samples by only one of the LA-ICP-MSlaboratories. This result is consistent with the fact that not onlythe differences in mean element concentrations, but also thevariations of the measured data within a sample, are importantin dening the ability of a method to distinguish two differentsources of glass.
Thirteen of the fourteen respondents reported that item K2was distinguishable from item Q2. The only respondent thatcould not distinguish between item K2 and item Q2 used m-XRF.However, aer discussion of the results, this respondent re-examined their data and found signicant differences in theFe/Mn peak intensity ratios that were missed during the test.These samples were manufactured at the same plant 1 monthapart and their elemental compositions are similar, but signif-icant differences were detected for some elements, in particularMn and Ti for m-XRF measurements and between 6 and 12elements for the ICP measurements.
Five of the fourteen respondents reported that item K2 wasdistinguishable from item Q3. None of the seven m-XRF userswere able to differentiate these two samples. The participantsthat were able to detect differences between these samples usedLA-ICP-MS techniques. Two of the ICP-MS users did notdifferentiate this pair. Lab ICP-A was unable to differentiate thesamples probably as a consequence of their smaller number ofelements measured, and their match criteria that allows oneelement to differ and still call the results indistinguishable. LabICP-F, who used SN-ICP-MS, reported an inconclusive result dueto problems with the digestion of sample Q3. Samples K2 andQ3 were manufactured at the same plant 3 months apart.However, the elemental compositions of K2 and Q3 are moresimilar than those of K2 and Q2, which were manufactured onlyone month apart. The concentrations of discriminatingelements were present at levels below 30 mg g�1 in the glass.
This third interlaboratory test allowed the study of the abilityof the different analytical methods to discriminate amongsamples that shared very similar composition. All techniqueswere able to differentiate samples manufactured three yearsapart in the same plant, regardless of the match criteriaemployed by each respondent. Samples manufactured weeks tomonths apart could only be differentiated in some instances bythe more sensitive analytical techniques.
Fourth interlaboratory test. The EAWGmembers felt that theresults of the third interlaboratory test were encouraging,particularly in the excellent ability of the ICP-MS methods todiscriminate glass sources produced over fairly short timeperiods. However, the high degree of source discriminationcould lead to the incorrect source exclusion of glass fragmentsthat came from the same source. To address this, a fourthinterlaboratory test was designed and carried out. The set ofsamples for this test was selected primarily with the aim ofstudying type 1 errors, although one sample was also includedto evaluate type 2 errors on samples produced in the same
This journal is ª The Royal Society of Chemistry 2013
Paper JAAS
Publ
ishe
d on
11
June
201
3. D
ownl
oade
d by
Uni
vers
ity o
f L
eeds
on
20/0
8/20
13 1
1:37
:58.
View Article Online
manufacturing plant at different times. There were seventeenparticipants in this test, including one who used an additionaltechnique, LA-ICP-OES.
Samples K1, K2, Q2 and Q3 all originated from glass man-ufactured at the Pilkington plant on March/03/2010. Sample Q1was manufactured at the same plant two weeks later (February/18/2010). As shown in Table 3, the pre-distribution analysisindicated that the composition of Q1 is signicantly differentfrom that of the other samples. To simulate typical casework,known samples K1 and K2 consisted of three small full thick-ness fragments, while questioned samples were each threesmall irregular fragments of approximately 0.5-1 mm in size.The participants were instructed to make a comparison andreach an opinion concerning possible source for each Q frag-ment separately, rather than grouping them as was done in theprior tests. The participant (ICP-F) who used SN-ICP-MS wasunable to analyze the small Q fragments individually due to thesample size requirements in the ASTM method, and thuscombined the three fragments for digestion and analysis.
Sixteen of seventeen respondents correctly reported that all ofthe Q1 fragments were distinguishable from items K1 and K2.Although these samples were manufactured only 2 weeks aparton the same oat line, signicant differences exist in composi-tion for Fe, Al and Ti and several trace elements that were readilydetected by all participant methods. One of the ICP participants,designated as ICP-L, does not conduct glass comparisons on aroutine basis at their laboratory and therefore only reported theirmeasured concentration data and did not make a decision ofassociation or exclusion. Their data were only utilized forcomparison of match criteria in the next part of this study.
All of the K1, K2, Q2, and Q3 fragments came from the samepieces of a single glass sheet, so they should have been associ-ated by the participants. Using their selected match criteria, allseven respondents that used m-XRF correctly reported that eachfragment labeled as item Q2 or Q3 were indistinguishable fromboth K1 and K2. Therefore, all participants who used m-XRFwere correct in both their distinguishable and indistinguish-able conclusions in this fourth interlaboratory test. It is note-worthy that by the completion of this fourth interlaboratory testmost m-XRF participants agreed on the selection of matchcriteria for their comparisons, based on previous results anddiscussion from the interlaboratory tests. All participants usedspectral overlay as a preliminary assessment of similarity fol-lowed by a �3s criterion for comparison of intensity ratios withthe exception of one laboratory that used range overlap.
On the other hand, of the 88 reported comparisons for thesefour samples made by the ten participants using ICP-basedmethods, there were 16 incorrect discriminations of fragmentpairs. Labs A, E, H, and K correctly found each of the Q2 and Q3fragments to be indistinguishable from both K1 and K2. Lab Chad only one incorrect result for a K1/Q3 comparison. Lab F, theone that used SN-ICP-MS had one incorrect result, but it was outof only four comparisons because the limited fragment sizeforced grouping of the fragments for each sample for digestion.The majority of incorrect exclusions were made by Lab D withsix and Lab J with eight. These two participants used the t-testwith Bonferroni correction for their match criterion.
This journal is ª The Royal Society of Chemistry 2013
These false exclusion results raised a ag for furtherdiscussion by the EAWG members concerning the appropriatematch criteria for ICP-based methods. Past experience of ICP-MS and ICP-OES users was that false exclusions rarely occurwhen an appropriate number of elements are used withreasonable match criteria. The observed rate of false exclusions,particularly for Labs D and J were unexpectedly high. It was feltthat this high false exclusion rate was a result of participantsusing match criteria that were too narrow when considering therelatively large number of elements measured. Therefore,further data analysis was conducted to assess the error rates fora number of match criteria with the aim of nding an optimummatch criterion that would simultaneously minimize both type1 and type 2 errors. The results of these studies are discussed inthe following section.
Evaluation of performance of different match criteria
In order to evaluate how the choice of match criterion affectserror rates, the data provided by each participant were used toassess the error rates for the following criteria for the m-XRFmethods: range overlap, t-tests (p ¼ 0.05, 0.01 and Bonferronicorrection to 0.05), condence intervals (�2s, 3s, 4s), HotellingT2, and for the ICP-based methods: these plus modied con-dence intervals (�2s, 3s, 4s, 5s, 6s with minimum 3% RSD). Thecalculations of error rates were performed for data collected forthe second, third and fourth interlaboratory tests. The datafrom each of the individual Q fragments were used whenmaking the comparison to the known sample for the purpose ofthis error rate analysis. Therefore, each K/Q comparison wasmade between nine or more measurements from the K sampleand three measurements from the Q sample. The result of acomparison was declared as indistinguishable when the valuesfor all measured variables met the match criterion, otherwisethe samples were deemed to be distinguishable.
The second test had one K/Q pair that originated from thesame source (K1 vs. Q1), which allowed the evaluation of falseexclusions, or type 1 errors and one pair of samples that origi-nated from different sources (K1 vs. Q2), which allowed theevaluation of false inclusions or type 2 errors. The third test hadve glass items, 2 known samples and 3 questioned samples, allof them originating from the same plant manufactured ondifferent dates. Because this test did not have pairs of samplesthat originated from the same source, it did not have thepossibility for type 1 errors. There were six sample paircomparisons that could result in false associations, or type 2errors; (K1/Q1, K1/Q2, K1/Q3, K2/Q1, K2/Q2, and K2/Q3). Thefourth test had ve glass items, two known and 3 questionedsamples. Two K/Q comparison pairs allowed the evaluation oftype 2 errors (K1/Q1 and K2/Q1) and 4 K/Q sample pairs (K1/Q2,K1/Q3, K2/Q2, and K2/Q3) were used to evaluate the rate of type1 errors. For each sample pair, the number of errors wasdetermined three times for the individual fragments of each Qsample and summed across all participants reporting results forthat sample pair. All reported sample pairs were used tocalculate the number of incorrect associations using each of thetested match criteria.
J. Anal. At. Spectrom., 2013, 28, 1270–1282 | 1277

JAAS Paper
Publ
ishe
d on
11
June
201
3. D
ownl
oade
d by
Uni
vers
ity o
f L
eeds
on
20/0
8/20
13 1
1:37
:58.
View Article Online
Error rates for m-XRF data
The summary results of error rate analyses obtained using m-XRF data for different match criteria expressed as the percent-ages of incorrect associations or exclusions are shown inTable 4. The number of comparisons used to calculate eachpercentage is given in the footnote to the table. False inclusions,or type 2 errors, were determined for the data from all threeinterlaboratory tests. The rate of false inclusions on this test wasvery low regardless of the match criteria employed for m-XRFdata. For the 68 sample pair comparisons made for the secondand fourth interlaboratory tests, only one pair resulted in a type2 error. This error only occurred for the t-test at p ¼ 0.01, thet-test with Bonferroni correction, and the 4s test for the secondtest. The sample pairs used for the evaluation of type 2 errorrates on the second and fourth interlaboratory tests weremanufactured in the same plant more than 2 years apart and 2weeks apart, respectively. Their elemental composition wasfairly distinctive and signicant differences were detectableusing m-XRF methods.
As expected, the type 2 error rates on the third interlabor-atory test are larger than for the other tests because the samplesfor this test were manufactured on the same oat line and, insome cases, at relatively short date intervals. As a result, thesesamples have only minor differences in elemental composition.The t-test at the 0.05 and 0.01 levels resulted in the lowestnumbers of type 2 errors in this set, 6% and 15%, respectively.
Type 1 error rates (false exclusions) were determined for thesecond and fourth tests. At least one false exclusion wasobserved for all of the match criteria except for 4s in the fourthtest. The number of type 1 errors when using the narrowermatch criteria of the t-tests and the 2s test are generally quitehigh. The range, 3s, 4s, and Hotelling's T2 tests, with their widermatch criteria, result in more acceptable type 1 error rates.The high number of type 1 errors is somewhat surprisingconsidering that m-XRF measurements have repeatability valuesof approximately 10% for elements present at lower
Table 4 Error rate results for the application of different match criteria on dataacquired by XRF methods
Match criteria
Type 1 error rate (%) Type 2 error rate (%)
Test 2a Test 3b Test 4c Test 2d Test 3e Test 4 f
Range 11 — 19 0 21 0t-Test .05 52 — 60 0 6 0t-Test .01 22 — 30 4 15 0t-Test Bonf. 15 — 26 4 21 0�2s 41 — 24 0 18 0�3s 11 — 6 0 27 0�4s 7 — 0 4 36 0Hotellings T 2 15 — 9.5 0 26 0
a Percent rate calculated out of 27 comparisons from 9 laboratories.b Design of the round robin 3 did not account for estimation of type 1errors. c Percent rate calculated out of 84 comparisons from 7laboratories. d Percent rate calculated out of 26 comparisons from 9laboratories. e Percent rate calculated out of 124 comparisons from 7laboratories. f Percent rate calculated out of 42 comparisons from7 laboratories.
1278 | J. Anal. At. Spectrom., 2013, 28, 1270–1282
concentrations, such as Ti, Sr, and Zr. A likely reason as to whyall pairs of samples from the same source are not correctlyassociated is that the irregular shapes and small sizes of the Qfragments result in poorer precision or biases in measuredintensities when compared to the data from the larger, multipleK fragments. As can be seen in Table 4, the tests estimatingpopulation distributions (2s, 3s, and 4s) tend to be moreforgiving of these impairments than tests that rely more on arepresentative sampling of both items (range overlap andT-tests). It is also signicant that the conclusions reported byindividual participants in the interlaboratory tests were allcorrect. There are several possible reasons for the betterperformance by the participants than that indicated by thevarious match criteria. First, the participants used spectraloverlay as a pretest prior to comparison of analytical data. As aresult, they may have removed some elements that were presentat close to limits of quantitation from further quantitativecomparison. Some of the false exclusion errors seen here resultfrom comparisons of ratios involving these barely detectableelements which are more prone to sample size and orientationerrors than elements present at higher concentrations.40 Thesecond reason for the lower number of type 1 error rates forindividual participant is that they grouped the data for Q frag-ments in Test 2, which improved the error rates compared withtreating fragments individually.
For a compromise between type 1 and type 2 error rates, theoptimum match criteria were 3s, range overlap, and HotellingsT 2. As shown in Table 4, 3s and Hotellings T 2 criteria hadhigher rates of false inclusions than range overlap for the datafrom the third test, which employed samples having verysimilar elemental compositions. However, the range overlapcriterion had a signicantly greater false exclusion rate than the3s or Hotellings T 2 criteria for the small irregular shaped frag-ments encountered in the fourth test. One advantage of m-XRFdata is that the typical number of variables (6–8 ratios) allowsthe fulllment of the requirement of Hotellings T 2 to have morereplicate measurements than variables (i.e., at least 5 to 7replicate measurements for the known sample and at least 3 foreach questioned sample). However, in instances with small Qfragments such as debris cases, it may not be practical, or evenpossible, to collect the required number of replicate measure-ments on each fragment unless the position of the X-ray beamremains stationary between measurements. Spectral overlaywas not included in the tested match criteria because it is aqualitative comparison. However, based on the experience ofEAWG members and the results reported by the participants inthe interlaboratory tests, spectral overlay is one of the bestmatch criteria. A protocol for m-XRF that was recently approvedby ASTM as a standard test method recommends the use ofspectral overlay followed by either a 3s or range overlap matchcriterion using element intensity ratios. Although the results ofthis study cannot be applied directly to other manufacturers oreven other dates for the oat lines studied, they should begenerally applicable. That is, the m-XRF methods are capable ofdetecting differences in composition of at glass from the sameline within a oat glass plant when they are produced over timeperiods of weeks to months apart.
This journal is ª The Royal Society of Chemistry 2013
Paper JAAS
Publ
ishe
d on
11
June
201
3. D
ownl
oade
d by
Uni
vers
ity o
f L
eeds
on
20/0
8/20
13 1
1:37
:58.
View Article Online
Error rates for ICP data
The summary of error rates obtained for ICP data for differentmatch criteria are shown in Table 5. Because of the goodprecision of most ICP data, additional broader match criteriawere included in this study (5s, 6s and modied condenceintervals with minimum of 3% RSD).26 False inclusions or type 2errors were estimated for the three tests. The only type 2 errorthat was made for the samples of the second and fourth inter-laboratory tests was from the t-test with Bonferroni correctionfor one fragment from one participant in the second test. Thesamples used for the evaluation of type 2 error rates on thesesets were manufactured in the same plant more than 2 yearsapart or 2 weeks apart, respectively. However, differences intheir elemental composition as measured by ICP methods aredetectable by any of the match criteria.
The type 2 error rate in the third interlaboratory test wasexpected to be larger than the other tests because the sampleswere purposely selected to be closer in manufacture date andalso very similar in elemental compositions. In spite of this, thefalse inclusion rate was very low. All the K/Q pairs that showedfalse inclusions came from the pair of samples manufacturedonly 2 weeks apart, demonstrating that the sensitivity andprecision of ICP data allows for the discrimination of samplesmanufactured at the same plant during short time intervals.Condence intervals greater than 5s provided the largestnumber of type 2 errors in this set.
Type 1 error rates, or false exclusions, were determined forthe second and fourth tests. Some false exclusions wereobserved for the majority of the match criteria, with lower ratesprovided by broader match criteria (>4s). Failure to associatesamples with the same origin was observed in the second test
Table 5 Error rate results for the application of different match criteria on dataacquired by ICP methods
Match criteria
Type 1 error rate (%) Type 2 error rate (%)
Test 2a Test 3b Test 4c Test 2d Test 3e Test 4 f
Range 42 — 81 0 0 0t-Test .05 74 — 93 0 1 0t-Test .01 53 — 84 0 1 0t-Test Bonf. 53 — 69 0 2 0�2s 53 — 85 0 0 0�2s (s > 3%) 26 — 75 0 0 0�3s 42 — 66 0 2 0�3s (s > 3%) 0 — 47 0 2 0�4s 26 — 42 0 5 0�4s (s > 3%) 0 — 28 0 5 0�5s 11 — 30 0 9 0�5s (s > 3%) 0 — 18 0 11 0�6s 11 — 27 0 12 0�6s (s > 3%) 0 — 13 0 15 0
a Percent rate calculated out of 19 comparisons from 7 laboratories.b Design of the round robin 3 did not account for estimation of type Ierrors. c Percent rate calculated out of 120 comparisons from 10laboratories. d Percent rate calculated out of 19 comparisons from 7laboratories. e Percent rate calculated out of 126 comparisons from7 laboratories. f Percent rate calculated out of 60 comparisons from 10laboratories.
This journal is ª The Royal Society of Chemistry 2013
only for 2 out of 7 participant laboratories and in all cases thedifferences were found only for one out of the 16–18 elementsmonitored. Repeatability between measurements in thediscriminating element was lower than 2% RSD. The largernumber of type 1 errors on the fourth test is attributedmainly tothe atypical heterogeneity discovered in the samples, which isdiscussed in more detail in the following section.
The best performance for a compromise between type 1 andtype 2 error rates is found for 4s and modied 4s interval. Usingthese broader match criteria reduced signicantly the Type 1errors without sacricing the capability to discriminate samples(type 2 errors). Hotellings T 2 is not as practical for ICP data as forthe m-XRF data due to the larger number of variables measured(16–18 elements). However, Hotellings T 2 could be applied incases where the questioned sample is large enough to allow therequisite number of replicate measurements. Since that was notthe case in these studies, no statement can bemade as to the errorrates that might result when using Hotelling's T 2 with ICP data.
The need to widen the match criteria for ICP measurements isa consequence of the high precision of the measurements (typi-cally less than 2% RSD). Using the broader criteria, the ICPmethods were still able to correctly discriminate between sampleswith similar elemental proles that originated from the sameplant and were manufactured more than 2 weeks apart. It shouldbe noted here that the signicant factor affecting changes incomposition of oat glass is not time, per se, but rather changes inthe compositions of raw materials and internal processes withinthemanufacturing plant that occur over time. Again, the results ofthis study cannot be applied directly to other manufacturers oreven other dates for the oat lines studied. However, they shouldbe generally applicable in that the ICP-based methods, whenapplied to many major, minor, and trace elements, are capable ofdetecting differences in composition of at glass originating fromone plant over time periods of weeks to months.
Homogeneity study: Pilkington and Cardinal plants
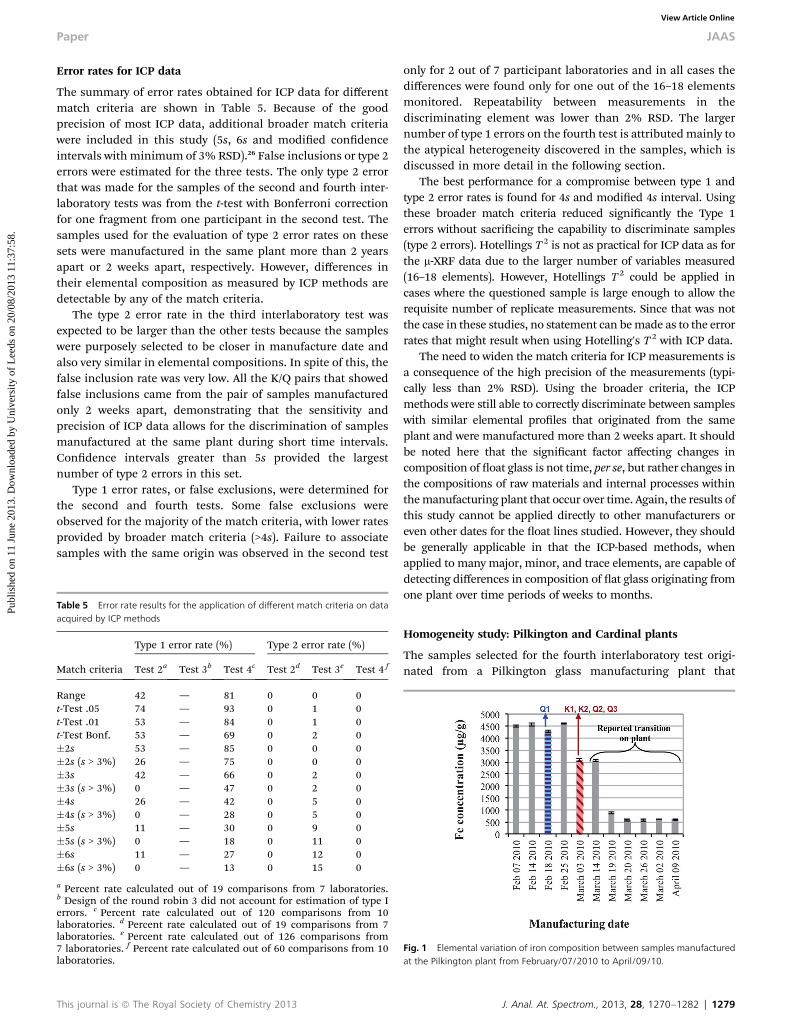
The samples selected for the fourth interlaboratory test origi-nated from a Pilkington glass manufacturing plant that
Fig. 1 Elemental variation of iron composition between samples manufacturedat the Pilkington plant from February/07/2010 to April/09/10.
J. Anal. At. Spectrom., 2013, 28, 1270–1282 | 1279
JAAS Paper
Publ
ishe
d on
11
June
201
3. D
ownl
oade
d by
Uni
vers
ity o
f L
eeds
on
20/0
8/20
13 1
1:37
:58.
View Article Online
experienced changes in the formulation of the glass due tomarket requirements. Fig. 1 shows the variation of concentra-tion of iron in glass samples collected over a 2-month period.Error bars represent the variation (as standard deviation)obtained from 5 replicates of a single sample measured by LA-ICP-MS. Drastic concentration changes in iron content wereobserved in glass manufactured between February 25, 2010 andMarch 19, 2010. Nevertheless, the plant reported that their“transition period”, where the glass was not released to themarket, was between March 14, 2010 and April 09, 2010.
Samples selected for the interlaboratory test were manufac-tured approximately two weeks and one month before thetransition period, respectively. Due to the unexpectedly highrates of false exclusions found in the fourth interlaboratory testby ICP-based methods, it was suspected that one cause for theoccurrence of this type of error could be an atypical heteroge-neity at the micro-scale of the samples submitted for analysis.
To test this hypothesis, homogeneity studies were conductedon the original source samples from the Pilkington plant. Inaddition, a set of glass samples from another plant wasincluded for comparison purposes. The Cardinal sample man-ufactured on August 17, 2001, which was used as K1 for thethird interlaboratory test, was selected for this study because inthat interlaboratory test none of the participants reported falseexclusion errors in their ndings.
The homogeneity study was designed to compare the varia-tion: (a) between fragments from the same source (i.e. 6 frag-ments from the same source, 3 replicates each) and (b) withinfragments (spatial variation, i.e. oat side. non-oat side, anddifferent areas through a cross-section of the glass).
Variation between fragments from the same source (non-oatsides only)
Six fragments were randomly selected from each sample, 3replicates were conducted on each of the non-oat originalsurfaces of the fragments for a total of 18 measurements persample.
Comparisons between the six fragments versus each otherwere conducted using ANOVA with Tukeys post-hoc test. Theresults showmore heterogeneity in samples from the Pilkingtonplant than in the samples from the Cardinal plant. Signicantdifferences for 7 out of 18 elements monitored (Mn, Al, K, Ca,Ti, Fe and Sr) were observed between fragments from the Pil-kington glass manufactured on February 18, 2010 and for 3 outof the 18 elements monitored (Al, Ca and Hf) for the Pilkingtonsample manufactured on March 3, 2010. In contrast, nosignicant differences were observed between any of the frag-ments sampled from the Cardinal glass using the samecriterion.
In order to simulate the statistical treatment given to thedata during the fourth interlaboratory test, the comparisonbetween fragments was also conducted by randomly choosing 3of the fragments to act as the Known sample (K) and theremaining fragments as independent Questioned samples (Q),with 3 measurement replicates each. Only non-oat surfaceswere analyzed during this experiment.
1280 | J. Anal. At. Spectrom., 2013, 28, 1270–1282
In general, the Cardinal glass sample showed evidence ofuniform distribution of elemental composition among non-oat surfaces. No signicant differences were detected betweenfragments using different match criteria (except t-test p ¼ 0.05).On the other hand, the Pilkington samples showed moreheterogeneity, as evidenced by more false exclusions than theCardinal sample. The false exclusions were reduced to zero forthe three Pilkington subsets when applying broader matchcriteria, such as �4s and modied �4s (minimum 3–5% RSD).
Variation between original surfaces and across the thicknessof the fragment
The sampling scheme used to study spatial variation within asingle fragment include ve replicate analyses that were con-ducted on each of the sampling sites (original surfaces such asoat versus non-oat side, and fracture surfaces as differentareas across the thickness of the fragment).
Signicant differences in composition were found betweenoat and non-oat surfaces on all tested samples (Cardinal andPilkington) using all match criteria. Differences between thesurfaces were detected not only for the content of Sn, but alsofor other elements, such as Al, Ca, Sr, Zr, Ti and Fe.
These observations highlight the relevance of sampling.Whenever possible, sampling from fracture surfaces ispreferred over original surfaces. Otherwise, if analyzing originalsurfaces, either all non-oat surfaces or all oat surfaces shouldbe used for the comparisons of known and questioned sources.An easy way to detect if the analysis is being done on the oatside is to monitor the content of Sn, which will typically be 1–2orders of magnitude larger on the oat side of the glass. Thisobservation can be done in situ during the analysis and thesample can be easily turned to the non-oat side if needed.
The study of elemental variability across the thickness of theinterior portion of glass fragments also revealed more hetero-geneity in the Pilkington samples. Signicant differences weredetected, depending on the match criteria, particularly close tothe non-oat surface (<200 mm). This variability was detectedregardless of the match criteria applied to sample PK030310,which was manufactured close to the time of the reportedtransition in Fe formulation. This sample was the one selectedfor the fourth interlaboratory test to examine false exclusionerrors.
Signicant differences across the thickness of the samplewere also detected for the Cardinal sample, depending on thematch criteria. Nevertheless, no signicant differences weredetected using �4s or modied �4s match criteria.
The heterogeneity between fragments was more pronouncedfor the Pilkington samples than for the Cardinal samples. Dueto the shape and small fragment size chosen for the Q sampleson the fourth interlaboratory test, it is likely that participantsreceived, Q samples from different areas across the thickness ofthe fragment and encountered heterogeneous compositions.This could have contributed to the elevated number of falseexclusions obtained with sensitive ICP-based methods.
Consequently, based on post distribution experiments andvarious statistical evaluations of the data, the rate of false
This journal is ª The Royal Society of Chemistry 2013
Paper JAAS
Publ
ishe
d on
11
June
201
3. D
ownl
oade
d by
Uni
vers
ity o
f L
eeds
on
20/0
8/20
13 1
1:37
:58.
View Article Online
exclusions found in the fourth test for ICP-based methods isattributable to several factors: (a) the limited number of repli-cates for questioned samples, a common casework concern, (b)unusual heterogeneity of the samples of Pilkington glass, and(c) match criteria too sensitive for methods achieving very highprecision between replicates.
In the fourth interlaboratory test, participants were asked tocompare the known fragments to each of the individual ques-tioned fragments (instead of grouping all questioned frag-ments). This approach was selected to be a more realisticsimulation of a case where small, irregular fragments recoveredfrom surface debris must be treated as individual fragments.Due to the small size of the fragments submitted for analysis,only 3 replicates were requested per questioned fragment. As aresult, for the sensitive ICP-based methods that have highprecision, only some of the fragments were correctly identiedas indistinguishable from the known sources. The precisionand sensitivity of m-XRF techniques, in combination with theselected match criteria, were shown to be appropriate for thesetypes of samples.
The heterogeneity observed on the Pilkington samples, bothwithin a fragment and between fragments originating from asingle source is atypical of what has been observed in the oatglass encountered in several manufacturing plant studiesanalyzed by SN-ICP-MS and LA-ICPMS at FIU over the lastdecade. Heterogeneity of these samples is also inconsistent withprevious within-sheet homogeneity studies conducted at FIU,the BKA, and the FBI. Nevertheless, as with any commercialproduct, the variability of its elemental composition is depen-dent on market requirements and the manufacturing history ofthe specic plant. For these reasons, samples such as thoseencountered in this fourth interlaboratory test may be presentin a real case and should be taken into account during theselection of match criteria and interpretation of the data.
Conclusions
The interlaboratory test results can be used as a guide forforensic scientists in the selection of the match criteria forcomparison of elemental composition of glass fragments. Theanalytical technique used to analyze both known and ques-tioned samples as well as the number of replicates used tocharacterize the variability of the known samples should beconsidered when selecting the match criteria.
For m-XRF analysis, the following observations are derivedfrom the studies. Spectral overlay, �3s, range overlap, andHotellings T 2 performed well in terms of both false exclusionsand inclusions. Excellent consistency of reported comparisonresults among participants was achieved for all the interlabor-atory tests, not only for comparison conclusions but also for theelements reported to be responsible for discrimination. Partic-ipants who used m-XRF methods were able to detect signicantdifferences between fragments of glass that were manufacturedin the same plant within short periods of time. That period oftime is dependent on the variability of the formulation of theglass within a plant. For instance, participants who used m-XRFwere able to detect differences in samples manufactured a
This journal is ª The Royal Society of Chemistry 2013
month apart at the Cardinal plant in this study. Differenceswere not detected between samples manufactured at this plant2 weeks apart and 3 months apart when their elementalcompositions were extremely similar. However, all participantswere able to detect signicant differences between samplesmanufactured 2 weeks apart at the Pilkington plant in thisstudy. Users of m-XRF must take into consideration that small,irregularly shaped fragments may result in false exclusionswhen they are compared to larger fragments, particularly whenthey are thin enough that high energy X-rays penetratecompletely through them.
For ICP-based methods (digestion SN-ICP-MS, LA-ICP-MS andLA-ICP-OES), the following conclusions are derived from thestudies. Most participants reported precisions between replicatesof 2% RSD or less. This good analytical precision may be one ofthe factors that contribute to higher false exclusion rates whensensitive match criteria such as the t-test or a low multiple ofstandard deviations are used. Due to the sensitivity of themethod, the capability of multi-elemental analysis of traceelements, the typical high precision, and the concerns forheterogeneity, the use of broader match criteria such as �4s isrecommended, either with or without minimum precision valuesdepending on the reproducibility within replicates. These matchcriteria still allow detection of signicant differences betweensamples manufactured in the same plant over short time inter-vals, even for samples with quite similar elemental proles. Theperformance of these match criteria is in agreement with recentpublished data.33 As with m-XRF methods, the time interval overwhich samples cannot be distinguished depends upon the vari-ability of the formulation of the glass within a plant. For instance,ICP participants were able to detect differences in samples fromthe same oat line at the Cardinal plant manufactured a monthapart and some participants detected differences of samplesmanufactured 2 weeks apart.
In terms of interpretation of elemental comparisons of glass,it can be concluded from the study that glass samples that aremanufactured in different plants, or even at the same plantyears apart, are clearly differentiated by elemental compositionwhen m-XRF or ICP-based methods are used for analysis.Samples produced in the same plant over time intervals ofweeks to months may also be differentiated. This level ofdifferentiation can be used to add signicance to an associa-tion, when one is found, and to assist in assigning recoveredfragments to a source when selecting among several potentialsources.
Acknowledgements
This project was supported by Award no. 2010-DN-BX-K179from the National Institute of Justice, Office of JusticePrograms, U.S. Department of Justice. The opinions, ndings,and conclusions or recommendations expressed in thispresentation are those of the authors and do not necessarilyreect those of the Department of Justice, the Department of theArmy or the Department of Defense. This is publication number12-15 of the FBI Laboratory Division. Names of commercialmanufacturers are provided for identication purposes only,
J. Anal. At. Spectrom., 2013, 28, 1270–1282 | 1281
JAAS Paper
Publ
ishe
d on
11
June
201
3. D
ownl
oade
d by
Uni
vers
ity o
f L
eeds
on
20/0
8/20
13 1
1:37
:58.
View Article Online
and inclusion does not imply endorsement of the manufac-turer, or its products or services by the FBI. The views expressedare those of the authors and do not necessarily reect the offi-cial policy or position of the FBI or the U.S. Government.Thanks to all of the Elemental Analysis Working Groupmembers and their agencies for devoting the time necessary tocomplete this project.
References
1 J. R. Almirall, J. Buckleton, J. M. Curran and T. N. Hicks, inForensic Interpretation of Glass Evidence, ed. J. M. Curran,T. N. Hicks and J. S. Buckleton, CRC Press, Florida, 2000,pp. 1–24.
2 R. D. Koons, C. A. Peters and P. S. Rebbert, J. Anal. At.Spectrom., 1991, 6, 451.
3 T. Hicks, S. F. Monard, T. Goldmann, A. Brunelle,C. Champod and P. Margot, Forensic Sci. Int., 2003, 137, 107.
4 J. Andrasko and A. Machly, J. Forensic Sci., 1978, 22, 250.5 S. Becker, L. Gunaratman, T. Hicks, W. Stoecklein andG. Warman, Probl. Forensic Sci., 2001, 47, 80.
6 D. C. Duckworth, S. J. Morton, K. Bayne, S. Montero,R. D. Koons and J. R. Almirall, J. Anal. At. Spectrom., 2002,17, 662.
7 R. D. Koons, C. Fiedler and C. Rawalt, J. Forensic Sci., 1988,33, 49.
8 S. Montero, A. Hobbs, T. French and J. R. Almirall, J. ForensicSci., 2003, 8, 1101.
9 J. R. Almirall and T. Trejos, Forensic Sci. Review., 2006, 18(2),74.
10 S. Ryland, J. Am. Soc. Trace Ev. Exam., 2011, 2, 2.11 Z. Brozel-Mucha and G. Zadora, Probl. Forensic Sci., 1998, 37,
68.12 P. Kuisma-Kursula, X-Ray Spectrom., 2000, 29, 111; V. Reeve,
J. Mathiesen and W. Fong, J. Forensic Sci., 1976, 21, 291.13 R. J. Dudley, C. R. Howden, T. J. Taylor and K. W. Smalldon,
X-Ray Spectrom., 1980, 9, 119.14 C. R. Howden, R. J. Dudley and K. W. Smalldon, J. Forensic
Sci. Soc., 1978, 18, 99.15 T. Catterick and D. A. Hickman, Forensic Sci. Int., 1981, 17,
253.16 K. L. Wolnik, C. M. Gaston and F. L. Fricke, J. Anal. At.
Spectrom., 1989, 4, 27.17 L. Moenke-Blankenburg, T. Schumann, D. Gunther,
H. M. Kuss and M. Paul, J. Anal. At. Spectrom., 1992, 7, 251.18 A. Zurhaar and L. Mullings, J. Anal. At. Spectrom., 1990, 5,
611.
1282 | J. Anal. At. Spectrom., 2013, 28, 1270–1282
19 T. Parouchais, I. M. Warner, L. T. Palmer and H. Kobus,J. Forensic Sci., 1996, 41, 351.
20 D. C. Duckworth, C. K. Bayne, S. J. Morton and J. R. Almirall,J. Anal. At. Spectrom., 2000, 15, 821.
21 C. Latkoczy, et al., J. Forensic Sci., 2005, 50, 1327.22 S. Becker, P. Watzke, M. Ducking andW. Stoecklein, Forensic
Sci. Int., 2003, 136(1), 361.23 B. Naes, et al., Spectrochim. Acta, Part B, 2008, 63(10), 1145.24 E. Cahoon and J. R. Almirall, Applied Optics, 2010, 49(13),
C49.25 National Research Council. Strengthening Forensic Science in
the United States: A Path Forward, The National AcademiesPress, Washington DC, 2009.
26 T. Trejos, et al., Anal. Bioanal. Chem., 2013, 405(16), 5393.27 T. Trejos and J. R. Almirall, Talanta, 2005, 67, 388.28 T. Trejos and J. R. Almirall, Talanta, 2005, 67, 396.29 J. M. Curran, T. Hicks and J. S. Buckleton, Forensic
Interpretation of Glass Evidence, CRC Press, Florida, 2000,pp. 27–73.
30 J. M. Curran, C. M. Triggs, J. R. Almirall, J. S. Buckleton andK. A. J. Walsh, Sci. Justice, 1997, 37, 241.
31 R. D. Koons and J. Buscaglia, J. Forensic Sci. Soc., 2002, 47,505.
32 S. Bajic, D. Aeschliman, N. J. Staetveit, D. P. Baldwin andR. S. Houk, J. Forensic Sci., 2005, 50, 1123.
33 P. Weis, M. Ducking, P. Watzke, S. Menges and S. Becker,J. Anal. At. Spectrom., 2011, 26, 1273.
34 S. Berends-Montero, W. Wiarda, P. de Joode and G. van derPeijl, J. Anal. At. Spectrom., 2006, 11, 1185.
35 J. N. Miller and J. C. Miller, Statistics and Chemometrics forAnalytical Chemistry, Pearson Education Limited, UK, 4thedn, 2000, pp. 42, 57–67 and 74–80.
36 R. A. Johnson and D. W. Wichern Applied MultivariateStatistical Analysis, Prentice Hall, New Jersey, 3rd edn,1982.
37 C. G. G. Aitken and F. Taroni, Statistics and the Evaluation ofEvidence for Forensic Scientists, John Wiley & Sons Ltd.,England, 2nd edn, 2004.
38 E. J. Garvin and R. D. Koons, J. Forensic Sci., 2011, 56(2), 491.39 American Society for Testing and Materials Method E2330-
04, Standard test method for determination of traceelements in glass using inductively couple plasma massspectrometry (ICP-MS), in ASTM Annual Book of ASTMStandards, 14.02, American Society for Testing andMaterials, West Conshohocken, PA, 2004.
40 T. Ernst, T. Berman, J. Buscaglia, et al., X-Ray Spectrom.,2012, 1–9.
This journal is ª The Royal Society of Chemistry 2013