Estimating global climatological PM 2.5 from MODIS and MISR AOD Aaron van Donkelaar and Randall...
8
Estimating global climatological PM 2.5 from MODIS and MISR AOD Aaron van Donkelaar and Randall Martin April 2009
-
date post
21-Dec-2015 -
Category
Documents
-
view
221 -
download
0
Transcript of Estimating global climatological PM 2.5 from MODIS and MISR AOD Aaron van Donkelaar and Randall...
Estimating global climatological PM2.5 from MODIS and MISR AOD
Aaron van Donkelaar and Randall MartinApril 2009
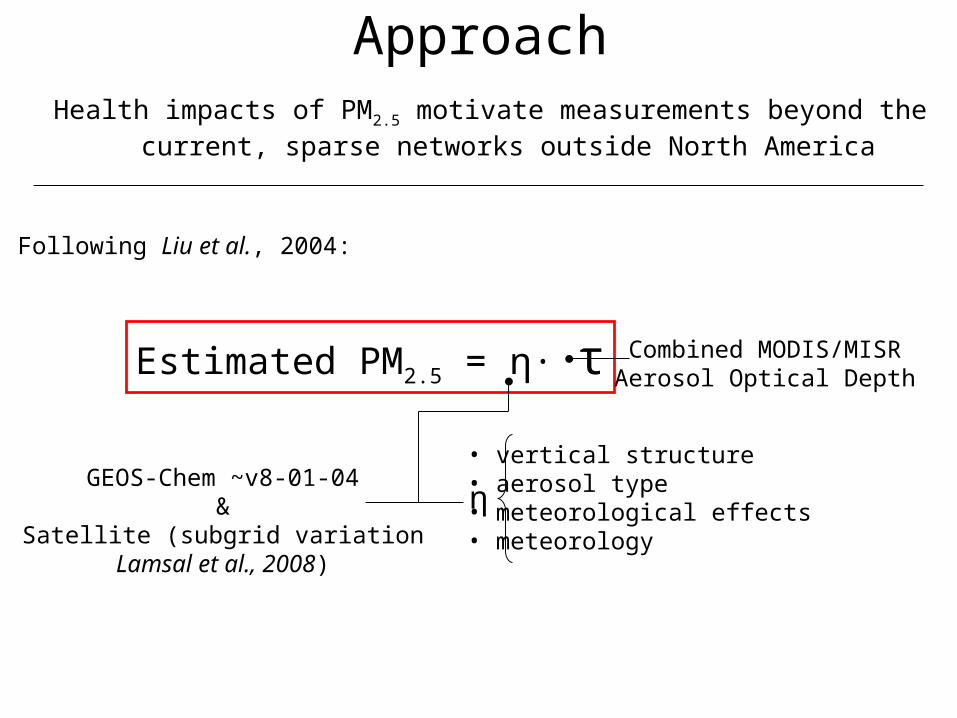
Health impacts of PM2.5 motivate measurements beyond the current, sparse networks outside North America
Estimated PM2.5 = η· τ
• vertical structure• aerosol type• meteorological effects• meteorology
η
Combined MODIS/MISRAerosol Optical Depth
GEOS-Chem ~v8-01-04&
Satellite (subgrid variationLamsal et al., 2008)
Approach
Following Liu et al., 2004:
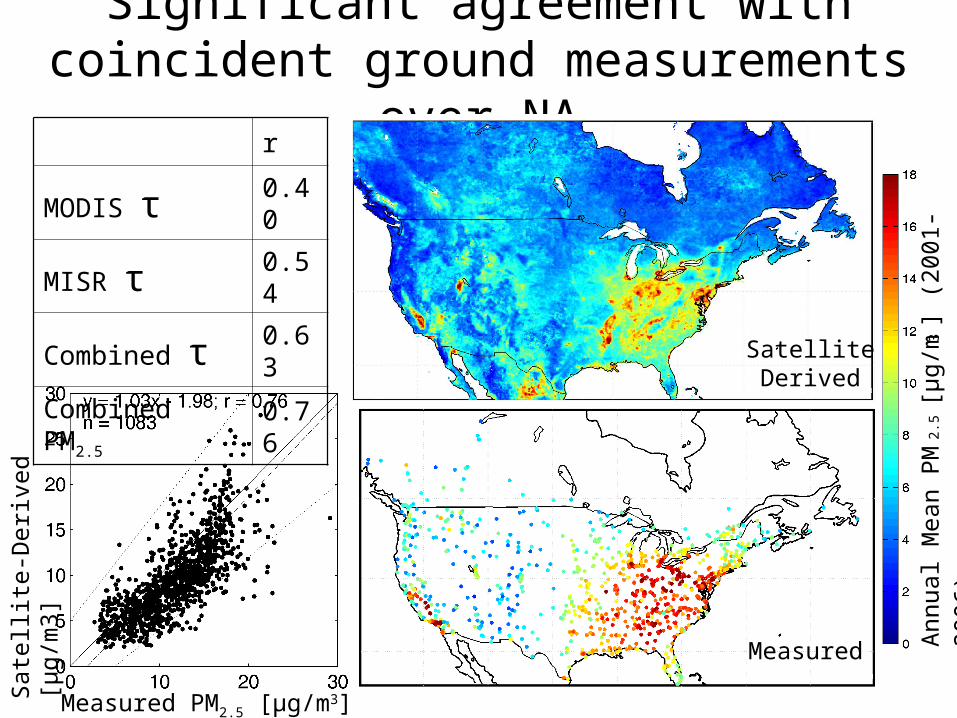
Significant agreement with coincident ground measurements over NA
SatelliteDerived
MeasuredSat
ellit
e-D
eriv
ed
[μg/
m3]
Measured PM2.5 [μg/m3]
Ann
ual M
ean
PM
2.5 [
μg/
m3]
(200
1-20
06)
r
MODIS τ 0.40
MISR τ 0.54
Combined τ 0.63
Combined PM2.5 0.76
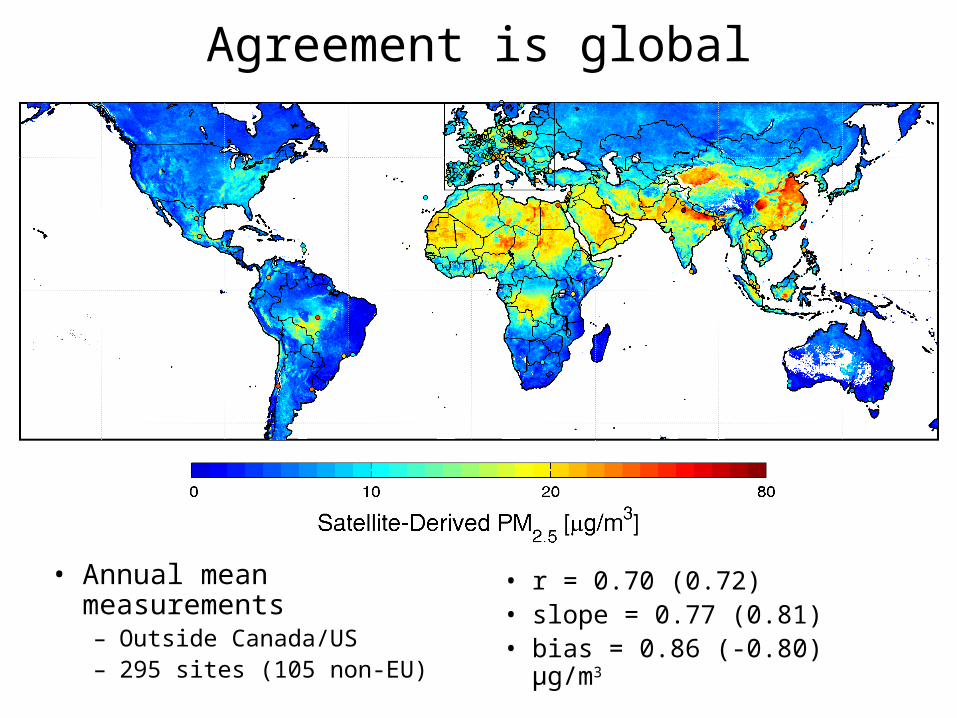
• Annual mean measurements– Outside Canada/US– 295 sites (105 non-EU)
• r = 0.70 (0.72)• slope = 0.77 (0.81)• bias = 0.86 (-0.80) μg/m3
Agreement is global
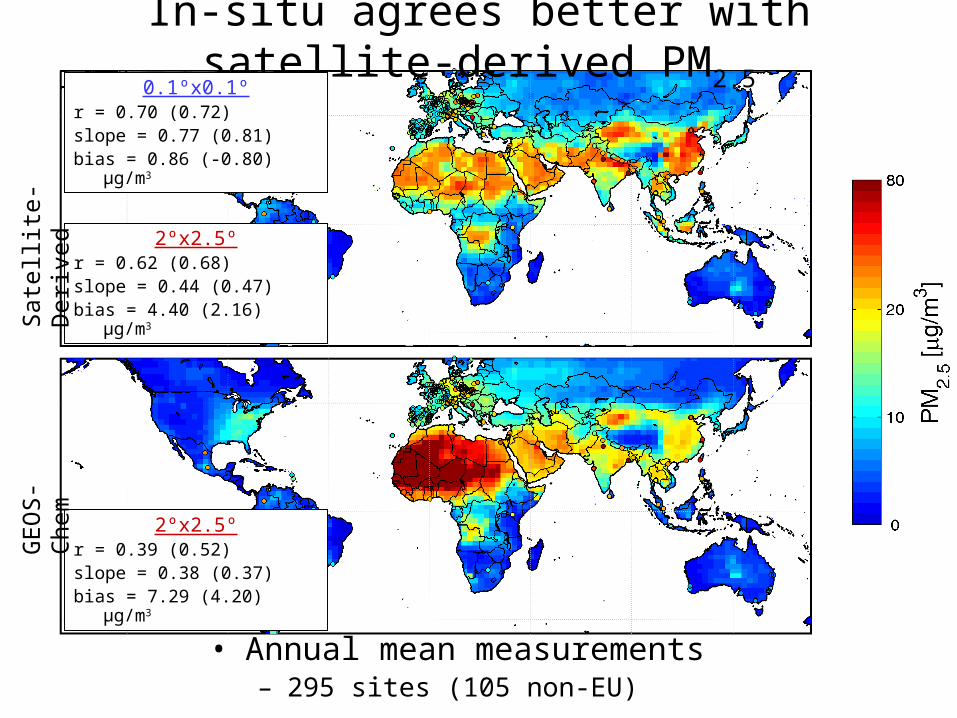
In-situ agrees better with satellite-derived PM2.5
• Annual mean measurements– 295 sites (105 non-EU)
0.1ºx0.1ºr = 0.70 (0.72)slope = 0.77 (0.81)bias = 0.86 (-0.80) μg/m3
2ºx2.5ºr = 0.39 (0.52)slope = 0.38 (0.37)bias = 7.29 (4.20) μg/m3
2ºx2.5ºr = 0.62 (0.68)slope = 0.44 (0.47)bias = 4.40 (2.16) μg/m3
GE
OS
-C
hem
Sat
ellit
e-D
eriv
ed
τ(z)/τsurface
Alti
tud
e [k
m]
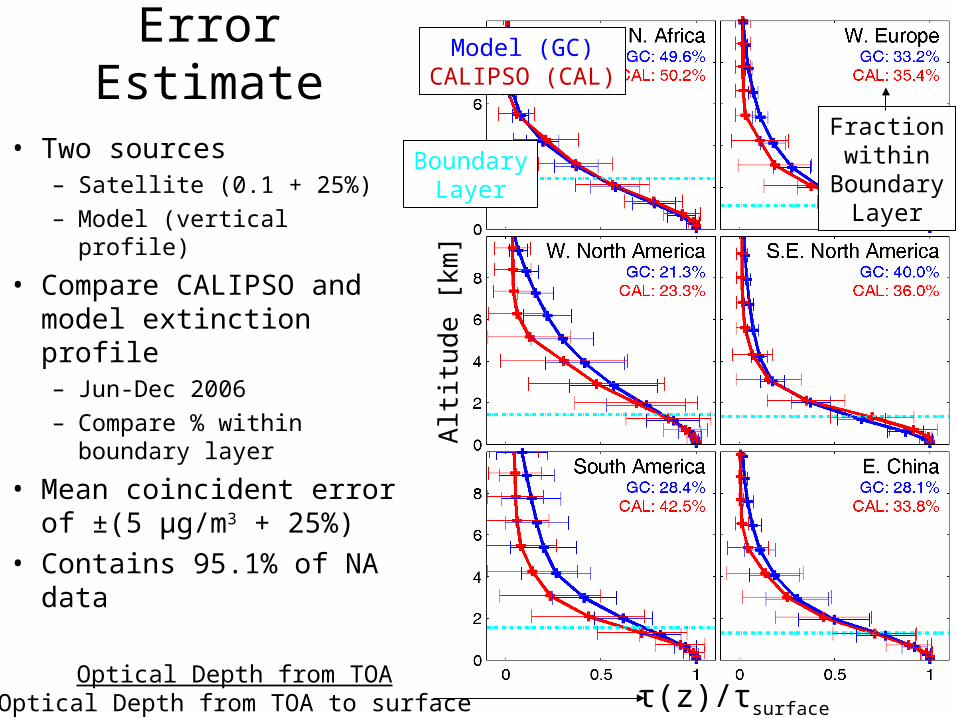
Error Estimate
• Two sources– Satellite (0.1 + 25%)– Model (vertical profile)
• Compare CALIPSO and model extinction profile– Jun-Dec 2006– Compare % within
boundary layer
• Mean coincident error of ±(5 μg/m3 + 25%)
• Contains 95.1% of NA data
Model (GC)CALIPSO (CAL)
Optical Depth from TOAOptical Depth from TOA to surface
BoundaryLayer
Fraction within
Boundary Layer
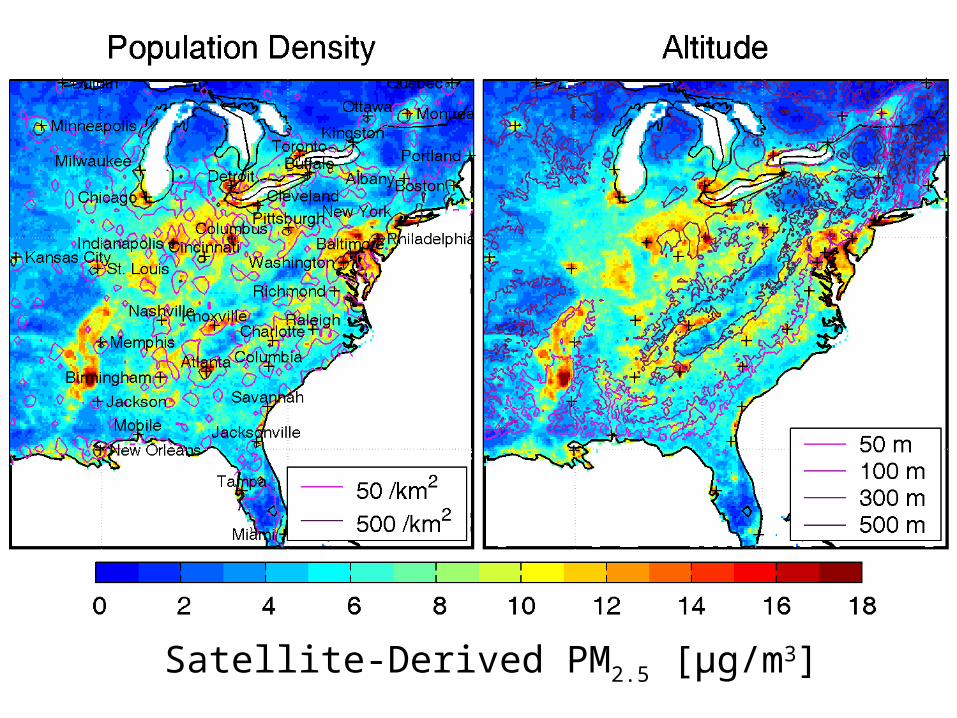
Satellite-Derived PM2.5 [μg/m3]
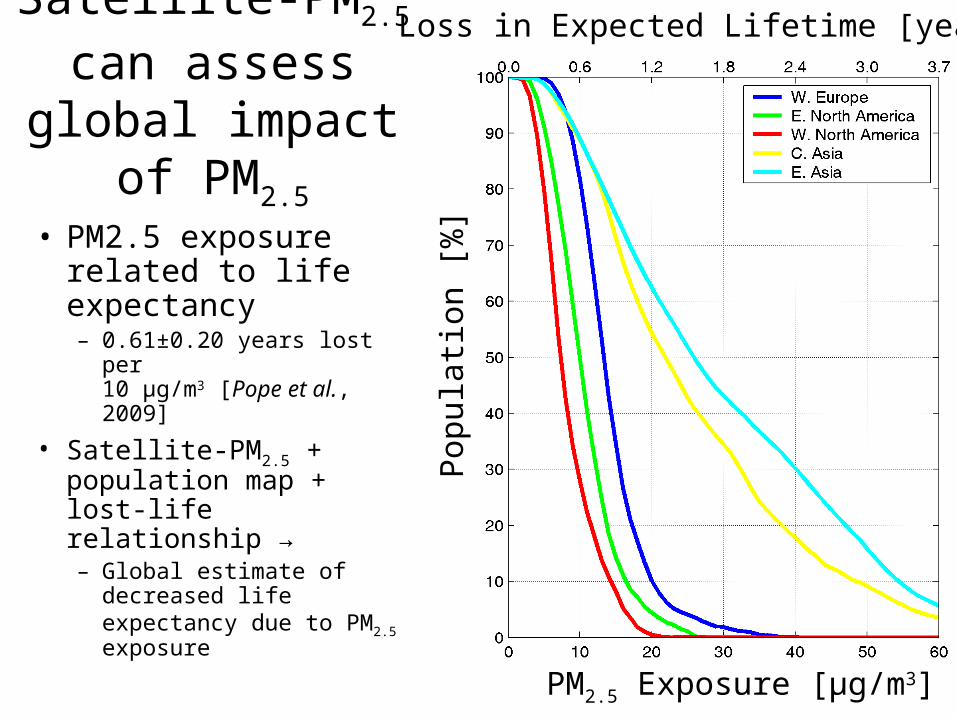
• PM2.5 exposure related to life expectancy– 0.61±0.20 years lost per
10 μg/m3 [Pope et al., 2009]
• Satellite-PM2.5 + population map + lost-life relationship →– Global estimate of
decreased life expectancy due to PM2.5 exposure
Loss in Expected Lifetime [years]
PM2.5 Exposure [μg/m3]
Pop
ulat
ion
[%]
Satellite-PM2.5 can assess global
impact of PM2.5
![The Oxford Democrat (Paris [M.E.]). 1921-06-28 [p 2]....Boetoo and Mr. abd Mra. Henry Τ. Tir- tell of Caotoo aod Mlee Mary Shebao are »t Mr. Hooper a aummer home here. Mr. Hooper](https://static.fdocument.org/doc/165x107/60e4697987782326d5676378/the-oxford-democrat-paris-me-1921-06-28-p-2-boetoo-and-mr-abd-mra.jpg)