MODELLING COASTAL EROSION - η-Τάξη ΕΚΠΑ erosion/Modelling... · seven physical land/marine...
14
MODELLING COASTAL EROSION MSc Kotinas Vasileios, Phd Candidate, University of Athens [email protected] Miltiadis Polidorou, PhD Candidate, University of Athens
Transcript of MODELLING COASTAL EROSION - η-Τάξη ΕΚΠΑ erosion/Modelling... · seven physical land/marine...

MODELLING COASTAL EROSION
MSc Kotinas Vasileios, Phd Candidate, University of Athens [email protected]
Miltiadis Polidorou, PhD Candidate, University of Athens
INTRODUCTION
Around 41% of Europe’s population live near the
coast (Collet & Engelbert, 2013)
Determining the physical response of the
coastline to sea-level rise is one of the most
important problems in coastal geology today
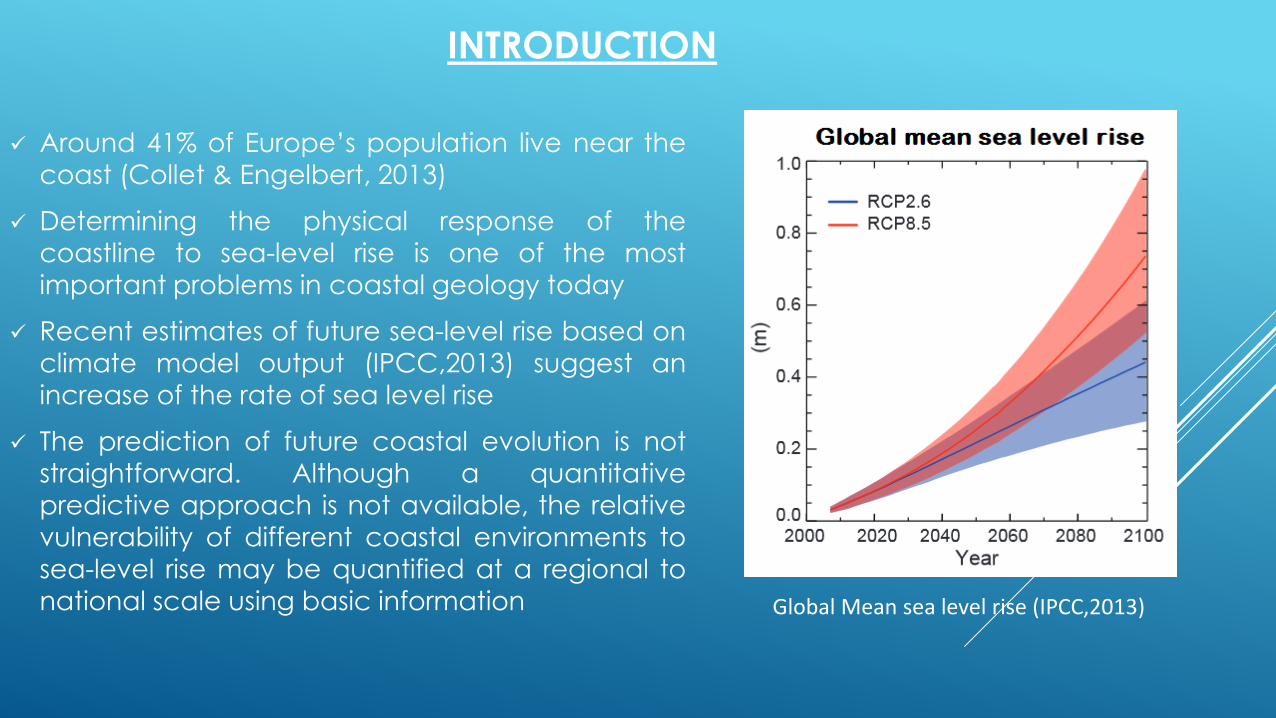
Recent estimates of future sea-level rise based on
climate model output (IPCC,2013) suggest an
increase of the rate of sea level rise
The prediction of future coastal evolution is not
straightforward. Although a quantitative
predictive approach is not available, the relative
vulnerability of different coastal environments to
sea-level rise may be quantified at a regional to
national scale using basic information Global Mean sea level rise (IPCC,2013)
CVI
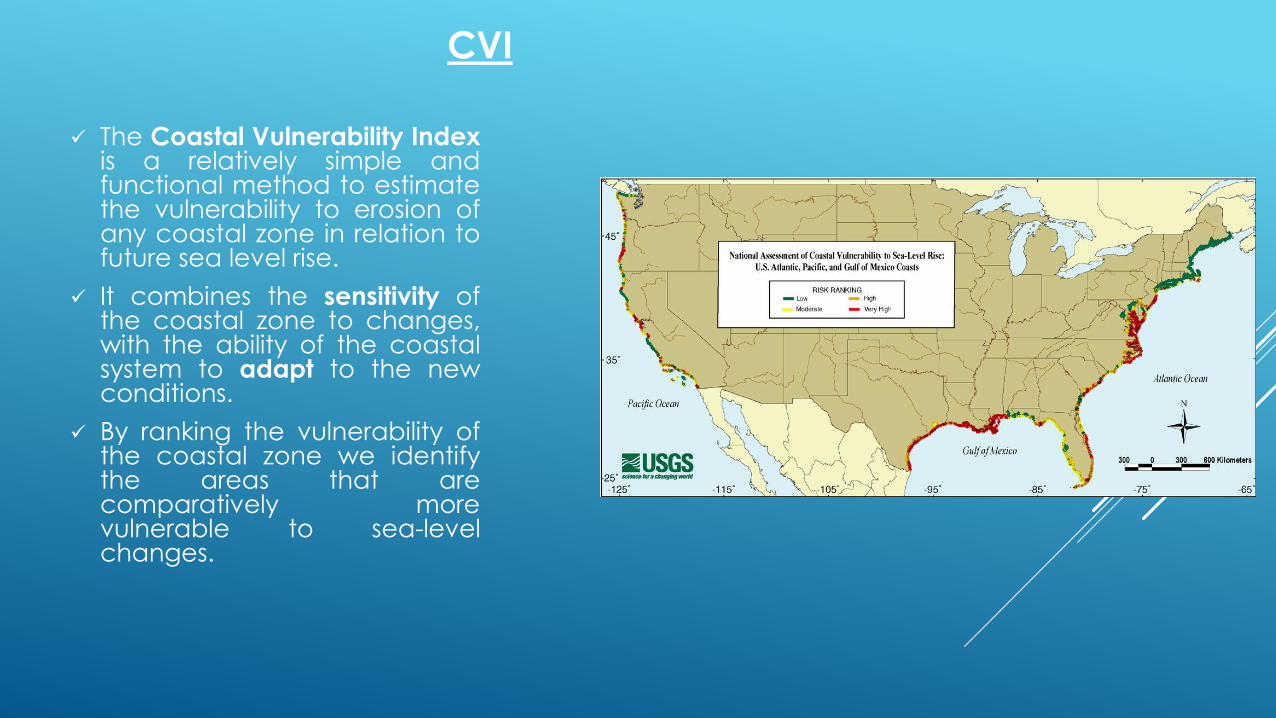
The Coastal Vulnerability Indexis a relatively simple andfunctional method to estimatethe vulnerability to erosion ofany coastal zone in relation tofuture sea level rise.
It combines the sensitivity ofthe coastal zone to changes,with the ability of the coastalsystem to adapt to the newconditions.
By ranking the vulnerability ofthe coastal zone we identifythe areas that arecomparatively morevulnerable to sea-levelchanges.
HISTORICAL EVOLUTION
The Coastal Vulnerability Index(CVI) was developed by Gornitz etal. (1990). The parameters thatwere considered were: relief, rocktype, landform, vertical (tectonic)movement, shorelinedisplacement, tidal range andwave height.
The CVI was modified later byGornitz et al (1994) to includeseven physical land/marinevariables and six climatologicalvariables
Many modifications were made tothe CVI. For example, Thieler andHammer Klose in 1999 reversed theranking of tidal range.
• The CVI was used by the UnitedStates Geological Survey (USGS) toassess the vulnerability of coastalarea, throughout the United States(Thieler, 2000; Thieler and Hammer-Klose, 1999, 2000)
• The problem with the CVI approachas proposed by Gornitz et al. andadopted by the USGS is its non-consideration of socio-economicdata.
• Boruf et al. (2005) combined theSocial Vulnerability Index with theCVI to form the Coastal SocialVulnerability Index (CSoVI)
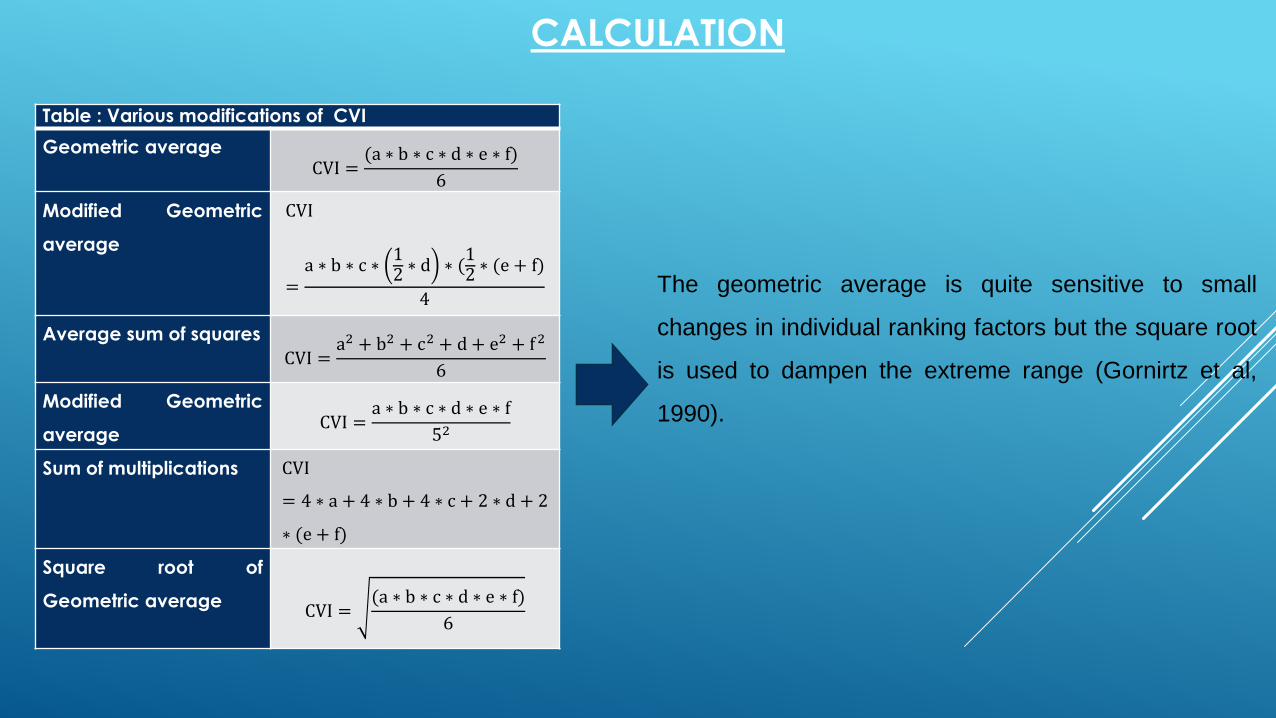
Table : Various modifications of CVI
Geometric averageCVI =
(a ∗ b ∗ c ∗ d ∗ e ∗ f)
6
Modified Geometric
average
CVI
=a ∗ b ∗ c ∗
12∗ d ∗ (
12∗ (e + f)
4
Average sum of squares
CVI =a2 + b2 + c2 + d + e2 + f2
6
Modified Geometric
averageCVI =
a ∗ b ∗ c ∗ d ∗ e ∗ f
52
Sum of multiplications CVI
= 4 ∗ a + 4 ∗ b + 4 ∗ c + 2 ∗ d + 2
∗ (e + f)
Square root of
Geometric averageCVI =
(a ∗ b ∗ c ∗ d ∗ e ∗ f)
6
The geometric average is quite sensitive to small
changes in individual ranking factors but the square root
is used to dampen the extreme range (Gornirtz et al,
1990).
CALCULATION

Rank Very Low Low Moderate High Very High
Variable 1 2 3 4 5
Relief (m) ≥30.1 20.1-30.0 10.1-20.0 5.1-10.0 0-5.0
Rock Type Plutonic,
Volcanic,
High-medium grade
metamorphics
Low grade
metamorphics,
Sandstone and
conglomerate
Most sedimentary
rocks
Coarse and poorly
sorted
unconsolidated
sediments
Fine unconsolidated
sediments, Volcanic
ash
Landform Rocky,Cliffed
coasts, Fiords,Fiards
Medium Cliffs,
Indented coasts
Low cliffs, Glacial
drift, Salt marsh,
Coral reefs,
Mangrove
Beaches(Pebbles),
Estuary, Laggoon,
Alluvial Plains
Barrier beaches
(sand),
Mudflats,
Deltas
Vertical movement
(mm/yr)
≤ -1.1 -1.0 - 0.99 1.0 – 2.0 2.1 - 4.0 ≥ 4.1
Shoreline
displacement
(m/yr)
≥ 2.1 Accretion 1.0 – 2.0 -1.0 - +1.0 Stable -1.1 - -2.0 ≤ -2.0 Erosion
Tidal Range (m) ≤0.99 Microtidal 1.0 – 1.9 2.0 – 4.0 Mesotidal 4.1-6.0 ≥ 6.1 Macrotidal
Wave height max
(m)
0-2.9 3.0-4.9 5.0-5.9 6.0-6.9 ≥ 7.0
Original CVI variables (Gornitz et al, 1990)
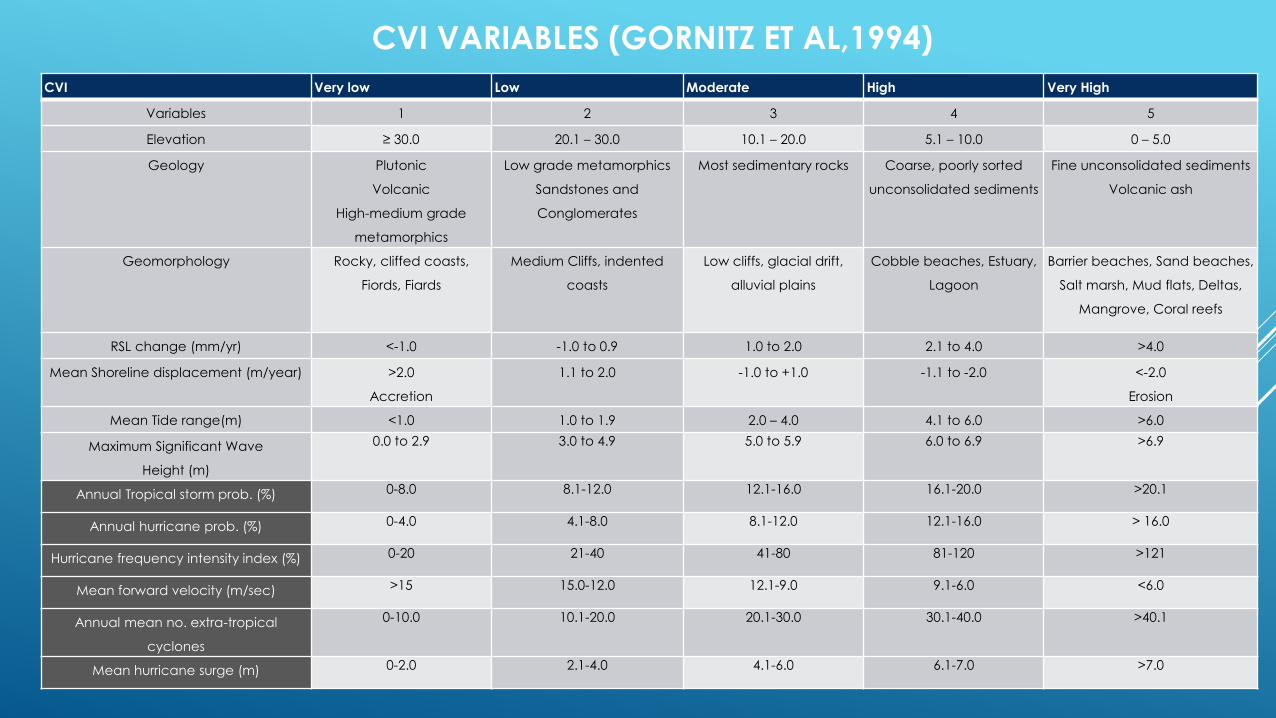
CVI VARIABLES (GORNITZ ET AL,1994)
CVI Very low Low Moderate High Very High
Variables 1 2 3 4 5
Elevation ≥ 30.0 20.1 – 30.0 10.1 – 20.0 5.1 – 10.0 0 – 5.0
Geology Plutonic
Volcanic
High-medium grade
metamorphics
Low grade metamorphics
Sandstones and
Conglomerates
Most sedimentary rocks Coarse, poorly sorted
unconsolidated sediments
Fine unconsolidated sediments
Volcanic ash
Geomorphology Rocky, cliffed coasts,
Fiords, Fiards
Medium Cliffs, indented
coasts
Low cliffs, glacial drift,
alluvial plains
Cobble beaches, Estuary,
Lagoon
Barrier beaches, Sand beaches,
Salt marsh, Mud flats, Deltas,
Mangrove, Coral reefs
RSL change (mm/yr) <-1.0 -1.0 to 0.9 1.0 to 2.0 2.1 to 4.0 >4.0
Mean Shoreline displacement (m/year) >2.0
Accretion
1.1 to 2.0 -1.0 to +1.0 -1.1 to -2.0 <-2.0
Erosion
Mean Tide range(m) <1.0 1.0 to 1.9 2.0 – 4.0 4.1 to 6.0 >6.0
Maximum Significant Wave
Height (m)
0.0 to 2.9 3.0 to 4.9 5.0 to 5.9 6.0 to 6.9 >6.9
Annual Tropical storm prob. (%) 0-8.0 8.1-12.0 12.1-16.0 16.1-20.0 >20.1
Annual hurricane prob. (%) 0-4.0 4.1-8.0 8.1-12.0 12.1-16.0 > 16.0
Hurricane frequency intensity index (%) 0-20 21-40 41-80 81-120 >121
Mean forward velocity (m/sec) >15 15.0-12.0 12.1-9.0 9.1-6.0 <6.0
Annual mean no. extra-tropical
cyclones
0-10.0 10.1-20.0 20.1-30.0 30.1-40.0 >40.1
Mean hurricane surge (m) 0-2.0 2.1-4.0 4.1-6.0 6.1-7.0 >7.0
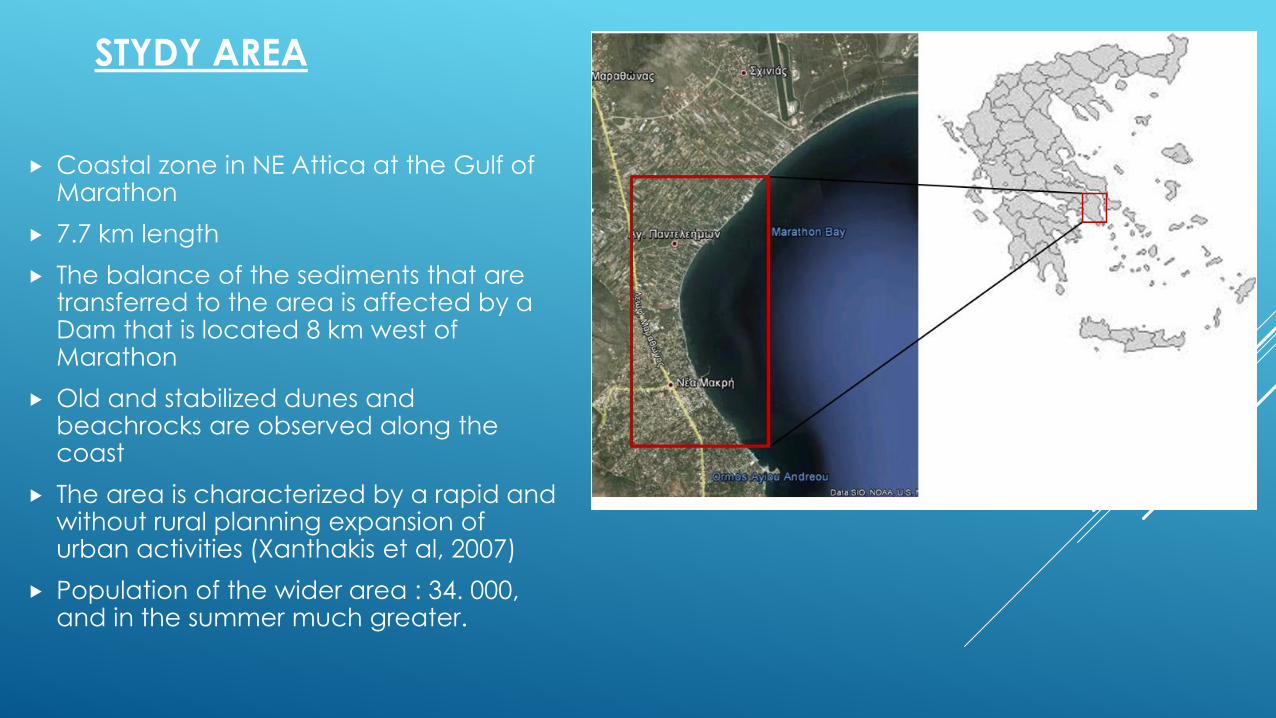
STYDY AREA
Coastal zone in NE Attica at the Gulf of Marathon
7.7 km length
The balance of the sediments that are transferred to the area is affected by a Dam that is located 8 km west of Marathon
Old and stabilized dunes and beachrocks are observed along the coast
The area is characterized by a rapid and without rural planning expansion of urban activities (Xanthakis et al, 2007)
Population of the wider area : 34. 000, and in the summer much greater.
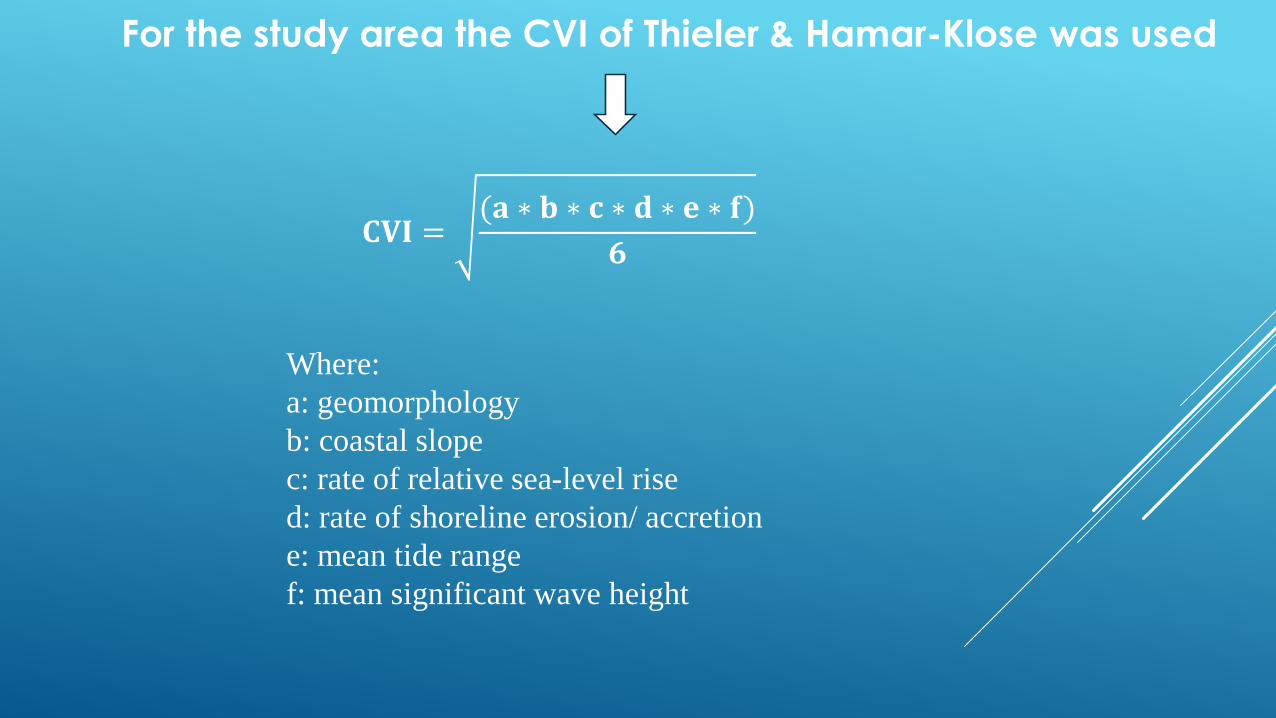
𝐂𝐕𝐈 =(𝐚 ∗ 𝐛 ∗ 𝐜 ∗ 𝐝 ∗ 𝐞 ∗ 𝐟)
𝟔
Where:
a: geomorphology
b: coastal slope
c: rate of relative sea-level rise
d: rate of shoreline erosion/ accretion
e: mean tide range
f: mean significant wave height
For the study area the CVI of Thieler & Hamar-Klose was used
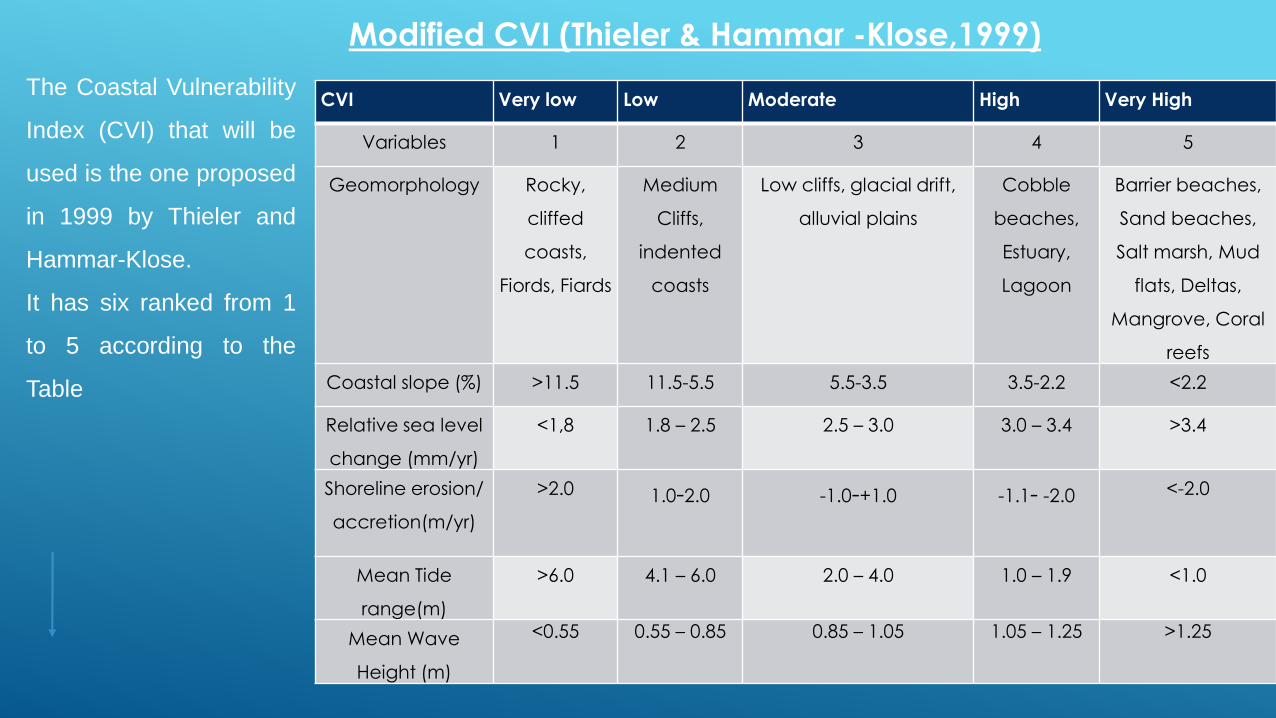
Modified CVI (Thieler & Hammar -Klose,1999)
CVI Very low Low Moderate High Very High
Variables 1 2 3 4 5
Geomorphology Rocky,
cliffed
coasts,
Fiords, Fiards
Medium
Cliffs,
indented
coasts
Low cliffs, glacial drift,
alluvial plains
Cobble
beaches,
Estuary,
Lagoon
Barrier beaches,
Sand beaches,
Salt marsh, Mud
flats, Deltas,
Mangrove, Coral
reefs
Coastal slope (%) >11.5 11.5-5.5 5.5-3.5 3.5-2.2 <2.2
Relative sea level
change (mm/yr)
<1,8 1.8 – 2.5 2.5 – 3.0 3.0 – 3.4 >3.4
Shoreline erosion/
accretion(m/yr)
>2.0 1.0-2.0 -1.0-+1.0 -1.1- -2.0 <-2.0
Mean Tide
range(m)
>6.0 4.1 – 6.0 2.0 – 4.0 1.0 – 1.9 <1.0
Mean Wave
Height (m)
<0.55 0.55 – 0.85 0.85 – 1.05 1.05 – 1.25 >1.25
The Coastal Vulnerability
Index (CVI) that will be
used is the one proposed
in 1999 by Thieler and
Hammar-Klose.
It has six ranked from 1
to 5 according to the
Table
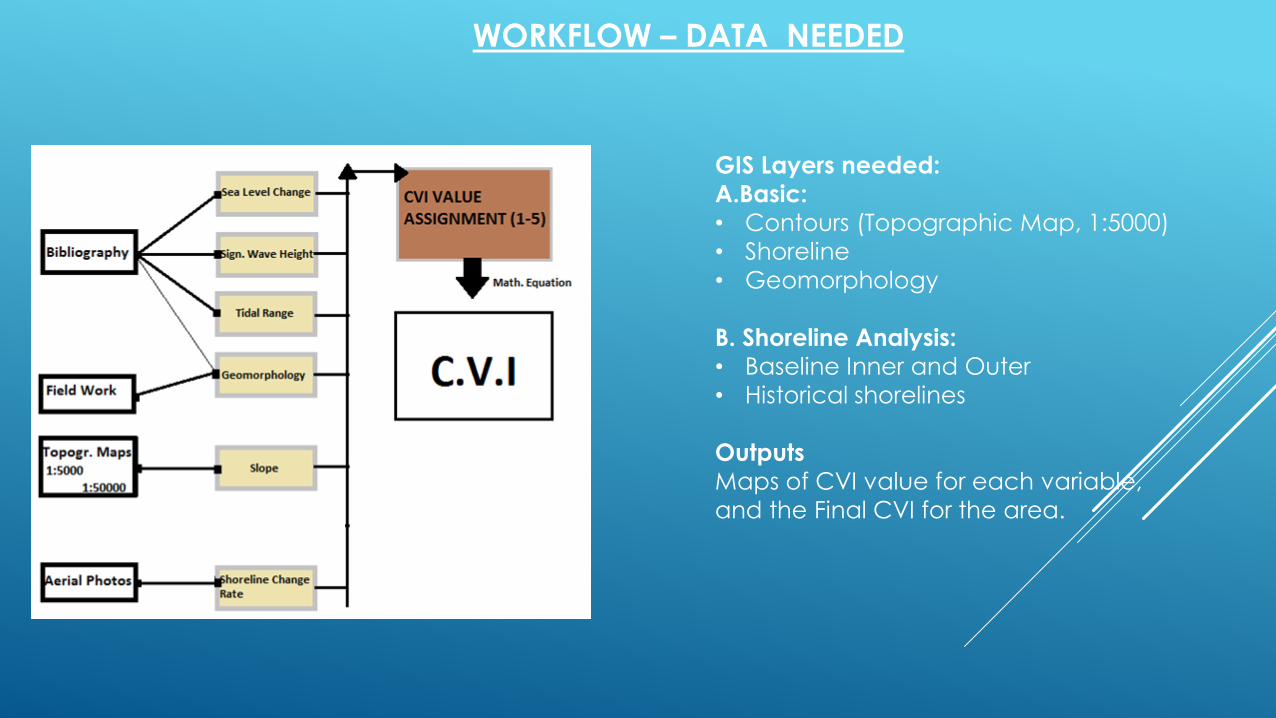
GIS Layers needed:
A.Basic:
• Contours (Topographic Map, 1:5000)
• Shoreline
• Geomorphology
B. Shoreline Analysis:
• Baseline Inner and Outer
• Historical shorelines
Outputs
Maps of CVI value for each variable,
and the Final CVI for the area.
WORKFLOW – DATA NEEDED
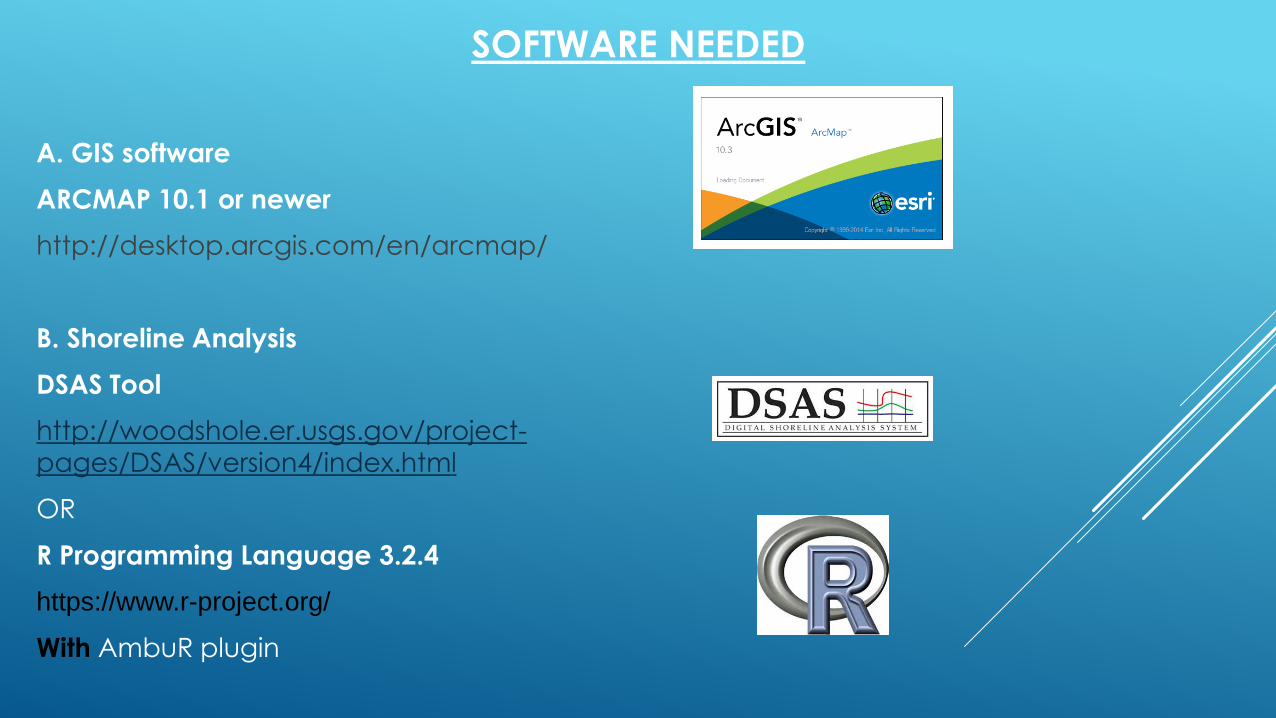
SOFTWARE NEEDED
A. GIS software
ARCMAP 10.1 or newer
http://desktop.arcgis.com/en/arcmap/
B. Shoreline Analysis
DSAS Tool
http://woodshole.er.usgs.gov/project-
pages/DSAS/version4/index.html
OR
R Programming Language 3.2.4
https://www.r-project.org/
With AmbuR plugin
So let’s start by launching
ARC Map 10.3
and start working with the data…
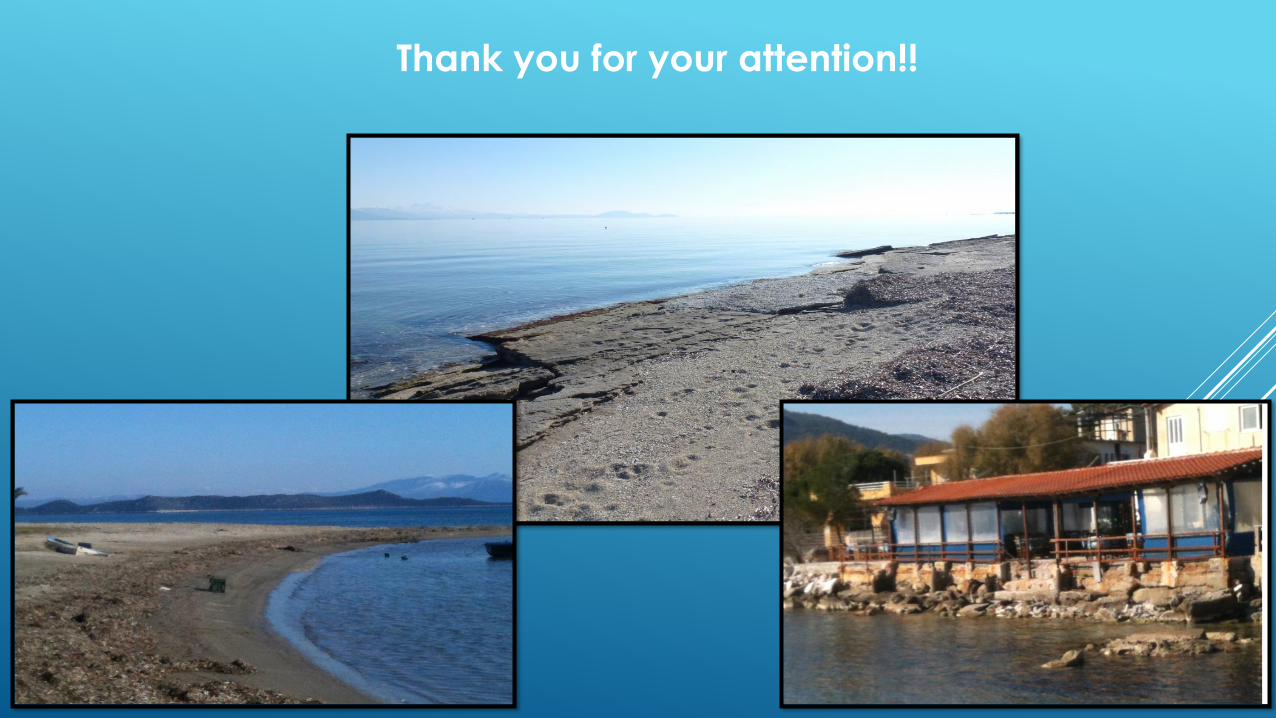
Thank you for your attention!!