Degenerative Transfer Living Ziegler-Natta Polymerization - DRUM
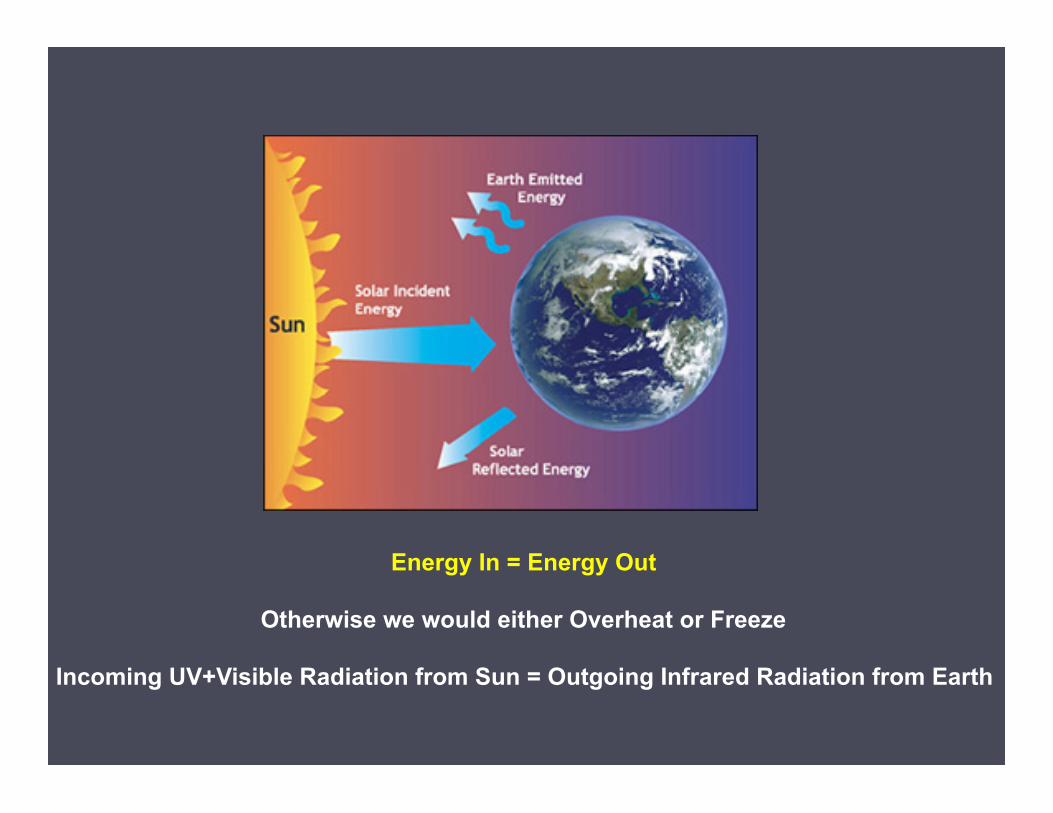
Energy In = Energy Out
Otherwise we would either Overheat or Freeze
Incoming UV+Visible Radiation from Sun = Outgoing Infrared Radiation from Earth
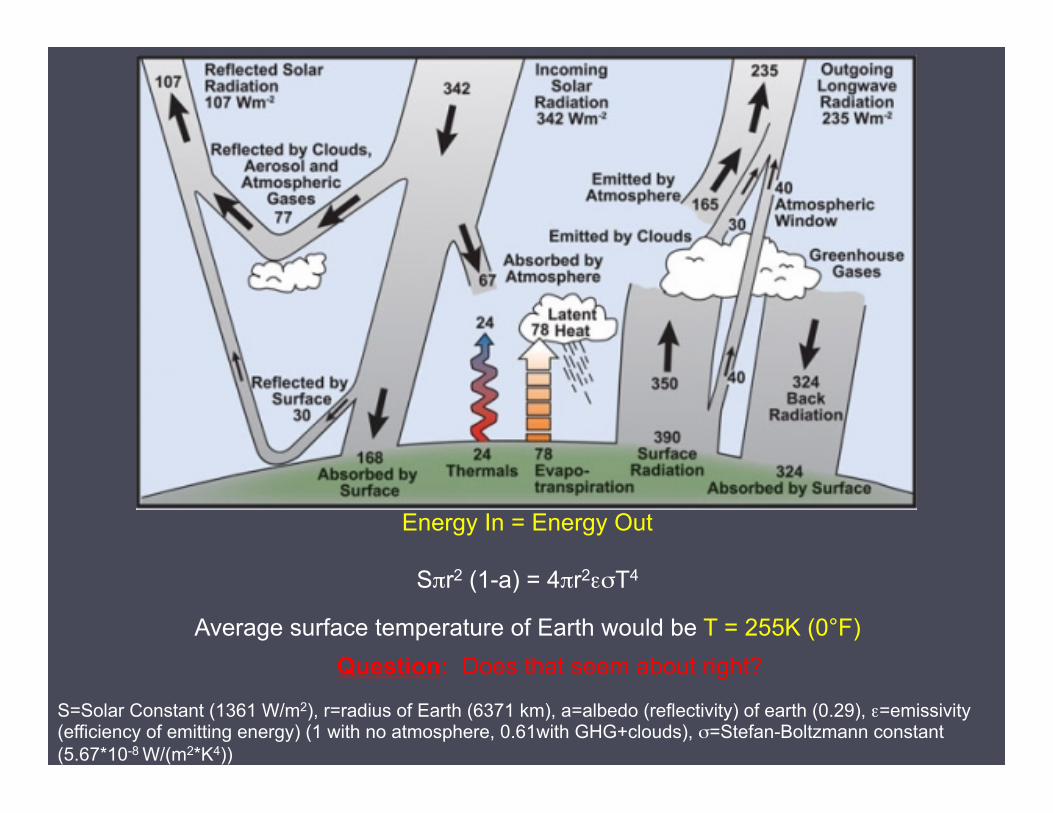
Energy In = Energy Out
Sπr2 (1-a) = 4πr2εσT4
Average surface temperature of Earth would be T = 255K (0°F)
S=Solar Constant (1361 W/m2), r=radius of Earth (6371 km), a=albedo (reflectivity) of earth (0.29), ε=emissivity (efficiency of emitting energy) (1 with no atmosphere, 0.61with GHG+clouds), σ=Stefan-Boltzmann constant (5.67*10-8 W/(m2*K4))
Question: Does that seem about right?
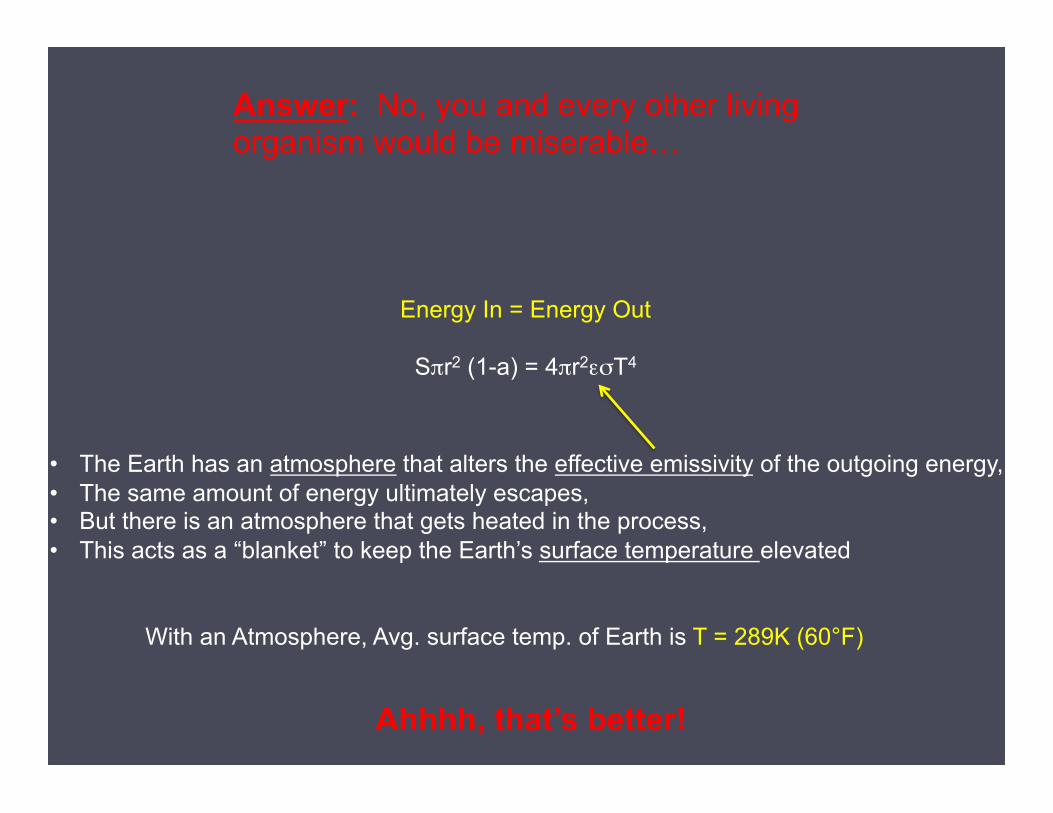
Energy In = Energy Out
Sπr2 (1-a) = 4πr2εσT4
Answer: No, you and every other living organism would be miserable…
• The Earth has an atmosphere that alters the effective emissivity of the outgoing energy, • The same amount of energy ultimately escapes, • But there is an atmosphere that gets heated in the process, • This acts as a “blanket” to keep the Earth’s surface temperature elevated
With an Atmosphere, Avg. surface temp. of Earth is T = 289K (60°F)
Ahhhh, that’s better!
The majority of this +60°F increase of Earth’s surface temperature is due to the greenhouse effect
We owe life as we know it to the greenhouse effect
It’s a wonderful, powerful thing
What would it mean if humans had the power to alter it?
Medi Belortaja - Toonpool
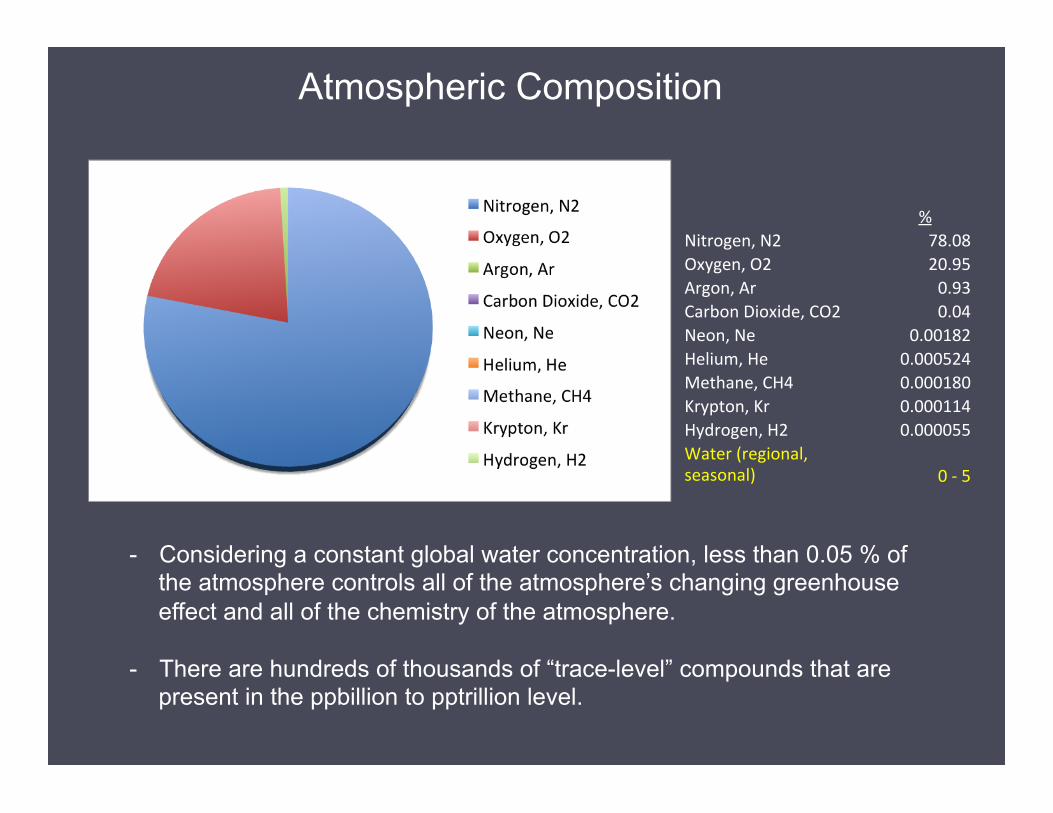
% Nitrogen, N2 78.08 Oxygen, O2 20.95 Argon, Ar 0.93 Carbon Dioxide, CO2 0.04 Neon, Ne 0.00182 Helium, He 0.000524 Methane, CH4 0.000180 Krypton, Kr 0.000114 Hydrogen, H2 0.000055 Water (regional, seasonal) 0 -‐ 5
Atmospheric Composition
- Considering a constant global water concentration, less than 0.05 % of the atmosphere controls all of the atmosphere’s changing greenhouse effect and all of the chemistry of the atmosphere.
- There are hundreds of thousands of “trace-level” compounds that are present in the ppbillion to pptrillion level.
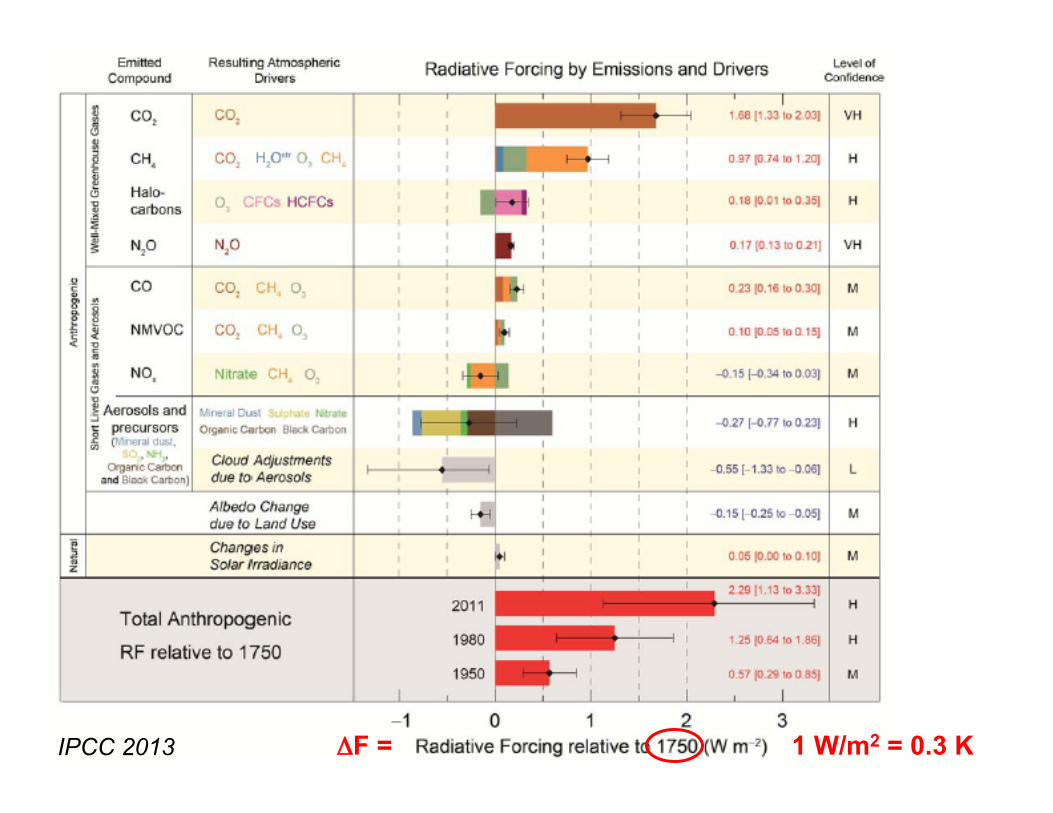
IPCC 2013 1 W/m2 = 0.3 K ΔF =
What makes a Gas a “Greenhouse” Gas?
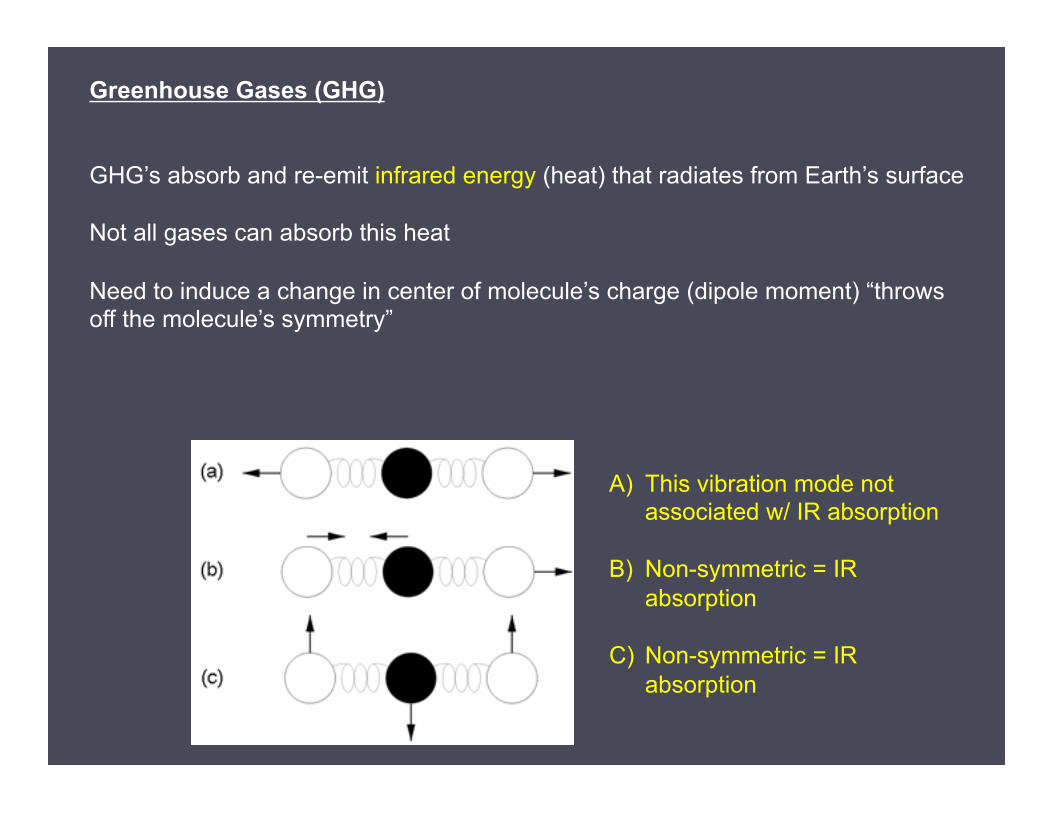
Greenhouse Gases (GHG) GHG’s absorb and re-emit infrared energy (heat) that radiates from Earth’s surface Not all gases can absorb this heat Need to induce a change in center of molecule’s charge (dipole moment) “throws off the molecule’s symmetry”
A) This vibration mode not associated w/ IR absorption
B) Non-symmetric = IR
absorption
C) Non-symmetric = IR absorption
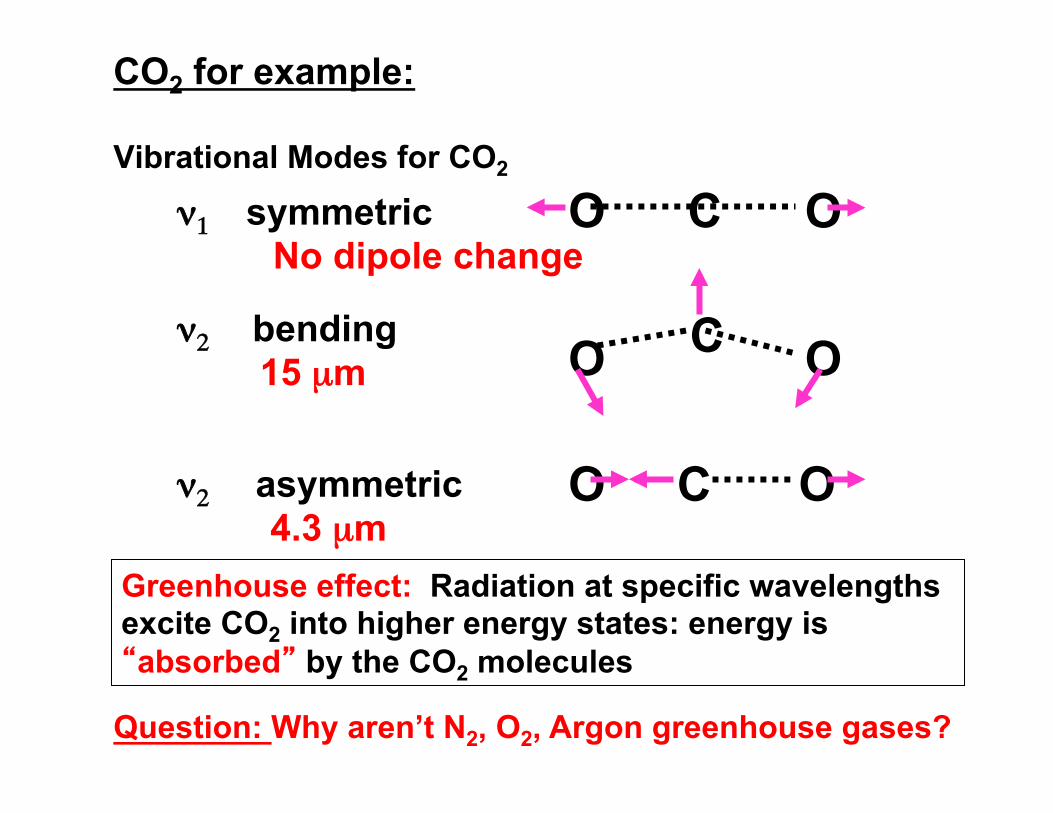
CO2 for example: Vibrational Modes for CO2
C O O
C O O
O O C
ν1 symmetric No dipole change
ν2 bending 15 µm
ν2 asymmetric 4.3 µm
Greenhouse effect: Radiation at specific wavelengths excite CO2 into higher energy states: energy is “absorbed” by the CO2 molecules
Question: Why aren’t N2, O2, Argon greenhouse gases?
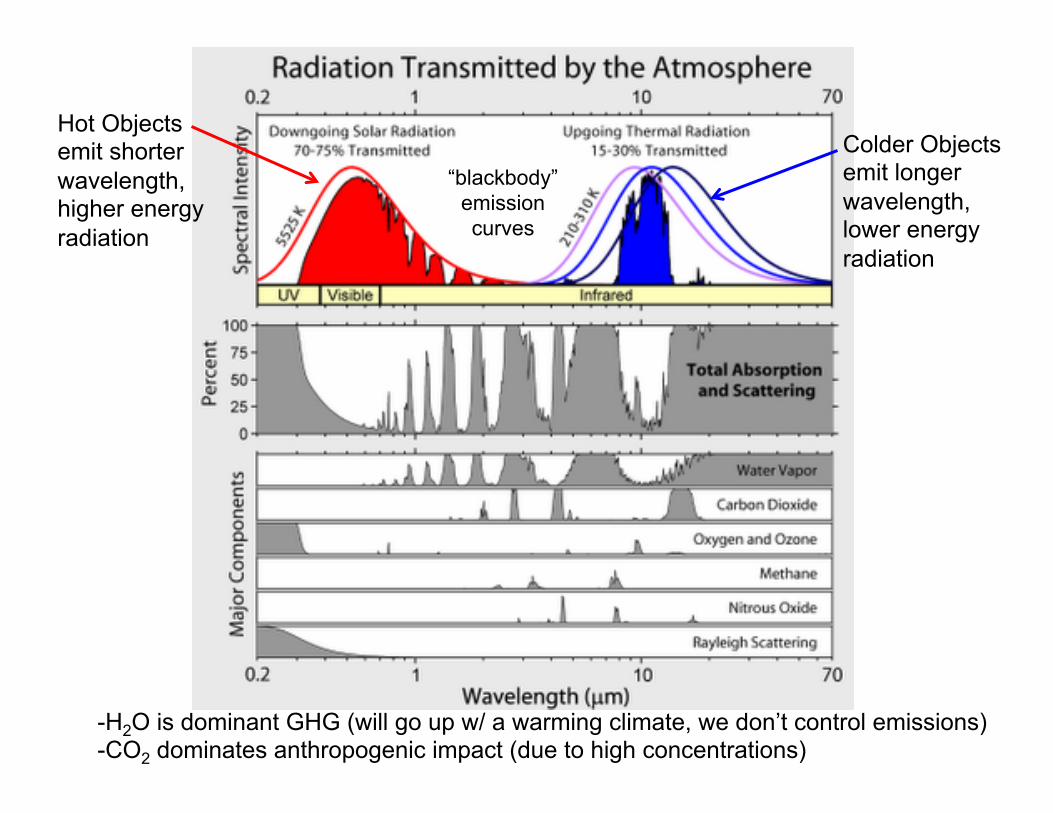
-H2O is dominant GHG (will go up w/ a warming climate, we don’t control emissions) -CO2 dominates anthropogenic impact (due to high concentrations)
Hot Objects emit shorter wavelength, higher energy radiation
Colder Objects emit longer wavelength, lower energy radiation
“blackbody” emission curves
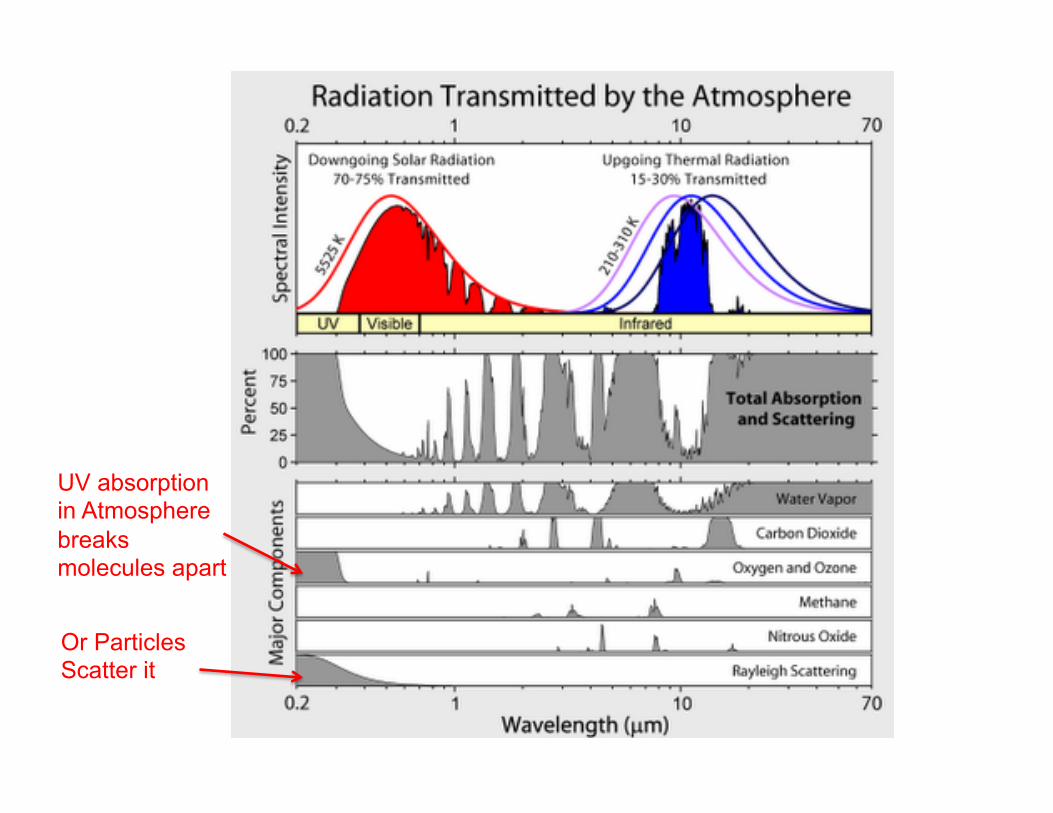
UV absorption in Atmosphere breaks molecules apart
Or Particles Scatter it
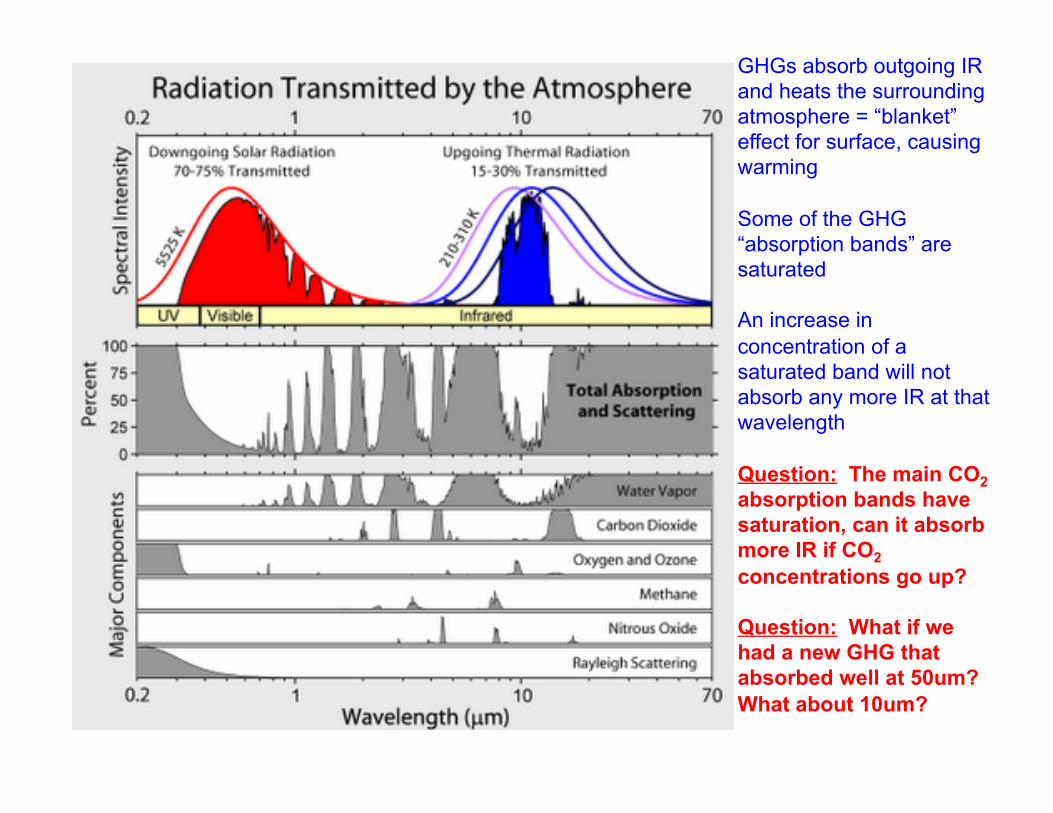
GHGs absorb outgoing IR and heats the surrounding atmosphere = “blanket” effect for surface, causing warming Some of the GHG “absorption bands” are saturated An increase in concentration of a saturated band will not absorb any more IR at that wavelength Question: The main CO2 absorption bands have saturation, can it absorb more IR if CO2 concentrations go up? Question: What if we had a new GHG that absorbed well at 50um? What about 10um?
So the increased warming with increased GHG concentration is typically non-linear. What does that mean? Also, the warming from increased GHG is not completely “realized” right away, we have further warming “commitment” that will happen in the future… The longer a GHG lives in the atmosphere, the longer it will continue to contribute to warming.
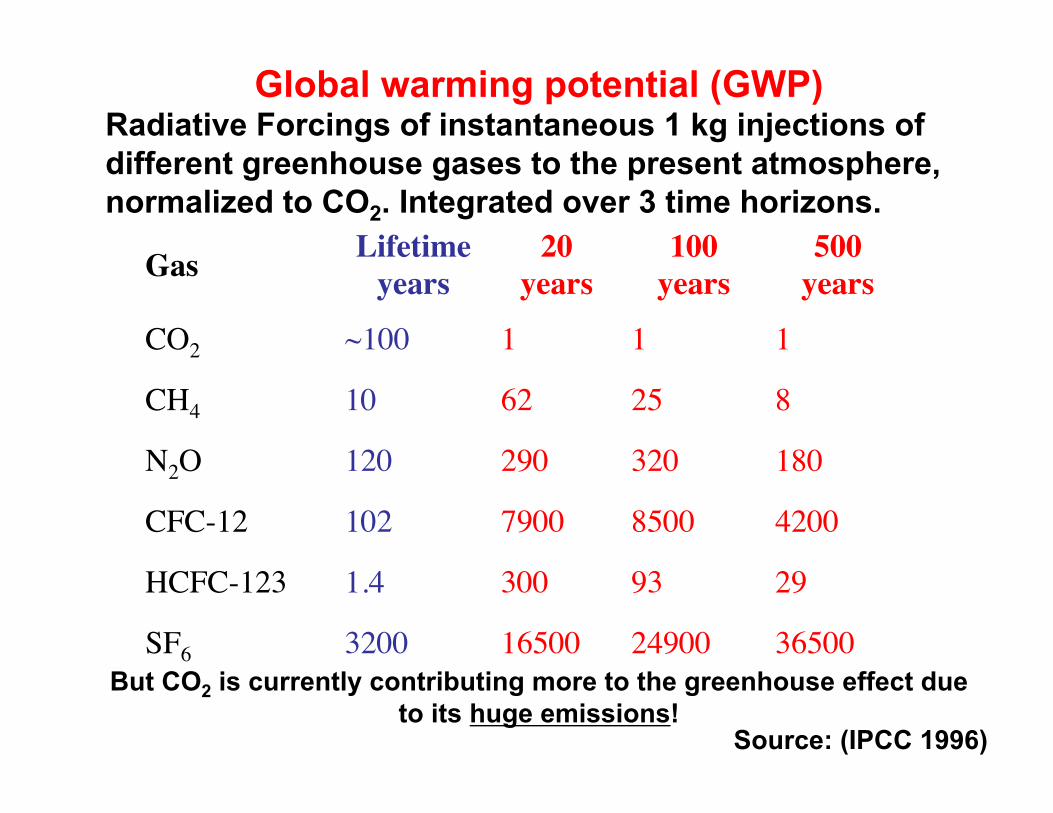
Gas Lifetime years
20 years
100 years
500 years
CO2 ~100 1 1 1
CH4 10 62 25 8
N2O 120 290 320 180
CFC-12 102 7900 8500 4200
HCFC-123 1.4 300 93 29
SF6 3200 16500 24900 36500
Global warming potential (GWP) Radiative Forcings of instantaneous 1 kg injections of different greenhouse gases to the present atmosphere, normalized to CO2. Integrated over 3 time horizons.
Source: (IPCC 1996)
But CO2 is currently contributing more to the greenhouse effect due to its huge emissions!
What have GHG concentrations looked like in “recent” history?
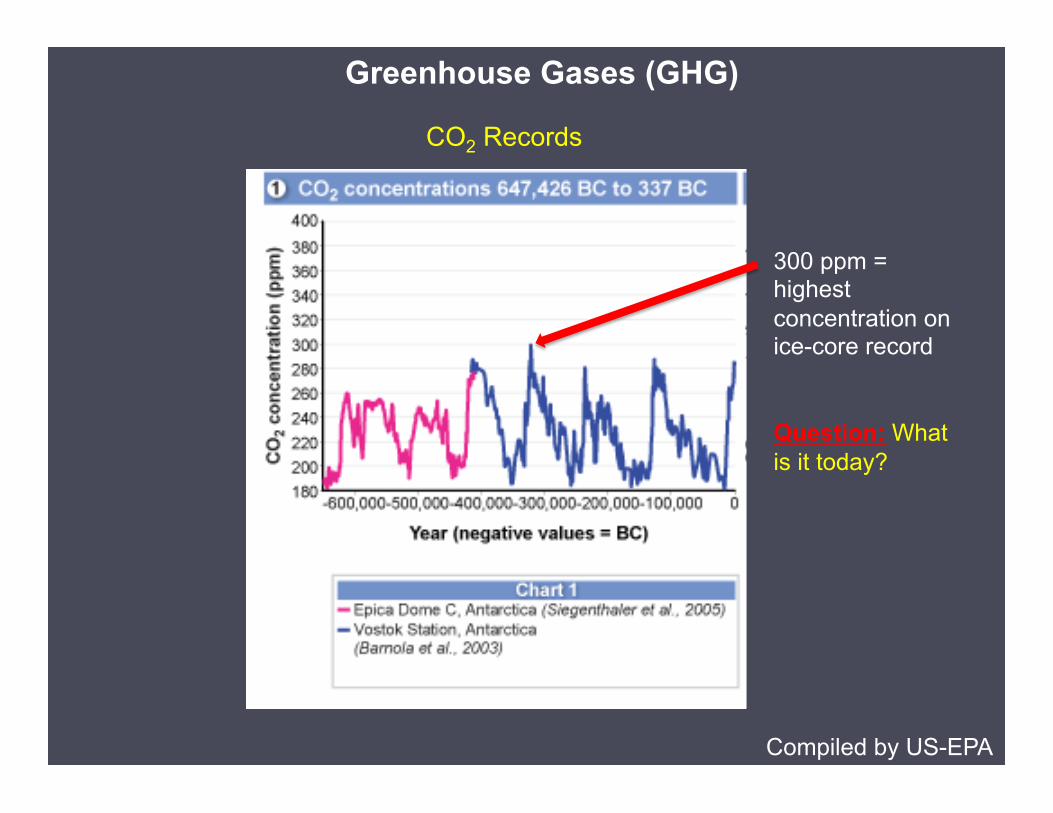
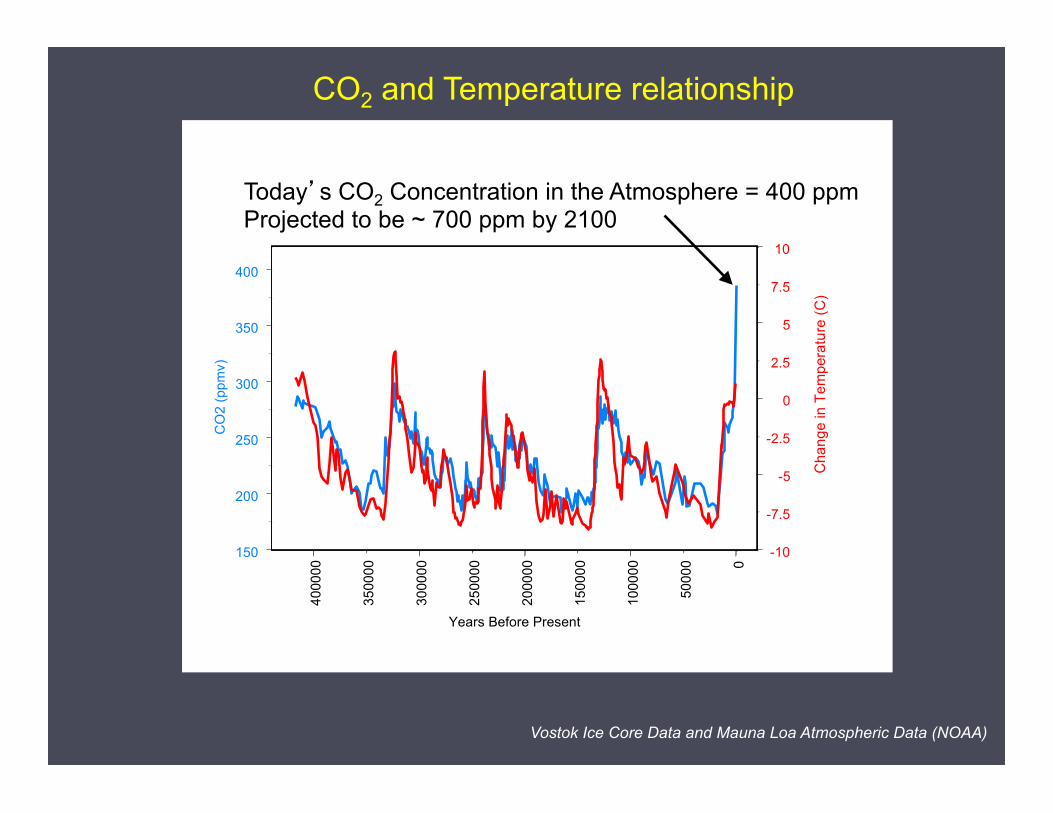
300 ppm = highest concentration on ice-core record Question: What is it today?
Compiled by US-EPA
CO2 Records
Greenhouse Gases (GHG)
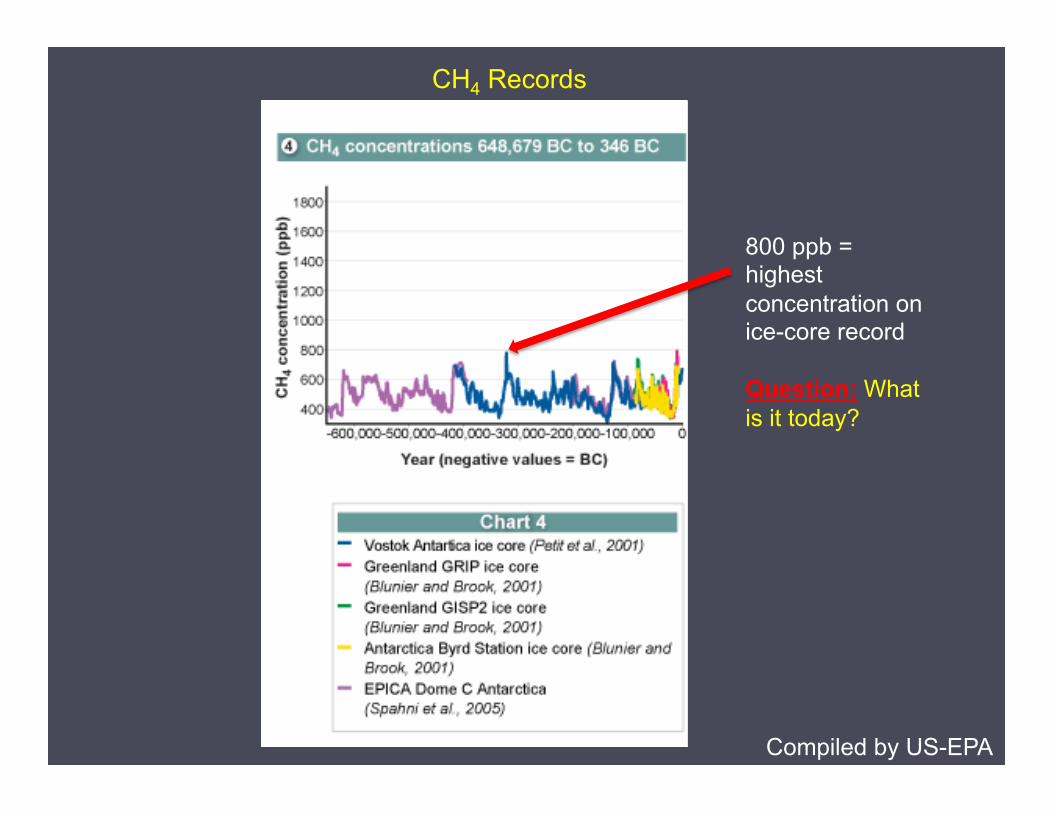
800 ppb = highest concentration on ice-core record Question: What is it today?
Compiled by US-EPA
CH4 Records
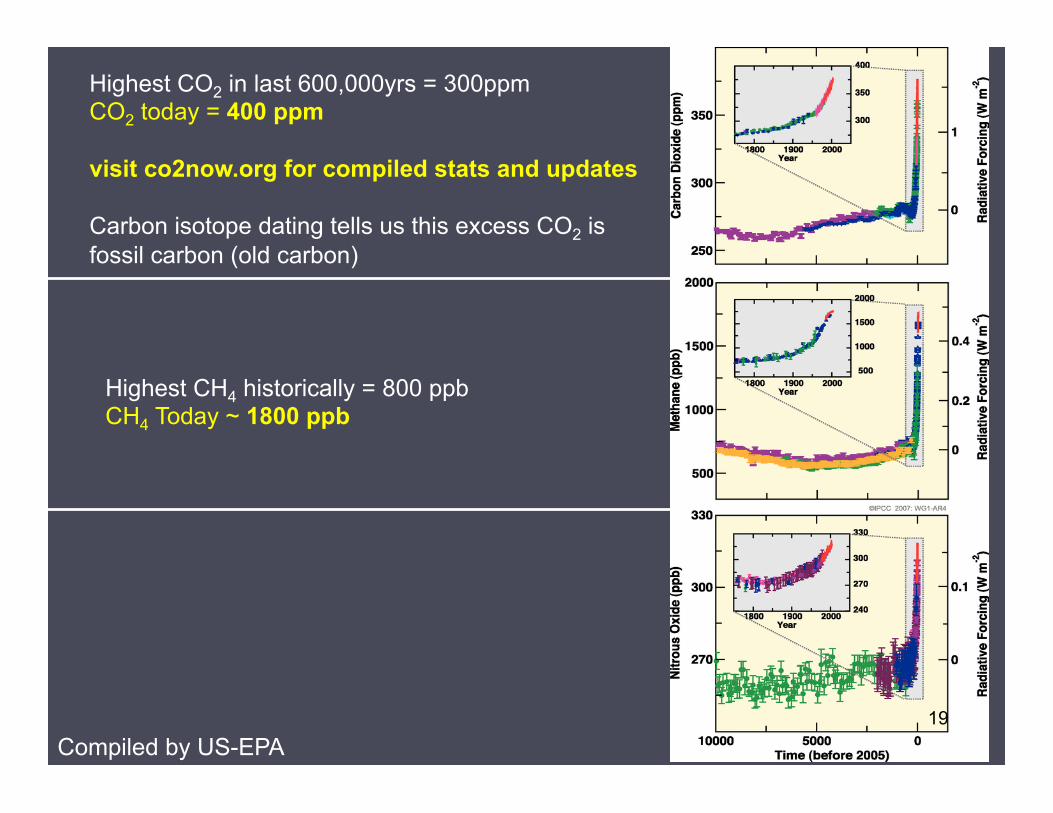
Highest CO2 in last 600,000yrs = 300ppm CO2 today = 400 ppm visit co2now.org for compiled stats and updates Carbon isotope dating tells us this excess CO2 is fossil carbon (old carbon)
Highest CH4 historically = 800 ppb CH4 Today ~ 1800 ppb
Compiled by US-EPA 19
CO2 is the dominant anthropogenic GHG that we are changing. It also has a natural emission and uptake cycle. Let’s explore further……
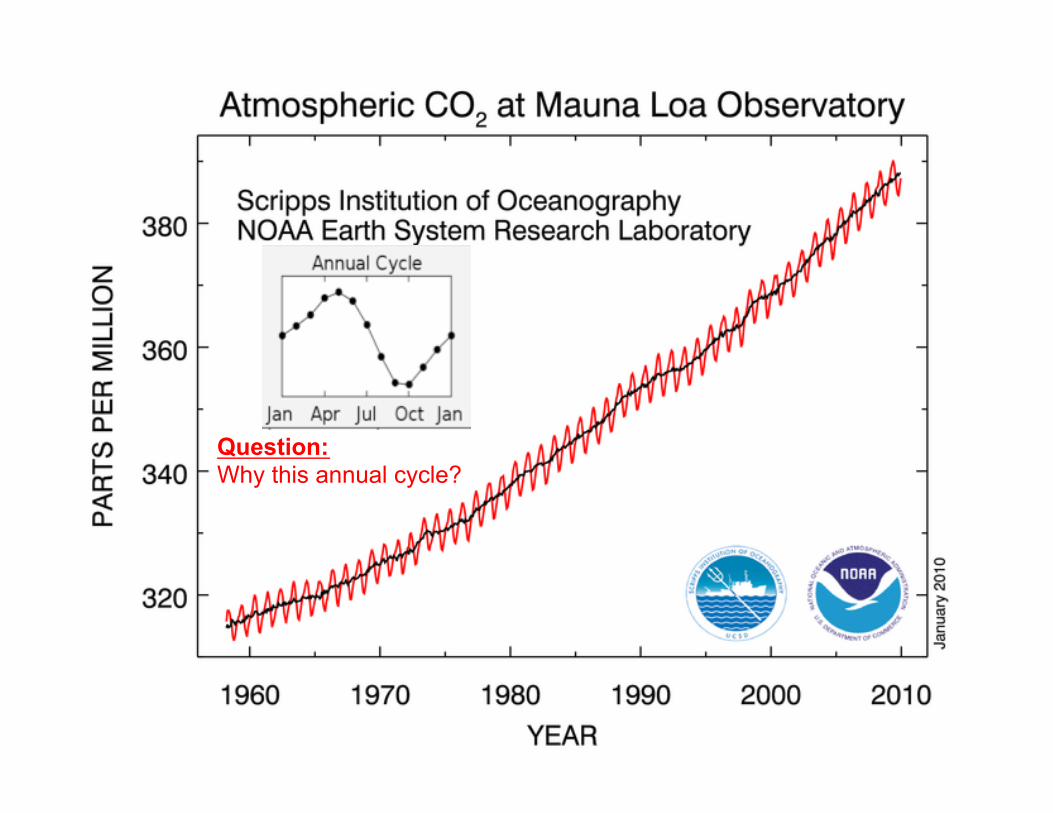
Question: Why this annual cycle?
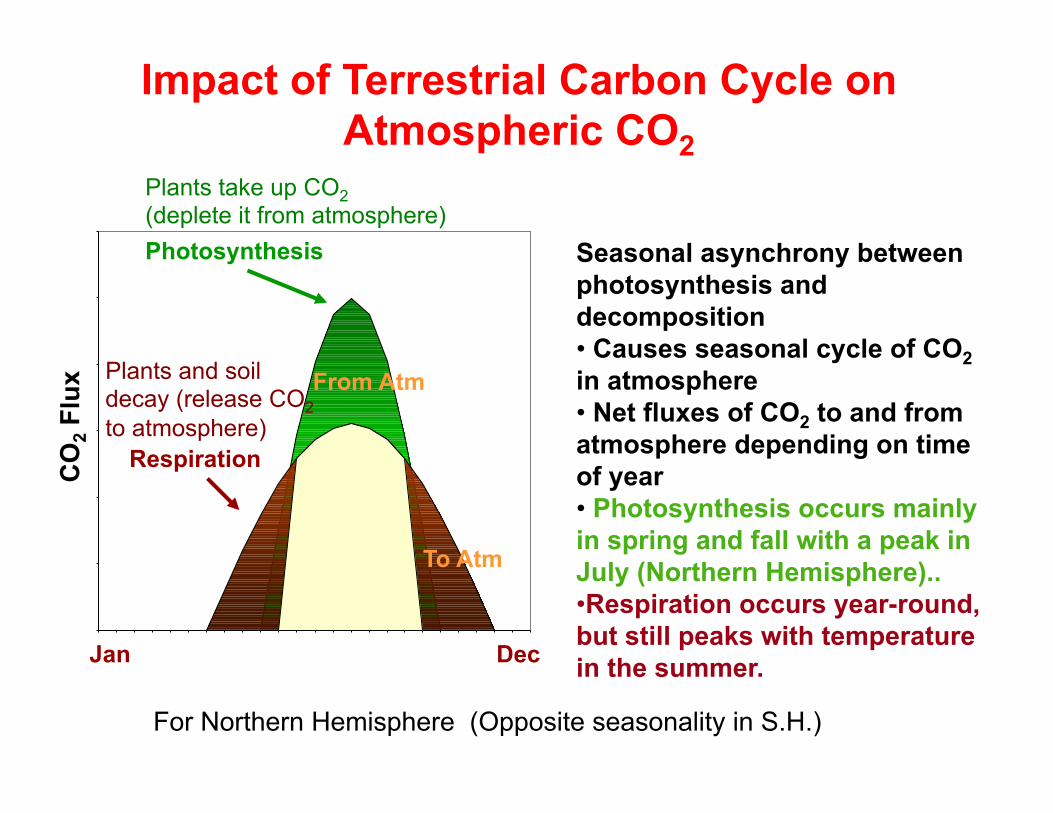
Seasonal asynchrony between photosynthesis and decomposition • Causes seasonal cycle of CO2 in atmosphere • Net fluxes of CO2 to and from atmosphere depending on time of year • Photosynthesis occurs mainly in spring and fall with a peak in July (Northern Hemisphere).. • Respiration occurs year-round, but still peaks with temperature in the summer.
Impact of Terrestrial Carbon Cycle on Atmospheric CO2
For Northern Hemisphere (Opposite seasonality in S.H.)
0.00
0.20
0.40
0.60
0.80
1.00
1.20
1 2 3 4 5 6 7 8 9 10 11 12 13 14 15 16 17 18 19 20 21 22 23 24 25Jan Dec
From Atm
To Atm
CO
2 Flu
x
Photosynthesis
Respiration
Plants take up CO2 (deplete it from atmosphere)
Plants and soil decay (release CO2 to atmosphere)
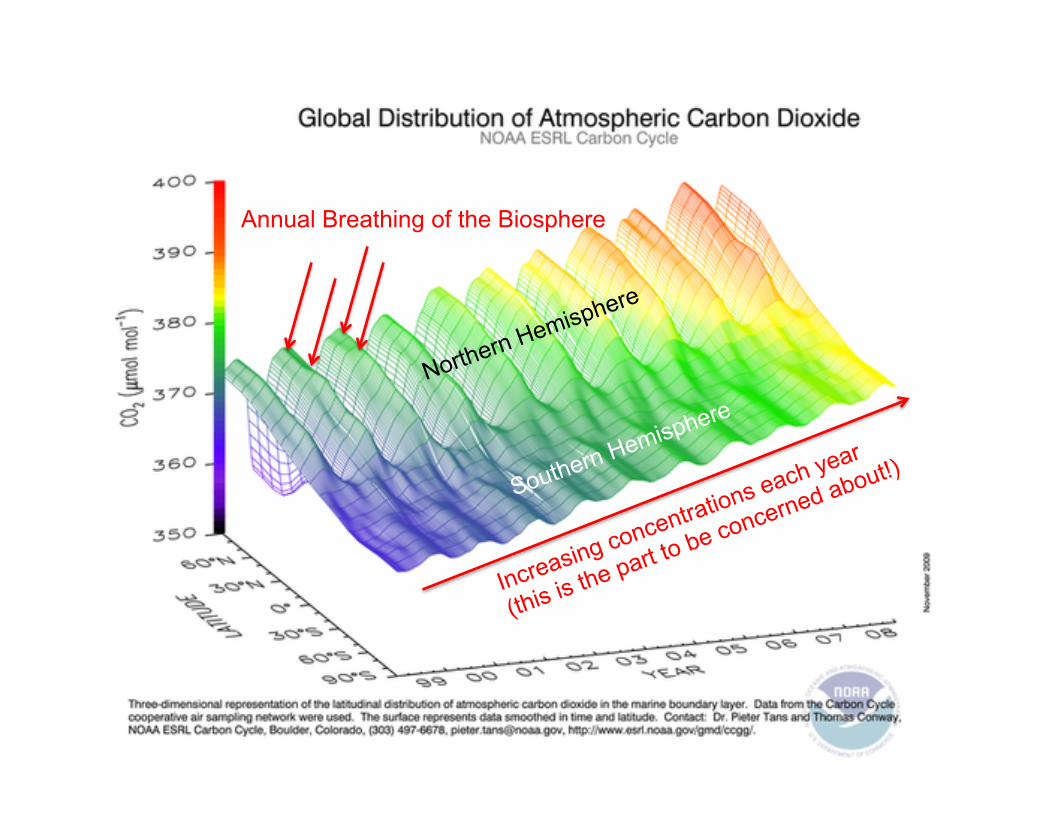
Annual Breathing of the Biosphere
Global CO2 cycle for 1 year (video link)
http://www.nasa.gov/press/goddard/2014/november/nasa-computer-
model-provides-a-new-portrait-of-carbon-dioxide/#.VNuF8i7F-l6
How fast is CO2 rising?
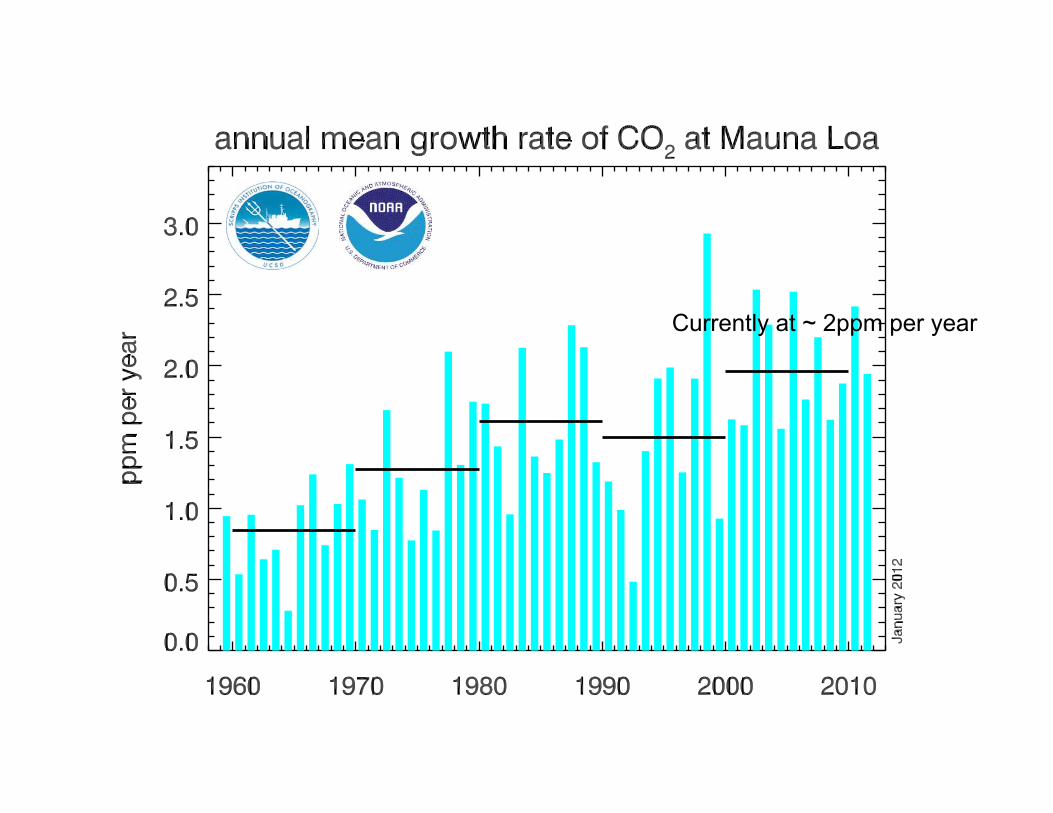
Currently at ~ 2ppm per year
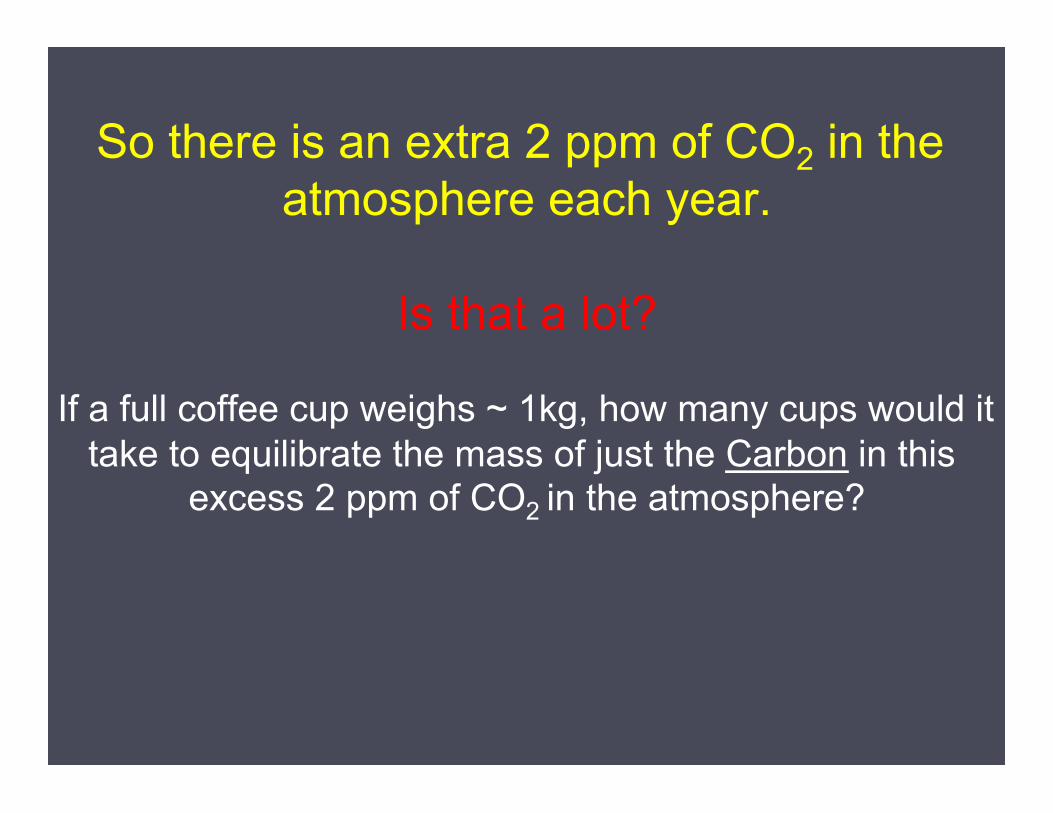
So there is an extra 2 ppm of CO2 in the atmosphere each year.
Is that a lot?
If a full coffee cup weighs ~ 1kg, how many cups would it
take to equilibrate the mass of just the Carbon in this excess 2 ppm of CO2 in the atmosphere?
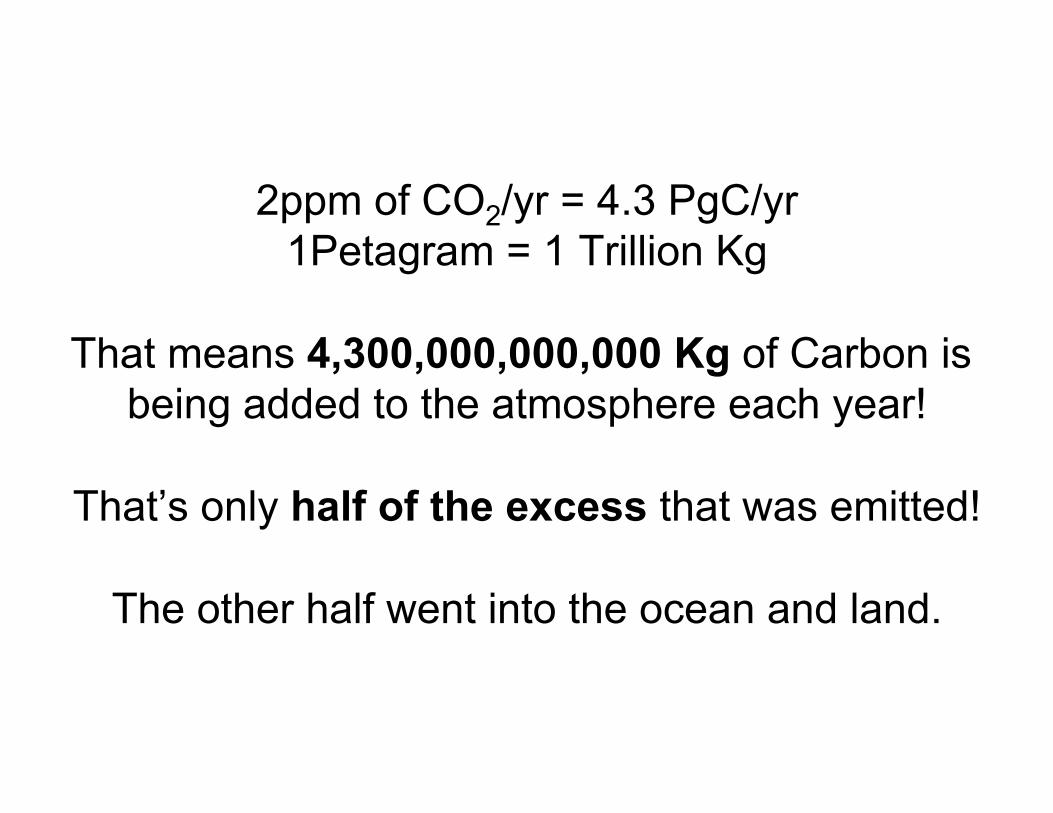
2ppm of CO2/yr = 4.3 PgC/yr 1Petagram = 1 Trillion Kg
That means 4,300,000,000,000 Kg of Carbon is
being added to the atmosphere each year!
That’s only half of the excess that was emitted!
The other half went into the ocean and land.
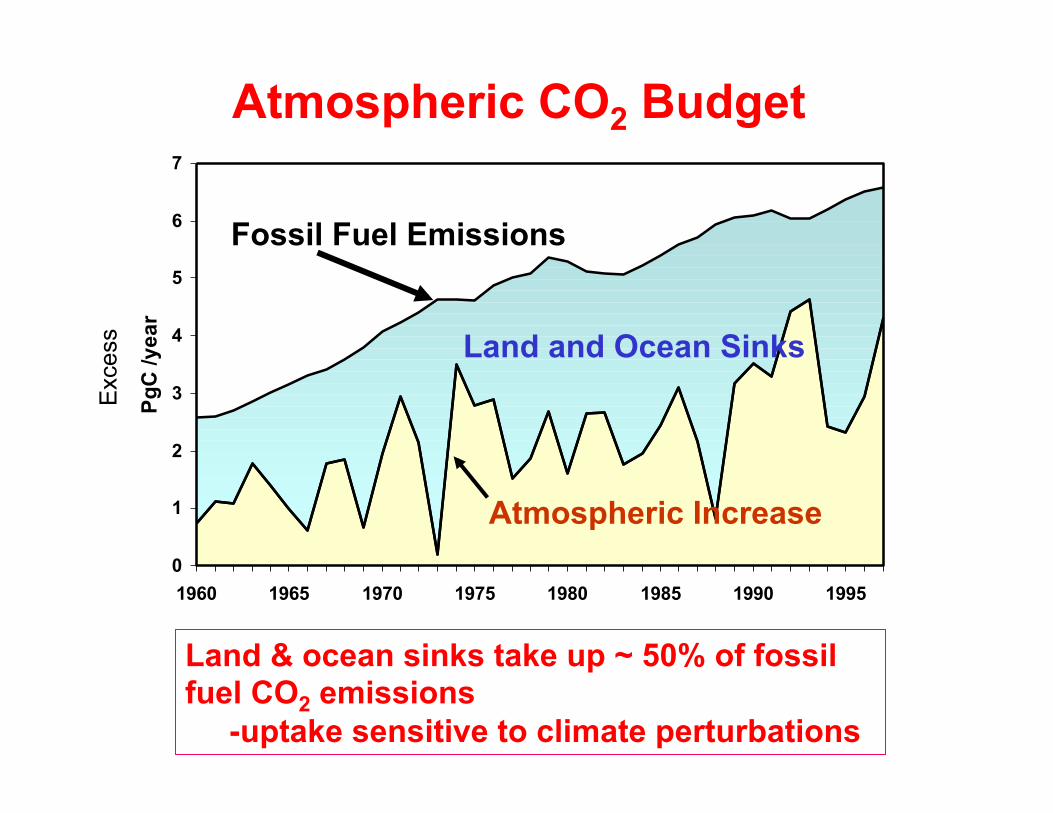
Atmospheric CO2 Budget
0
1
2
3
4
5
6
7
1960 1965 1970 1975 1980 1985 1990 1995
PgC
/yea
r
Atmospheric Increase
Fossil Fuel Emissions
Land and Ocean Sinks
Land & ocean sinks take up ~ 50% of fossil fuel CO2 emissions -uptake sensitive to climate perturbations
Exc
ess
Where is the excess CO2 coming from?
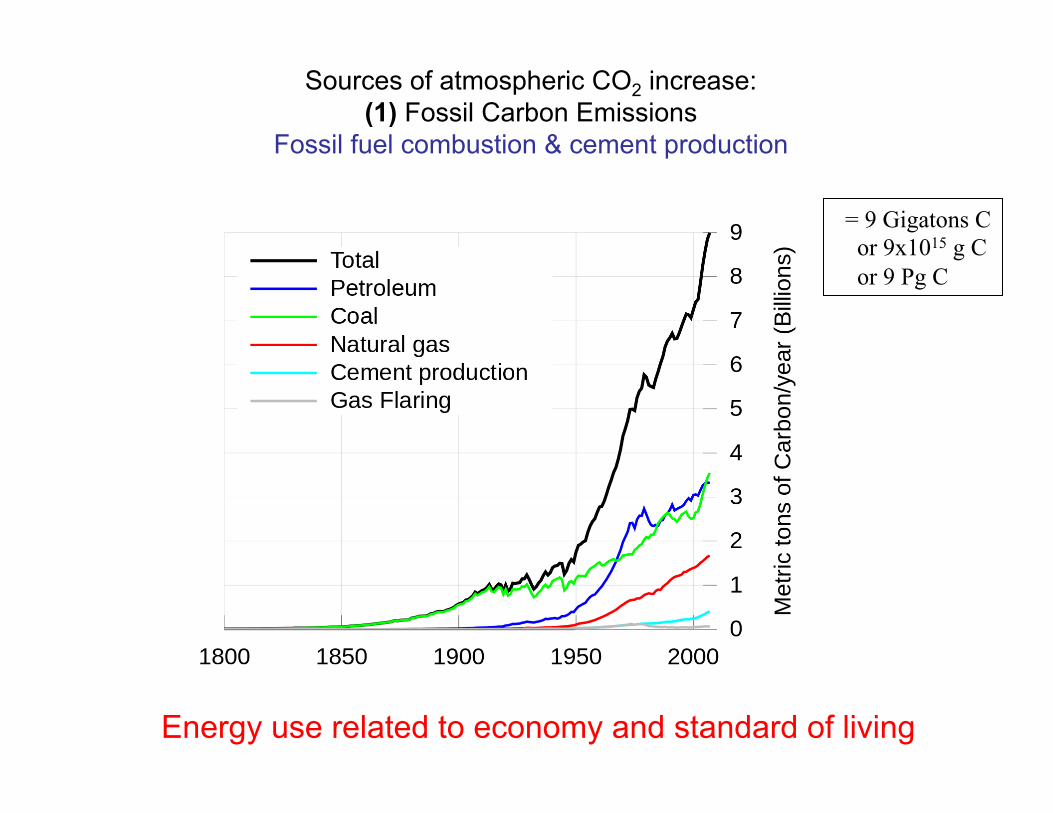
Sources of atmospheric CO2 increase: (1) Fossil Carbon Emissions
Fossil fuel combustion & cement production
Energy use related to economy and standard of living
= 9 Gigatons C or 9x10¹⁵ g C or 9 Pg C
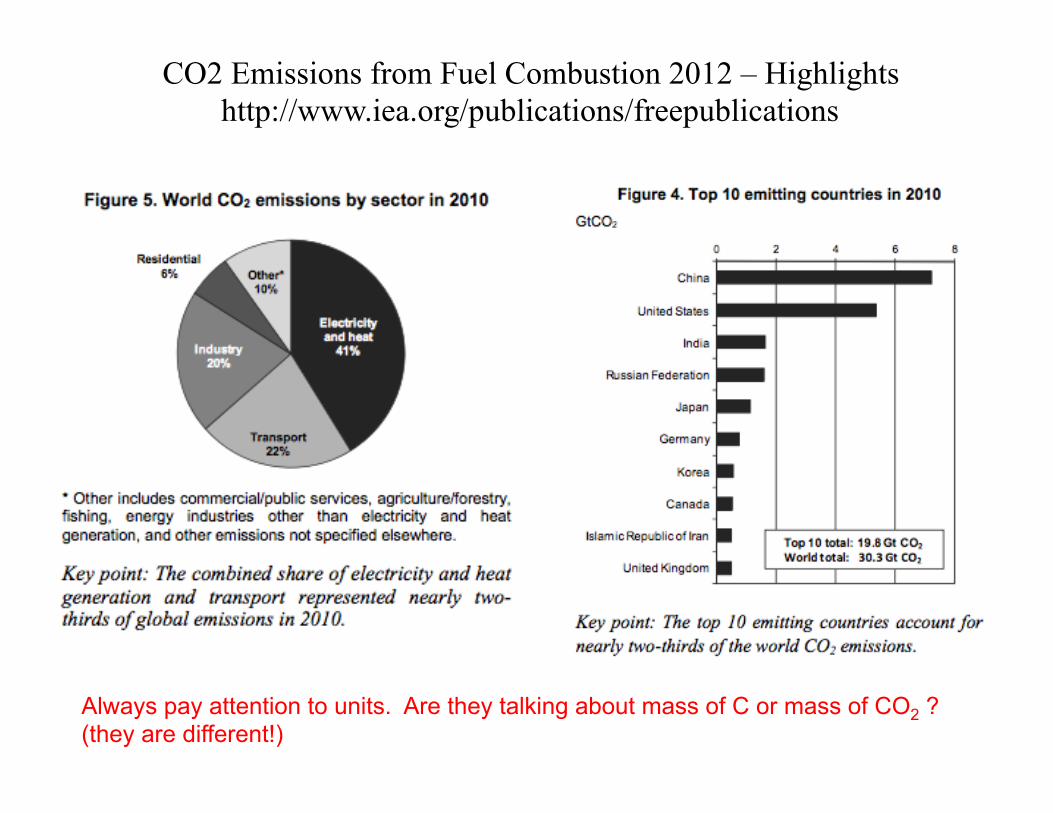
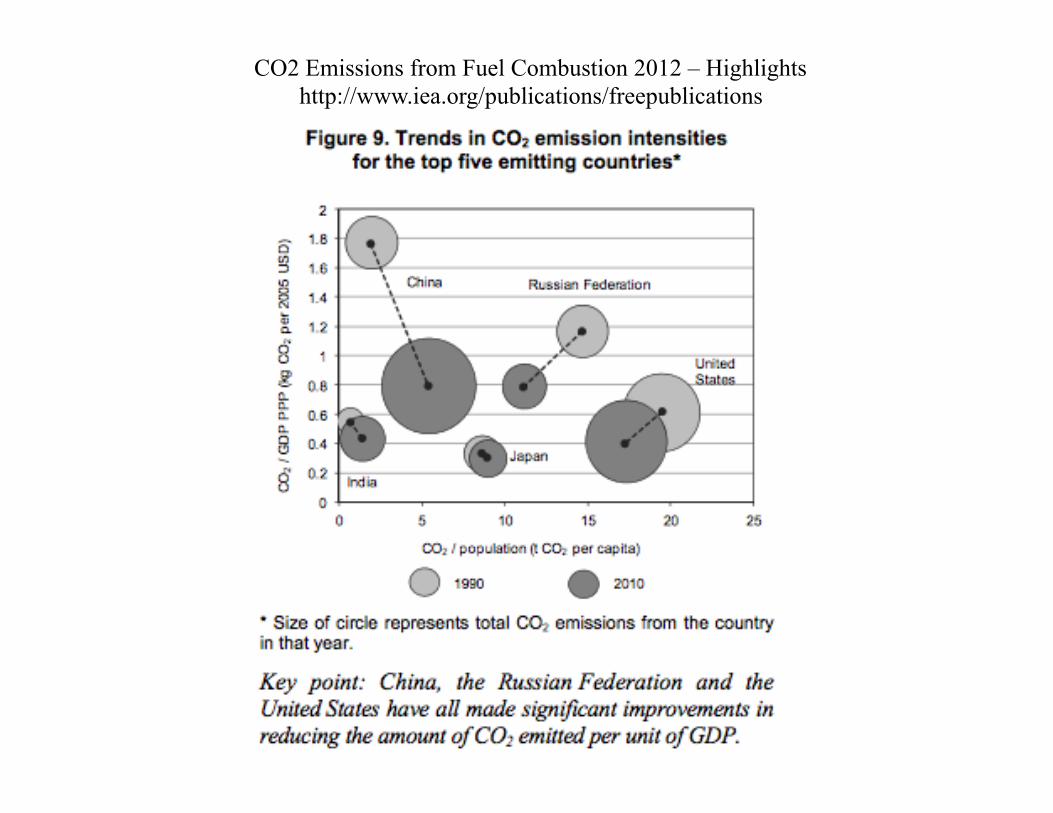
CO2 Emissions from Fuel Combustion 2012 – Highlights http://www.iea.org/publications/freepublications
Always pay attention to units. Are they talking about mass of C or mass of CO2 ? (they are different!)
CO2 Emissions from Fuel Combustion 2012 – Highlights http://www.iea.org/publications/freepublications
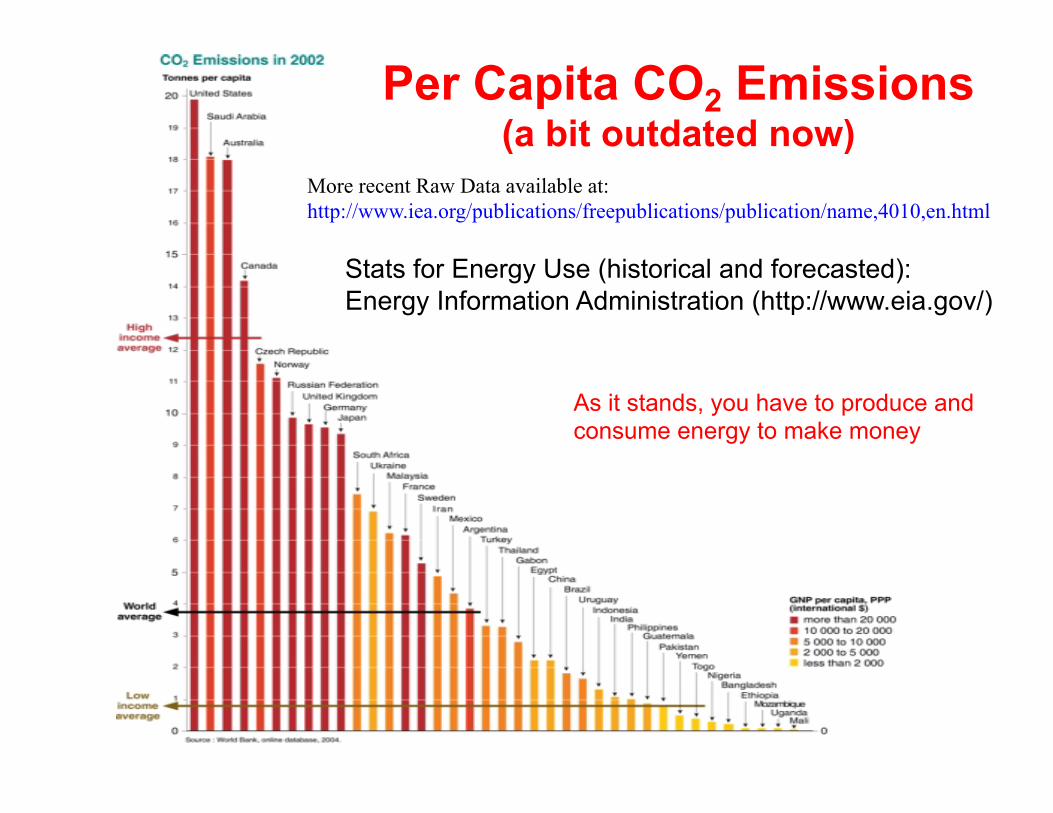
Per Capita CO2 Emissions (a bit outdated now)
More recent Raw Data available at: http://www.iea.org/publications/freepublications/publication/name,4010,en.html
Stats for Energy Use (historical and forecasted): Energy Information Administration (http://www.eia.gov/)
As it stands, you have to produce and consume energy to make money
35
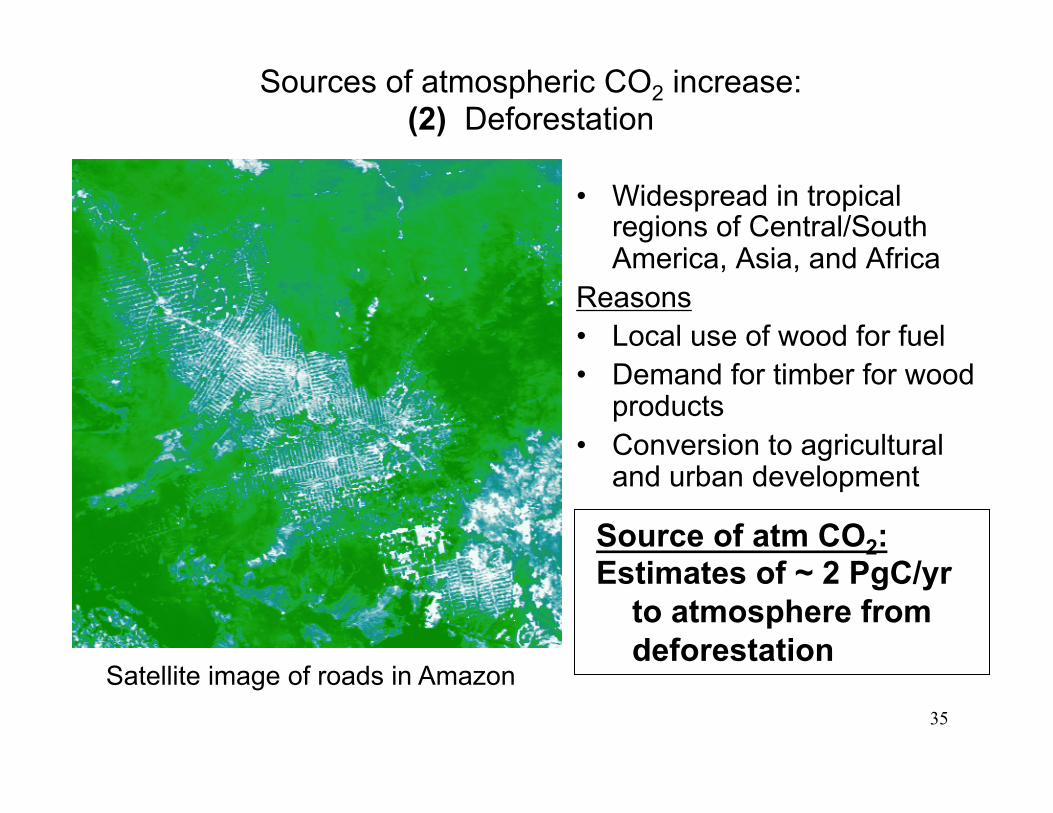
Sources of atmospheric CO2 increase: (2) Deforestation
Satellite image of roads in Amazon
• Widespread in tropical regions of Central/South America, Asia, and Africa
Reasons • Local use of wood for fuel • Demand for timber for wood
products • Conversion to agricultural
and urban development
Source of atm CO2: Estimates of ~ 2 PgC/yr
to atmosphere from deforestation
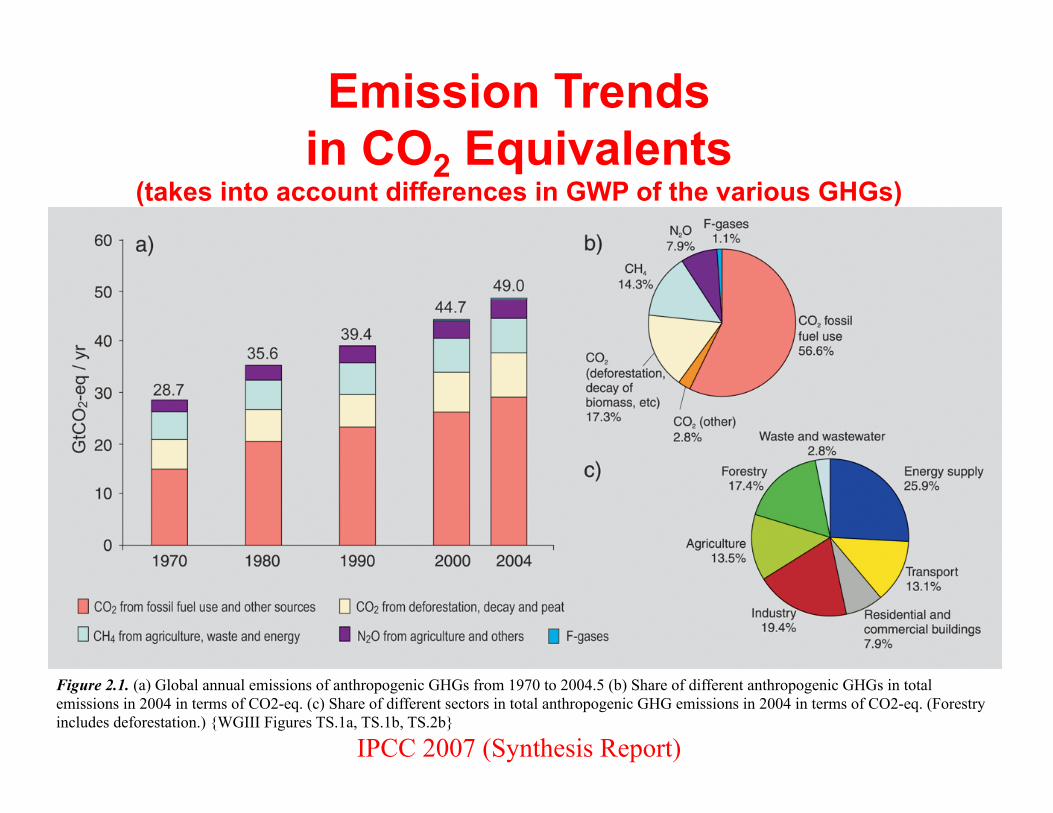
Emission Trends in CO2 Equivalents
(takes into account differences in GWP of the various GHGs)
IPCC 2007 (Synthesis Report)
Figure 2.1. (a) Global annual emissions of anthropogenic GHGs from 1970 to 2004.5 (b) Share of different anthropogenic GHGs in total emissions in 2004 in terms of CO2-eq. (c) Share of different sectors in total anthropogenic GHG emissions in 2004 in terms of CO2-eq. (Forestry includes deforestation.) {WGIII Figures TS.1a, TS.1b, TS.2b}
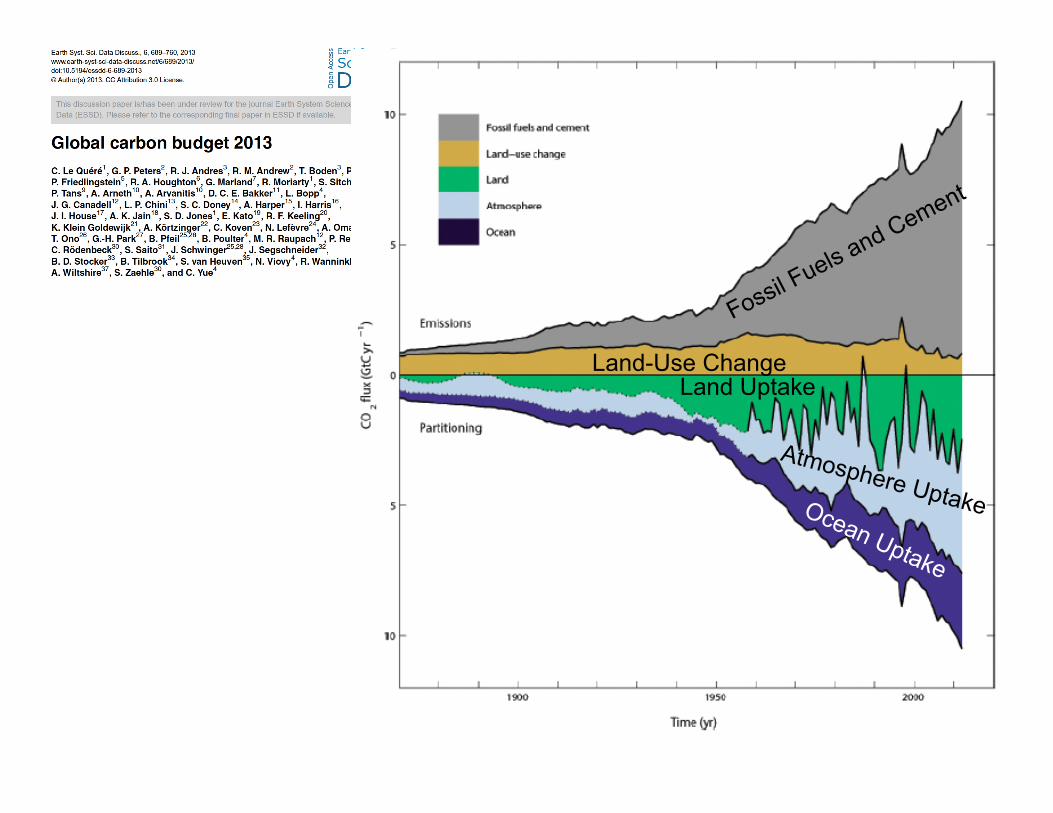
Land-Use Change Land Uptake
Atmosphere Uptake
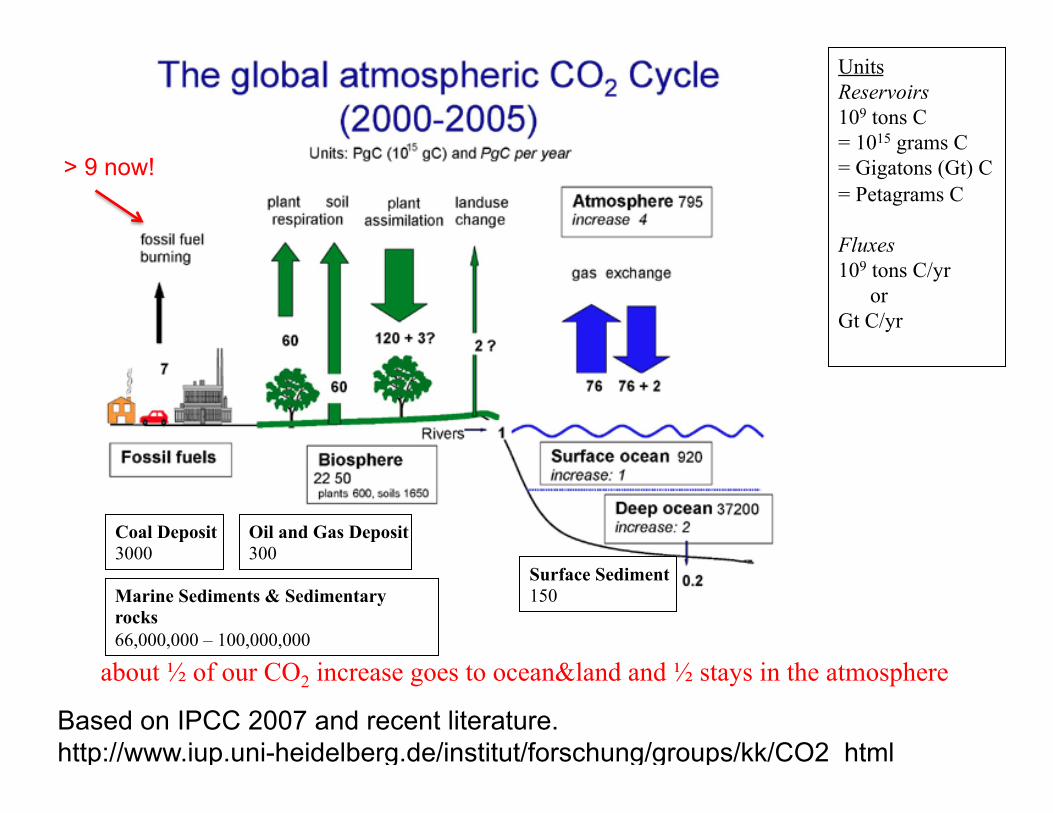
Based on IPCC 2007 and recent literature. http://www.iup.uni-heidelberg.de/institut/forschung/groups/kk/CO2_html
Surface Sediment 150
Coal Deposit 3000
Oil and Gas Deposit 300
Marine Sediments & Sedimentary rocks 66,000,000 – 100,000,000
Units Reservoirs 109 tons C = 1015 grams C = Gigatons (Gt) C = Petagrams C Fluxes 109 tons C/yr or Gt C/yr
about ½ of our CO2 increase goes to ocean&land and ½ stays in the atmosphere
> 9 now!
Ok, greenhouse gases are increasing, who gives a shit?
Besides, major changes won’t happen in my
lifetime, right?
Changes are already being observed, with major changes predicted by 2050.
4000
00
3000
00
2000
00
1000
00 0
3500
00
2500
00
1500
00
5000
0
Years Before Present
150
200
250
300
350
400
CO
2 (p
pmv)
-10
-5
0
5
10
-7.5
-2.5
2.5
7.5
Cha
nge
in T
empe
ratu
re (C
)
Today’s CO2 Concentration in the Atmosphere = 400 ppm Projected to be ~ 700 ppm by 2100
Vostok Ice Core Data and Mauna Loa Atmospheric Data (NOAA)
CO2 and Temperature relationship
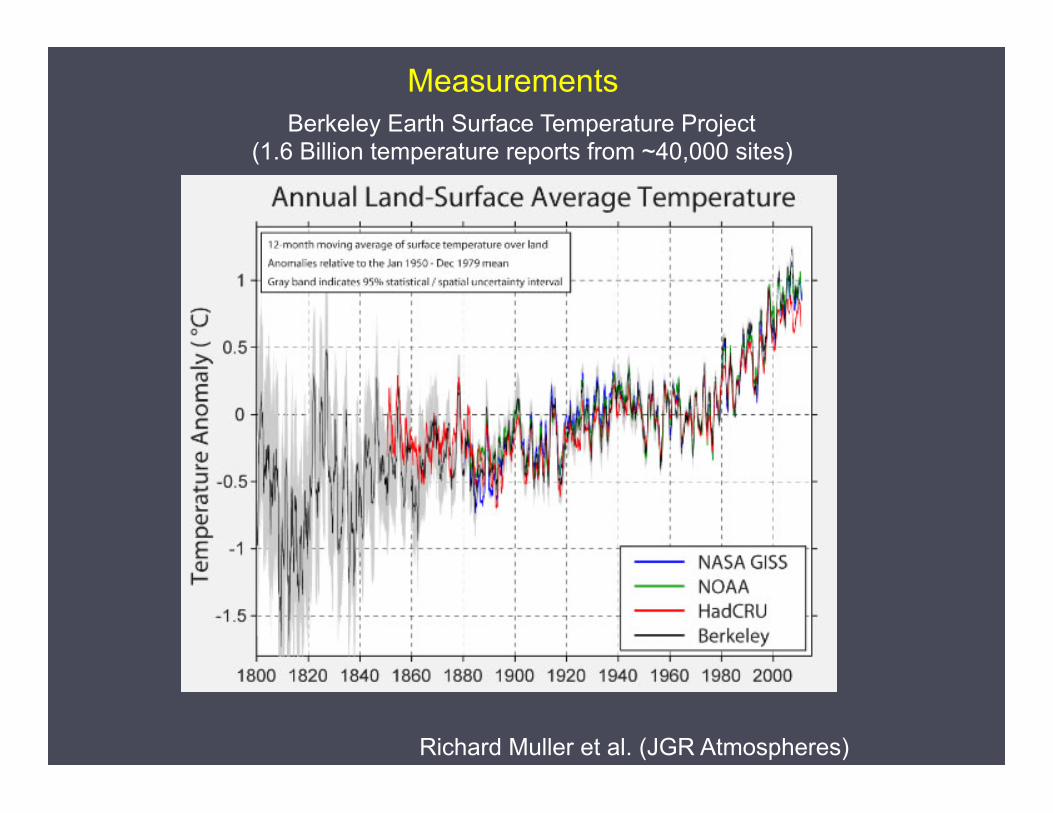
Berkeley Earth Surface Temperature Project (1.6 Billion temperature reports from ~40,000 sites)
Richard Muller et al. (JGR Atmospheres)
Measurements
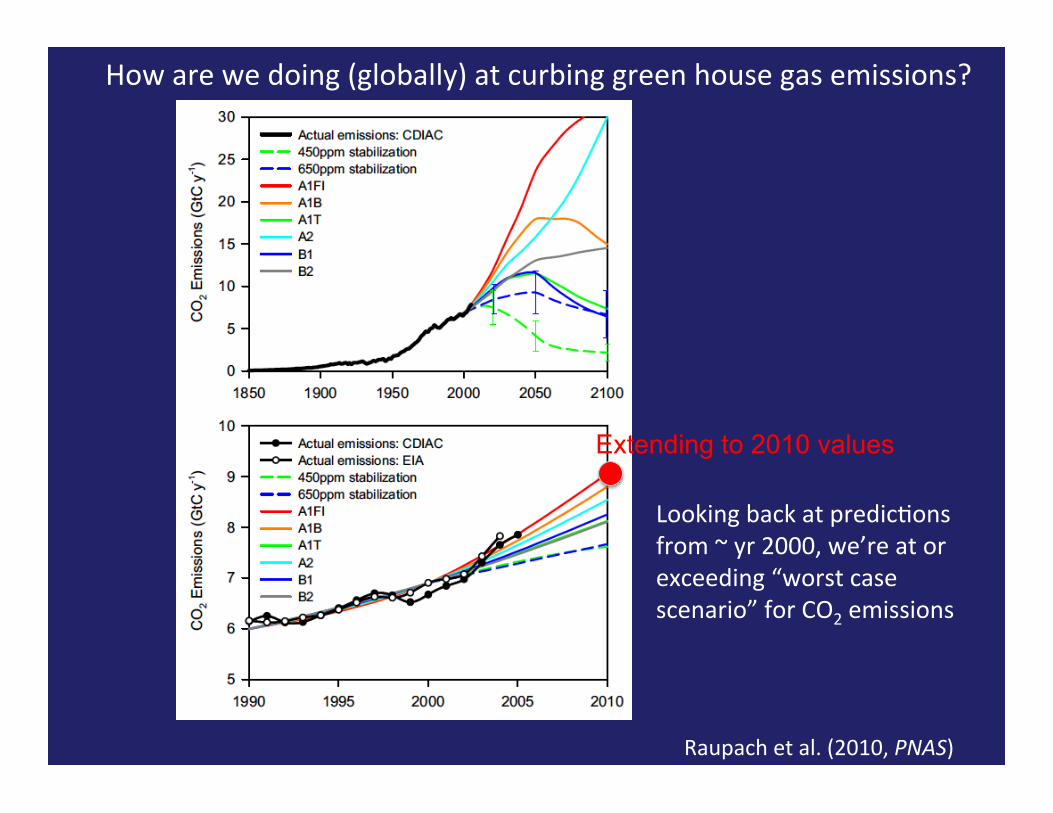
How are we doing (globally) at curbing green house gas emissions?
Raupach et al. (2010, PNAS)
Looking back at predicRons from ~ yr 2000, we’re at or exceeding “worst case scenario” for CO2 emissions
Extending to 2010 values
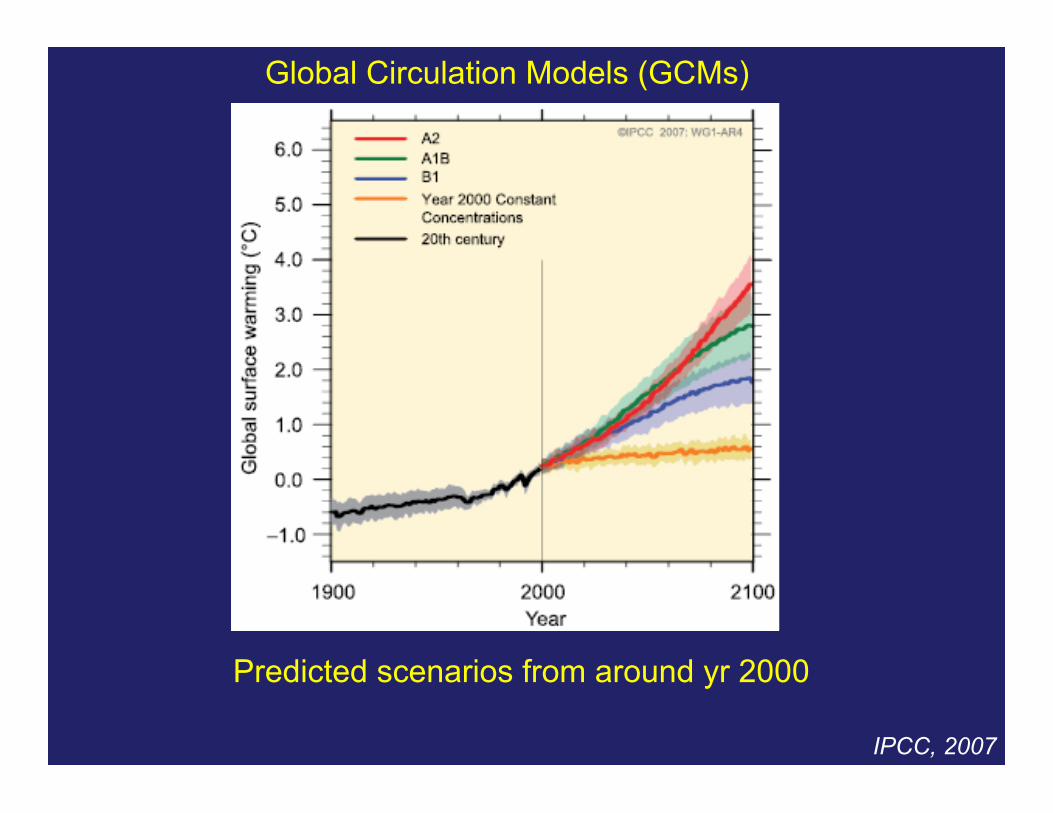
IPCC, 2007
Predicted scenarios from around yr 2000
Global Circulation Models (GCMs)
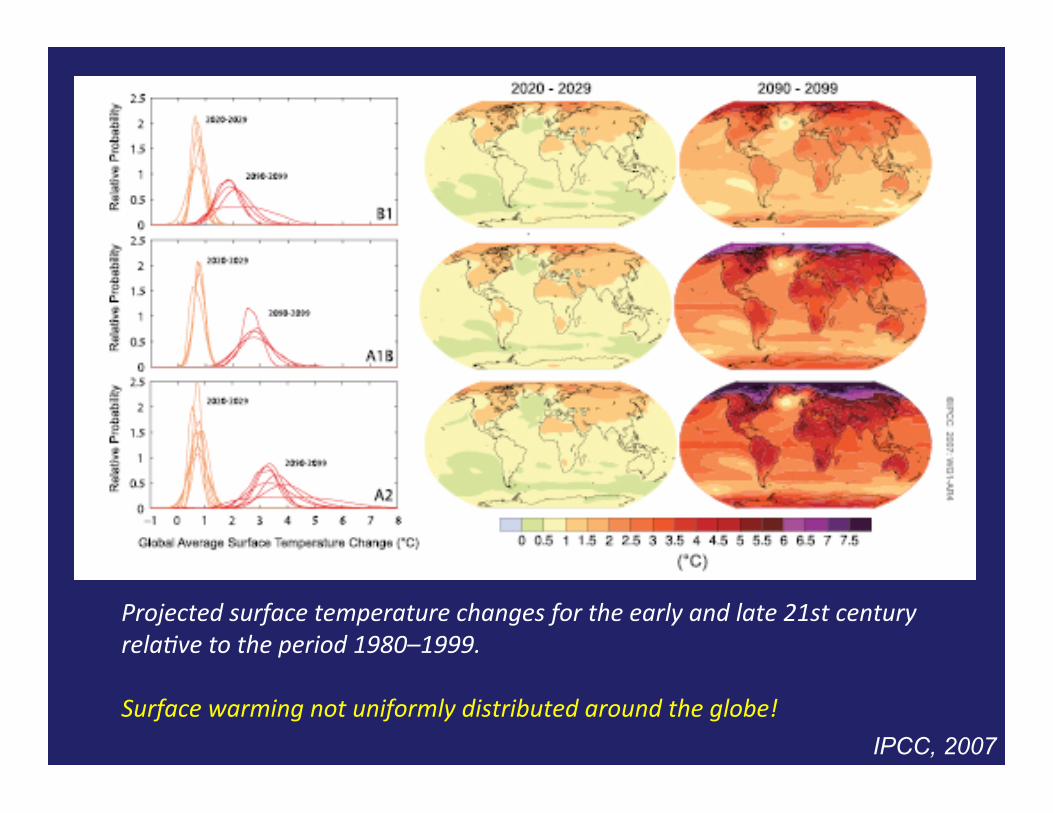
Projected surface temperature changes for the early and late 21st century rela:ve to the period 1980–1999. Surface warming not uniformly distributed around the globe!
IPCC, 2007
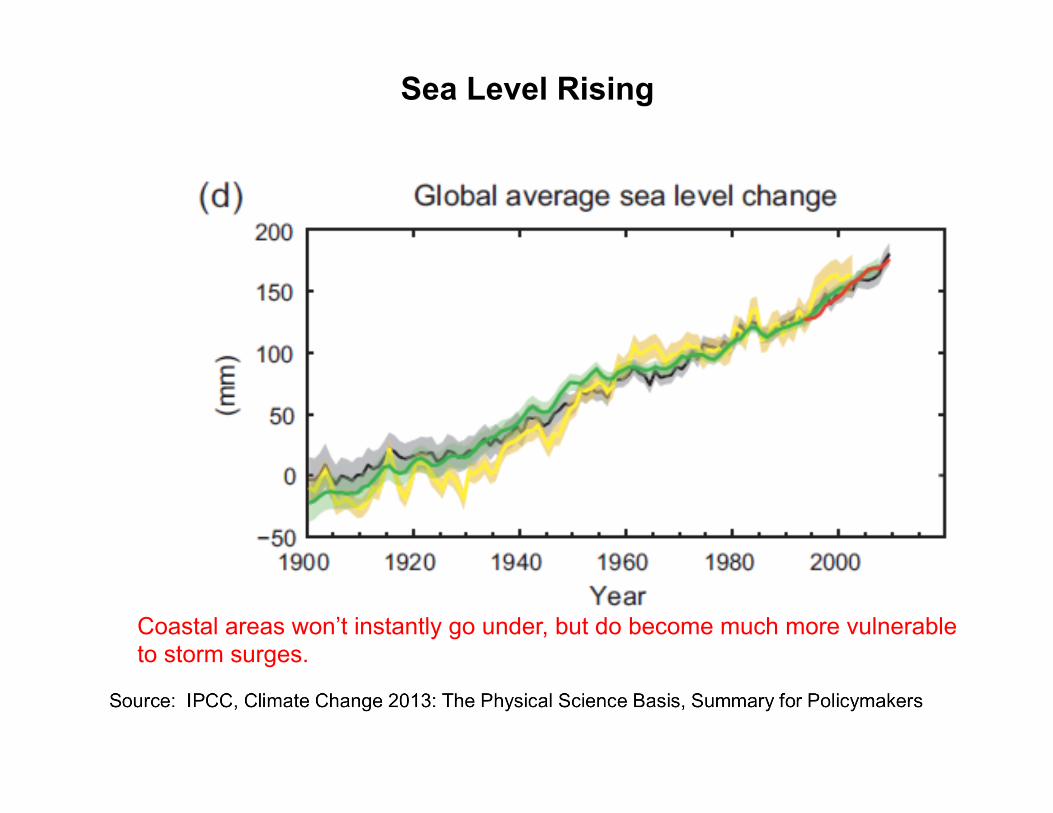
Sea Level Rising
Coastal areas won’t instantly go under, but do become much more vulnerable to storm surges.
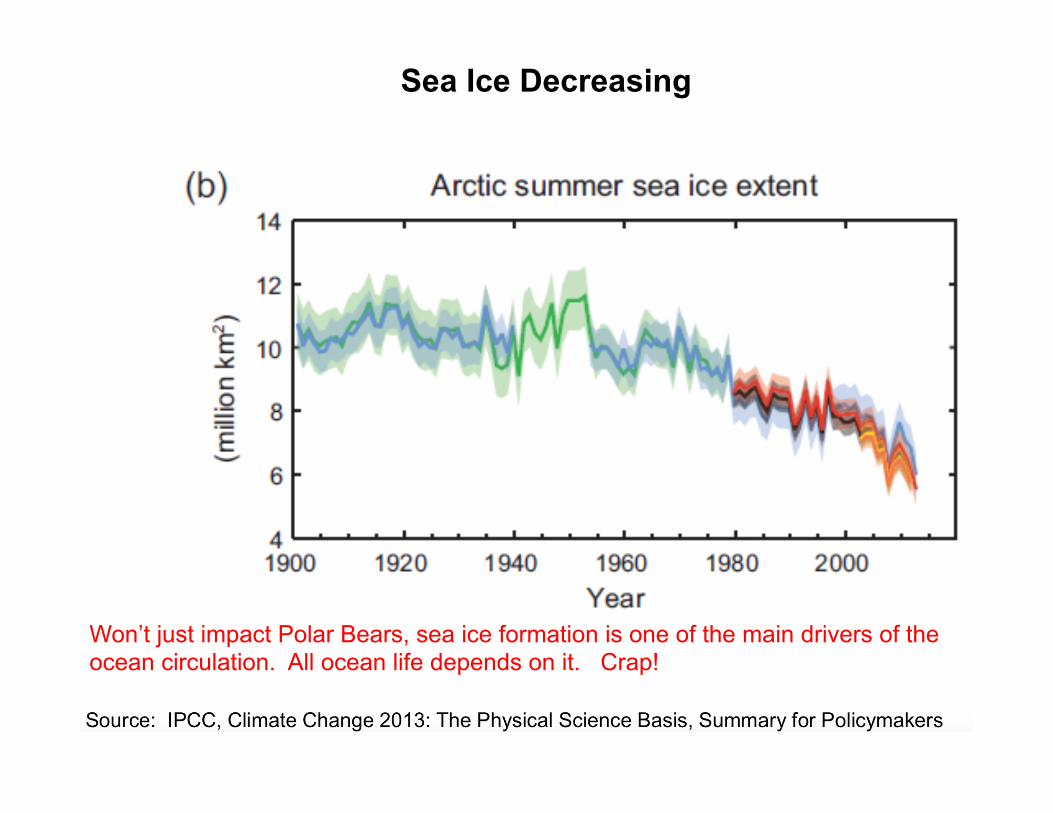
Sea Ice Decreasing
Won’t just impact Polar Bears, sea ice formation is one of the main drivers of the ocean circulation. All ocean life depends on it. Crap!
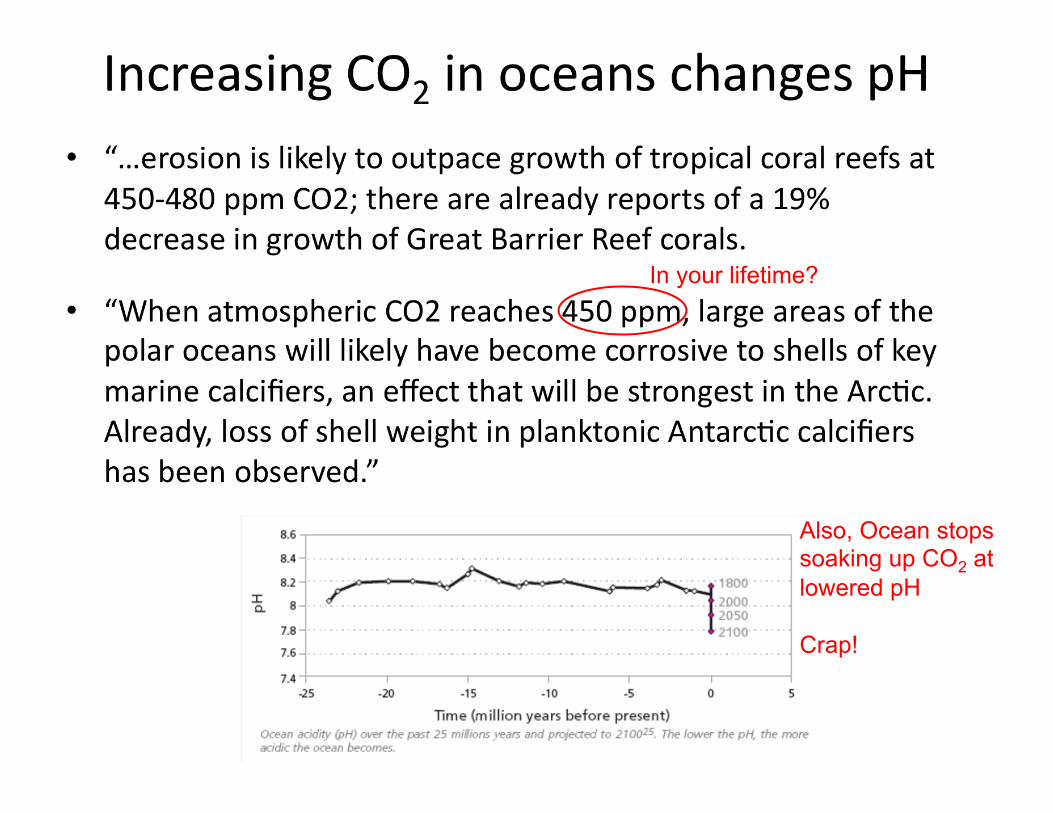
Also, Ocean stops soaking up CO2 at lowered pH Crap!
In your lifetime?

A final part of the puzzle that I spend my days thinking about…..

IPCC, 2013
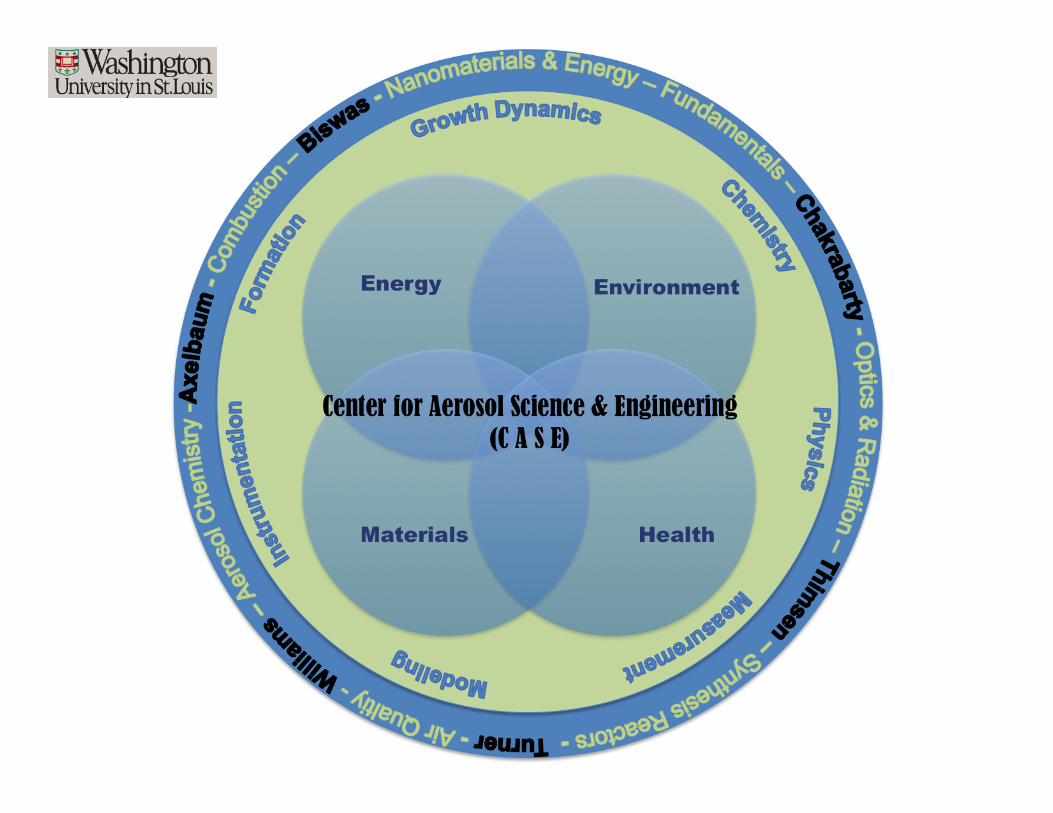
What are Aerosols and how do they impact climate?
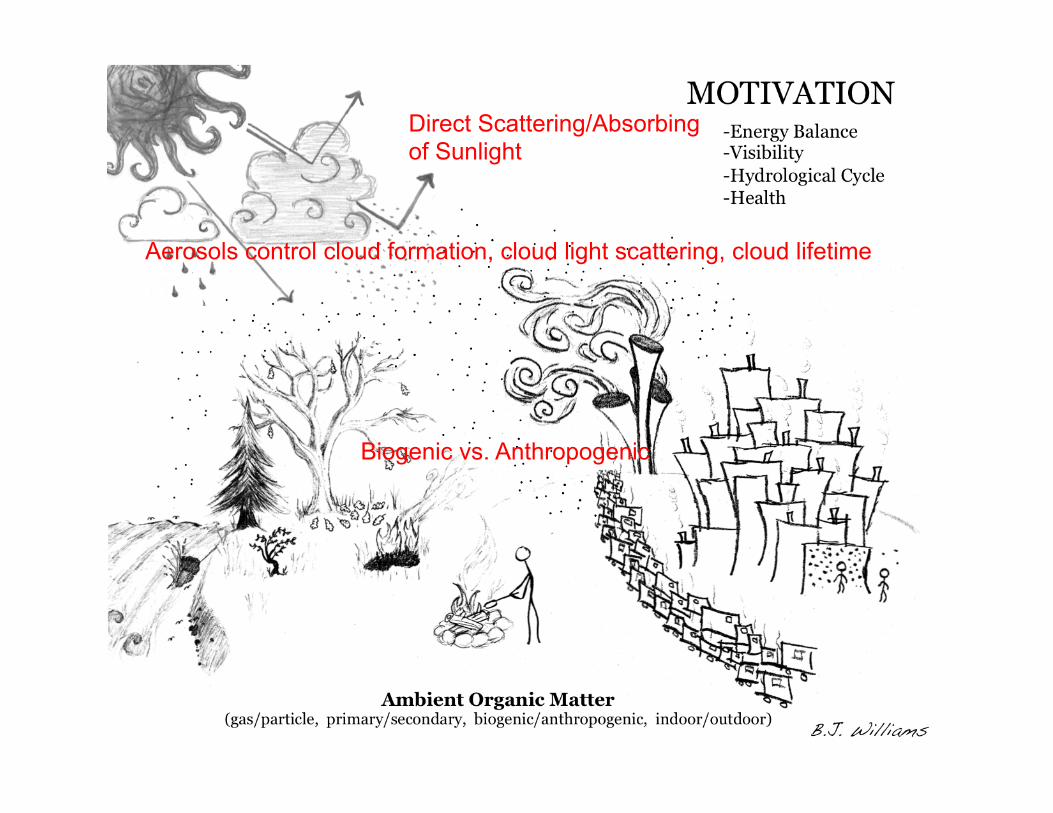
Aerosols control cloud formation, cloud light scattering, cloud lifetime
Biogenic vs. Anthropogenic
Direct Scattering/Absorbing of Sunlight
http://gmao.gsfc.nasa.gov/research/aerosol/modeling/nr1_movie/
A year worth of Aerosol Emissions
There are a lot of interesting engineering ideas on what we can do to limit our influence on climate change. (examples) Lowering GHG emissions:
-Renewable energy sources -Improve efficiency -Capture and sequester carbon -Convert and reuse carbon
Geoengineering: Methods to force planetary cooling, many involve intentionally increasing reflective particles and/or clouds. Dangers of unintentional feedbacks!
You intelligent students need to figure it out, and start now!