
Primary energy supply and conversions to energy carriers
21
PRIMARY ENERGY SUPPLY AND CONVERSIONS TO ENERGY CARRIERS Professor em. Björn Kjellström Heat and Power Technology Royal Institute of Technology Stockholm
Transcript of Primary energy supply and conversions to energy carriers
PRIMARY ENERGY SUPPLY AND CONVERSIONS TO
ENERGY CARRIERS
Professor em. Björn Kjellström
Heat and Power Technology Royal Institute of Technology
Stockholm

NOMENCLATURE c speed of light cp specific heat at constant pressure cv specific heat at constant volume F force g acceleration of gravity h specific enthalpy H heating value I electric current m mass p pressure P power Q thermal energy, heat t time T temperature u specific internal energy v specific volume = 1/ρ V electric tension w velocity W energy, general x distance y parameter defining physical state z vertical distance η energy efficiency ρ density Subscripts el electricity fuel fuel heat useful heat loss loss marg marginal th thermal LIST OF ABBREVIATIONS bbl 109 barrels (billion barrels) cap capita GNP Gross national product lb pound (1 lb = 0,454 kg) LNG Liquefied Natural Gas LPG Liquefied Petroleum Gas (mainly propane and butane) SEK Swedish crown USD US Dollar
1
1. INTRODUCTION
1.1 Scope of these notes The objective of the notes is to give an introduction to the current issues of energy engineering with a focus on the role of energy supply for development of the human societies. Technical issues are treated only to the extent that this is necessary for understanding of the limitations and potential of the current technologies. These notes present current estimates of the potential of the different energy sources that are being used for supply of technical energy to human societies and includes a review of various processes that are or may be used for conversion of primary energy from these sources to energy carriers.
Definitions In section 1.6 of the lecture notes “Energy for human societies”, energy sources and energy carriers were defined. A distinction was made between “Finite” energy sources and “Continuous” or “Renewable” energy sources but it was made clear that the distinction is not quite clear. Finite energy sources will be defined as those that are stored on our planet and regenerated at a rate that is many orders of magnitude less than the present rate of use. The fossil fuels i.e. natural gas, oil, different types of coal, peat and uranium will then belong to this group. Renewable energy sources are those that can be assumed to be available for as long as there is human life on this planet. Solar radiation energy and energy that is continuously generated by solar radiation like wind energy, wave energy, potential energy in water located above ocean level and biomass belong to this group and so does tidal energy and geothermal energy.
Difficulties involved in resource estimates An important issue discussed in these notes is the amount of energy that can be utilised from any given energy source. For finite energy sources this would be the total amount of the particular type that is presently stored on or in this planet expressed for instance in TWh. For renewable energy sources, the potential would rather be expressed as the maximum rate at which the energy source can be utilised, expressed for instance in terms of TWh/year. In both cases there are three fundamental difficulties. The first difficulty is simply lack of reliable data. The current knowledge about the deposits of fossil fuels and uranium is limited simply because complete geological surveys have not been carried out. Similarly, limitations in hydrological and meteorological data lead to uncertainties about energy potentials in solar radiation, wind, waves and hydropower. A distinction must therefore be made between proven
2
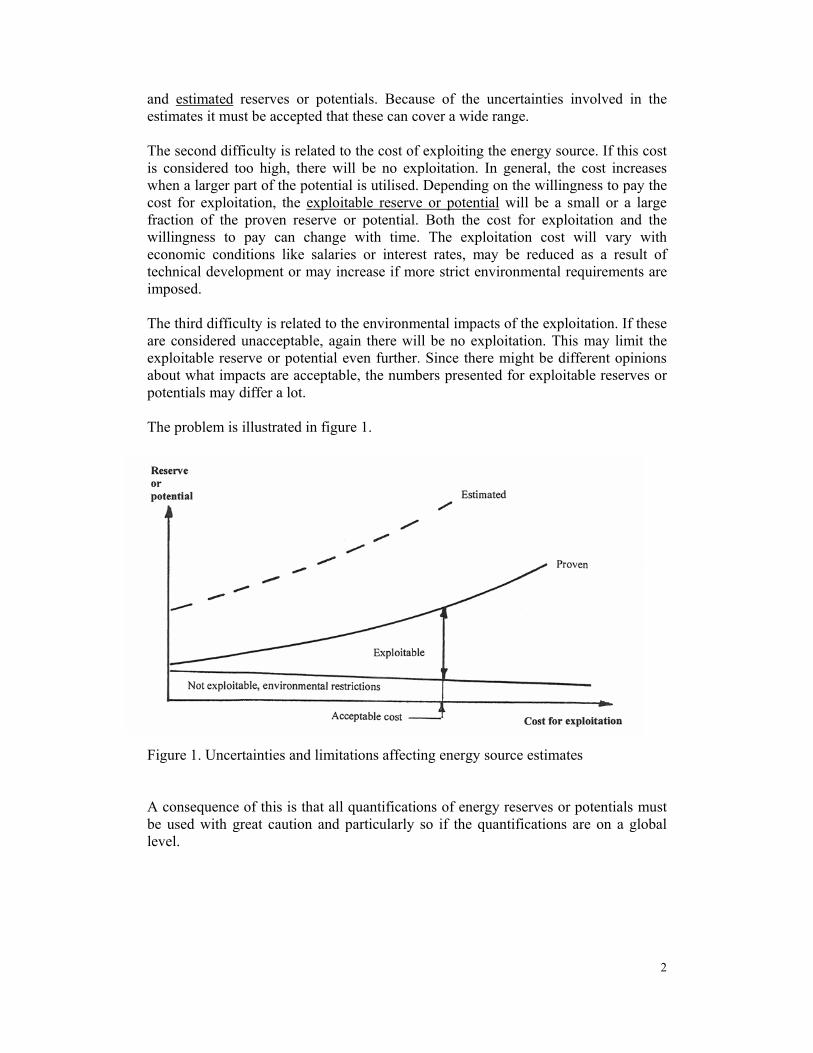
and estimated reserves or potentials. Because of the uncertainties involved in the estimates it must be accepted that these can cover a wide range. The second difficulty is related to the cost of exploiting the energy source. If this cost is considered too high, there will be no exploitation. In general, the cost increases when a larger part of the potential is utilised. Depending on the willingness to pay the cost for exploitation, the exploitable reserve or potential will be a small or a large fraction of the proven reserve or potential. Both the cost for exploitation and the willingness to pay can change with time. The exploitation cost will vary with economic conditions like salaries or interest rates, may be reduced as a result of technical development or may increase if more strict environmental requirements are imposed. The third difficulty is related to the environmental impacts of the exploitation. If these are considered unacceptable, again there will be no exploitation. This may limit the exploitable reserve or potential even further. Since there might be different opinions about what impacts are acceptable, the numbers presented for exploitable reserves or potentials may differ a lot. The problem is illustrated in figure 1. Figure 1. Uncertainties and limitations affecting energy source estimates A consequence of this is that all quantifications of energy reserves or potentials must be used with great caution and particularly so if the quantifications are on a global level.
3
2. RESERVES AND EXPLOITATION OF FOSSIL FUELS
General remarks Fossil fuels include coal, oil, natural gas and sometimes also peat. As indicated by the name, fossil fuels have been generated from the remains of plants and animals buried millions of years ago in swamps, lakes and seabeds. These materials, consisting mainly of carbon, hydrogen, oxygen, sulphur and some mineral matter were transformed by heat and pressure in the Earth´s crust into coal, oil and natural gas. There are several reasons why these fuels have had an increasing importance for the industrial and technological development during the last two centuries. The most important are: − Fossil fuels are relatively easily accessible in the Earth´s crust. They are available
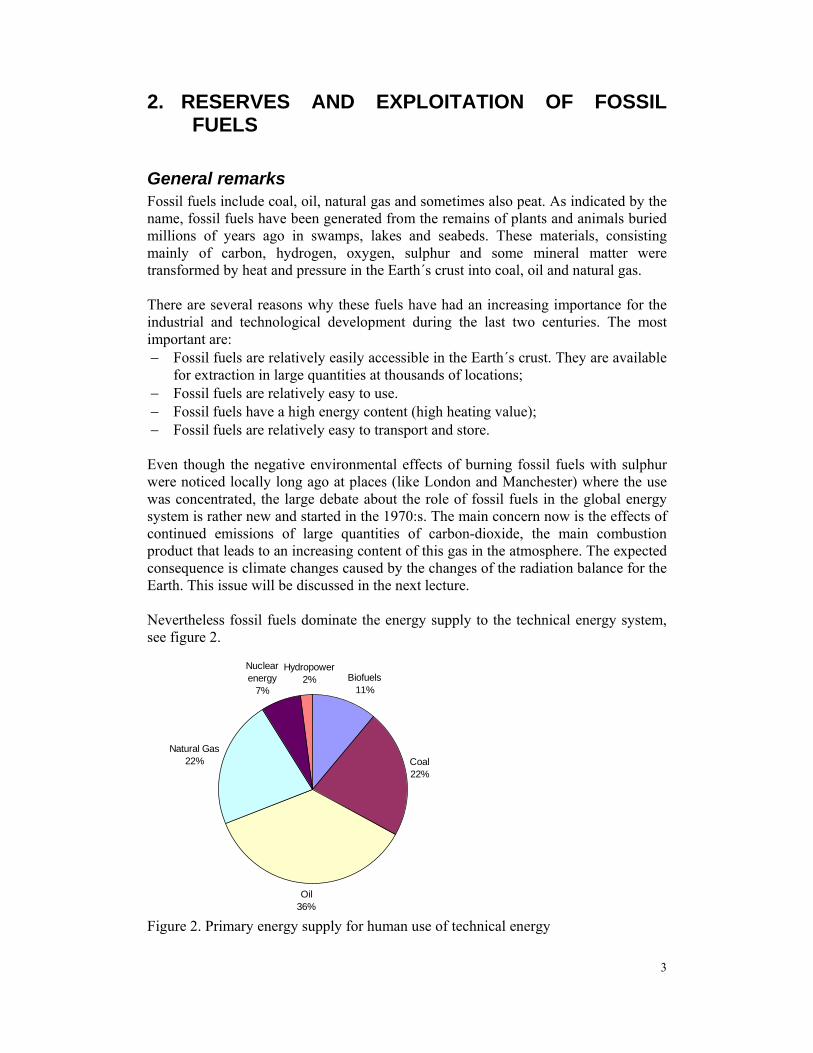
for extraction in large quantities at thousands of locations; − Fossil fuels are relatively easy to use. − Fossil fuels have a high energy content (high heating value); − Fossil fuels are relatively easy to transport and store. Even though the negative environmental effects of burning fossil fuels with sulphur were noticed locally long ago at places (like London and Manchester) where the use was concentrated, the large debate about the role of fossil fuels in the global energy system is rather new and started in the 1970:s. The main concern now is the effects of continued emissions of large quantities of carbon-dioxide, the main combustion product that leads to an increasing content of this gas in the atmosphere. The expected consequence is climate changes caused by the changes of the radiation balance for the Earth. This issue will be discussed in the next lecture. Nevertheless fossil fuels dominate the energy supply to the technical energy system, see figure 2.
Biofuels11%
Coal22%
Oil36%
Natural Gas22%
Nuclear energy
7%
Hydropower2%
Figure 2. Primary energy supply for human use of technical energy
4
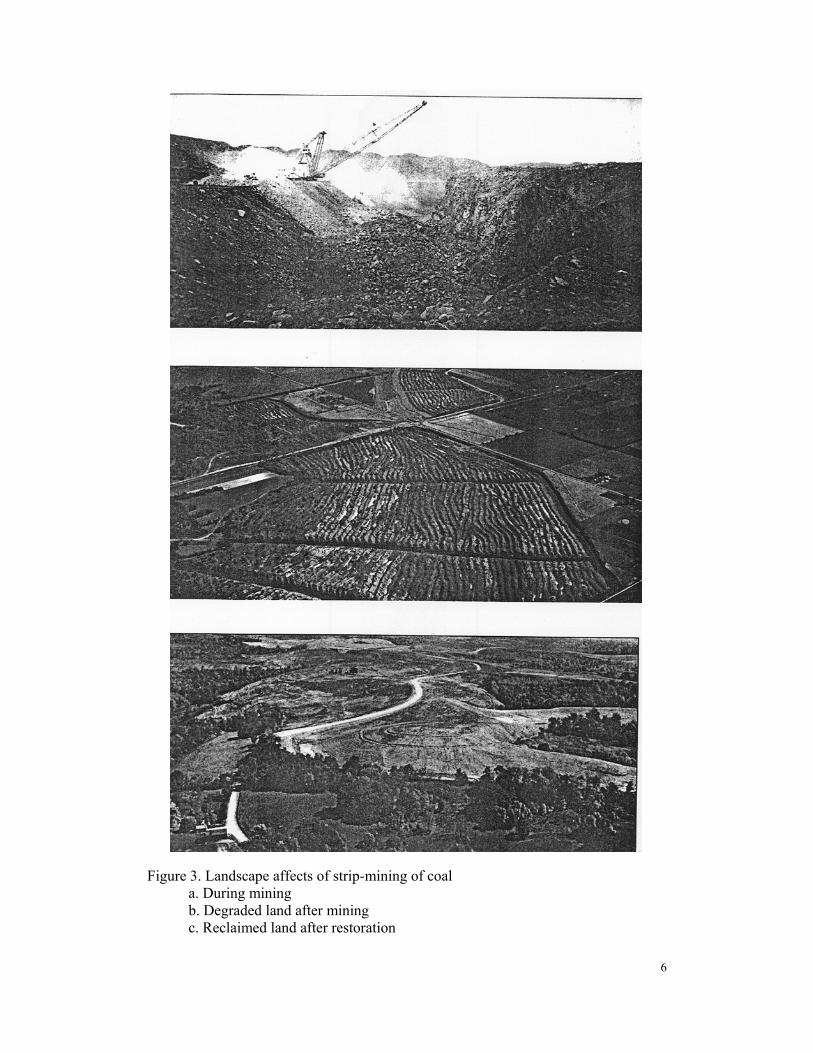
Coal Coal is a heterogeneous mineral material consisting principally of carbon, hydrogen and oxygen and with lesser amounts of sulphur, nitrogen and ash-forming inorganic compounds. Coal originates from wood and other biomass that was later covered, compacted and transformed into rock over a period of hundreds of thousand years. This process leads to a gradual reduction of the oxygen content (from typically 42% in biomass to 25 - 13% in coal) and thereby an increase in the carbon content from typically 50% in biomass to 68 – 80% in coal. The carbon content and the properties of coal depend on the age of the coal and there are large differences between coals found at different sites. Coal are “ranked” with respect to its heating value and the general tendency is that younger coals like lignite1 have a lower heating value than older coals like bituminous coals and anthracite. The heating value ranges from 6500 – 8000 kWh/ton. Coal is mined in surface mines (strip mining) or in underground mines. Strip mining leads to substantial local temporary changes of the landscape, but restoration appears as possible, see figure 3. Underground mining is associated with high occupational hazards. Some refinement of the coal by washing is sometimes made close to the mine. This will reduce the ash and sulphur contents. The proven reserves that can be exploited with the present technologies is about 10 000 Gton and the estimated reserves about 15 000 Gton2. The exploitable reserves at acceptable cost were about 500 Gton in 1977 and is now, with higher coal prices, about 1000 Gton. Table 1 shows the proven and exploitable reserves of coal in 20023. Table 1. Exploitable reserves of coal Region Exploitable reserve
Gton % of total
North America 258 26 Latin America 22 2 Europa and Eurasia 198 20 Russia 157 16 Africa and Middle East 57 6 Australia 82 8 China 114 12 Remaining Asia 96 10 Total 984 100
1 Swedish “brunkol” 2 Nämnden för Energiproduktionsforskning, planeringsrapport NE 1977:23 3 Energifakta, datablad September 2003

5
The coal reserves in Sweden are relatively small, about 30 Mton. The deposits are located between Ängelholm and Helsingborg. The heating value is low, only about
6
Figure 3. Landscape affects of strip-mining of coal a. During mining b. Degraded land after mining c. Reclaimed land after restoration
7
5500 kWh/kg. About 0,5 Mton was mined annually during the period 1940-45 but the operation was then stopped because it was uneconomical. Most of the coal is used not far from where it is mined, but there is an international trade of coal. The largest exporters of coal are USA, Australia, South Africa, China and Indonesia. Sweden imports about 3,5 Mton annually. In 2002, 0,5 Mton was used as fuel in co-generation plants (see section 6.4) and the industry the remaining 3 Mton. About 50% of this is used for production of coke, see section 6.5. The coke is used in the steel mills.
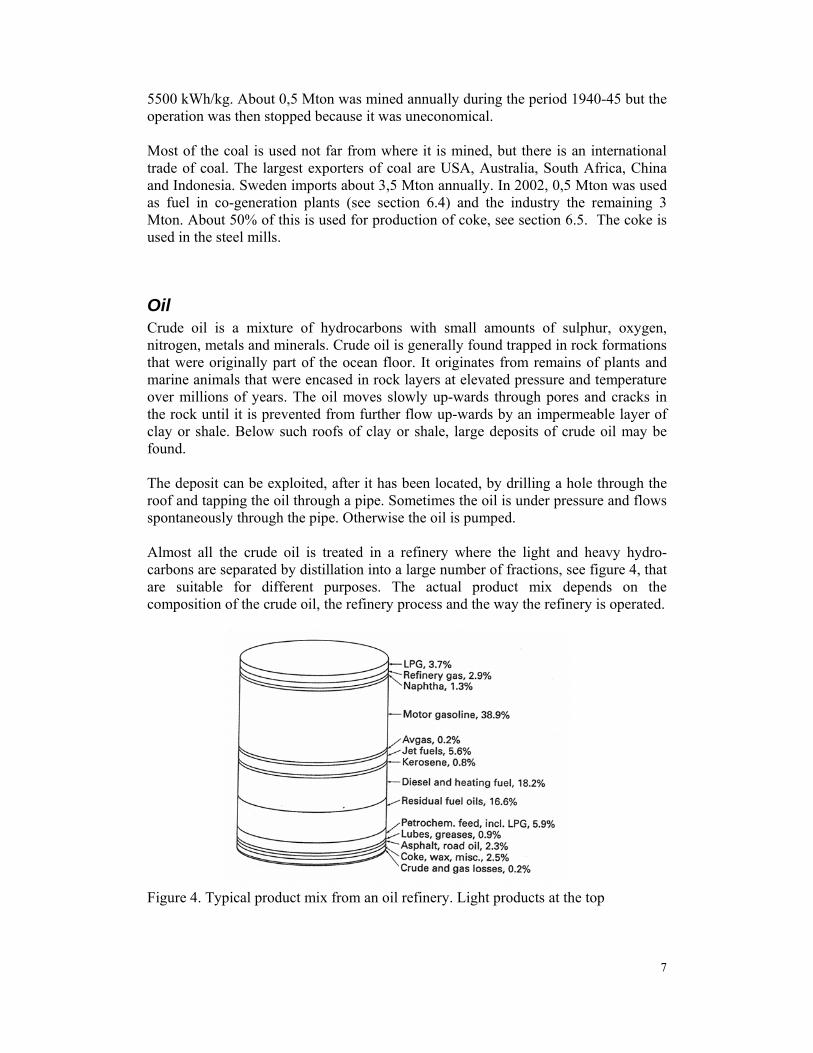
Oil Crude oil is a mixture of hydrocarbons with small amounts of sulphur, oxygen, nitrogen, metals and minerals. Crude oil is generally found trapped in rock formations that were originally part of the ocean floor. It originates from remains of plants and marine animals that were encased in rock layers at elevated pressure and temperature over millions of years. The oil moves slowly up-wards through pores and cracks in the rock until it is prevented from further flow up-wards by an impermeable layer of clay or shale. Below such roofs of clay or shale, large deposits of crude oil may be found. The deposit can be exploited, after it has been located, by drilling a hole through the roof and tapping the oil through a pipe. Sometimes the oil is under pressure and flows spontaneously through the pipe. Otherwise the oil is pumped. Almost all the crude oil is treated in a refinery where the light and heavy hydro-carbons are separated by distillation into a large number of fractions, see figure 4, that are suitable for different purposes. The actual product mix depends on the composition of the crude oil, the refinery process and the way the refinery is operated. Figure 4. Typical product mix from an oil refinery. Light products at the top
8
The heavy fractions can be converted to light fractions with higher product value like gasoline and diesel fuel by thermal treatment (cracking) or by treatment with hydrogen. The light products are used in particular as fuel for engines or gas turbines. The heating value of these products is about 11 900 kWh/ton. The heavier fuel fractions are mainly used as boiler fuel but may also be used in slow speed marine diesel engines. There heating value is about 11 300 kWh/ton. The estimated reserves of crude oil are about 260 Gt. The reserves that are now considered exploitable at reasonable cost are about 143 Gton and are distributed as shown in table 2. Table 2. Exploitable reserves of oil Region Exploitable
reserve Gton % of total
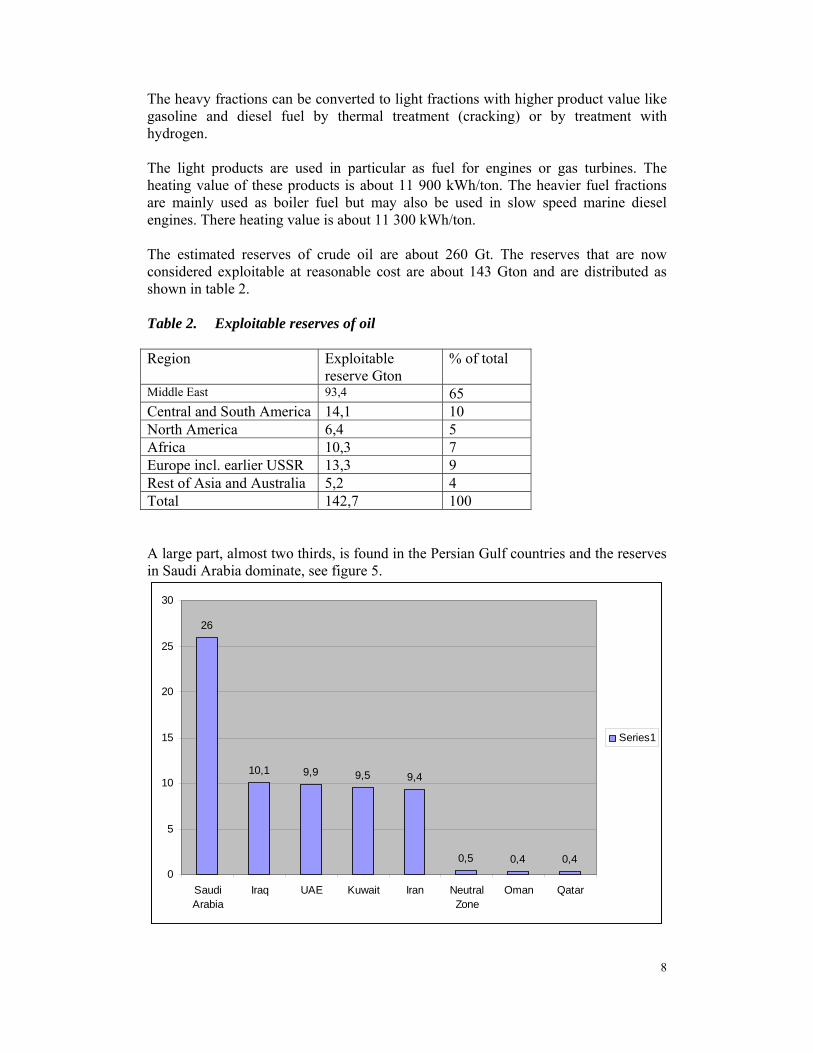
Middle East 93,4 65 Central and South America 14,1 10 North America 6,4 5 Africa 10,3 7 Europe incl. earlier USSR 13,3 9 Rest of Asia and Australia 5,2 4 Total 142,7 100 A large part, almost two thirds, is found in the Persian Gulf countries and the reserves in Saudi Arabia dominate, see figure 5.
26
10,1 9,9 9,5 9,4
0,5 0,4 0,40
5
10
15
20
25
30
SaudiArabia
Iraq UAE Kuwait Iran NeutralZone
Oman Qatar
Series1


![Novel carriers for dicarboxilic acids on the basis of α-aminophosphonates and calix[4]arenes](https://static.fdocument.org/doc/165x107/56812faa550346895d952ea8/novel-carriers-for-dicarboxilic-acids-on-the-basis-of-aminophosphonates.jpg)