Effect of the Metal Oxides Additives on the Electrical Properties
14
Egypt. J. Sol., Vol. (26), No. (2), (2003) 151 Effect of the Metal Oxides Additives on the Electrical Properties of β -Eucryptite Ceramics H.S. Ragab 1 , A. Shehab 2 , G. Attia 3 and F.H. Abd El- Kader 2 . 1 Department of Physics, Faculty of Education, Suez Canal University El-Arish, Egypt. 2 Department of Physics, Faculty of Science, Cairo University, Giza, Egypt. 3 Department of Physics, Faculty of Science, Cairo University, El-Fayum, Egypt. The dc electrical conductivity and thermally stimulated discharge current (TSDC) studies have been made on pure and modified β-eucryptite with TiO 2 , Fe 2 O 3 and CuO in the temperature range 303 – 423 K . The calculated values of activation energy and ionic transference number from dc electrical conduction indicate the presence of ionic character in the investigated samples. The global TSDC spectra studies point to a superposition of dipole orientation and space charge effects. With the aid of the thermal sampling technique, the complex spectrum could be resolved into its elementary processes. The compensation effects is observed to be valid and the values of the compensation temperature and time are found to be 356 K and 1.18 sec respectively. 1. Introduction: Lithium aluminosilicate has been widely used in the glass and ceramic industry for decades as a lithia-bearing flux and low expansion filler in white ware bodies [1-4]. It is widely known to posses a low coefficient of thermal expansion, relatively good strength, good thermal shock properties [5,6]. Also it has attractive application for ionic conductivity purposes [7] and as a humidity sensor [8]. Polarization effects due to ionic motion in insulators have been studied over many years, by considering the change of the electrical current with time in a sample subjected to dc electric field [9] at a fixed temperature. The technique of thermally stimulated depolarization currents (TSDC) has proved to be most useful in studying the electrical properties of materials, and their variations when the material is subjected to treatments which lead to
Transcript of Effect of the Metal Oxides Additives on the Electrical Properties
Egypt. J. Sol., Vol. (26), No. (2), (2003) 151
Effect of the Metal Oxides Additives on the
Electrical Properties of β -Eucryptite Ceramics
H.S. Ragab1, A. Shehab2, G. Attia3 and F.H. Abd El- Kader2.
1Department of Physics, Faculty of Education, Suez Canal University El-Arish, Egypt.
2 Department of Physics, Faculty of Science, Cairo University, Giza, Egypt.
3Department of Physics, Faculty of Science, Cairo University, El-Fayum, Egypt.
The dc electrical conductivity and thermally stimulated discharge
current (TSDC) studies have been made on pure and modified β-eucryptite with TiO2, Fe2O3 and CuO in the temperature range 303 – 423 K . The calculated values of activation energy and ionic transference number from dc electrical conduction indicate the presence of ionic character in the investigated samples. The global TSDC spectra studies point to a superposition of dipole orientation and space charge effects. With the aid of the thermal sampling technique, the complex spectrum could be resolved into its elementary processes. The compensation effects is observed to be valid and the values of the compensation temperature and time are found to be 356 K and 1.18 sec respectively.
1. Introduction:
Lithium aluminosilicate has been widely used in the glass and ceramic industry for decades as a lithia-bearing flux and low expansion filler in white ware bodies [1-4]. It is widely known to posses a low coefficient of thermal expansion, relatively good strength, good thermal shock properties [5,6]. Also it has attractive application for ionic conductivity purposes [7] and as a humidity sensor [8].
Polarization effects due to ionic motion in insulators have been studied over many years, by considering the change of the electrical current with time in a sample subjected to dc electric field [9] at a fixed temperature. The technique of thermally stimulated depolarization currents (TSDC) has proved to be most useful in studying the electrical properties of materials, and their variations when the material is subjected to treatments which lead to
H.S. Ragab et al. 152
configurational changes [10-12]. Besides, using the thermal sampling (TS) technique it is possible to decompose a complex relaxation mechanism into its individual or elementary components allowing the analysis of fine structure of TSDC spectra [13-15].
The present work aims to throw light on the influence of the additive metal oxides on the insulating characteristics of β-eucryptite ceramic, Li2O. Al2O3 2SiO2.Thus, a systematic investigation on dc conductivity, TSDC and TS techniques are done in the temperature range 303 – 423 K. The compensation behavior is also studied.
2. Experimental:
β-eucryptite ceramic in the powder form with the formula Li2O Al2O3 2SiO2 was prepared by using pure Li2CO3,(99.5%) as source of Li2O, local quartz (from upper Egypt), and pure Kaolin from Montcataine S. E. A Milano as source of both Al2O3 and SiO2. Three types of metal oxides CuO, Fe2O3 and TiO2 as modifiers were added with percentage 0.05 mole to β-eucryptite. Batches were wet mixed, dried, calcined at 1393 K with heating rate 10 deg/min. Final product was grounded. The obtained sample in the form of disks of 0.3 cm thickness and 1.0 cm in diameter were shaped using semidry pressing technique (80 Kg/cm2) and vitrified in an electric furnace. Detailed preparation technique was reported elsewhere [16].
Differential scanning calorimetry (DSC) measurement was carried out on β-eucryptite modified by Fe2O3 from room temperature up to 573 K with heating rate of 10 deg/min.
The electrical measurements of the samples were done on sandwich configuration of the samples using a sample holder of brass electrodes, and the currents was measured using Keithley electrometer model 616.
The global TSDC spectra were done first by heating the sample to a specific polarization temperature of 373 K and by applying electric field strength Ep= 4.0 kV/cm for a polarizing period of tp=2h. After polarization, the sample was cooled to the room temperature while the field is on. Then, the field was switched off and the sample was shorted for 15 min to remove frictional and stray charge [17], if any.
The TS technique was carried out as the sample was subjected to an electric field, Ep, at temperature, Tp, for a time, tp , (15 min. was taken as poling time). The sample was rapidly cooled to the lowest desired temperature, Td, where in our case Tp-T\d= 10 deg. After removing the electric field the sample was short-circuited. Then the sample was cooled down to room
Egypt. J. Sol., Vol. (26), No. (2), (2003) 153
temperature and subsequently warmed up by aheating rate of 2 deg/min. while the current is measured.
3. Results and discussion:
3.1. D.C. electrical conductivity
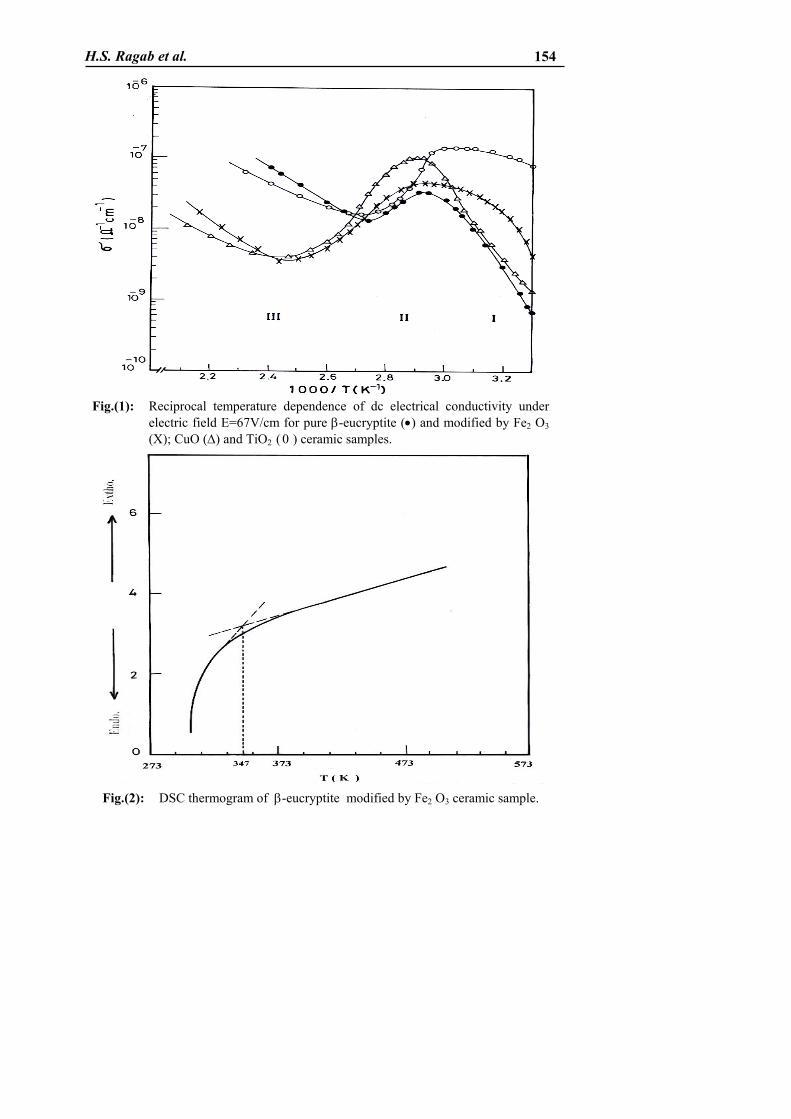
The temperature – dependence of the electrical conductivities σdc of pure β-eucryptite and modified by CuO,Fe2O3 and TiO2 ceramic powder samples are shown in Fig. (1). It can be seen that the general trend of the conductivity-temperature curves are similar,. From these plots, it is seen that all the samples show two regions with changing of slope at different temperatures which are attributed to change in conductivity mechanism [18]. A discontinuous region II, is observed for pure and modified β-eucryptite which may be due to structural changes by weakening of bonds and/or the increase in lattice vibrations [19] vibrations. This is consistent with the diffuse phase transition found in differential scanning calorimetry (DSC), for β-eucryptite modified by Fe2O3 shown in Fig. (2). During sintering , the interaction between the various modifiers (Cu2+, Fe3+, and Ti4+ ions) and ceramic lattice creates chemical defects and modifies the stress distribution.
Electrical conduction in materials depends on the concentration of
charge carriers and their mobility in polycrystalline materials. Several factors such as coordination number of modifier ions, character of the neighbouring oxygen ligands or the state of the polarisability of oxygen anions , whether the modifier metal ion behaves as a network former or a network modifier and valence state of the modifier metal ion are considered to affect the conductivity of the modified β-eucryptite ceramic samples. The additive enters the ceramic lattice network by breaking up the random network (bonds) thus introducing coordinated defects in the network[20]. These bonding defects give rise to electron state within the band gap of the material and these will therefore be localized in that region. The increase of the conductivity on increasing temperature may be attributed to the liberation of more charge carriers from tarps or to agreater mobility through the ceramic lattice network. In the low temperature region, the conductivity is more affected by the addition of metal oxides to β-eucryptite ceramics in the order σ(TiO2)> σ(Fe2O3)> σ(CuO). This can be attributed to the decrease of the radii of the additive ions in the order Ti4+<Fe3+<Cu2+ [12], since the mean ion spacing decreases with the increasing radius of cations and this raises remarkably the hopping probability.
H.S. Ragab et al. 154
Fig.(1): Reciprocal temperature dependence of dc electrical conductivity under electric field E=67V/cm for pure β-eucryptite (•) and modified by Fe2 O3 (Χ); CuO (∆) and TiO2 ( 0 ) ceramic samples.
Fig.(2): DSC thermogram of β-eucryptite modified by Fe2 O3 ceramic sample.

Egypt. J. Sol., Vol. (26), No. (2), (2003) 155
In addition, Li+ ions are considered solely to be the mobile ones on account of their lower atomic mass unit (6.9) compared to Al 3+ (26.08) or Si4+(28.08) although of its large size compared to others (radii of atoms 1.586, 1.312, 1.068 Ao for Li , Al and Si , respectively ) [11,21].
The activation of conduction can be estimated using the relation (1)
where σ0 is constant, ∆E is the thermal activation energy and k is Boltzmann’s constant. The activation energies evaluated for pure and modified β-eucryptite samples are listed in Table (1). It is clear from the values of activation energy and the change of conductivity with temperature in the low temperature region I that the electronic contribution is the predominant process. Thus, thermally activated electronic conduction is represented as a result of ions hopping between thermally created defect pairs or between a relatively high number of available vacant sites disposed at random in ceramic lattice [22]. However, at high temperature region III the conduction mechanism in the samples under investigation may be due to a combined electronic and ionic processes [23,24].
Table (1): Values of activation energy as calculated from dc conductivity
measurements
Activation energy (eV) Sample Region I* Region III**
Pure β -eucryptite powder ceramic 1.20 0.58 β -eucryptite modified by CuO ceramic 1.04 0.35 β -eucryptite modified by Fe2O3 ceramic 0.80 0.54 β -eucryptite modified by TiO2 ceramic 0.77 0.32
*low-temperature region ** High- temperature region
The total dc conductivity (σdc)total, of a compound is given by
(σdc)total= σion + σe, where σion and σe are the conductivities due to ion and electron/hole transport respectively. The ionic and electronic transfer number (tion and te) are a measure of extent of ionic and electronic contribution in the total conduction mechanism, where tion and te are defined as [25],
(2)
(3)
kTEo e /∆−= σσ
H.S. Ragab et al. 156
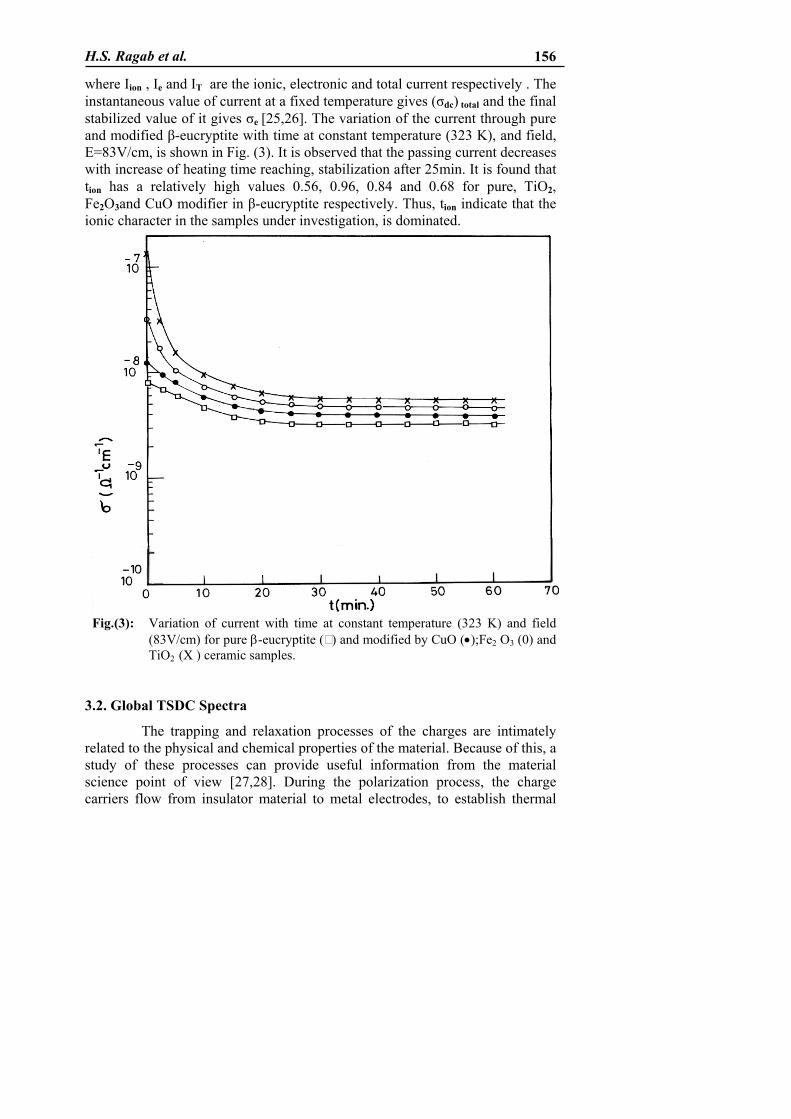
where Iion , Ie and IT are the ionic, electronic and total current respectively . The instantaneous value of current at a fixed temperature gives (σdc) total and the final stabilized value of it gives σe [25,26]. The variation of the current through pure and modified β-eucryptite with time at constant temperature (323 K), and field, E=83V/cm, is shown in Fig. (3). It is observed that the passing current decreases with increase of heating time reaching, stabilization after 25min. It is found that tion has a relatively high values 0.56, 0.96, 0.84 and 0.68 for pure, TiO2, Fe2O3and CuO modifier in β-eucryptite respectively. Thus, tion indicate that the ionic character in the samples under investigation, is dominated.
Fig.(3): Variation of current with time at constant temperature (323 K) and field
(83V/cm) for pure β-eucryptite ( ) and modified by CuO (•);Fe2 O3 (0) and TiO2 (X ) ceramic samples.
3.2. Global TSDC Spectra
The trapping and relaxation processes of the charges are intimately related to the physical and chemical properties of the material. Because of this, a study of these processes can provide useful information from the material science point of view [27,28]. During the polarization process, the charge carriers flow from insulator material to metal electrodes, to establish thermal
Egypt. J. Sol., Vol. (26), No. (2), (2003) 157
equilibrium, resulting into depletion-region in the insulator near the elctrode [28]. The charge carrier in bulk, contribute to heterocharge while the barrier layers contribute to homocharge [11,29]. Both charges co-exist and are responsible for the electrical conductivity [12]
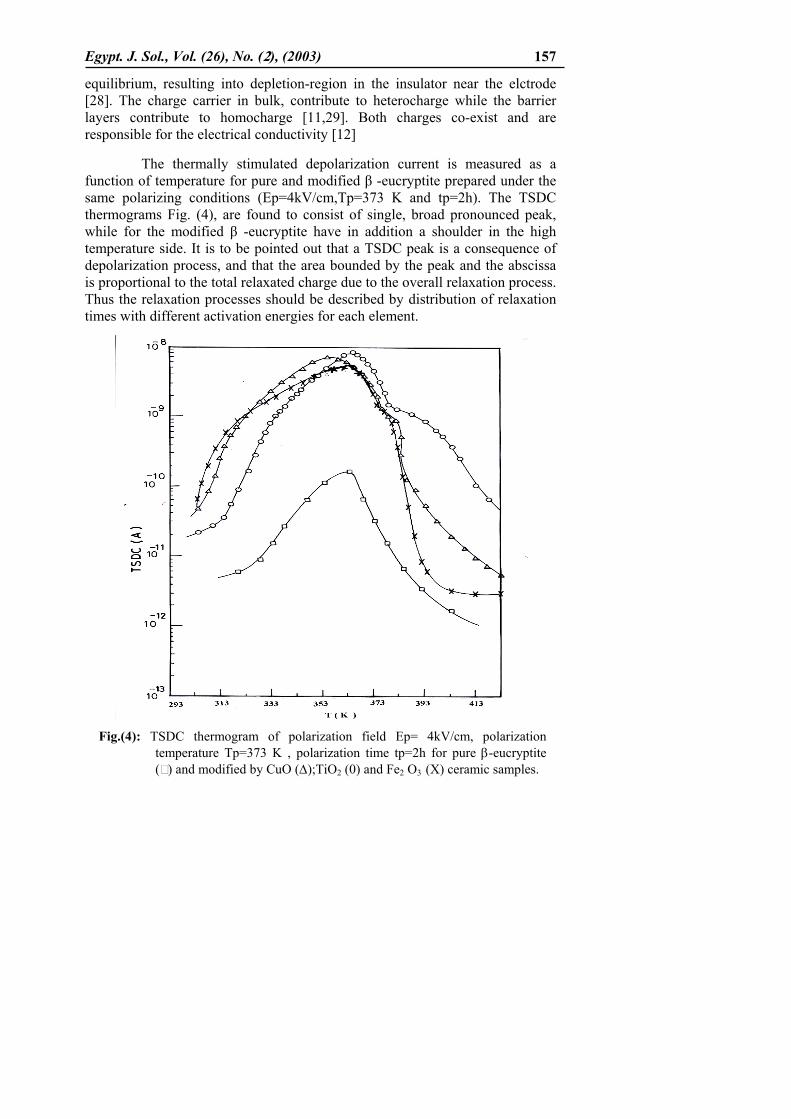
The thermally stimulated depolarization current is measured as a function of temperature for pure and modified β -eucryptite prepared under the same polarizing conditions (Ep=4kV/cm,Tp=373 K and tp=2h). The TSDC thermograms Fig. (4), are found to consist of single, broad pronounced peak, while for the modified β -eucryptite have in addition a shoulder in the high temperature side. It is to be pointed out that a TSDC peak is a consequence of depolarization process, and that the area bounded by the peak and the abscissa is proportional to the total relaxated charge due to the overall relaxation process. Thus the relaxation processes should be described by distribution of relaxation times with different activation energies for each element.
Fig.(4): TSDC thermogram of polarization field Ep= 4kV/cm, polarization temperature Tp=373 K , polarization time tp=2h for pure β-eucryptite ( ) and modified by CuO (∆);TiO2 (0) and Fe2 O3 (X) ceramic samples.
H.S. Ragab et al. 158
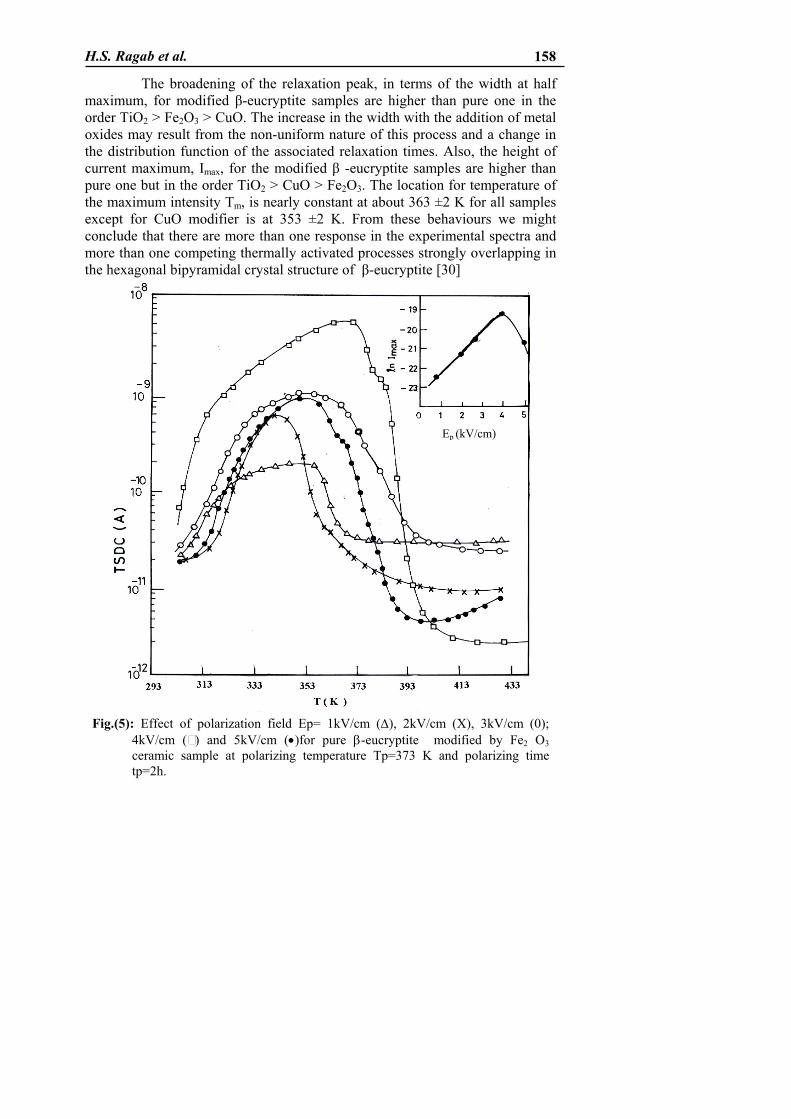
The broadening of the relaxation peak, in terms of the width at half maximum, for modified β-eucryptite samples are higher than pure one in the order TiO2 > Fe2O3 > CuO. The increase in the width with the addition of metal oxides may result from the non-uniform nature of this process and a change in the distribution function of the associated relaxation times. Also, the height of current maximum, Imax, for the modified β -eucryptite samples are higher than pure one but in the order TiO2 > CuO > Fe2O3. The location for temperature of the maximum intensity Tm, is nearly constant at about 363 ±2 K for all samples except for CuO modifier is at 353 ±2 K. From these behaviours we might conclude that there are more than one response in the experimental spectra and more than one competing thermally activated processes strongly overlapping in the hexagonal bipyramidal crystal structure of β-eucryptite [30]
Fig.(5): Effect of polarization field Ep= 1kV/cm (∆), 2kV/cm (X), 3kV/cm (0);
4kV/cm ( ) and 5kV/cm (•)for pure β-eucryptite modified by Fe2 O3 ceramic sample at polarizing temperature Tp=373 K and polarizing time tp=2h.
Ep (kV/cm)
Egypt. J. Sol., Vol. (26), No. (2), (2003) 159
The dependence of the TSDC peak on the polarizing field, Ep, in the range 1-5 kV/cm is investigated only for β-eucryptite modified by Fe2O3 (see Fig. (5). The inset of Fig. (5) indicate that the dependence of Im on Ep shows clear deviation from linearity expected for uniform polarization. Therefore the origin of TSDC peak may be caused by metastable defects in crystalline system. These defects form dipoles in β-eucryptite modified by metal oxides. One can expect the formation of positively and negatively charged, non-bridging oxygen as well as triply bonded oxygen ions in the investigated samples. These dipoles share in the electrical polarization. In addition, a space charge may contribute to the electrical polarization depending upon the molecular packing within the samples under investigation. Since the packing of a modified ceramic might not be uniform as that of crystalline β-eucryptite, it is reasonable to expect dispersion due to molecular motions in the material. Physically, more complex behaviour of TSDC is obtained from a process involving space charge polarization, since generally the build-up release and equilibrium spatial distribution of the charges are strongly dependent on the applied voltage. When a carrier injection occurs, with or without subsequent trapping, one may predict a more or less complicated non-ohmic behaviour due to inefficient transport, potential-dependent injection or potential-dependent rate of detrapping [28, 31-33].
3.3. Thermal Sampling (TS) Spectra
The different discharge in the TSDC spectrum has been extensively studied by the thermal sampling technique, which allow us to polarize narrow segments of the whole thermocurrent spectrum and, thus, to separate the complex global peaks into its components. The application of the TS polarization technique results in quasi-non distributed peaks, so that interpretation of the resulting spectra is easier than the depolarization discharge which is obtained from conventionally polarized electret [13,14].
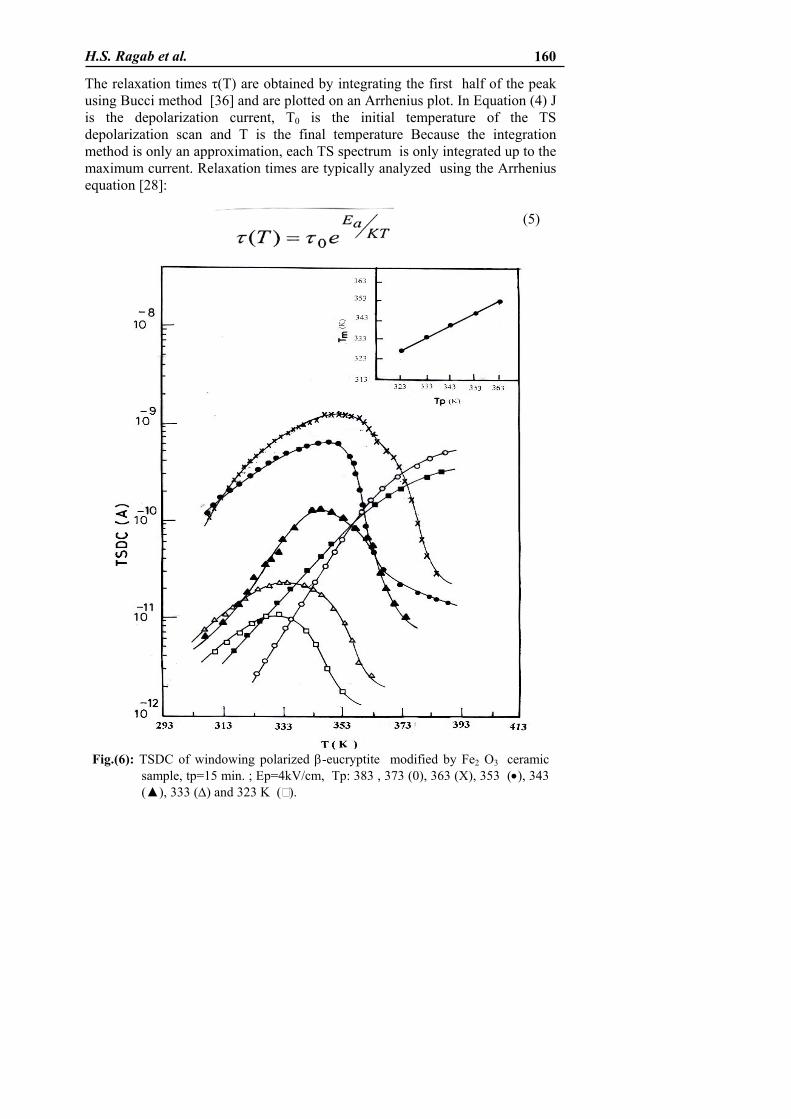
Seven representative TS spectra at polarizing temperature 323-383 K with a temperature window 10deg for β-eucryptite modified with Fe2O3 are shown in Fig. (6). It is evident that the peak intensities shown roughly trace out the shape of the global TSDC spectrum except TS spectra at Tp=373 ± 2 and 383 ± 2 K. TS spectra are characterized by a linear relationship between the peak maximum temperature Tm, on the poling temperature Tp, as shown in the inset of Fig. (6). The slope of the line approaches unity, in a good agreement with the theoretical prediction for continuous distribution [34].
Fractional integration of each TS spectrum was performed using [34,35]: [
(4)
H.S. Ragab et al. 160
The relaxation times τ(T) are obtained by integrating the first half of the peak using Bucci method [36] and are plotted on an Arrhenius plot. In Equation (4) J is the depolarization current, T0 is the initial temperature of the TS depolarization scan and T is the final temperature Because the integration method is only an approximation, each TS spectrum is only integrated up to the maximum current. Relaxation times are typically analyzed using the Arrhenius equation [28]: (5)
Fig.(6): TSDC of windowing polarized β-eucryptite modified by Fe2 O3 ceramic
sample, tp=15 min. ; Ep=4kV/cm, Tp: 383 , 373 (0), 363 (X), 353 (•), 343 (▲), 333 (∆) and 323 K ( ).
Egypt. J. Sol., Vol. (26), No. (2), (2003) 161
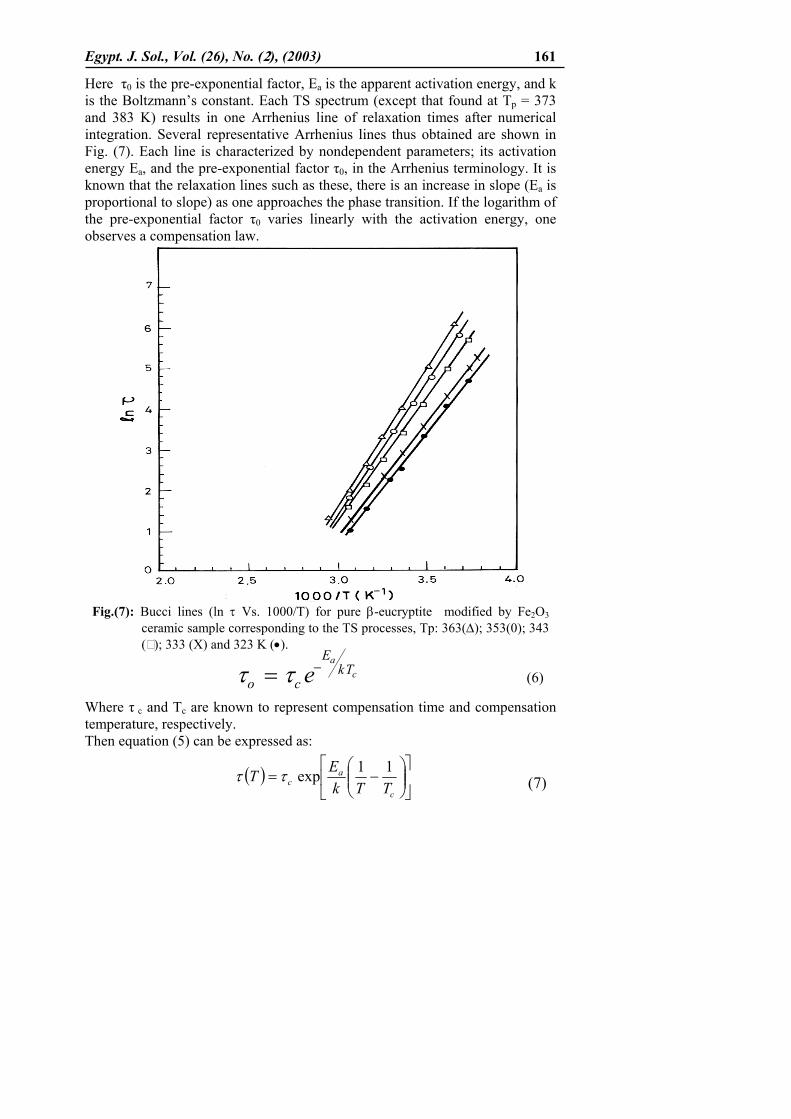
Here τ0 is the pre-exponential factor, Ea is the apparent activation energy, and k is the Boltzmann’s constant. Each TS spectrum (except that found at Tp = 373 and 383 K) results in one Arrhenius line of relaxation times after numerical integration. Several representative Arrhenius lines thus obtained are shown in Fig. (7). Each line is characterized by nondependent parameters; its activation energy Ea, and the pre-exponential factor τ0, in the Arrhenius terminology. It is known that the relaxation lines such as these, there is an increase in slope (Ea is proportional to slope) as one approaches the phase transition. If the logarithm of the pre-exponential factor τ0 varies linearly with the activation energy, one observes a compensation law.
Fig.(7): Bucci lines (ln τ Vs. 1000/T) for pure β-eucryptite modified by Fe2O3
ceramic sample corresponding to the TS processes, Tp: 363(∆); 353(0); 343 ( ); 333 (X) and 323 K (•).
(6) Where τ c and Tc are known to represent compensation time and compensation temperature, respectively. Then equation (5) can be expressed as:
(7)
ca
TkE
co e−= ττ
( )
−=
c
ac TTk
ET 11expττ
H.S. Ragab et al. 162
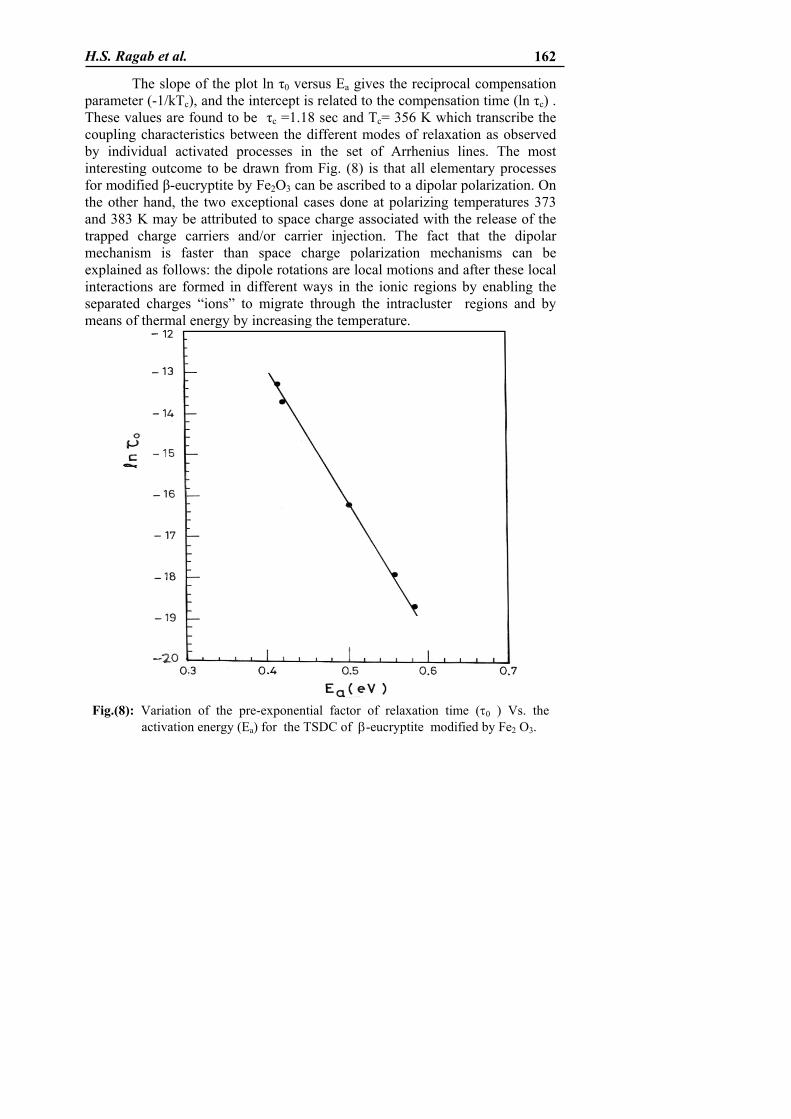
The slope of the plot ln τ0 versus Ea gives the reciprocal compensation parameter (-1/kTc), and the intercept is related to the compensation time (ln τc) . These values are found to be τc =1.18 sec and Tc= 356 K which transcribe the coupling characteristics between the different modes of relaxation as observed by individual activated processes in the set of Arrhenius lines. The most interesting outcome to be drawn from Fig. (8) is that all elementary processes for modified β-eucryptite by Fe2O3 can be ascribed to a dipolar polarization. On the other hand, the two exceptional cases done at polarizing temperatures 373 and 383 K may be attributed to space charge associated with the release of the trapped charge carriers and/or carrier injection. The fact that the dipolar mechanism is faster than space charge polarization mechanisms can be explained as follows: the dipole rotations are local motions and after these local interactions are formed in different ways in the ionic regions by enabling the separated charges “ions” to migrate through the intracluster regions and by means of thermal energy by increasing the temperature.
Fig.(8): Variation of the pre-exponential factor of relaxation time (τ0 ) Vs. the
activation energy (Ea) for the TSDC of β-eucryptite modified by Fe2 O3.
Egypt. J. Sol., Vol. (26), No. (2), (2003) 163
4. Conclusion:
Metal oxides have been shown to be suitable additives for β-eucryptite ceramic, leading to significant improvements of electrical conductivity and thermal stimulated depolarization current. The addition of any modifier (TiO2, Fe2O3, and CuO) in β-eucryptite ceramic network increases both σdc and TSDC with temperature. The origin of observed TSDC peaks in all samples is related to polarization caused by the combined effect of the intrinsic dipolar defects and space charge. The increase of conductivity at temperatures below the transition temperature is mainly due to the ionic carriers in the materials under investigation.
References:
1. C. A. Cowan, G. A. Bole and R. L. Stone; J. Am. Ceram. Soc., 33, 193 (1950).
2. J. H. Fishwick ; ” Applications of Lithium in Ceramics”, (Cahners Books, Boston, Mass, 1974).
3. I. M. Low, C. G. SHI ; J. Mat. Sci., 35, 6293 (2000). 4. UK Kang, A. A. Zhilin ; G. T. Petrovesky, O. S. Dymshits, and T. I.
Chuvaeva; J. Non-Cryst. Sol., 258, 216 (1999). 5. P. W. Mcmillan ; “Glass Ceramics”, 2nd Ed., Academic Press. London,
(1979). 6. F. H. Hummel ; Interceramics, 6, 27(1984). 7. H. J. Schulz ,W. Press, B. Penker and H. Bohm; Phys. Rev. 821, (3),
1250(1980). 8. L. W. Hobbs ; J. Am. Ceram. Soc., 62, (5-6), 267(1979). 9. G. M. Sessler ; “Physical principles of Electrets” , In GM. Sessler Editor
Berlin, springer (1979) . 10. P. Braunlich, , Ed ; “Thermally Stimulated Relaxations in Solids, Topics in
Applied Physics ” , springer-Verlog, New York, Vol.37(1979). 11. H. S. Ragab, R. A. Abd-Ellah, M. S. Abo-Ellil. A. Shehap, A. F. Basha,
and F. H. Abd El- Kader ; J. Mat. Sci, 36, 4561 (2001). 12. H. S. Ragab, R. A. Abd-Ellah, M. S. Abo-Ellil. A. Shehap, W. H. Osman,
and F. H. Abd El- Kader ; J. Phys. Chem. Solids, 63, 1839 (2002). 13. M. Mudarra, J. Belana; J. C. Candas; J. A. Diego ; Polymer, 40, 2659
(1999). 14. M. D. Migahed, M. T. Ahmed and A. E. Kotp; J. Phys. D. Appl. Phys. 33,
2108 (2000) 15. M. Topic, A. M. Milankovic, and D. E. Day; J. Non-Cryst. Sol., 261,146
(2000). 16. R. Abdellah; Ph.D. Thesis, Cairo University (1988).
H.S. Ragab et al. 164
17. S. N. Prasad; R. S. Prasad; Indian J. Phys, 49,596 (1975). 18. S. M. Otari, V. B. Kadam, S. R. Sawant and S. A. Patil; Indian J. Pure and
Appl. Phys, 34,166 (1990). 19. S.M.Yousaf, S.Raza, Z.Ahmed and F.A.Khwaja; J.Mat.Sci; 33,
4923(1998). 20. G. Liu and R.D. Roseman; J.Mat.Sci, 34, 4439(1999). 21. W. Abdel Fattah, M.S. Abo Ellil, R.A. Abdellah, M.Aboutaleb, and
F.H.Abd El-Kader; Egypt. J. Sol, 19, (2), 369(1996). 22. R. J. Elliott, L. Perondi and Rafael A. Barrio; J. Non Crystall. Solids, 168,
167 (1994). 23. A.K.Jonscher; Thin Solid Films, 1, 1215(1967). 24. K.C. Kao and W.Hwong,”Electrical transport in Solids”, Pergamon Press,
New York (1981). 25. T. Kar and R. N. P. Choudhary; J. Mat. Sci. Lett., 19, 809, (2000). 26. S. Chandra; “Superionic solids- Principles and Applications” (North
Holland Publishing Co., New York, 141 (1981). 27. A. Mogus, Milankovic and D. E. Day; J. Non. Cryst. Solids, 162, 275
(1993). 28. S. B. Sawarkar, V. S. Deagaonkar, S. V. Pokade and S. P. Yawale; Indian
J. Pure and Appl. Phys, 35. 281 (1997). 29. A. P. Barranco, F. C. Pinar and O. P. Martinez; J. Mat. Sci, 20, 1439
(2001). 30. H. G. F. Winkler; Acta Cryst. 1, 27 (1948). 31. T. Takamastu and E. Fukada; “Electret Charge Storage and Transport
Properties in Dielectrics” (Soc. New Jersey) 128 (1973). 32. P. C. Mchendru, K. Jain and A. P. Agrawal; J. Phys. D (G.B) 13, 1947
(1980). 33. P. K. Khare and A. P. Srivastava; Indian J. Pure and Appl. Phys. 30,
131(1992). 34. J. A. Owen and R. Bonart; Polymer, 26, 1023 (1985). 35. S. F. Liu and Y. D. Lee; J. Polym. Sci. And Polym. Phys., B, 33, 1333
(1995). 36. C. Bucci and R. Fieschi; Phys. Rev, 148, 816 (1966).