Effect of subharmonic forcing on transition in chemically...
23
Effect of subharmonic forcing on transition in chemically reactive shear-layers Luca Massa * I. Introduction Aerothermodynamic heating loads on reentry vehicles are increased by shear-layer/boundary layer de- velopment, and the design of the thermal protection system depend critically on the ability of predicting transition. Supersonic shear-layers form in the windward region of the vehicles due to shock-shock inter- actions near the engine leading edge 1 or in the leeward region of blunt body capsules near the separation region. 2 In either cases, transition affects the thermal load at the impingement of the shear-layer with solid surfaces. Carbon chemistry is important for planetary reentry, given the large concentration of carbon diox- ide in the Mars and Venus atmosphere. Carbon chemistry also affects the development of fine scale mixing in cavity stabilized supersonic combustors, 3 where shear-layers are formed between the air stream and the burnt gas recirculating in the cavity. Vibrational relaxation in carbon dioxide was shown by experiments 4 and computations 5 to decrease the growth rate of second mode boundary layer instabilities. Fuji and Hornung 4 link the stabilization to the absorption of acoustic energy into molecular internal degrees of freedom, thus removing the fundamental trapping mechanism supporting neutral two-dimensional acoustic modes. The second inflectional modes of boundary layers discovered by Mack 6 are similar to the supersonic shear layer modes discovered by Jackson and Grosch 7 because they originate when the compressible Rayleigh equation 8 becomes hyperbolic in a region including at least one boundary, and thus admits multiple solutions. The major difference between the supersonic shear layer and acoustic boundary layer modes is that the former ones have neutral solutions that are radiative and vortical, while the latter are trapped and acoustic, i.e., no radiation occurs in the free-stream. Therefore, the fundamental question at the base of the present research is whether (and by how much) carbon addition slows down the development of the shear layer, in light of the fact that the acoustic trapping mechanism invoked by Fujii and Hornung 4 is not present in free supersonic shear-layers. In the present research carbon vibrational chemistry is analyzed with a detailed model which includes the contributions of molecular vibration to both kinetic and transport terms. This approach leads to high fidelity predictions for chemical times, but also requires the solution of a large set of partial differential equations. For high convective Mach numbers (M c ≈ 0.86 9 ) vortex pairing, typical of incompressible shear layers, is not observed, Biot-Savart induction between paired structures disappears, large organized structures are not observed, and the system in purely convective far into the transition regime. For convectively unstable flows, the nonlinear parabolized stability equations (NPSE) 10 are a suitable alternative to direct numerical simulation (DNS) and provide a cost-effective mean of simulating transition with detailed chemistry. Previous NPSE analysis of mixing layers 11 were limited to equilibrium chemistry with simplified caloric and thermal equations. Moreover such analyses were not extended in the transition regime, thus no in- formation was provided about the contribution of streamwise vortices to transition. In the present work, both NPSE and linear analysis of carbon containing shear layers are investigated. Parallel and non-parallel * Assistant Professor, Aerodynamics Research Center, Department of Mechanical and Aerospace Engineering. University of Texas at Arlington, Arlington, Texas, 76019. Senior Member AIAA. 1 of 23 American Institute of Aeronautics and Astronautics 50th AIAA Aerospace Sciences Meeting including the New Horizons Forum and Aerospace Exposition 09 - 12 January 2012, Nashville, Tennessee AIAA 2012-0447 Copyright © 2012 by The author. Published by the American Institute of Aeronautics and Astronautics, Inc., with permission.
Transcript of Effect of subharmonic forcing on transition in chemically...
Effect of subharmonic forcing on transition in
chemically reactive shear-layers
Luca Massa∗
I. Introduction
Aerothermodynamic heating loads on reentry vehicles are increased by shear-layer/boundary layer de-velopment, and the design of the thermal protection system depend critically on the ability of predictingtransition. Supersonic shear-layers form in the windward region of the vehicles due to shock-shock inter-actions near the engine leading edge1 or in the leeward region of blunt body capsules near the separationregion.2 In either cases, transition affects the thermal load at the impingement of the shear-layer with solidsurfaces. Carbon chemistry is important for planetary reentry, given the large concentration of carbon diox-ide in the Mars and Venus atmosphere. Carbon chemistry also affects the development of fine scale mixingin cavity stabilized supersonic combustors,3 where shear-layers are formed between the air stream and theburnt gas recirculating in the cavity.
Vibrational relaxation in carbon dioxide was shown by experiments4 and computations5 to decrease thegrowth rate of second mode boundary layer instabilities. Fuji and Hornung4 link the stabilization to theabsorption of acoustic energy into molecular internal degrees of freedom, thus removing the fundamentaltrapping mechanism supporting neutral two-dimensional acoustic modes. The second inflectional modes ofboundary layers discovered by Mack6 are similar to the supersonic shear layer modes discovered by Jacksonand Grosch7 because they originate when the compressible Rayleigh equation8 becomes hyperbolic in aregion including at least one boundary, and thus admits multiple solutions. The major difference betweenthe supersonic shear layer and acoustic boundary layer modes is that the former ones have neutral solutionsthat are radiative and vortical, while the latter are trapped and acoustic, i.e., no radiation occurs in thefree-stream. Therefore, the fundamental question at the base of the present research is whether (and by howmuch) carbon addition slows down the development of the shear layer, in light of the fact that the acoustictrapping mechanism invoked by Fujii and Hornung4 is not present in free supersonic shear-layers.
In the present research carbon vibrational chemistry is analyzed with a detailed model which includes thecontributions of molecular vibration to both kinetic and transport terms. This approach leads to high fidelitypredictions for chemical times, but also requires the solution of a large set of partial differential equations.For high convective Mach numbers (Mc ≈ 0.869) vortex pairing, typical of incompressible shear layers, isnot observed, Biot-Savart induction between paired structures disappears, large organized structures arenot observed, and the system in purely convective far into the transition regime. For convectively unstableflows, the nonlinear parabolized stability equations (NPSE)10 are a suitable alternative to direct numericalsimulation (DNS) and provide a cost-effective mean of simulating transition with detailed chemistry.
Previous NPSE analysis of mixing layers11 were limited to equilibrium chemistry with simplified caloricand thermal equations. Moreover such analyses were not extended in the transition regime, thus no in-formation was provided about the contribution of streamwise vortices to transition. In the present work,both NPSE and linear analysis of carbon containing shear layers are investigated. Parallel and non-parallel
∗Assistant Professor, Aerodynamics Research Center, Department of Mechanical and Aerospace Engineering. University ofTexas at Arlington, Arlington, Texas, 76019. Senior Member AIAA.
1 of 23
American Institute of Aeronautics and Astronautics
50th AIAA Aerospace Sciences Meeting including the New Horizons Forum and Aerospace Exposition09 - 12 January 2012, Nashville, Tennessee
AIAA 2012-0447
Copyright © 2012 by The author. Published by the American Institute of Aeronautics and Astronautics, Inc., with permission.
(streamwise relaxation) chemistry effects are analyzed for a set of carbon molar contents, velocity ratios andperturbation intensities. The formation of streamwise vorticity and their effect on transition are correlatedto the carbon content.
II. Governing equations
Day et. al.,11 showed that the thin-shear-layer NPSE approximation reproduce DNS evolution of super-sonic two dimensional shear-layers. The governing equation for the present research are obtained by addingto the thin-layer unreactive Navier-Stokes detailed chemistry and transport while ignoring cross (Soret)diffusion terms.12
Letting x the streamwise direction, z the spanwise direction and y the cross-wise direction, the governingequations are
Dρ
Dt+ ρ∇·~v = 0 (1a)
ρDu
Dt+
∂p
∂x=
∂
∂y
(
µ∂u
∂y
)
(1b)
ρDv
Dt+
∂p
∂y= 4/3
∂
∂y
(
µ∂v
∂y
)
− 2/3
(
∂
∂y
(
µ∂u
∂x
)
+∂
∂y
(
µ∂w
∂z
))
+∂
∂x
(
µ∂u
∂y
)
+∂
∂z
(
µ∂w
∂y
)
(1c)
ρDw
Dt+
∂p
∂z=
∂
∂y
(
µ∂w
∂y
)
(1d)
ρDh
Dt− Dp
Dt=
∂
∂y
(
λ∂T
∂y
)
+
Ns∑
i=1
∂
∂y
(
δi∂Yi
∂y
)
+ µ
(
∂u
∂y
2
+∂w
∂y
2)
(1e)
ρDYi
Dt=
Ns∑
j=1
∂
∂y
(
νi,j∂Yi
∂y
)
+ ρΩi. (1f)
Note, ref. [11] retained only the first term in RHS of equation (1c), and neglected viscous heating, the lastterm in equation (1e). Viscous heating will be proven to play an important role in non-equilibrium problemsby supporting both the temperature overshoot along y and streamwise relaxation in x.
Caloric and thermal properties are found using multicomponent mixture rules, e.g., ref. [12], adaptedto the vibrational non-equilibrium case. The transport coefficients µ, ν, λ and δ depend not only on themolecular composition, but also on the vibrational state of the molecules and are evaluated as described byref. [13].
III. Chemistry Model
The kinetic model is based on that developed by ref. [14], includes four species CO2, CO, O2, O andallows for molecular vibration in non-equilibrium by considering only the antisymmetric mode of CO2.At freestream temperatures higher than 1000 K molecular rotation and symmetric stretch-bend motion ofCO2 can be assumed in equilibrium with the translation mode. To this end, the repartition of energyinto carbon dioxide equilibrium modes is modeled through temperature dependent weights associated witheach antisymmetric mode. On the other hand, the non-equilibrium energy transfer between antisymmetricvibrational quantum states is controlled by source terms. The chemistry can be categorized as a semi-classicalmodel, where the vibration in quantized while translation and rotation are modeled as a continuum. Thequantized energy includes four vibrational levels for CO2, five for CO, and six for O2.
Most of the kinetic parameters are taken from ref. [14], with the exception of the spectroscopic constants
2 of 23
American Institute of Aeronautics and Astronautics

of CO2. The equilibrium weights and the vibrational energies of the asymmetric degree of freedom areevaluated by averaging all allowable transitions probabilities reported in the 2010 HITEMP database:15
4,878,628 transitions are considered in this study. First, the spectroscopic constants of the asymmetric stretchare evaluated by expanding the molecular energies in terms of asymmetric vibrational v and rotational Jquantum numbers,
E(v, 0, 0, J) = Gv + BvJ(J + 1) − Dv (J(J + 1))2 + Hv (J(J + 1))3 , (2)
where the second and third arguments of the function on the left hand side are the symmetric stretchand bending vibrational quantum numbers. The harmonic and anharmonic vibrational constants Gv =ωe (v + 1/2) − ωexe (v + 1/2)2 are found by fitting the Gv value obtained in the Dunham expansion equa-tion (2). The fitting yields ωe = 2373.9 cm−1 and ωexe = 12.43 cm−1 .The temperature dependent weights ofthe asymmetric levels are determined by direct summation over the symmetric stretch-bend pair of quantumnumbers (u, w) and the rotation number J ,
gv =∑
J
∑
u
∑
w
gv,u,w,J exp (−E(v, u, w, J)/kT ) exp (Gv/kT ) , (3)
where k is the Boltzmann constant, and gv,u,w,J is the degeneracy of the vibrational degree of freedomidentified by the quadruplet (u, v, w, J).
Results for the averaging are presented in Fig. 1. The left panel shows that four CO2 vibrational modes,v = 0− 3, are sufficient to represent the variation of the total partition function (rotational plus vibrational,cf. ref. [16])in the temperature range 300 < T < 3000. The right panel shows the error in the partitionfunction contribution of the asymmetric vibrational level v when the diatomic harmonic formula
Qv/∑
v
Qv = exp (−vθas/T ) [1 − exp (−θas/T )], (4)
is compared to the direct summationgv exp (−Gv/kT )
∑
v gv exp (−Gv/kT ).
In equation (4), θas = 3380.2 K is the anti-symmetric stretch vibrational temperature. The comparison showsthat the simple harmonic formula leads to relative errors that are approximately 40 % in the intermediatetemperature range.
500 1000 1500 2000 2500 3000
0
0.2
0.4
0.6
Temperature, K
Par
titio
n E
rror
v=0v=1v=2v=3
500 1000 1500 2000 2500 3000
102
104
Temperature, K
Qv+
r
Rothman et al.Present
Figure 1. Left panel: total partition function with 4 CO2 asymmetric levels when compared to ref. [16]. Right panel:error in the vibrational partition of the harmonic oscillator approximation (equation (4)) when compared to the directsummation for a given asymmetric mode v.
3 of 23
American Institute of Aeronautics and Astronautics
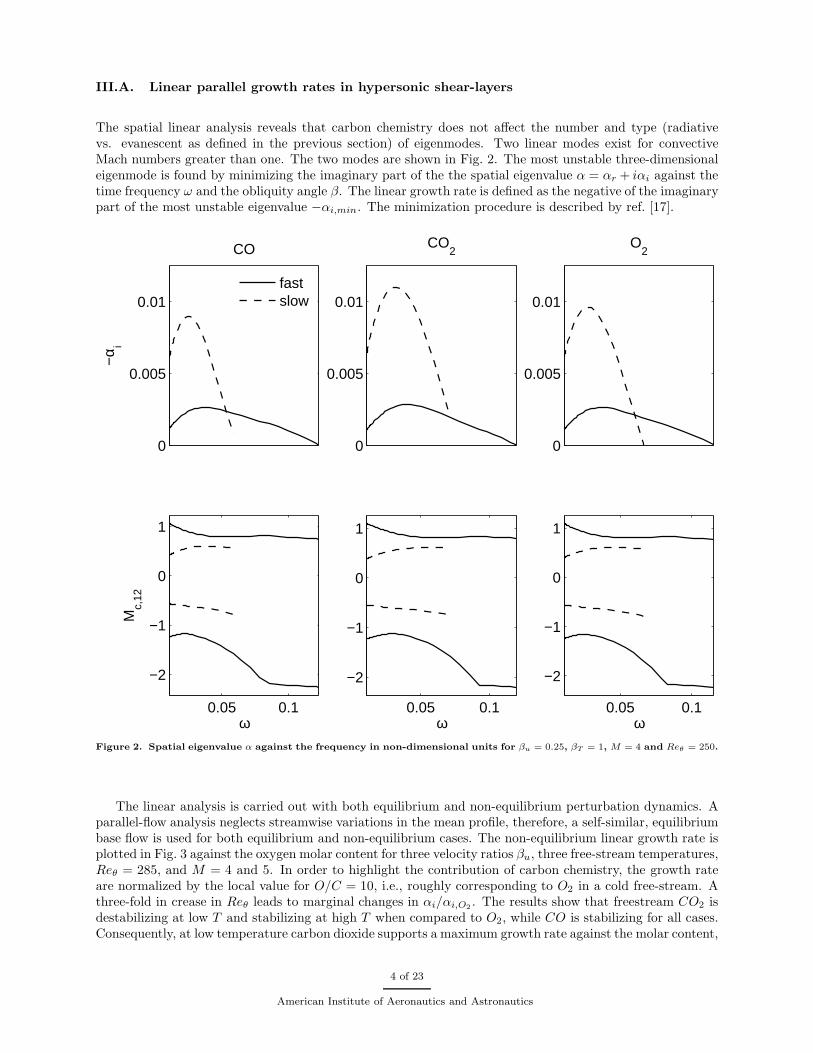
III.A. Linear parallel growth rates in hypersonic shear-layers
The spatial linear analysis reveals that carbon chemistry does not affect the number and type (radiativevs. evanescent as defined in the previous section) of eigenmodes. Two linear modes exist for convectiveMach numbers greater than one. The two modes are shown in Fig. 2. The most unstable three-dimensionaleigenmode is found by minimizing the imaginary part of the the spatial eigenvalue α = αr + iαi against thetime frequency ω and the obliquity angle β. The linear growth rate is defined as the negative of the imaginarypart of the most unstable eigenvalue −αi,min. The minimization procedure is described by ref. [17].
0
0.005
0.01
−α i
CO
fastslow
0.05 0.1
−2
−1
0
1
Mc,
12
ω
0
0.005
0.01
CO2
0.05 0.1
−2
−1
0
1
ω
0
0.005
0.01
O2
0.05 0.1
−2
−1
0
1
ωFigure 2. Spatial eigenvalue α against the frequency in non-dimensional units for βu = 0.25, βT = 1, M = 4 and Reθ = 250.
The linear analysis is carried out with both equilibrium and non-equilibrium perturbation dynamics. Aparallel-flow analysis neglects streamwise variations in the mean profile, therefore, a self-similar, equilibriumbase flow is used for both equilibrium and non-equilibrium cases. The non-equilibrium linear growth rate isplotted in Fig. 3 against the oxygen molar content for three velocity ratios βu, three free-stream temperatures,Reθ = 285, and M = 4 and 5. In order to highlight the contribution of carbon chemistry, the growth rateare normalized by the local value for O/C = 10, i.e., roughly corresponding to O2 in a cold free-stream. Athree-fold in crease in Reθ leads to marginal changes in αi/αi,O2
. The results show that freestream CO2 isdestabilizing at low T and stabilizing at high T when compared to O2, while CO is stabilizing for all cases.Consequently, at low temperature carbon dioxide supports a maximum growth rate against the molar content,
4 of 23
American Institute of Aeronautics and Astronautics
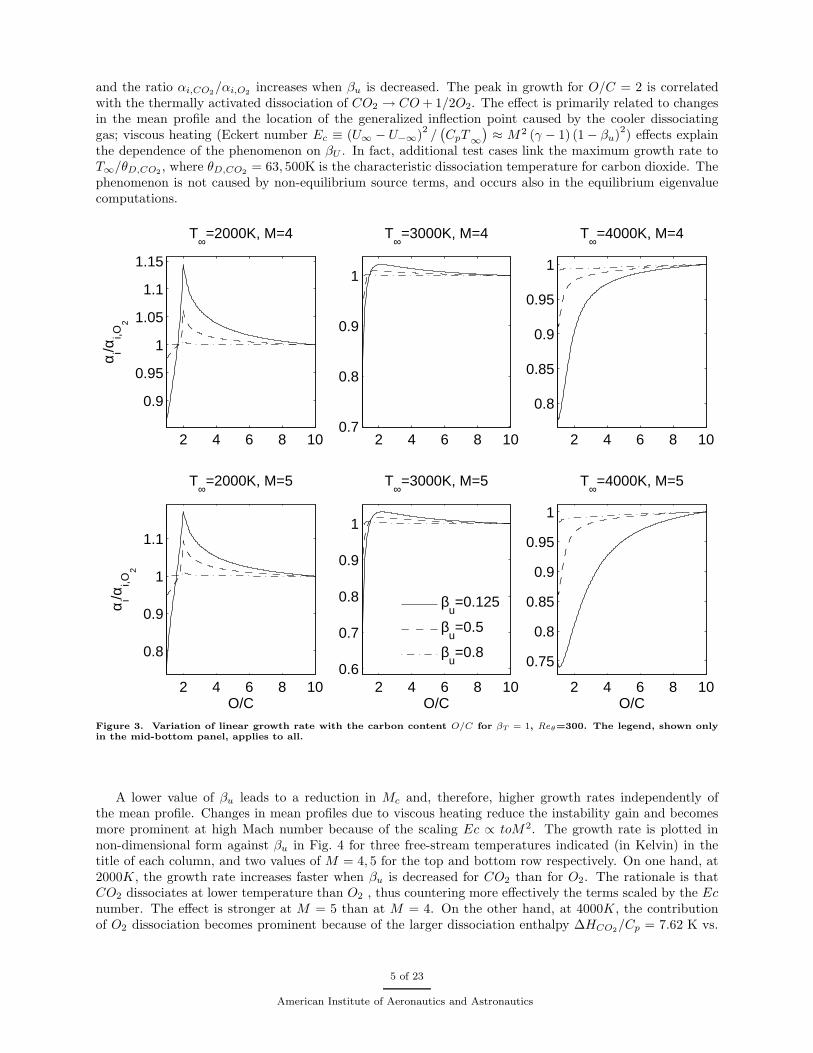
and the ratio αi,CO2/αi,O2
increases when βu is decreased. The peak in growth for O/C = 2 is correlatedwith the thermally activated dissociation of CO2 → CO + 1/2O2. The effect is primarily related to changesin the mean profile and the location of the generalized inflection point caused by the cooler dissociatinggas; viscous heating (Eckert number Ec ≡ (U∞ − U−∞)
2/(
CpT∞
)
≈ M2 (γ − 1) (1 − βu)2) effects explain
the dependence of the phenomenon on βU . In fact, additional test cases link the maximum growth rate toT∞/θD,CO2
, where θD,CO2= 63, 500K is the characteristic dissociation temperature for carbon dioxide. The
phenomenon is not caused by non-equilibrium source terms, and occurs also in the equilibrium eigenvaluecomputations.
2 4 6 8 10
0.9
0.95
1
1.05
1.1
1.15
T∞=2000K, M=4
α i/αi,O
2
2 4 6 8 100.7
0.8
0.9
1
T∞=3000K, M=4
2 4 6 8 10
0.8
0.85
0.9
0.95
1
T∞=4000K, M=4
2 4 6 8 10
0.8
0.9
1
1.1
T∞=2000K, M=5
α i/αi,O
2
O/C2 4 6 8 10
0.6
0.7
0.8
0.9
1
T∞=3000K, M=5
O/C
2 4 6 8 10
0.75
0.8
0.85
0.9
0.95
1
T∞=4000K, M=5
O/C
βu=0.125
βu=0.5
βu=0.8
Figure 3. Variation of linear growth rate with the carbon content O/C for βT = 1, Reθ=300. The legend, shown onlyin the mid-bottom panel, applies to all.
A lower value of βu leads to a reduction in Mc and, therefore, higher growth rates independently ofthe mean profile. Changes in mean profiles due to viscous heating reduce the instability gain and becomesmore prominent at high Mach number because of the scaling Ec ∝ toM2. The growth rate is plotted innon-dimensional form against βu in Fig. 4 for three free-stream temperatures indicated (in Kelvin) in thetitle of each column, and two values of M = 4, 5 for the top and bottom row respectively. On one hand, at2000K, the growth rate increases faster when βu is decreased for CO2 than for O2. The rationale is thatCO2 dissociates at lower temperature than O2 , thus countering more effectively the terms scaled by the Ecnumber. The effect is stronger at M = 5 than at M = 4. On the other hand, at 4000K, the contributionof O2 dissociation becomes prominent because of the larger dissociation enthalpy ∆HCO2
/Cp = 7.62 K vs.
5 of 23
American Institute of Aeronautics and Astronautics
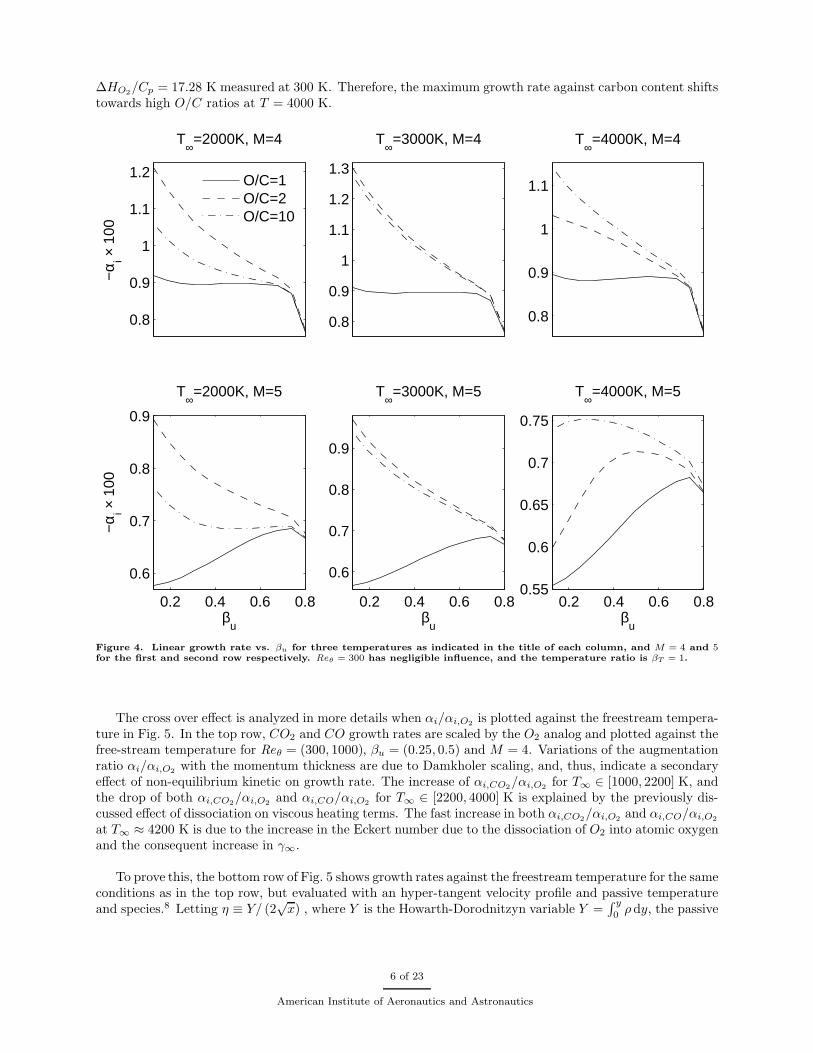
∆HO2/Cp = 17.28 K measured at 300 K. Therefore, the maximum growth rate against carbon content shifts
towards high O/C ratios at T = 4000 K.
0.8
0.9
1
1.1
1.2
T∞=2000K, M=4
−α i ×
100
0.8
0.9
1
1.1
1.2
1.3
T∞=3000K, M=4
0.8
0.9
1
1.1
T∞=4000K, M=4
0.2 0.4 0.6 0.8
0.6
0.7
0.8
0.9
T∞=2000K, M=5
βu
−α i ×
100
0.2 0.4 0.6 0.8
0.6
0.7
0.8
0.9
T∞=3000K, M=5
βu
0.2 0.4 0.6 0.80.55
0.6
0.65
0.7
0.75
T∞=4000K, M=5
βu
O/C=1O/C=2O/C=10
Figure 4. Linear growth rate vs. βu for three temperatures as indicated in the title of each column, and M = 4 and 5
for the first and second row respectively. Reθ = 300 has negligible influence, and the temperature ratio is βT = 1.
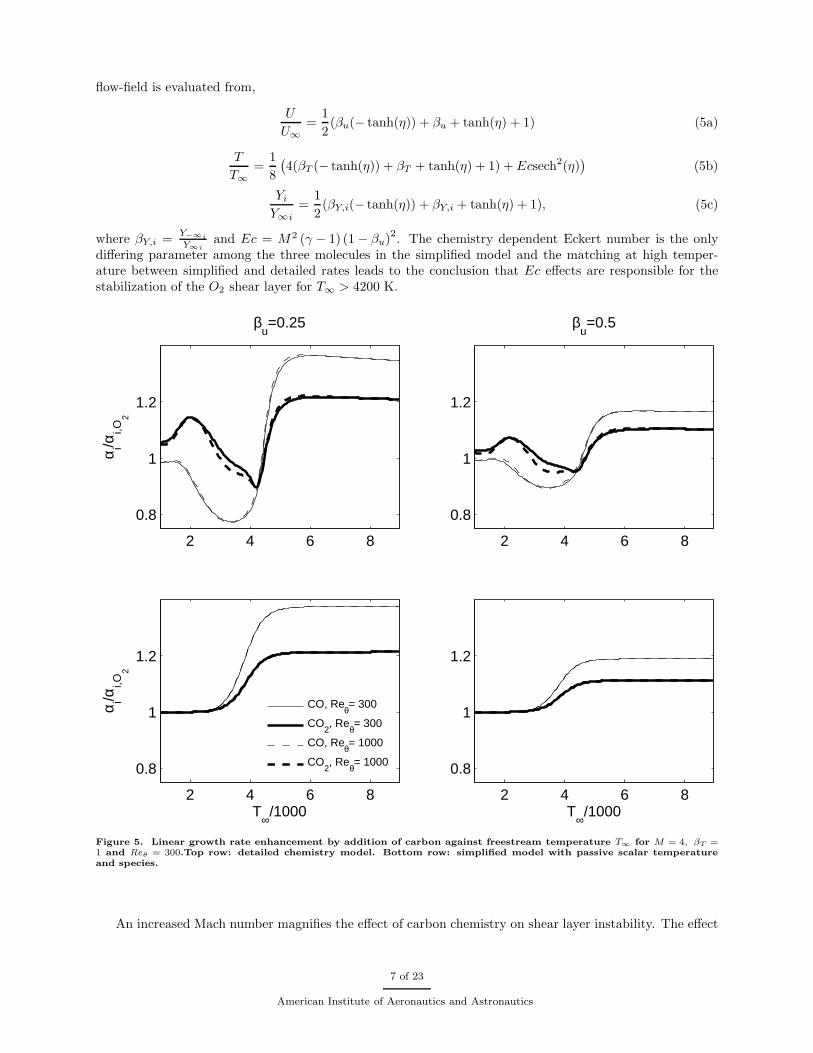
The cross over effect is analyzed in more details when αi/αi,O2is plotted against the freestream tempera-
ture in Fig. 5. In the top row, CO2 and CO growth rates are scaled by the O2 analog and plotted against thefree-stream temperature for Reθ = (300, 1000), βu = (0.25, 0.5) and M = 4. Variations of the augmentationratio αi/αi,O2
with the momentum thickness are due to Damkholer scaling, and, thus, indicate a secondaryeffect of non-equilibrium kinetic on growth rate. The increase of αi,CO2
/αi,O2for T∞ ∈ [1000, 2200] K, and
the drop of both αi,CO2/αi,O2
and αi,CO/αi,O2for T∞ ∈ [2200, 4000] K is explained by the previously dis-
cussed effect of dissociation on viscous heating terms. The fast increase in both αi,CO2/αi,O2
and αi,CO/αi,O2
at T∞ ≈ 4200 K is due to the increase in the Eckert number due to the dissociation of O2 into atomic oxygenand the consequent increase in γ∞.
To prove this, the bottom row of Fig. 5 shows growth rates against the freestream temperature for the sameconditions as in the top row, but evaluated with an hyper-tangent velocity profile and passive temperatureand species.8 Letting η ≡ Y/ (2
√x) , where Y is the Howarth-Dorodnitzyn variable Y =
∫ y
0ρ dy, the passive
6 of 23
American Institute of Aeronautics and Astronautics
flow-field is evaluated from,
U
U∞
=1
2(βu(− tanh(η)) + βu + tanh(η) + 1) (5a)
T
T∞
=1
8
(
4(βT (− tanh(η)) + βT + tanh(η) + 1) + Ecsech2(η))
(5b)
Yi
Y∞i
=1
2(βY,i(− tanh(η)) + βY,i + tanh(η) + 1), (5c)
where βY,i =Y−∞i
Y∞iand Ec = M2 (γ − 1) (1 − βu)
2. The chemistry dependent Eckert number is the only
differing parameter among the three molecules in the simplified model and the matching at high temper-ature between simplified and detailed rates leads to the conclusion that Ec effects are responsible for thestabilization of the O2 shear layer for T∞ > 4200 K.
2 4 6 8
0.8
1
1.2
βu=0.25
α i/αi,O
2
2 4 6 8
0.8
1
1.2
βu=0.5
2 4 6 8
0.8
1
1.2
T∞/1000
α i/αi,O
2
2 4 6 8
0.8
1
1.2
T∞/1000
CO, Reθ= 300
CO2, Reθ= 300
CO, Reθ= 1000
CO2, Reθ= 1000
Figure 5. Linear growth rate enhancement by addition of carbon against freestream temperature T∞ for M = 4, βT =
1 and Reθ = 300.Top row: detailed chemistry model. Bottom row: simplified model with passive scalar temperatureand species.
An increased Mach number magnifies the effect of carbon chemistry on shear layer instability. The effect
7 of 23
American Institute of Aeronautics and Astronautics
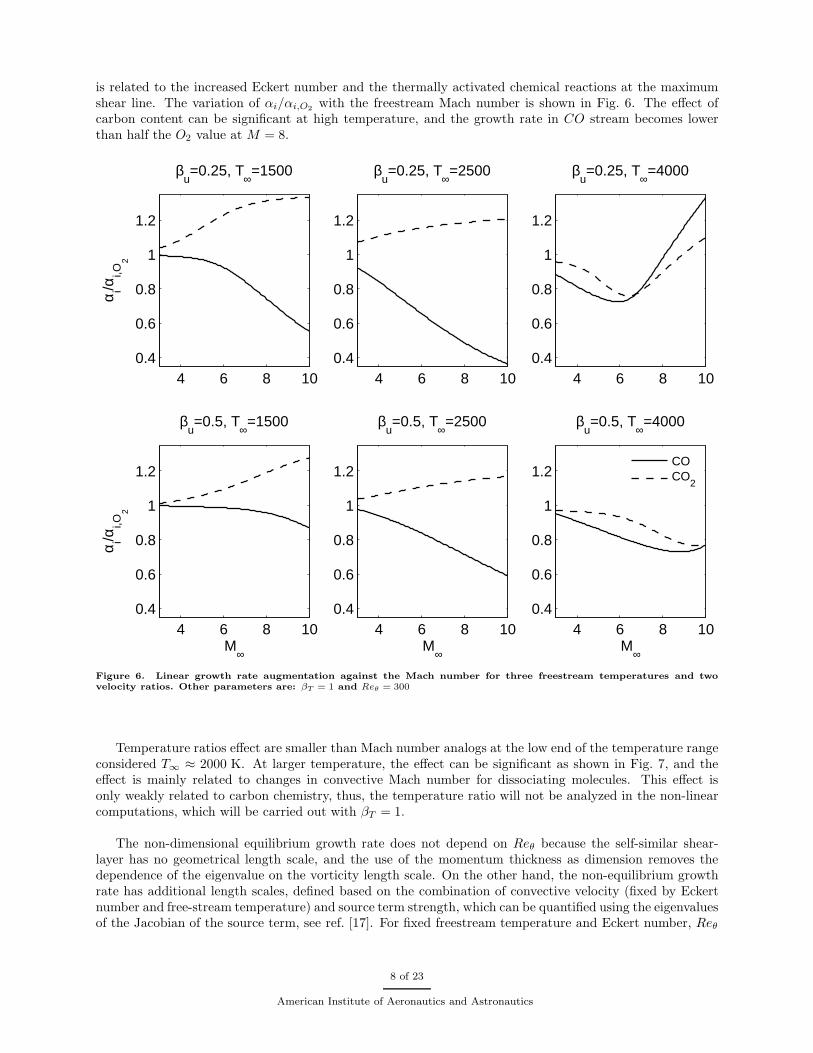
is related to the increased Eckert number and the thermally activated chemical reactions at the maximumshear line. The variation of αi/αi,O2
with the freestream Mach number is shown in Fig. 6. The effect ofcarbon content can be significant at high temperature, and the growth rate in CO stream becomes lowerthan half the O2 value at M = 8.
4 6 8 100.4
0.6
0.8
1
1.2
βu=0.25, T
∞=1500
α i/αi,O
2
4 6 8 100.4
0.6
0.8
1
1.2
βu=0.25, T
∞=2500
4 6 8 100.4
0.6
0.8
1
1.2
βu=0.25, T
∞=4000
4 6 8 100.4
0.6
0.8
1
1.2
βu=0.5, T
∞=1500
α i/αi,O
2
M∞
4 6 8 100.4
0.6
0.8
1
1.2
βu=0.5, T
∞=2500
M∞
4 6 8 100.4
0.6
0.8
1
1.2
βu=0.5, T
∞=4000
M∞
COCO
2
Figure 6. Linear growth rate augmentation against the Mach number for three freestream temperatures and twovelocity ratios. Other parameters are: βT = 1 and Reθ = 300
Temperature ratios effect are smaller than Mach number analogs at the low end of the temperature rangeconsidered T∞ ≈ 2000 K. At larger temperature, the effect can be significant as shown in Fig. 7, and theeffect is mainly related to changes in convective Mach number for dissociating molecules. This effect isonly weakly related to carbon chemistry, thus, the temperature ratio will not be analyzed in the non-linearcomputations, which will be carried out with βT = 1.
The non-dimensional equilibrium growth rate does not depend on Reθ because the self-similar shear-layer has no geometrical length scale, and the use of the momentum thickness as dimension removes thedependence of the eigenvalue on the vorticity length scale. On the other hand, the non-equilibrium growthrate has additional length scales, defined based on the combination of convective velocity (fixed by Eckertnumber and free-stream temperature) and source term strength, which can be quantified using the eigenvaluesof the Jacobian of the source term, see ref. [17]. For fixed freestream temperature and Eckert number, Reθ
8 of 23
American Institute of Aeronautics and Astronautics

1 1.5 20.7
0.8
0.9
1
1.1
βu=0.25, T
∞=1500
α i/αi,O
2
1 1.5 20.7
0.8
0.9
1
1.1
βu=0.25, T
∞=2500
1 1.5 20.7
0.8
0.9
1
1.1
βu=0.25, T
∞=4000
1 1.5 20.7
0.8
0.9
1
1.1
βu=0.5, T
∞=1500
α i/αi,O
2
βT
1 1.5 20.7
0.8
0.9
1
1.1
βu=0.5, T
∞=2500
βT
1 1.5 20.7
0.8
0.9
1
1.1
βu=0.5, T
∞=4000
βT
COCO
2
Figure 7. Variation of linear growth rate with the stream temperature ratio. The velocity ratio and freestreamtemperature are indicated on the column title; Reθ = 300 and 950 for the first and second row respectively; Eckertnumber is M = 4.
9 of 23
American Institute of Aeronautics and Astronautics
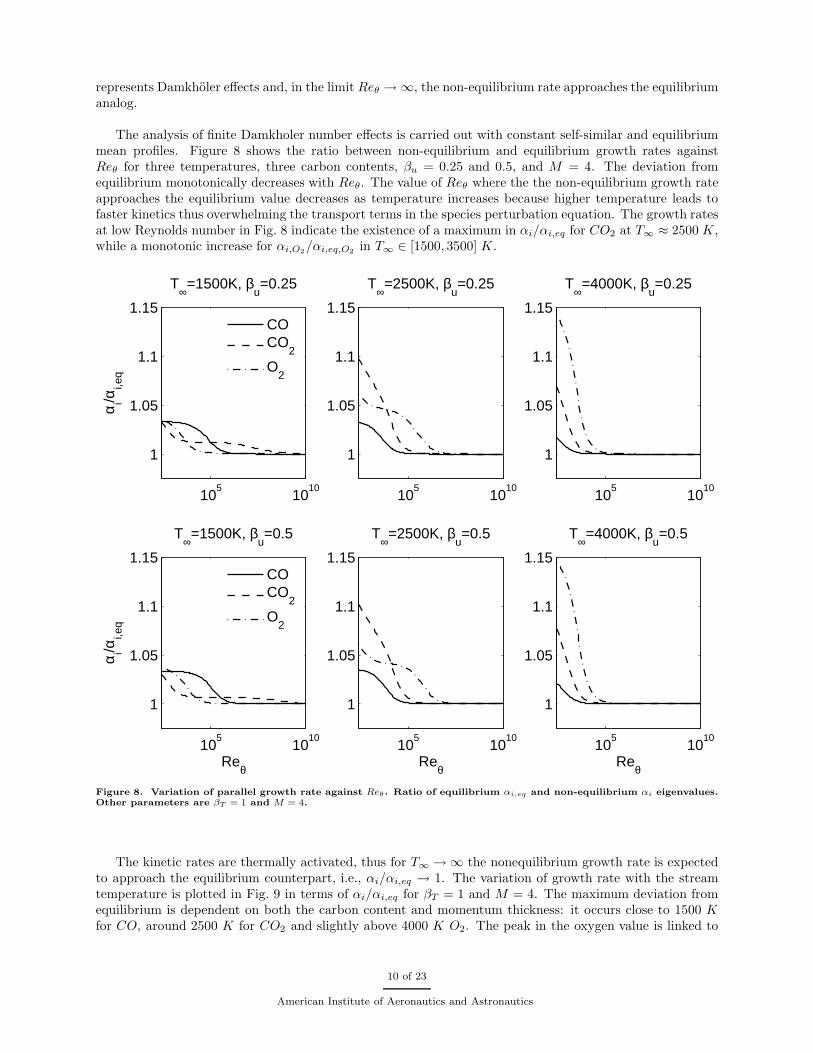
represents Damkholer effects and, in the limit Reθ → ∞, the non-equilibrium rate approaches the equilibriumanalog.
The analysis of finite Damkholer number effects is carried out with constant self-similar and equilibriummean profiles. Figure 8 shows the ratio between non-equilibrium and equilibrium growth rates againstReθ for three temperatures, three carbon contents, βu = 0.25 and 0.5, and M = 4. The deviation fromequilibrium monotonically decreases with Reθ. The value of Reθ where the the non-equilibrium growth rateapproaches the equilibrium value decreases as temperature increases because higher temperature leads tofaster kinetics thus overwhelming the transport terms in the species perturbation equation. The growth ratesat low Reynolds number in Fig. 8 indicate the existence of a maximum in αi/αi,eq for CO2 at T∞ ≈ 2500 K,while a monotonic increase for αi,O2
/αi,eq,O2in T∞ ∈ [1500, 3500] K.
105
1010
1
1.05
1.1
1.15
T∞=1500K, β
u=0.25
α i/αi,e
q
105
1010
1
1.05
1.1
1.15
T∞=2500K, β
u=0.25
105
1010
1
1.05
1.1
1.15
T∞=4000K, β
u=0.25
105
1010
1
1.05
1.1
1.15
T∞=1500K, β
u=0.5
Reθ
α i/αi,e
q
105
1010
1
1.05
1.1
1.15
T∞=2500K, β
u=0.5
Reθ
105
1010
1
1.05
1.1
1.15
T∞=4000K, β
u=0.5
Reθ
COCO
2
O2
COCO
2
O2
Figure 8. Variation of parallel growth rate against Reθ. Ratio of equilibrium αi,eq and non-equilibrium αi eigenvalues.Other parameters are βT = 1 and M = 4.
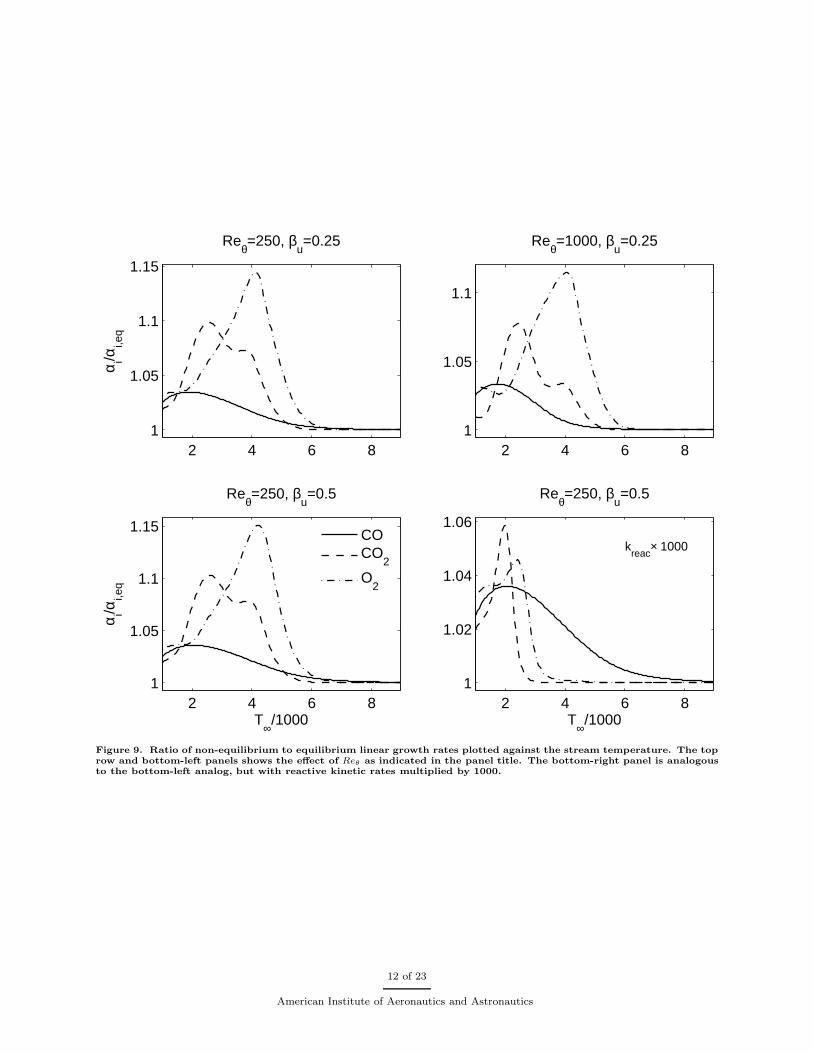
The kinetic rates are thermally activated, thus for T∞ → ∞ the nonequilibrium growth rate is expectedto approach the equilibrium counterpart, i.e., αi/αi,eq → 1. The variation of growth rate with the streamtemperature is plotted in Fig. 9 in terms of αi/αi,eq for βT = 1 and M = 4. The maximum deviation fromequilibrium is dependent on both the carbon content and momentum thickness: it occurs close to 1500 Kfor CO, around 2500 K for CO2 and slightly above 4000 K O2. The peak in the oxygen value is linked to
10 of 23
American Institute of Aeronautics and Astronautics
source terms controlling the dissociation reaction 2O + M → O2 + M , while the peak in CO2 is associatedwith the exchange reaction CO2 → CO + 1/2O2.
In order to eliminate the contribution of reactive collision and isolate that of vibrational relaxation, inthe bottom-right panel the rate constant of the reactive ones is multiplied by 1000, effectively pushing inthermochemical equilibrium. The peak in αi/αi,eq due to vibrational relaxation occurs at a lower temperaturethan the baseline case (bottom-left panel), and its magnitude is about half that due to dissociation chemistry.
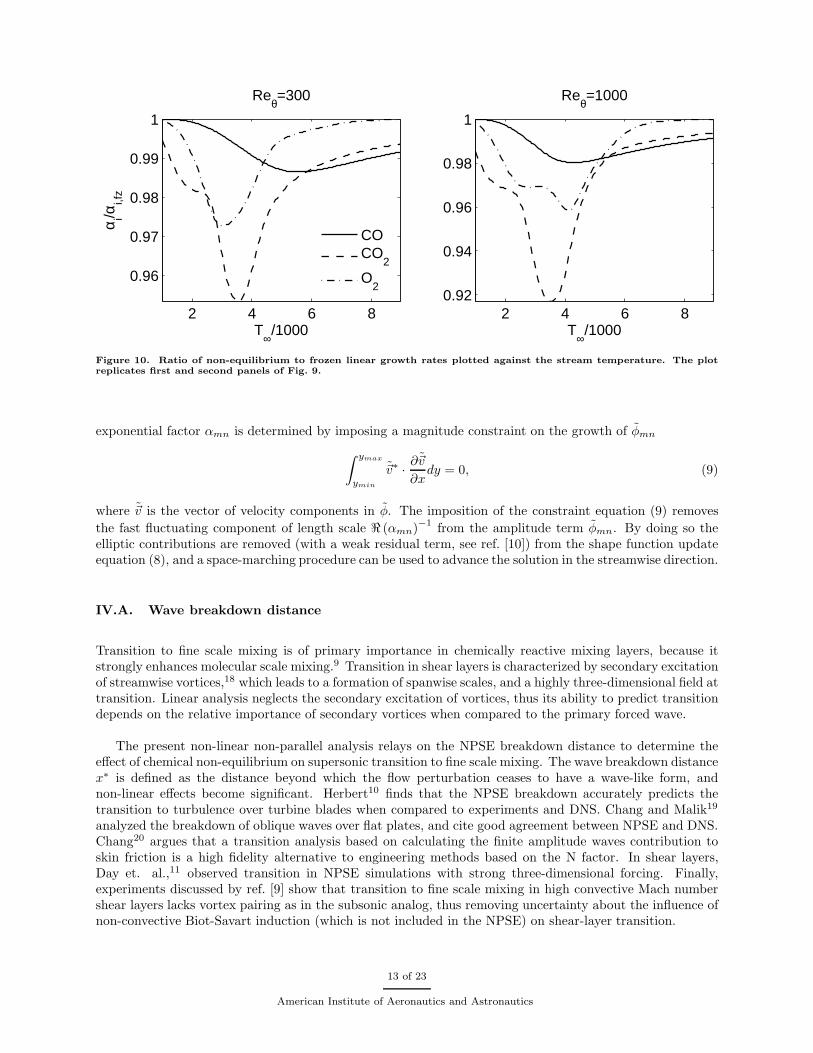
Results for βu ∈ [0.25, 0.75] and βT ∈ [0.7, 2] confirm the trends shown in Fig. 9, thus, an energizingeffect (smaller than 15 %) of finite rate chemistry when compared to equilibrium is found for all shearlayers analyzed. On one had, this conclusion is not antithetic to the boundary layer analysis of Johnsonand Candler,5 who showed that finite rate chemistry is stabilizing for conical flows. The rationale is thatref. [5] compared frozen and finite rate chemistry. Growth rates obtained with these two caloric models arecompared in Fig. 10, which replicates first and second panels of Fig. 9, and shows kinetic driven stabilizationat non-zero Damkholer number. On the other hand, the effect of finite rate chemistry on carbon containingshear layers cannot be explained by acoustic energy absorption into vibrational degrees of freedom, whichpeaks at some characteristic frequencies, as explained by ref. [4]. The rationale is that −αi monotonicallydecreases with the Damkholer number.
In summary, endothermic reactions affect supersonic shear-layer instability in two ways. The primaryeffect, of magnitude lower than 30% for M <= 5, is due to changes to the base profile primarily associatedwith dissociative and interchange reactions. The effect is energetic when endothermic reaction reduce thetemperature peak at the maximum shear line supported by viscous dissipation. A secondary, kinetic con-trolled, stabilizing effect has magnitude lower than 15% and is related to absorption of fluctuating energy intomolecular degrees of freedom. The effect becomes more prominent with an increase in Damkholer number.
IV. Parabolized stability expansion
The flow solution φ = [p, u, v, w, h, Yi]T is decomposed in a two dimensional mean φ and a three dimen-
sional fluctuating part φ′, which is expanded in Fourier modes
φ = φ (x, y) +
m=M,n=N∑
m=−M,n=−N
φ′
mn (x, y, z, t) + c.c., (6a)
Amn ≡ exp
[
i
∫ x
0
αmn (x) dx
]
, (6b)
where,φ′
mn ≡ φmn (x, y)Amn (x) exp [i (nβ1z − mω1t)] (7)
is the part of the amplitude that varies on the fast fluctuation spatial scale ℜ (αmn)−1, β1 and ω1 are thefundamental frequencies. The enthalpy h includes both sensible and formation parts, and is related to theother thermodynamic variables via a mixture dependent caloric equation of state.
Substitution of the PSE expansion in the Navier-Stokes equation leads to the parabolized stability equa-tions for the slow varying amplitudes
(
Amn∂
∂x+ Bmn
∂
∂y+ Cmn
∂
∂y2+ Dmn
)
φmn =Fmn
Amn, (8)
where Fmn is the vector of non linear interaction terms, while A, B, C, D are coefficient matrices. The
11 of 23
American Institute of Aeronautics and Astronautics
2 4 6 81
1.05
1.1
1.15
Reθ=250, β
u=0.25
α i/αi,e
q
2 4 6 81
1.05
1.1
Reθ=1000, β
u=0.25
2 4 6 81
1.05
1.1
1.15
Reθ=250, β
u=0.5
T∞/1000
α i/αi,e
q
2 4 6 81
1.02
1.04
1.06
Reθ=250, β
u=0.5
T∞/1000
kreac
× 1000COCO
2
O2
Figure 9. Ratio of non-equilibrium to equilibrium linear growth rates plotted against the stream temperature. The toprow and bottom-left panels shows the effect of Reθ as indicated in the panel title. The bottom-right panel is analogousto the bottom-left analog, but with reactive kinetic rates multiplied by 1000.
12 of 23
American Institute of Aeronautics and Astronautics
2 4 6 8
0.96
0.97
0.98
0.99
1
Reθ=300
T∞/1000
α i/αi,f
z
2 4 6 80.92
0.94
0.96
0.98
1
Reθ=1000
T∞/1000
COCO
2
O2
Figure 10. Ratio of non-equilibrium to frozen linear growth rates plotted against the stream temperature. The plotreplicates first and second panels of Fig. 9.
exponential factor αmn is determined by imposing a magnitude constraint on the growth of φmn
∫ ymax
ymin
~v∗ · ∂~v
∂xdy = 0, (9)
where ~v is the vector of velocity components in φ. The imposition of the constraint equation (9) removes
the fast fluctuating component of length scale ℜ (αmn)−1 from the amplitude term φmn. By doing so theelliptic contributions are removed (with a weak residual term, see ref. [10]) from the shape function updateequation (8), and a space-marching procedure can be used to advance the solution in the streamwise direction.
IV.A. Wave breakdown distance
Transition to fine scale mixing is of primary importance in chemically reactive mixing layers, because itstrongly enhances molecular scale mixing.9 Transition in shear layers is characterized by secondary excitationof streamwise vortices,18 which leads to a formation of spanwise scales, and a highly three-dimensional field attransition. Linear analysis neglects the secondary excitation of vortices, thus its ability to predict transitiondepends on the relative importance of secondary vortices when compared to the primary forced wave.
The present non-linear non-parallel analysis relays on the NPSE breakdown distance to determine theeffect of chemical non-equilibrium on supersonic transition to fine scale mixing. The wave breakdown distancex∗ is defined as the distance beyond which the flow perturbation ceases to have a wave-like form, andnon-linear effects become significant. Herbert10 finds that the NPSE breakdown accurately predicts thetransition to turbulence over turbine blades when compared to experiments and DNS. Chang and Malik19
analyzed the breakdown of oblique waves over flat plates, and cite good agreement between NPSE and DNS.Chang20 argues that a transition analysis based on calculating the finite amplitude waves contribution toskin friction is a high fidelity alternative to engineering methods based on the N factor. In shear layers,Day et. al.,11 observed transition in NPSE simulations with strong three-dimensional forcing. Finally,experiments discussed by ref. [9] show that transition to fine scale mixing in high convective Mach numbershear layers lacks vortex pairing as in the subsonic analog, thus removing uncertainty about the influence ofnon-convective Biot-Savart induction (which is not included in the NPSE) on shear-layer transition.
13 of 23
American Institute of Aeronautics and Astronautics
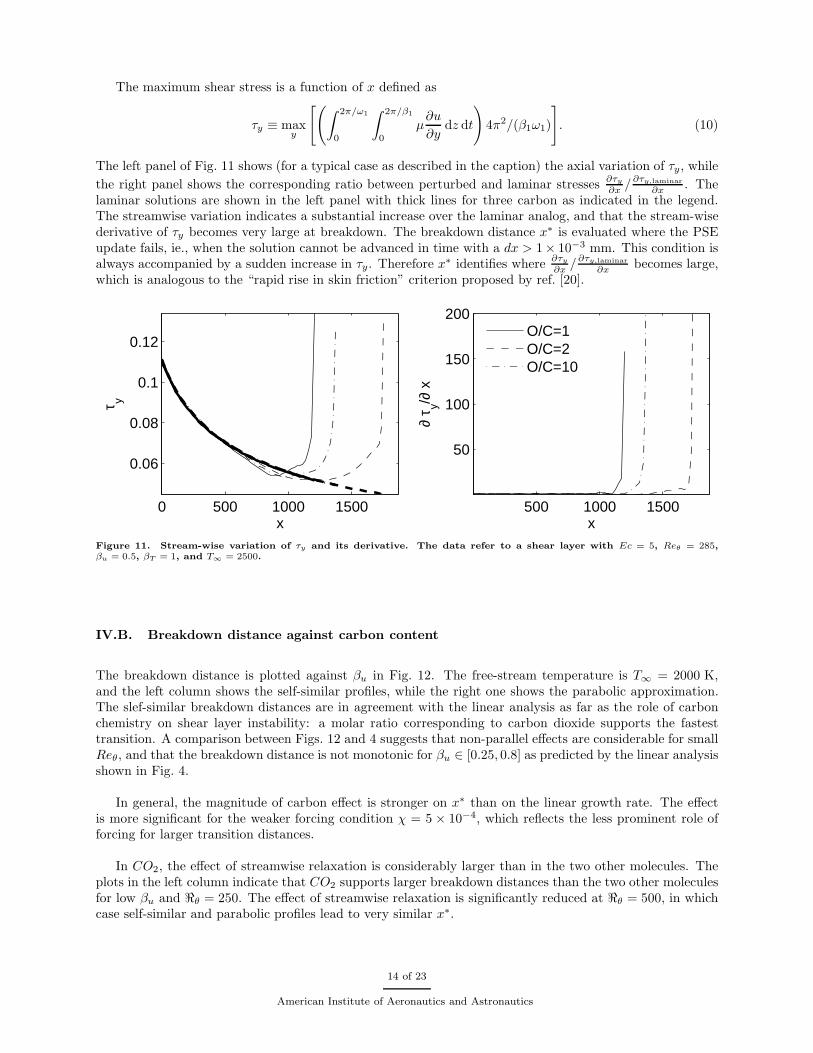
The maximum shear stress is a function of x defined as
τy ≡ maxy
[(
∫ 2π/ω1
0
∫ 2π/β1
0
µ∂u
∂ydz dt
)
4π2/(β1ω1)
]
. (10)
The left panel of Fig. 11 shows (for a typical case as described in the caption) the axial variation of τy, while
the right panel shows the corresponding ratio between perturbed and laminar stresses∂τy
∂x /∂τy,laminar
∂x . Thelaminar solutions are shown in the left panel with thick lines for three carbon as indicated in the legend.The streamwise variation indicates a substantial increase over the laminar analog, and that the stream-wisederivative of τy becomes very large at breakdown. The breakdown distance x∗ is evaluated where the PSEupdate fails, ie., when the solution cannot be advanced in time with a dx > 1× 10⁻³ mm. This condition isalways accompanied by a sudden increase in τy. Therefore x∗ identifies where
∂τy
∂x /∂τy,laminar
∂x becomes large,which is analogous to the “rapid rise in skin friction” criterion proposed by ref. [20].
0 500 1000 1500
0.06
0.08
0.1
0.12
τ y
x500 1000 1500
50
100
150
200
x
∂ τ y/∂
x
O/C=1O/C=2O/C=10
Figure 11. Stream-wise variation of τy and its derivative. The data refer to a shear layer with Ec = 5, Reθ = 285,βu = 0.5, βT = 1, and T∞ = 2500.
IV.B. Breakdown distance against carbon content
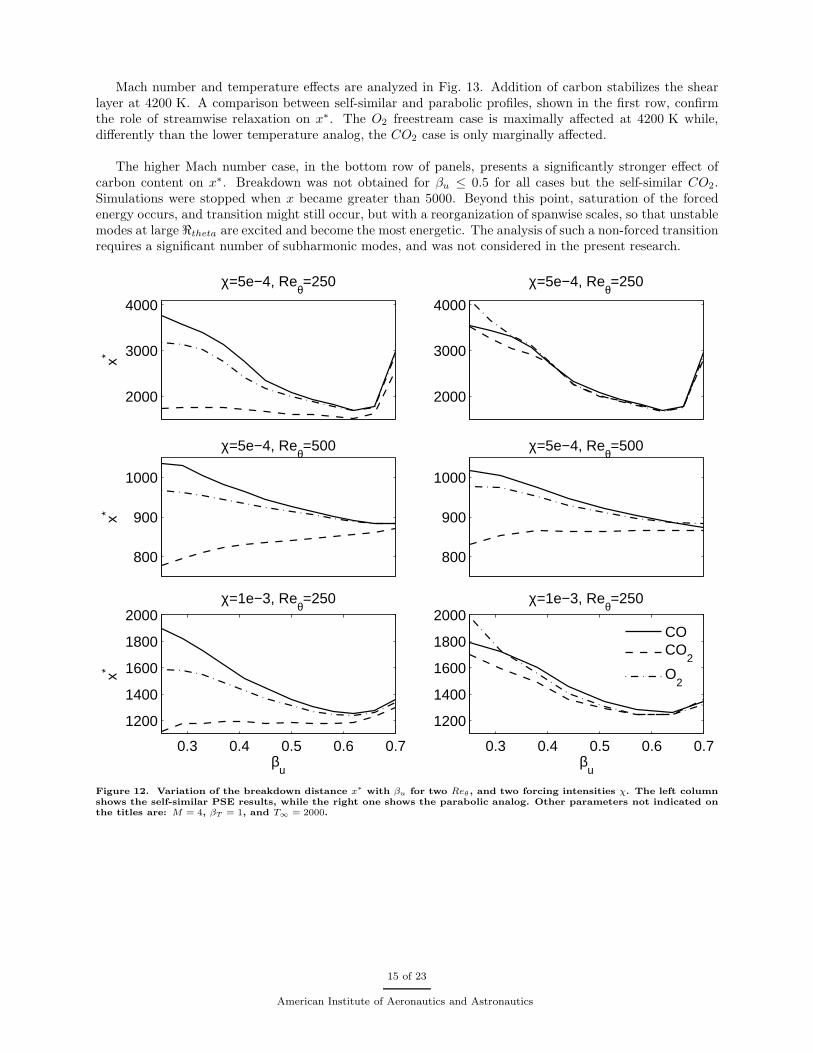
The breakdown distance is plotted against βu in Fig. 12. The free-stream temperature is T∞ = 2000 K,and the left column shows the self-similar profiles, while the right one shows the parabolic approximation.The slef-similar breakdown distances are in agreement with the linear analysis as far as the role of carbonchemistry on shear layer instability: a molar ratio corresponding to carbon dioxide supports the fastesttransition. A comparison between Figs. 12 and 4 suggests that non-parallel effects are considerable for smallReθ, and that the breakdown distance is not monotonic for βu ∈ [0.25, 0.8] as predicted by the linear analysisshown in Fig. 4.
In general, the magnitude of carbon effect is stronger on x∗ than on the linear growth rate. The effectis more significant for the weaker forcing condition χ = 5 × 10⁻⁴, which reflects the less prominent role offorcing for larger transition distances.
In CO2, the effect of streamwise relaxation is considerably larger than in the two other molecules. Theplots in the left column indicate that CO2 supports larger breakdown distances than the two other moleculesfor low βu and ℜθ = 250. The effect of streamwise relaxation is significantly reduced at ℜθ = 500, in whichcase self-similar and parabolic profiles lead to very similar x∗.
14 of 23
American Institute of Aeronautics and Astronautics
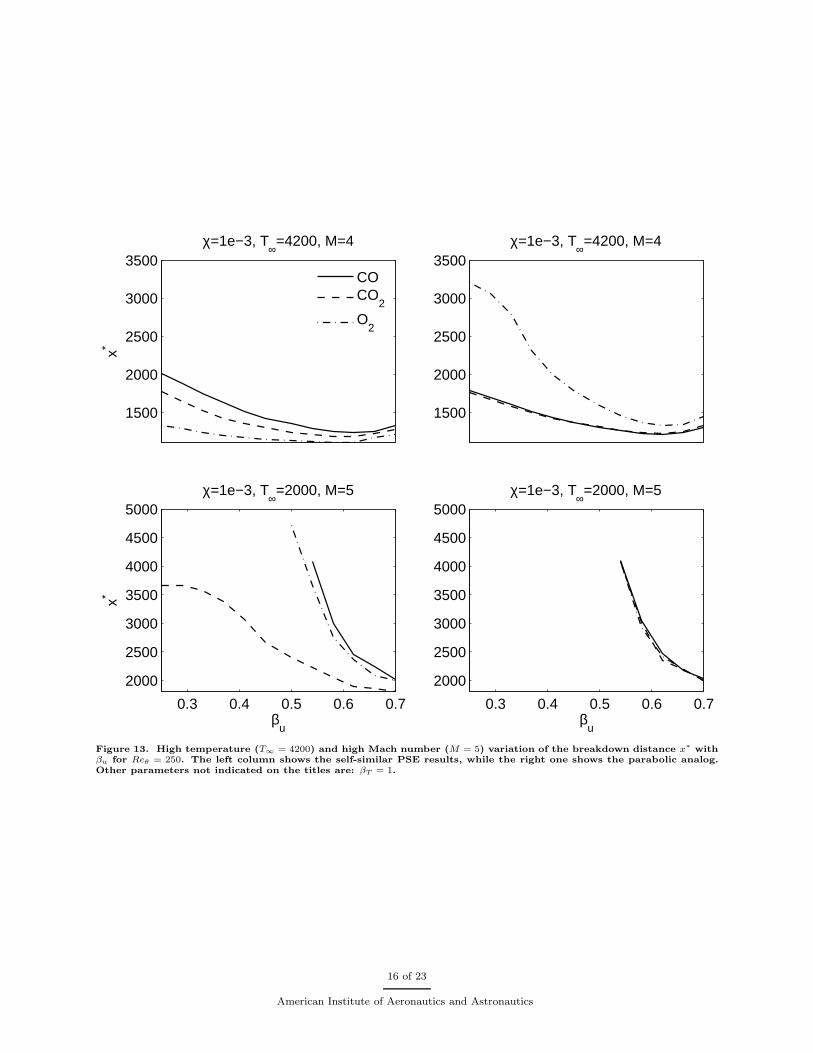
Mach number and temperature effects are analyzed in Fig. 13. Addition of carbon stabilizes the shearlayer at 4200 K. A comparison between self-similar and parabolic profiles, shown in the first row, confirmthe role of streamwise relaxation on x∗. The O2 freestream case is maximally affected at 4200 K while,differently than the lower temperature analog, the CO2 case is only marginally affected.
The higher Mach number case, in the bottom row of panels, presents a significantly stronger effect ofcarbon content on x∗. Breakdown was not obtained for βu ≤ 0.5 for all cases but the self-similar CO2.Simulations were stopped when x became greater than 5000. Beyond this point, saturation of the forcedenergy occurs, and transition might still occur, but with a reorganization of spanwise scales, so that unstablemodes at large ℜtheta are excited and become the most energetic. The analysis of such a non-forced transitionrequires a significant number of subharmonic modes, and was not considered in the present research.
2000
3000
4000
χ=5e−4, Reθ=250
x*
2000
3000
4000
χ=5e−4, Reθ=250
800
900
1000
χ=5e−4, Reθ=500
x*
800
900
1000
χ=5e−4, Reθ=500
0.3 0.4 0.5 0.6 0.7
1200
1400
1600
1800
2000χ=1e−3, Re
θ=250
βu
x*
0.3 0.4 0.5 0.6 0.7
1200
1400
1600
1800
2000χ=1e−3, Re
θ=250
βu
COCO
2
O2
Figure 12. Variation of the breakdown distance x∗ with βu for two Reθ , and two forcing intensities χ. The left columnshows the self-similar PSE results, while the right one shows the parabolic analog. Other parameters not indicated onthe titles are: M = 4, βT = 1, and T∞ = 2000.
15 of 23
American Institute of Aeronautics and Astronautics
1500
2000
2500
3000
3500
x*
χ=1e−3, T∞=4200, M=4
COCO
2
O2
1500
2000
2500
3000
3500χ=1e−3, T
∞=4200, M=4
0.3 0.4 0.5 0.6 0.7
2000
2500
3000
3500
4000
4500
5000
βu
x*
χ=1e−3, T∞=2000, M=5
0.3 0.4 0.5 0.6 0.7
2000
2500
3000
3500
4000
4500
5000
βu
χ=1e−3, T∞=2000, M=5
Figure 13. High temperature (T∞ = 4200) and high Mach number (M = 5) variation of the breakdown distance x∗ withβu for Reθ = 250. The left column shows the self-similar PSE results, while the right one shows the parabolic analog.Other parameters not indicated on the titles are: βT = 1.
16 of 23
American Institute of Aeronautics and Astronautics
IV.C. Chemistry effects on primary and secondary instability
Bayly21 analysis suggests that transition in convectively unstable (i.e., shear-flows) proceeds through asuccession of increasingly more complex instabilities supported by the distorted basic flow. In planar mixinglayers, primary forcing leads to a highly three-dimensional secondary wave pattern, which enhances molecularmixing by generating a sharp decrease in spanwise scales, a phenomenon described by ref. [9] as mixingtransition.
In this section, the streamwise development of the primary wave, the distortion of the basic state andthe destabilization of secondary waves are correlated to carbon chemistry within the NPSE framework. Thedeviation between linear and non-linear evolution of the forced frequency (primary wave) is analyzed in termsof the kinetic energy growth rate αE ≡ −1/Ea
∂Ea
∂x , where Ea is the kinetic energy of the most amplifiedlinear mode. Figure 14 shows the linear and non-linear values of αE with thick and thin lines respectivelyfor βu = 0.37, and for a parameter set identical to that discussed in the first four panels of Fig. 12.
A comparison of the αE values at x = 0 against the linear rates indicates that non-parallel and viscousterms are of secondary importance on initial growth: αE,CO2
/αE,O2≈ 1.1 and αE,CO/αE,O2
≈ 0.97 aresimilar to the values reported in Fig. 5.
In all panels of Fig. 14, the primary wave growth rate diminishes with streamwise distance because ofthe stabilizing effect associated with an increase in momentum thickness. The increase is faster for the lowReθcase, where the primary wave reaches a negative rate and saturates before secondary growth begins. Onthe other hand, at Reθ = 500, secondary instability begins when the primary wave is still unstable, andsaturation does not occur. Comparing the left (self-similar) and right (parabolic) columns shows that thesignificant increase in transition distance for CO2 is associated to a small decrease in αE of the primarywave, which is predicted by both linear and non-linear calculations.
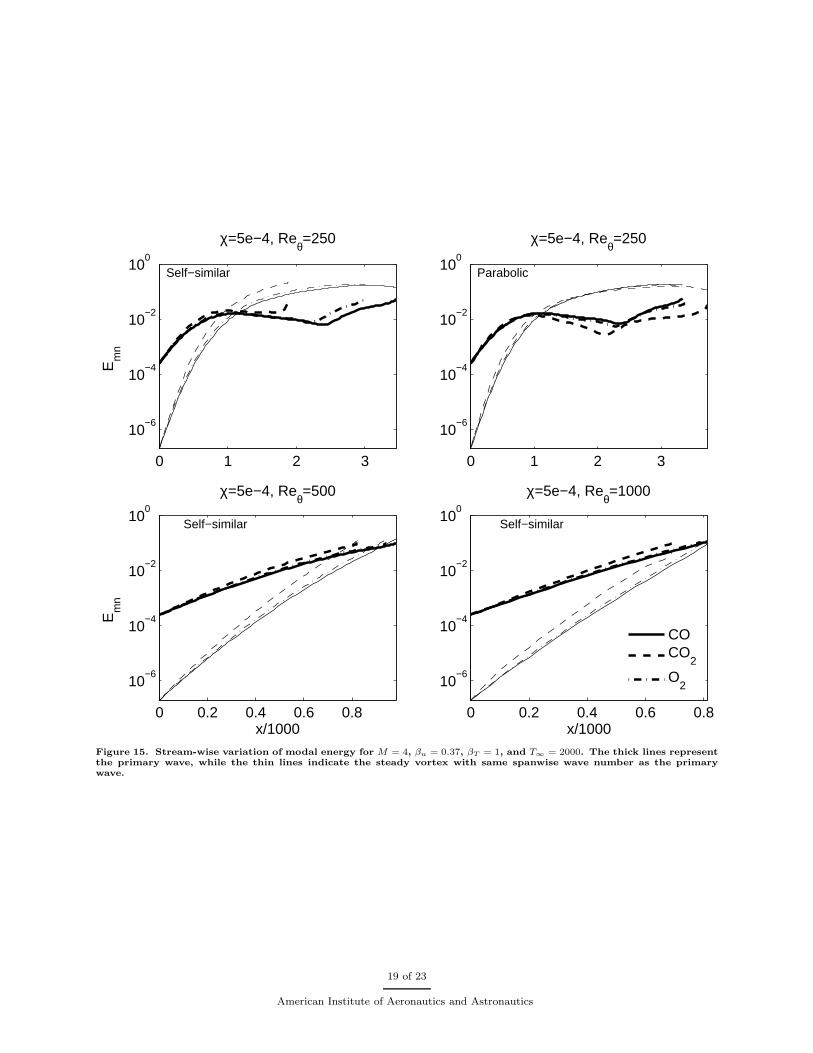
A more detailed analysis of the transition process at βu = 0.37 is carried out by comparing in Fig. 15 themodal energy of the forced wave and most amplified stationary vortex for self-similar and parabolic profiles.
The first, third and fourth panels show self similar results for Reθ = 250, Reθ = 500 and Reθ = 1000respectively, and suggest that for lower Reθthe stationary vortex becomes energetically dominant over theprimary wave at a larger streamwise location and at much lower energy (approximately a quarter), whilethe transfer between primary wave and stationary flow continues well after saturation. As a result, atReθ = 250, secondary instability is driven by the much stronger vortices, while for larger Reθit is supportedby the primary distortion to the basic flow.
A comparison between different carbon contents leads to the conclusion that the carbon dioxide free-stream supports a significantly faster growth of the stationary vortex (dashed line in the top-left panel),which becomes more energetic than the primary wave at a lower streamwise location when compared toCO and O2. This effect is diminished by streamwise relaxation in the parabolic profile at Reθ = 250(top-right panel), thus explaining the later development of the secondary waves and the transition delay.
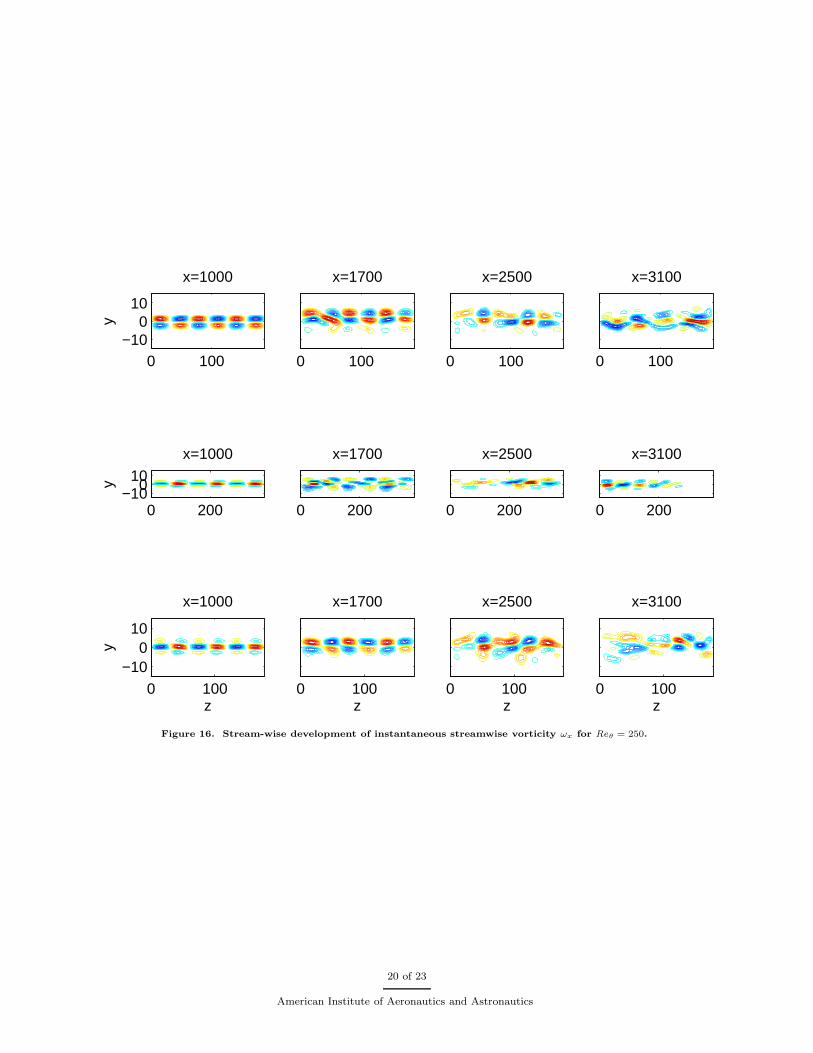
The spatial development of streamwise vorticity is shown in Figs. 16 and 17 for two values of Reθ. Thekey observation is that while in the high Reθcase the streamwise vorticity maintains the structure of theprimary wave, which thus drives the secondary instability, in the low Reθcase amalgamation of primarypatterns leads to change of spanwise scales for x > 1000. The conclusion is that the primary forcing hassaturated and secondary instability is supported by the more energetic vortices.
17 of 23
American Institute of Aeronautics and Astronautics

0 1 2 3−0.4
−0.2
0
0.2
0.4
0.6
0.8
χ=5e−4, Reθ=250
α E ×
100
0 1 2 3
−0.5
0
0.5
1
χ=5e−4, Reθ=250
0 0.2 0.4 0.6 0.8
0.4
0.5
0.6
0.7
0.8
0.9
1χ=5e−4, Re
θ=500
x/1000
α E ×
100
0 0.2 0.4 0.6 0.8
0.4
0.5
0.6
0.7
0.8
0.9
1χ=5e−4, Re
θ=500
x/1000
COCO
2
O2
Figure 14. Stream-wise variation of kinetic energy growth rate αE. The four panels refer to the same conditions asthe first four panels of Fig. 12: left column self-similar profiles and right column parabolic profiles; M = 4, βu = 0.37,βT = 1, and T∞ = 2000.
18 of 23
American Institute of Aeronautics and Astronautics
0 1 2 3
10−6
10−4
10−2
100
χ=5e−4, Reθ=250
Em
n
Self−similar
0 1 2 3
10−6
10−4
10−2
100
χ=5e−4, Reθ=250
Parabolic
0 0.2 0.4 0.6 0.8
10−6
10−4
10−2
100
χ=5e−4, Reθ=500
x/1000
Em
n
Self−similar
0 0.2 0.4 0.6 0.8
10−6
10−4
10−2
100
χ=5e−4, Reθ=1000
x/1000
Self−similar
COCO
2
O2
Figure 15. Stream-wise variation of modal energy for M = 4, βu = 0.37, βT = 1, and T∞ = 2000. The thick lines representthe primary wave, while the thin lines indicate the steady vortex with same spanwise wave number as the primarywave.
19 of 23
American Institute of Aeronautics and Astronautics
x=1000
y
0 100−10
010
x=1700
0 100
x=2500
0 100
x=3100
0 100
x=1000
y
0 200−10
010
x=1700
0 200
x=2500
0 200
x=3100
0 200
x=1000
y
z0 100
−100
10
x=1700
z0 100
x=2500
z0 100
x=3100
z0 100
Figure 16. Stream-wise development of instantaneous streamwise vorticity ωx for Reθ = 250.
20 of 23
American Institute of Aeronautics and Astronautics

x=492
y
0 100 200−10
010
x=675
0 100 200
x=792
0 100 200
x=967
0 100 200
x=500
y
0 100 200−10
010
x=667
0 100 200
x=800
0 100 200
x=860
0 100 200
x=500
y
z0 100 200
−100
10
x=667
z0 100 200
x=800
z0 100 200
x=952
z0 100 200
Figure 17. Stream-wise development of instantaneous streamwise vorticity ωx for Reθ = 500.
21 of 23
American Institute of Aeronautics and Astronautics
References
1Cheng, H., “Perspectives on hypersonic viscous flow research,” Annual Review of Fluid Mechanics, Vol. 25, No. 1, 1993,
pp. 455–484.
2Horvath, T., Berry, S., and Merski, N., “Hypersonic boundary/shear layer transition for blunt to slender configurations-
A NASA Langley experimental perspective,” Tech. Rep. RTO-MP-AVT-111, NATO Research and Technology Organisation
(RTO), 2004.
3Curran, E., Heiser, W., and Pratt, D., “Fluid phenomena in scramjet combustion systems,” Annual Review of Fluid
Mechanics, Vol. 28, No. 1, 1996, pp. 323–360.
4Fujii, K. and Hornung, H., “Experimental investigation of high-enthalpy effects on attachment-line boundary-layer tran-
sition,” AIAA Journal , Vol. 41, No. 7, 2003, pp. 1282–1291.
5Johnson, H., Seipp, T., and Candler, G., “Numerical study of hypersonic reacting boundary layer transition on cones,”
Physics of Fluids, Vol. 10, 1998, pp. 2676–2685.
6Mack, L., Boundary-layer stability theory , Jet Propulsion Laboratory Internal Document No. 900-277, Rev. A; also NASA
Contractor Report No. 131591, 1969.
7Jackson, T. and Grosch, C., “Inviscid spatial stability of a compressible mixing layer,” Journal of Fluid Mechanics,
Vol. 208, 1989, pp. 609–637.
8Criminale, W., Jackson, T., and Joslin, R., Theory and computation in hydrodynamic stability , Cambridge University
Press, UK, 2003.
9Gutmark, E., Schadow, K., and Yu, K., “Mixing enhancement in supersonic free shear flows,” Annual Review of Fluid
Mechanics, Vol. 27, No. 1, 1995, pp. 375–417.
10Herbert, T., “Parabolized stability equations,” Annual Review of Fluid Mechanics, Vol. 29, No. 1, 1997, pp. 245–283.
11Day, M., Mansour, N., and Reynolds, W., “Nonlinear stability and structure of compressible reacting mixing layers,”
Journal of Fluid Mechanics, Vol. 446, 2001, pp. 375–408.
12Giovangigli, V., Multicomponent flow modeling , Birkhauser, 1999.
13Kustova, E. and Nagnibeda, E., “Transport properties of a reacting gas mixture with strong vibrational and chemical
nonequilibrium,” Chemical Physics, Vol. 233, No. 1, 1998, pp. 57–75.
14Doraiswamy, S., Kelley, J., and Candler, G., “Vibrational Modeling of CO2 in High-Enthalpy Nozzle Flows,” Journal of
Thermophysics and Heat Transfer , Vol. 24, No. 1, 2010, pp. 9–17.
15Rothman, L., Gordon, I., Barber, R., Dothe, H., Gamache, R., Goldman, A., Perevalov, V., Tashkun, S., and Tennyson,
J., “HITEMP, the high-temperature molecular spectroscopic database,” Journal of Quantitative Spectroscopy and Radiative
Transfer , Vol. 111, No. 15, 2010, pp. 2139–2150.
16Rothman, L., Hawkins, R., Wattson, R., and Gamache, R., “Energy levels, intensities, and linewidths of atmospheric
carbon dioxide bands,” Journal of Quantitative Spectroscopy and Radiative Transfer , Vol. 48, No. 5-6, 1992, pp. 537–566.
17Massa, L. and Austin, J., “Spatial linear stability of a hypersonic shear layer with nonequilibrium thermochemistry,”
Physics of Fluids, Vol. 20, 2008, pp. 084104.
18Bernal, L. and Roshko, A., “Streamwise vortex structure in plane mixing layers,” Journal of Fluid Mechanics, Vol. 170,
1986, pp. 499–525.
19Chang, C. and Malik, M., “Oblique-mode breakdown and secondary instability in supersonic boundary layers,” Journal
of Fluid Mechanics, Vol. 273, 1994, pp. 323–360.
22 of 23
American Institute of Aeronautics and Astronautics

20Chang, C., “Langley stability and transition analysis code (LASTRAC) version 1.2 user manual,” NASA Langley Research
Center, NASA TM 213233 , 2004.
21Bayly, B., Orszag, S., and Herbert, T., “Instability mechanisms in shear-flow transition,” Annual Review of Fluid
Mechanics, Vol. 20, No. 1, 1988, pp. 359–391.
23 of 23
American Institute of Aeronautics and Astronautics

![Index [] · Elements 108, hassium (Hs), and element 112, the heaviest elements chemically investigated, are placed in groups 8 and 12, respectively. The arrangement of the ac-](https://static.fdocument.org/doc/165x107/5e69f87a3a2218242e6f29df/index-elements-108-hassium-hs-and-element-112-the-heaviest-elements-chemically.jpg)