
Discovery in Complex or Massive Datasets: Common ...
23
Discovery in Complex or Massive Datasets: Common Statistical Themes A Workshop funded by the National Science Foundation October 16-17, 2007 1
Transcript of Discovery in Complex or Massive Datasets: Common ...

Discovery in Complex or Massive Datasets:
Common Statistical Themes
A Workshop funded by the National Science FoundationOctober 16-17, 2007
1
.
25Harrison B. Prosper Statistical Issues at the LHC
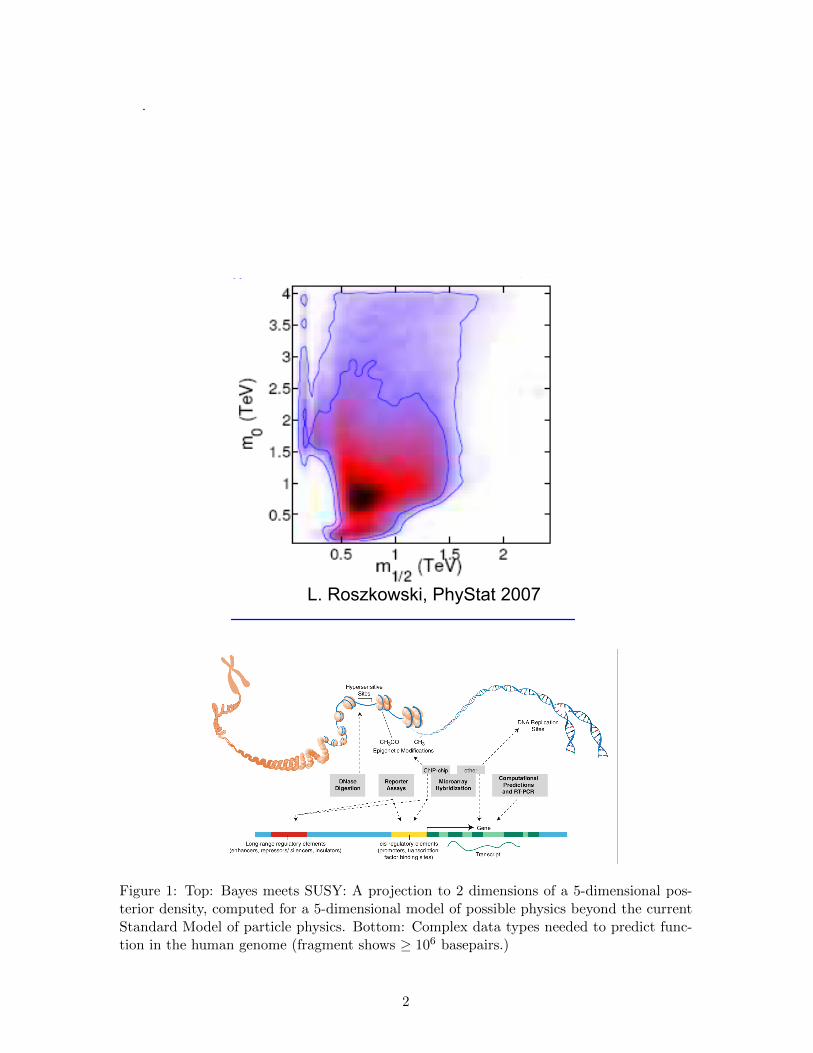
BayesBayes Meets SUSYMeets SUSY
Recently, the 5-D mSUGRA parameter space has been sampled using Markov Chain Monte Carlo and a prior flat in θM.
But that prior is not well founded
How can one incorporate priorsthat are better founded?
L. Roszkowski, PhyStat 2007
Figure 1: Top: Bayes meets SUSY: A projection to 2 dimensions of a 5-dimensional pos-terior density, computed for a 5-dimensional model of possible physics beyond the currentStandard Model of particle physics. Bottom: Complex data types needed to predict func-tion in the human genome (fragment shows ≥ 106 basepairs.)
2
Executive Summary
We report on a workshop, “Discovery in Complex or Massive Data Sets: Com-mon Statistical Themes”, held in Washington, October 16-17, 2007, funded byNSF’s Division of Mathematical Sciences. We connect with a later workshop, “DataEnabled Science in the Mathematical and Physical Sciences” held in Washington,March 29-30, 2010, funded by NSF’s Directorate of Mathematical and PhysicalSciences.
Research responding to important scientific and societal questions now requires thegeneration and understanding of vast amounts of often highly complex data. The 2007workshop dealt with crosscutting issues arising in the analysis of such data sets with aparticular focus on the role of statistical analysis. This was done through selected examplesmatching scientific and societal interests. In particular there were sessions on:
• Genomics and other areas of the biosciences that play a key role both in fundamentalbiology and in our current efforts to cure human diseases.• Computer models with an emphasis on modeling in the atmospheric sciences that
plays a critical role in climate change forecasting.• Finance, economics, and risk management focusing on problems of financial and other
economic forecasting and also on analysis of the flow of potential new regulatory data.• Particle and astrophysics pointing to a plethora of needs and issues, including scientific
questions such as solving massive inverse problems as they arise in the study of dark energy,statistical modeling of galactic filamentary structures, and policy issues such as determiningresource allocation among expensive experiments.• Network modeling pointing to an old type of data appearing with new complexity and
size from many sources: the Internet, ecological networks, biochemical pathways, etc.
In addition, there were two cross cutting sessions,
• Sparsity, which reflects how simply we can represent information, has been recognizedas the key feature that the new massive data sets must have for us to analyze them at all.Sparsity figures prominently in compressed sensing, now a major topic as the number andtypes of detectors and the amount of data they can generate has grown exponentially.• Machine Learning developed in computer science and statistics to integrate computa-
tional considerations with data modeling. Methods such as clustering look for sparsity ormore generally structure in the data. The field’s principles are entirely statistical. Its meth-ods play an important role in speech recognition, document retrieval, web-search, computervision, bioinformatics, neuroscience, and many other areas.
The activity of the 2007 Workshop foreshadowed in its treatment of analysis the 2010Data Enabled Science Workshop1, although the latter examined and gave policy recom-mendations for all divisions in the directorate, rather than focusing on the nature of thescience in one sub discipline. But the same themes came up, with all or most divisionalsections stressing the growth in size and complexity of data, interdisciplinary collaborationas key to modern progress, and the need for the development of common large databasesfor analysis. The use of such existing databases in the biomedical sciences and astrophysicswas implicit in the presentations of the 2007 workshop. More broadly, advances in statisticsand mathematics will be crucial for developments of DES in other disciplines.
In their respective ways both workshops point to the need to support organization andanalysis of our massive and high-dimensional data sets as a key to future advances.
1and a 2010 E.U. report “Riding the wave: How Europe can gain from the rising tide of scientific data”
3
Contents
1 Background 4
2 Introduction 4
3 Session Summaries 83.1 Statistics in Biological and Health Sciences . . . . . . . . . . . . . . . . . . 83.2 Sparsity: Compressed Sensing Using High-Dimensional Thinking . . . . . . 113.3 Computer and Simulation-Based Models . . . . . . . . . . . . . . . . . . . . 123.4 Statistics in Particle & Astrophysics . . . . . . . . . . . . . . . . . . . . . . 143.5 Economics, Finance and Risk Management . . . . . . . . . . . . . . . . . . 153.6 Machine Learning . . . . . . . . . . . . . . . . . . . . . . . . . . . . . . . . . 173.7 Network Modeling . . . . . . . . . . . . . . . . . . . . . . . . . . . . . . . . 20
4 Acknowledgements 22
5 Workshop Presenters 22
1 Background
This document is the report of a Workshop on Discovery in Complex or Massive Datasets:Common Statistical Themes, held October 16-17, 2007 in Washington, D.C. The idea andfunding for the workshop came from Dr. Peter March, Director of the Divison of Mathe-matical Sciences (DMS) at the National Science Foundation (NSF).
The impetus for the meeting was the observation that interdisciplinary research instatistics engages with so many fields of science that it is neither possible, nor perhapsappropriate, for DMS to fund all of it, either alone, or through partnerships – thoughsuccessful examples of the latter certainly exist. At the same time, DMS is the primarydisciplinary home for statistics within NSF, and so in particular is the primary locus withinthe Foundation for workforce develpment efforts in statistics. In such an environment, whatideas might guide DMS in its funding of statistics research?
The workshop and report develop the notion of “intersections” – that part of statisticalmethods and theory that has, or seems likely to have, impact in multiple scientific domains.The intent for the short workshop was to be illustrative rather than encylopedic. It is not,therefore, a report on the ’future of statistics’, and deliberately does not contain formalconsensus recommendations. However, we hope that the sampling of research areas inthis short report illustrates the existence of these intersectional topics and importance ofresearch into their development.
2 Introduction
The amount and complexity of data generated to support contemporary scientific investi-gation continues to grow rapidly, following its own type of Moore’s Law [11]. In domainsfrom genomics to climate science, statisticians are actively engaged in interdisciplinary re-search teams. In some areas, automated processes collect and process huge amounts ofinformation; in others simulations of complex systems are designed to generate information
4
about large scale behavior, and in still other areas, the very sources of data are productsof the information age.
There is substantial current activity to develop statistical ideas, methods and softwarein many of these domains, which include astronomy, genomics, climate science, financialmarket analysis and sensor networks. Statisticians are engaged in (often large) interdisci-plinary teams, and frequently receive significant research support from the relevant scientificdiscipline.
The history of statistics shows that, while frequently initially arising in response tochallenges in specific scientific domains, statistical methods and associated theory oftenachieve broader success and power by being subsequently applied to subjects far remotefrom those of origin. Well known examples include the analysis of variance, proportionalhazard models and the application of sparsity ideas in signal recovery.
We see enormous opportunity, then, in advancing the study of the “intersections” aris-ing from statistical research in today’s Age of Information – statistical problems, theories(including probabilistic models), tools and methods that arise in or are relevant to multipledomains of scientific enquiry, and as such, are moving or should move into the “core”.
The workshop aimed to enumerate some of today’s most intellectually compelling chal-lenges arising out of these intersections, and was guided by the hope of stimulating futureresearch advances that will extend and enhance our data analytic toolkit for scientific dis-covery.
In order to have a title that both has some focus, and yet is broadly inclusive, wechose “Discovery from Complex or Massive Datasets: Common Statistical Themes”. Here“massive” means large relative to existing capability in some way, including, but not re-stricted to, many cases (sample size), many variables (dimension), or many datasets (sensornetworks).
The workshop took a broad view of research in statistics, and included researchers whomay not identify themselves as statisticians yet who feel that advances in statistics arecentral to advances in science and society.
The body of the report contains short summaries of each of the sessions at the workshop.In this introduction, we illustrate three of the themes with brief paragraphs, indicatingin parentheses the sessions in which these themes come up explicitly or implicity. Weconclude with some reflections on national needs that will be served by a focus on statisticalintersections.
Sparsity. [§3.1, 3.2, 3.3, 3.4, 3.6] A preference for parsimony in scientific theories –captured in principles such as “Occam’s razor” – has long influenced statistical modelingand estimation. The size of contemporary datasets and the number of variables collectedmakes the search for, and exploitation of, sparsity even more important. For example, outof a huge list of proteins or genes, only an (unknown) few may be active in a particularmetabolic or disease process, or sharp changes in a generally smooth signal or image mayoccur at a small number of points or boundaries The sparsity of representation may be“hidden”: revealed only with the use of new function systems such as wavelets or curvelets.
The theme of sparsity draws upon and stimulates research in many areas of mathe-matics, statistics and computing: harmonic analysis and approximation theory (for thedevelopment and properties of representations), numerical analysis and scientific computa-tion (the associated algorithms), statistical theory and methods (techniques and propertieswhen applied to noisy data).
Sparsity ideas have recently given birth to a new circle of ideas and technologies knowncollectively as “Compressed Sensing”. It is common experience that many images can
5
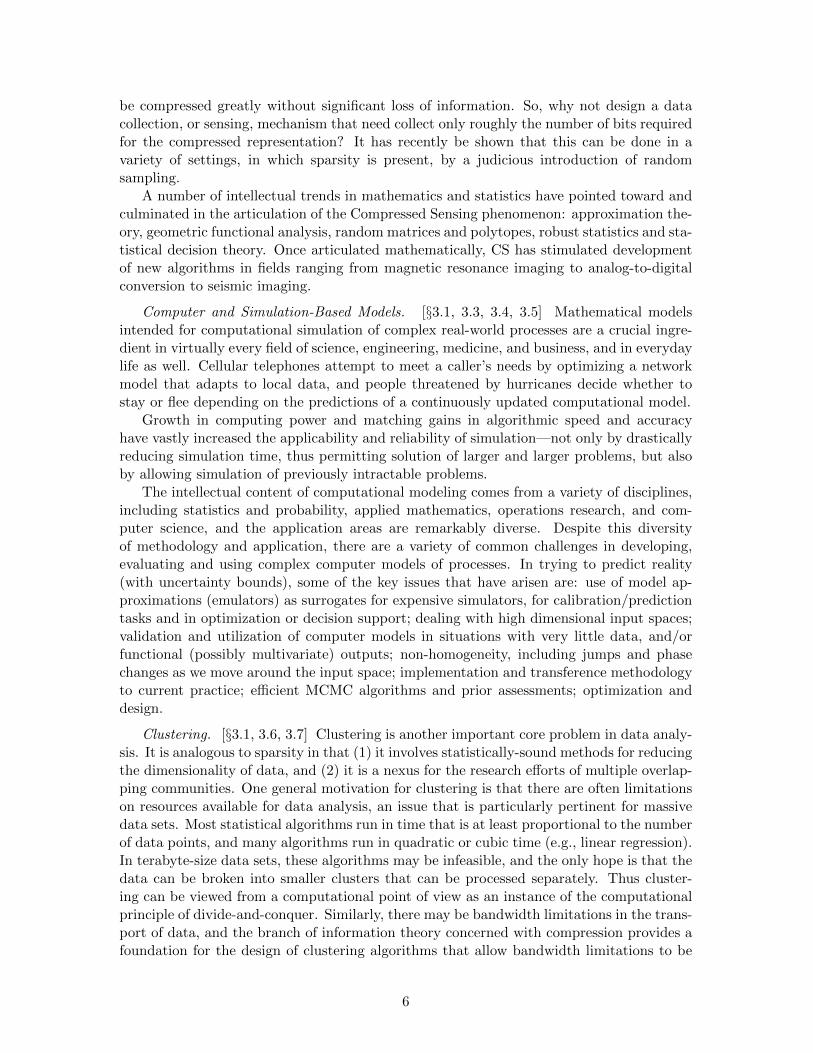
be compressed greatly without significant loss of information. So, why not design a datacollection, or sensing, mechanism that need collect only roughly the number of bits requiredfor the compressed representation? It has recently be shown that this can be done in avariety of settings, in which sparsity is present, by a judicious introduction of randomsampling.
A number of intellectual trends in mathematics and statistics have pointed toward andculminated in the articulation of the Compressed Sensing phenomenon: approximation the-ory, geometric functional analysis, random matrices and polytopes, robust statistics and sta-tistical decision theory. Once articulated mathematically, CS has stimulated developmentof new algorithms in fields ranging from magnetic resonance imaging to analog-to-digitalconversion to seismic imaging.
Computer and Simulation-Based Models. [§3.1, 3.3, 3.4, 3.5] Mathematical modelsintended for computational simulation of complex real-world processes are a crucial ingre-dient in virtually every field of science, engineering, medicine, and business, and in everydaylife as well. Cellular telephones attempt to meet a caller’s needs by optimizing a networkmodel that adapts to local data, and people threatened by hurricanes decide whether tostay or flee depending on the predictions of a continuously updated computational model.
Growth in computing power and matching gains in algorithmic speed and accuracyhave vastly increased the applicability and reliability of simulation—not only by drasticallyreducing simulation time, thus permitting solution of larger and larger problems, but alsoby allowing simulation of previously intractable problems.
The intellectual content of computational modeling comes from a variety of disciplines,including statistics and probability, applied mathematics, operations research, and com-puter science, and the application areas are remarkably diverse. Despite this diversityof methodology and application, there are a variety of common challenges in developing,evaluating and using complex computer models of processes. In trying to predict reality(with uncertainty bounds), some of the key issues that have arisen are: use of model ap-proximations (emulators) as surrogates for expensive simulators, for calibration/predictiontasks and in optimization or decision support; dealing with high dimensional input spaces;validation and utilization of computer models in situations with very little data, and/orfunctional (possibly multivariate) outputs; non-homogeneity, including jumps and phasechanges as we move around the input space; implementation and transference methodologyto current practice; efficient MCMC algorithms and prior assessments; optimization anddesign.
Clustering. [§3.1, 3.6, 3.7] Clustering is another important core problem in data analy-sis. It is analogous to sparsity in that (1) it involves statistically-sound methods for reducingthe dimensionality of data, and (2) it is a nexus for the research efforts of multiple overlap-ping communities. One general motivation for clustering is that there are often limitationson resources available for data analysis, an issue that is particularly pertinent for massivedata sets. Most statistical algorithms run in time that is at least proportional to the numberof data points, and many algorithms run in quadratic or cubic time (e.g., linear regression).In terabyte-size data sets, these algorithms may be infeasible, and the only hope is that thedata can be broken into smaller clusters that can be processed separately. Thus cluster-ing can be viewed from a computational point of view as an instance of the computationalprinciple of divide-and-conquer. Similarly, there may be bandwidth limitations in the trans-port of data, and the branch of information theory concerned with compression provides afoundation for the design of clustering algorithms that allow bandwidth limitations to be
6
surmounted. Another general motivation for clustering arises in exploratory data analysis,where the goal is to find relatively homogeneous subsets of data (or subsets of variables)that correspond to meaningful entities in some problem domain. Many research commu-nities have pursued such an agenda—notable examples include bioinformatics, astronomy,medicine, psychology, marketing, linguistics and artificial intelligence.
The result of this intense effort has been the development of literally hundreds of spe-cific clustering algorithms, including recent contributions from statistical mechanics, graphtheory and error-control coding. Statistics has also contributed many specific algorithms(including the prominent K-means algorithm), but even more importantly, statistics pro-vides a general framework for the evaluation of clustering methods, both from a theoreticalpoint of view and am empirical point of view. Such analyses make it possible to expose thetradeoffs involved in clustering, such that appropriate methods can be chosen for specificproblems.
Another key contribution of statistics is to provide methods for assessing uncertainty inclustering. As in any area of inference, it is essential to assess uncertainty in order to be ableto make statements about whether a phenomenon is likely to be meaningful or could havearisen solely by chance. Assessments of uncertainty are also necessary in order to comparemultiple competing models. In fact, one useful view of clustering is as a collection ofstatistical models, one model for each cluster, where the problem is to decide which modelsaccount for which data points. This brings clustering into contact with general problems ofmodel selection and model averaging, areas that have been very active in statistics in recentyears. Finally, though, clustering is the area where statistics and subject matter sciencemeet most intimately since the ultimate validation of a cluster has to be science based.
These three common themes are but examples. Other examples of crosscutting themesmight include data complexity, modelling at multiple scales, and the tradeoff between com-putational and optimality considerations.
General Remarks: Complexity and massive data sets go together: enormous numbersof huge vectors of categorical data as in the output of the second-generation sequencingmachines in genomics, images in fields ranging from physics, for instance, particle tracks,galactic filaments to neuroscience, for instance CAT scans, to spacetime fields in atmo-spheric sciences, to general graphical structure in network models. All these types of dataare found in combined form creating higher levels ad infinitem.
Statisticians have a long history of modeling complex data types, for instance the pro-portional hazards model with time varying covariates which has established itself in epi-demiology, but the challenges of the current types of data are unprecedented. This themewas stressed in each of the sessions. A consequence is an imperative for statisticians to towork closely with other applied mathematicians and computer scientists with their exper-tise in data structures and numerical stability of algorithms and also pure mathematicianswho have long studied abstract structures for their own sake. A second imperative, againapparent in all sessions, is the need to work closely in the development of methods andmodels with specialists in substantive fields of interest. Methods can become generic inmany fields only if they have proved their success in some field of application.
Another consequence of the data explosion, also apparent in many of the sessions,that has direct impact on theory as well as practice is the need to consider computationalefficiency as well as statistical optimality in the construction of new methods.
Comments on national needs: Support for research on “intersectional” topics willadvance the capability of statistical theories and methods to contribute to contemporary
7
challenges of discovery from massive and/or complex datasets, thus enhancing the nation’s“methodologic infrastructure” for research.
In conjuction with support for collaboration (and appropriate joint training with spe-cialists), research on ‘intersections’ offers the prospect of fostering the flow of ideas betweendisciplines, as analysis methods developed in one domain are transferred in other areas.
The vitality of both these enterprises is and will remain an important component ofmaintaining the competitiveness, and indeed, the leading character of the U.S. scientificresearch effort.
Turning to workforce issues, we are in an era of expansion in graduate and undergraduateprograms in statistics nationally, while at the same time retirements of faculty hired in the1960’s and 1970’s are accelerating. Interdisciplinary research is mostly (though of coursenot always) done by younger and mid-career faculty. Thus many retirements will depletethe strength of graduate programs in ‘core’ statistical theory and methods. Support forresearch on statistical intersections will enhance the pre- and post- doctoral level trainingof research statisticians who will be critically needed as replacement core faculty membersin expanding statistics programs around the country.
There is a second aspect of workforce development worth comment. Many statistics fac-ulty will obtain research support for their cross-disciplinary research from agencies focusedon a specific discipline. When such research yields methods or theory of potentially broaderscientific utility (an ‘intersection’), that funding agency may well not regard support forresearch into realizing that potential as part of its mission. Yet it is precisely such researchthat may help early career statistics faculty receive the kind of broader recognition withinthe statistics community that will help with promotion and career advancement.
3 Session Summaries
3.1 Statistics in Biological and Health Sciences
The biosciences, particularly molecular biology and the fields it has spawned, provide analmost paradigmatic view of the statistical themes that have emerged with the advent ofcomplex, massive data sets.
Over the last several years, biological research has undergone a major transformation asscientists have been assimilating the implications of the genetic revolution, developing newtechnology for high-throughput genotyping and characterization of the activity of genes,messenger RNAs, and proteins, and studying interplay of genes and the environment, andgenes and clinical treatments, in causing human diseases. Technological platforms haveadvanced to a stage where many biological entities, e.g., genes, transcripts, proteins, lipidsand sugars, can be measured on the whole genome scale, yielding massive high-throughput“omics” data, such as genomic, epigenomic, proteomic and metabolomic data. These mas-sive datasets need to be analyzed using biologically meaningful and computationally efficientstatistical and computational models with the goals of understanding the mechanisms ofexperimental and biological systems and to study the associations of genetic and environ-mental factors and disease phenotypes.
The sequencing of the human genome with its 3 billion basepairs was a landmark pre-ceded by the sequencing of the yeast genome and followed up to the present time by genomesof multiple species. The rapid advance of next generation sequencing technology makesgenome-wide sequencing of a large number of subjects feasible in the next few years. Thegenomes are enormous instruction manuals for producing the complex organisms of life.
8
To try to determine functions, an enormous variety of data are being generated, such asexpression of mRNAs by genes, binding sites of proteins produced by genes, images ofhundreds to thousands of individual cells with intensities of various processes measured byfluorescence, sequencing machines and alignment methods etc. The data is being generatedby international consortia such as ENCODE (Encylopedia of DNA) for general function,and the 1000 Genomes project for analysis of human variation, accumulating at the rateof terabytes in specialized databases. The high level goal of this enormous activity is to“annotate” genomes, that is, identify and ascribe “function” to the “words,” “sentences,”“paragraphs,” and “topics” of genomes by relating them to each other, to the machinery ofthe cell, the proteins that they produce and so on up the ladder of complexity. A referencefor more details of these activities is [1]. A more immediate goal is to investigate theirassociations with disease phenotypes [9].
The explosion of information about the human genome presents extraordinary chal-lenges in data processing, integration and analysis. These challenges include (1) manipu-lating and analyzing high-dimensional “omics” data using advanced and efficient statisticaland computational methods that are biologically meaningful; (2) integrating “omics” datafrom different sources for data analysis and result interpretation; (3) Conducting interdis-ciplinary research to help synthesize massive existing and rapidly increasing molecular andgenetic information to understand biological systems; (4) Developing innovative study de-signs and analysis and computational tools to study the interaction between genes (nature)and environment (nurture) and hence understand disease etiology and develop effective newdisease prevention and intervention strategies. These challenges provide enormous oppor-tunities for statisticians, both in new directions of research and training and call for urgentresponse as a community.
Data Integration: Biological systems and causes of diseases are complex and are af-fected by a spectrum of genes and gene products and environmental factors. Different typesof data, have to be integrated to understand biological systems and disease processes. Forexample, genome-wide association studies (GWAS) provide a powerful tool to genotypehundreds of thousands of common genetic variants across the whole genome to study theirroles and interactions with the environment in causing human diseases. In addition to thedevelopment of statistical and epidemiologic methods for the integration of high dimensionalmixed clinical and experimental data, integration with GWAS and other omic information,such as pathways, transcriptions, epigenetics and gene expression and regulatory mech-anisms for expression is important. Many public genetic databases have been availablerapidly, such as HapMap, UCSC genome browser, dbGaP, Ensemble. Data sharing is nowmandated for most of these databases. All these data resources and scientific needs makedata integration critical. Statisticians need to play a pivotal role in this endeavor and toincorporate this information in statistical modeling and analysis.
Such integration has long been a part of statistics. Categorical data are combined withnumerical data through logistic regression, vectors of numerical data can be combined viacanonical correlation analysis and so on. But what makes all this a new enterprise is thecomplexity, high dimensionality and size of the data and the inability to make real contribu-tions without deep knowledge of or close collaboration with specialists versed in the relevantnew biology. There is certainly a very important “computer science” aspect of manipulat-ing data but representation (modeling) and analysis have to be statistical, and insertion ofknowledge of biology and genetics is critical. The trade-off between computational effortand power of analysis is also a major challenge which has to be faced.
9
Stochastic Mechanistic Modeling. Another feature of the new technologies is that theyenable us to make measurements of complex quantities dynamically in time at differentscales and sometimes at heretofore- unavailable nanoscale resolution. These data call formixtures of modeling at different levels, purely stochastic at the nanoscale level mergingwith high dimensional Markov modeling, merging with dynamical systems modeling. Anexample of mechanistic stochastic modelling at nanoscales explaining phenomena at largescales is [6].
More generally, biological and many other (e.g. financial, geophysical) processes operateat several scales. This is clearly seen in the development of the embryo where stages arephysically identified but necessarily correspond to the cellular evolution and interactions ofmany proteins in many cells. Modeling changes of regime, (“emergent phenomena”), at acoarser scale arising from fine scales, when responses are highly multidimensional is a majorand novel challenge faced in modern statistics. This activity links naturally with appliedmathematics and our discussion of computer models.
Sparsity: As discussed earlier, biological processes and the data we gather on theminvolve the temporal evolution of huge numbers of genes and gene products, such as mRNAand proteins in different cell environments. It has become widely accepted in biology thatthis great complexity is built up out of a relatively small number of building blocks, subunitsof proteins, circuits in cellular processes, etc.
For understanding we need to find an appropriate alphabet of parts and proceduresout of the mess of different types of high dimensional indirect measurements that we have.This theme of sparsity is pervasive. We hope that for complex diseases, although manydifferent types of mutations may lead to the disease, a relatively small number of genes andpathways are involved.
Redundancy: Another aspect particularly important in biological systems is redundancy– if a pathway fails in most cases there should be an alternative to take up the slack. This cansometimes be interpreted as low dimensionality, ”covariates” or ”collinearity” of predictors.
Causality and Perturbation Experiments: A weakness of purely statistical analysis ofdata in the biological context is the lack of ground truth when checking statistical predic-tions. This can be mitigated through perturbation experiments, e.g. knock out of regionspredicted to have functional importance with the expectation of evidence of causation. Un-fortunately, masking effects are all too frequent in view of redundancy. One can expectthat causal inference, Bayesian networks (i.e. conditional independence models) will be ofvalue here.
Training Issues: Manipulating large data bases analyzing high throughput data suc-cessfully requires computational skills which are not typically in the province of statisticians.However these are we view, essential since they are required to: 1) understand the data 2)develop methods which have an impact on the science 3) enable one to make the tradeoffbetween computational and statistical efficiency needed to make serious progress.
As in most fields, sufficient training in the science in order to communicate with under-standing with specialists and generally is of great value.
3.2 Sparsity: Compressed Sensing Using High-Dimensional Thinking
The Shannon sampling theorem is a fundamental tool underlying our modern media-richera. This theorem prescribes a hard constraint that designers of scientific and engineer-ing systems use daily in designing sensors and data acquisition protocols. For example,
10
Magnetic Resonance Imaging scanners, now frequently used in medical practice, take inmany cases an hour or so to collect enough data to render an image of the inside of thehuman body. Ultimately the scan takes so long because straightforward calculations usingShannon’s theorem suggest that millions of measurements must be made in order to obtaina reconstructed image.
Recently, it has become clear in a number of scientific fields that the Shannon limit,although honored almost universally as a fundamental constraint on data acquisition, canactually be circumvented in some fairly important settings. Thus, one can, in the rightsetting, ‘undersample’ – violate the Shannon limit substantially – and still obtain high-quality reconstructions by the right method. As a simple example, at the Society forMagnetic Resonance in Medicine meeting in Berlin, May 2006, results were presented byseveral teams showing that certain categories of MR imaging tasks could be sped up byfactors of 7 over what had previously been considered necessary. This means 7 times asmany patients can be served by a facility in the same measurement time.
Such improvements over traditional sampling rates are achieved by a technique oftencalled “Compressed Sensing” [3, 2]. The technique ultimately depends on some fascinatingcounter-intuitive properties of high-dimensional geometry that are now being systemati-cally explored by statisticians, probabilists, information theorists, and applied mathemati-cians; ultimately, the source of our understanding can be traced back to investigations bymathematicians in seemingly very remote issues: how many low-dimensional faces does arandom polytope have? and how ‘thick’ is a random low-co-dimensional cross section ofa high-dimensional simplex? It is also tied in unexpected ways to work by mathematicialstatisticians to understand methods which can resist the influence of outliers.
The potential feasibility of Compressed Sensing can be motivated through a couple ofobservations:
(1) all images and other media are compressible: they don’t need nearly as many bits torepresent them as one might expect based on the raw image format. A 1000-by-1000image indeed has 1 mega-pixels, but as every user of digital cameras, web browsers,cell phones and other modern tools knows, the actual number of bits needed to acheivea reasonably high quality reconstruction of an 8-bit deep image is in the tens or fewhundreds of thousands, not 8 million.
(2) since the number of bits is substantially less than the nominal number of bits, weought to be able to take a number of samples amounting to roughly the number ofunderlying bits appearing in the compressed representation, not the number of bitsthat appear in the uncompressed representation.
In short, since media (such as MRI images) are compressible, the sensing process itselfought to be compressible. Possibly, many scientists and engineers have formulated theseobservations previously, but it is only very recently that a coherent intellectual foundationhas emerged.
One foundational explanation goes as follows: Suppose that we have an object x0 ofinterest, with N coefficients, which we suppose has a sparse representation in a specific basisfor RN—for many media types, this basis could be a suitable wavelet basis. By sparse, wemean that there are relatively few nonzero coefficients. While the typical vector is dense,with all coefficients nonzero – the typical humanly-intelligible media is sparse, with fewcoefficients nonzero. Sparsity will be the key ingredient allowing us to undersample.
We take measurements y = Ax0, where A is an n by N matrix. Undersampling is
11
expressed by the fact that n � N . Our task is to reconstruct x0 from y; this seemshopeless, as there are fewer equations than unknowns.
However, we have extra information: the object x is sparse, i.e. has at most k signifi-cantly nonzero elements, for k � n. To exploit this knowledge, we reconstruct x0 by solvinga convex optimization problem: minimize ‖x‖1 subject to y = Ax. In words, we seek theminimal `1 norm object matching the measurements y. This is a very different goal thanthat used traditionally, where we ask for the object with minimal `2 norm.
In this setting, we have the following mathematical result: if the measurements A arerandom – for example with i.i.d. Gaussian entries, and if x0 is truly sparse – with k strictnonzeros – then we have exact reconstruction provided the number of measurements exceedsa threshold: n > 2 log(N/k)k.
This is a sampling theorem like Shannon’s original theorem; however, it requires that thenumber of samples n be comparable to the number of nonzeros k, rather than the apparentvector dimension N . In short, although undersampling leads to underdetermined systemsof equations, when the equations are random, and the solution is sparse, the solution isavailable by convex optimization.
This is a sampling of the kinds of results which are now available to explain the un-derlying phenomenon. This particular result follows from properties of high dimensionalpolytopes subjected to random orthogonal projection onto lower-dimensional space. Otherapproaches to formulating foundations can be based on properties of minors of randommatrices, or on sections of hypercubes.
3.3 Computer and Simulation-Based Models
Computer models are computer codes, often large and deterministic, that simulate complexprocesses. They can encapsulate a field of knowledge, synthesizing the understanding ofmany individuals and often seek to answer questions that can not be answered directly withobservational data or direct experiments. They are also used to make complex predictionsthat incorporate a substantial body of scientific understanding. Examples range from asimulation for traffic flow in an urban area (e.g. TRANSIMS) to climate models used tomake global projections of future climate change (Fourth Assessment Report, Intergovern-mental Panel on Climate Change) to a mechnical deformation model used to test vehicledesigns in a crash. Despite the diverse use of computer models in many fields they sharecommon problems in drawing inferences from high dimensional output, combining modelswith observations and quantifying the model’s uncertainty. Statistics provides a frameworkto solve these problems and hence contribute to the scientific value of these models. Giventhe now ubiquitous use of computer models throughout science and engineering they meritmore attention by the statistical community. We will illustrate with some questions arisingin the geosciences.
By representing the interaction among several processes, computer models often yieldoutput that has complex structure and are often difficult to analyze without some form ofdimension redution. Data reduction using linear projections derived from sample covariancematrices (known as emipirical orthogonal functions in the geosciences) can miss nonlinearbehavior and can be hard to interpret beyond a small number of projections. Statistics cansupport these efforts by exploiting sparsity of output fields with respect to particular bases.In general, finding efficient, regularized bases that are suited to particular physical processessimulated by computer models is important. Moreover, in the geosciences simulated fieldsof physical variables have many more spatial locations than temporal or model model
12
replications and so fit into a “large p small n” context.Data assimilation refers to combining a numerical model with observations to produce
a better estimate of the state of the system. This process is fundamentally a statistical oneand, for example, provides the basis for weather forecasting. Some of the most challengingproblems in prediction involve the assimilation of massive data streams into computer mod-els with large state vectors. The high dimensionality of both model and data demand thatany approach that is computationally feasible must also be approximate. It is uncertainhow many of the approximations currently used in data assimilation affect the accuracy ofthe resulting analysis. In particular several data assimilation approaches can be cast as ap-proximate Bayesian solutions where the posterior is represented through a sample (termedan ensemble in weather prediction). This identification makes connections to general prob-lems of Bayesian inference using Monte Carlo algorithms for computation. An importantemerging area in assimliation is estimating parameters in a computer model based on data,also known as model tuning. This activity has the potential to move model developmentfrom often subjective and heuristic tuning of parameters to an activity where parametersare estimated from observations using explicit criteria. The parametric components of com-puter models especially for geophysical problems often address behavior for processes atmultiple scales. Thus applications of multiresolution statistical ideas can have an impactin suggesting alternative ways to simulate these processes within a computer model.
Physical models which, at the scales of interest, are not so well understood figure in manygeophysical applications. The difficulty that this poor understanding poses is exacerbatedby the amount and complexity of the data. This brings to the fore a number of points notlimited to these sciences:
1. The models have been developed by geophysicists and applied mathematicians whounderstand them to be crude approximations The data exhibit substantial systematic bi-ases from the postulated models. To contribute to these fields theoretically or practicallystatisticians must work closely with physicists and applied mathematicians.
2. Sparsity plays a key role not only in terms of data representation as discussed in thesection on sparsity but also in dimension reduction and model selection.
3. Bayesian approaches assist in incorporating scientific knowledge into data analysis.Nonparametric approaches such as `1 optimization discussed in the sparsity section aresimilarly important for checking and correcting the sometimes shaky foundations describedabove.
As computer modeling assumes a mature and central role in many scientific disciplinesthere will be a tendency to consider families or classes of models, rather than just a singleinstantiation. From this perspective, one has a space of complex objects, i.e. computermodels, that are functions of particular inputs, parameters or different model components.A practical question is: Given several versions of a computer model how well does thislimited set of choices represent the possible behavior across the space of possible models?Answering this kind of question reinforces the theme of statistical science’s ability to addresscomplex data structures and interpolate/extrapolate a discrete set of information to acontinuous set.
3.4 Statistics in Particle & Astrophysics
Experiments at the frontiers of modern physics and astronomy involve measurements ofextremely weak signals and the search for extremely rare events. The fact that these exper-iments produce vast amounts of data, while enhancing the chances of successful detection,
13
presents a new range of problems of data management and computation.
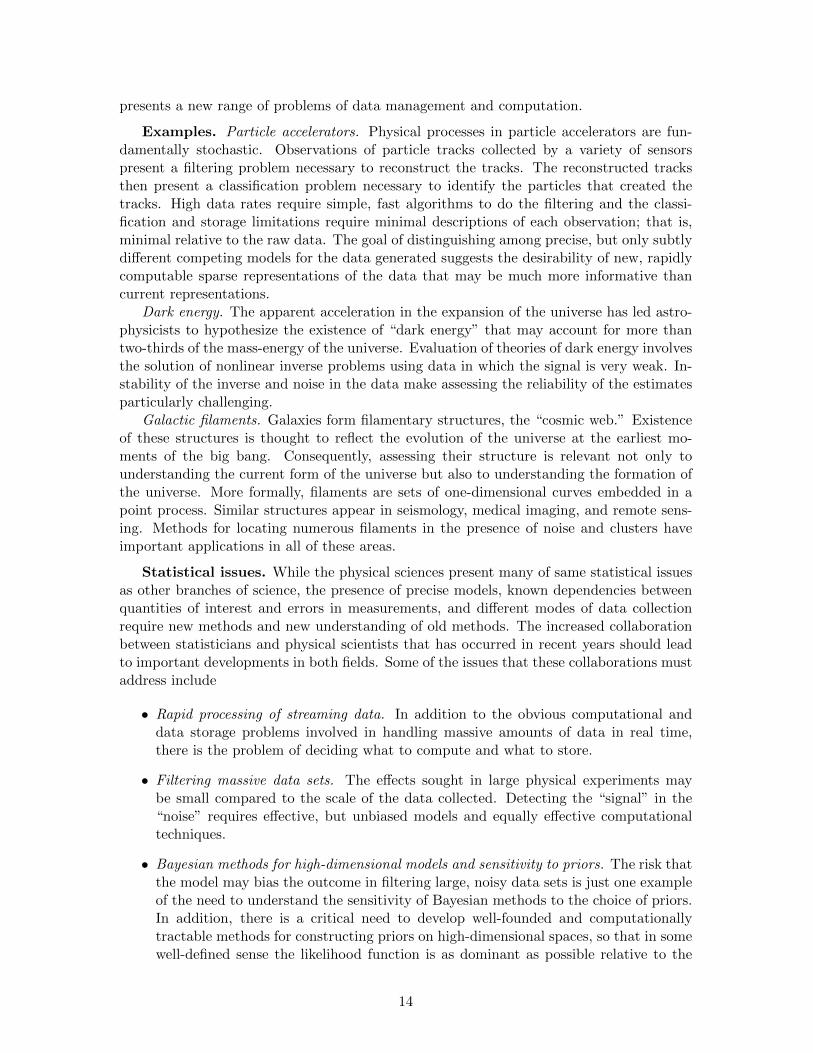
Examples. Particle accelerators. Physical processes in particle accelerators are fun-damentally stochastic. Observations of particle tracks collected by a variety of sensorspresent a filtering problem necessary to reconstruct the tracks. The reconstructed tracksthen present a classification problem necessary to identify the particles that created thetracks. High data rates require simple, fast algorithms to do the filtering and the classi-fication and storage limitations require minimal descriptions of each observation; that is,minimal relative to the raw data. The goal of distinguishing among precise, but only subtlydifferent competing models for the data generated suggests the desirability of new, rapidlycomputable sparse representations of the data that may be much more informative thancurrent representations.
Dark energy. The apparent acceleration in the expansion of the universe has led astro-physicists to hypothesize the existence of “dark energy” that may account for more thantwo-thirds of the mass-energy of the universe. Evaluation of theories of dark energy involvesthe solution of nonlinear inverse problems using data in which the signal is very weak. In-stability of the inverse and noise in the data make assessing the reliability of the estimatesparticularly challenging.
Galactic filaments. Galaxies form filamentary structures, the “cosmic web.” Existenceof these structures is thought to reflect the evolution of the universe at the earliest mo-ments of the big bang. Consequently, assessing their structure is relevant not only tounderstanding the current form of the universe but also to understanding the formation ofthe universe. More formally, filaments are sets of one-dimensional curves embedded in apoint process. Similar structures appear in seismology, medical imaging, and remote sens-ing. Methods for locating numerous filaments in the presence of noise and clusters haveimportant applications in all of these areas.
Statistical issues. While the physical sciences present many of same statistical issuesas other branches of science, the presence of precise models, known dependencies betweenquantities of interest and errors in measurements, and different modes of data collectionrequire new methods and new understanding of old methods. The increased collaborationbetween statisticians and physical scientists that has occurred in recent years should leadto important developments in both fields. Some of the issues that these collaborations mustaddress include
• Rapid processing of streaming data. In addition to the obvious computational anddata storage problems involved in handling massive amounts of data in real time,there is the problem of deciding what to compute and what to store.
• Filtering massive data sets. The effects sought in large physical experiments maybe small compared to the scale of the data collected. Detecting the “signal” in the“noise” requires effective, but unbiased models and equally effective computationaltechniques.
• Bayesian methods for high-dimensional models and sensitivity to priors. The risk thatthe model may bias the outcome in filtering large, noisy data sets is just one exampleof the need to understand the sensitivity of Bayesian methods to the choice of priors.In addition, there is a critical need to develop well-founded and computationallytractable methods for constructing priors on high-dimensional spaces, so that in somewell-defined sense the likelihood function is as dominant as possible relative to the
14
prior. Important work along those lines has been done, but the extension to modelswith many parameters remains challenging.
• Confidence bands for nonparametric estimates. Meaningful methods for exhibitingthe variability of estimates of curves, surfaces, or even higher dimensional objectsare needed for describing structure in multidimensional data and for the solution ofinverse problems.
• Cluster identification. Improved methods for the detection of sparse signals (clusters)in the presence of inhomogeneous Poisson contamination are needed. Problems in-clude evaluation of the sensitivity of the methods and estimation of the backgroundand signal intensities.
• Modeling resource allocation among expensive experiments. Beyond the political issueof which scientific questions to address, there is the need to allocate resources toparticular experiments. Determining the set of experiments that is most likely to givesatisfactory answers requires both accurate physical modeling of the experiments andstatistical design under resource constraints.
None of these issues is unique to physical data. As technology emerges in any fieldthat allows the collection of large amounts of data, the opportunity to address increasinglycomplex and subtle questions arises.
3.5 Economics, Finance and Risk Management
Statistical inferences about extreme events, credit risks and macroeconomic policy modelingand simulations can have profound impact on the well being of society and at the same timepose significant intellectual challenges for academic research. The recent subprime crisisonce more demonstrates that innovative statistical tools are urgently needed to contributeto controlling and managing market risks and that quantitative measures are needed forlegal regulatory purposes.
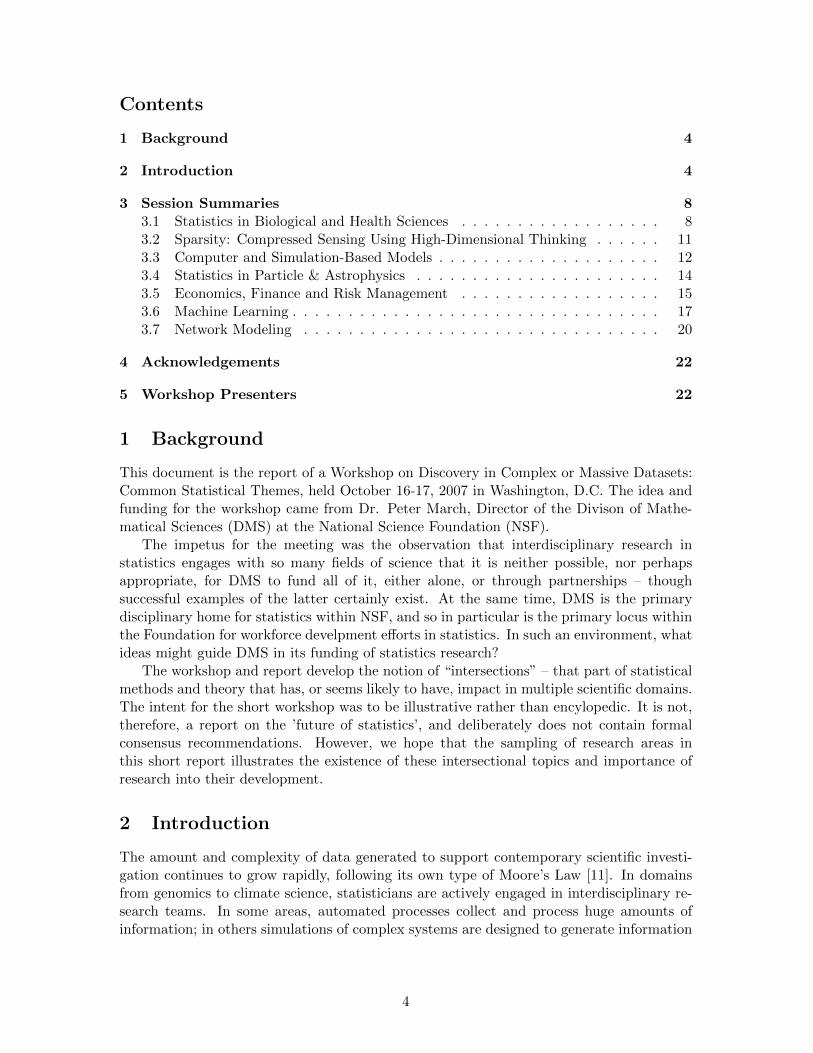
Complex systems in finance and economics are inherently high-dimensional. In manag-ing and controlling economic and financial risks, modeling and estimation of extreme eventsin several hundred dimensions are required. In monetary policy making, large statisticalmodels of the US economy are needed. In managing financial risks, correlation matrices ofthe order of hundreds and thousands are prominently featured in assessing portfolio risksand portfolio allocations. Understanding systemic risk in the financial industry will haveto be based on stochastic network models. These high-dimensional and complex problemsshare common statistical themes with other biological, physical and social sciences. Forexample, the collection of housing price indices for all counties or zip codes in the US formhigh-dimensional time series data, which have some spatial-temporal features and statisticalchallenges in common with climatological studies.
Extreme events not only occur in size, but also at the level of dependence. Understand-ing portfolio properties under extreme correlations is crucial in financial risk management,particularly when the analysis of rare extreme events is confronted. Insight into the causeof jumps and spillover effects of markets is important in building a sound financial sys-tem. The recent arrival of high-frequency data for a host of financial instruments makesunderstanding of extreme events more feasible and at the same time poses new statisticalchallenges of computation, modeling, and inference. In the legal regulatory framework for
15
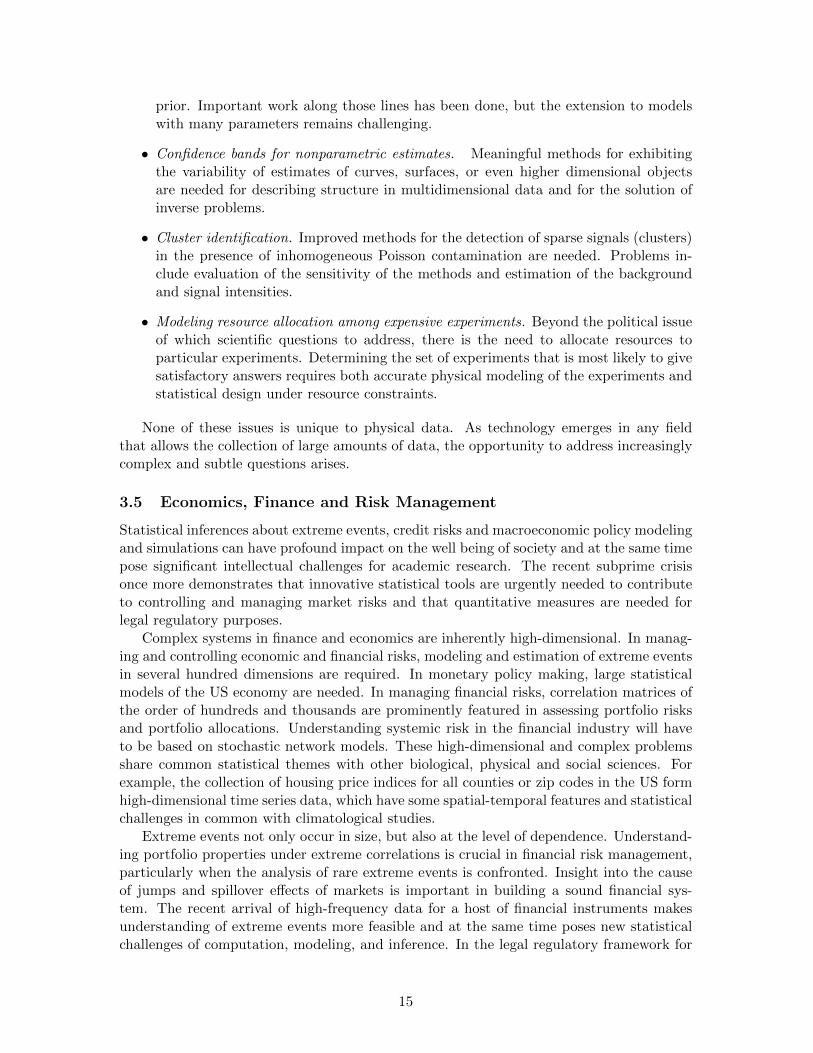
Figure 2: (a) The correlation of HPI among the 100 largest markets in the US. (b) Thecorrelation of HPI among the 100 largest markets in the US after adjusting for (conditioning)the national HPI (Courtesy of Magnetar Capital).
the supervision of banking and insurance, estimates of the high quantiles of loss distribu-tions are required. Such estimates are also needed for the reinsurance industry. Immediateapplications exist in the field of alternative risk transfer between the insurance of naturalcauses and the financial markets (catastrophe bonds, mortality and longevity bonds).
In risk analysis, one needs to understand the impact of dimensionality on covariance ma-trix estimation, risk assessment, and portfolio allocation. One needs to select and identifyimportant risk factors, a common theme in statistical model selection that has applica-tions to many scientific disciplines. Modeling high-dimensional covariance matrices hasbroad significance for finance, longitudinal studies in economics and health sciences, andfor biological, genomic and social networks. Different subject domains require differentstatistical modeling and understanding, but nevertheless share some common intellectualcontent. For example, credit risk analysis (time to default modeling) shares common sta-tistical themes with health risk analysis (survival time analysis) and reliability (lifetime ofproducts), but has also its distinguishing characteristics deriving from financial and eco-nomic theory. Disease classifications using microarrays and proteomic data share commonstatistical challenges with robust portfolio selection and risk management. In the formercase, scientists wish to select tens of genes for disease classifications and to understandthe underlying molecular mechanism, while in the latter, investors wish to select tens orhundred of stocks that achieve return-risk efficiency. In a similar vein, stochastic mod-eling for understanding the dynamics of market price co-movements also intersects withmathematical modeling of biological systems.
Macroeconomic policy making relies on the theory of inference for simultaneous equa-tions models of high-dimensionality. Model uncertainty and estimation errors for parame-ters can have a large impact on decision making. Statistical model building and asymptoticinference play pivotal roles. Recently, economists at central banks have employed BayesianMCMC methods that make possible inference with the more complex models that emergefrom the rational expectations framework, and at a scale that is useful for the policy pro-cess. They produce measures of uncertainty that can in principle be fed, with due caution,into policy discussion that invokes judgemental beliefs of policy makers. A model estimatedby these methods is now the central policy model at the Swedish Riksbank, and severalother central banks have such models under development.
These are just a few examples of a methodology that combines ideas that have emergedfrom statistics and crossed over into very different fields, illustrating the role of the statistics
16
discipline in stimulating intellectual cross-fertilization.
3.6 Machine Learning
In the past few decades, the presence of increasingly large data sets in many fields ofscience and engineering, coupled with the widespread availability of powerful computers,has prompted a great deal of computationally-intensive statistical research, much of itcarried out under the moniker of “machine learning.” Machine learning is a set of activitiesthat fall squarely within the general purview of statistical science, enriching statistics byenhancing the links to other areas of information science—including optimization theory,algorithms, signal processing, databases and information theory—and by strengthening theties to applied users of statistical inference in areas such as genomics, information retrieval,speech recognition, remote detection and logistics.
Large data sets, characterized by many variables (large p) and/or many samples (largen), are now a common feature in many areas of science and engineering. They often arisefrom the use of high-throughput technologies, such as mass spectometry and gene expressionarrays, and large-scale scientific studies, such as digital sky surveys and climate modeling.
Large, high-dimensional data sets present a number of statistical and computationalchallenges that are not present in more traditional studies involving small samples and rel-atively few variables. Machine learning, and the statistics field in general, has responded tothese challenges in a timely fashion, through the development of core theory and methodol-ogy. Just as importantly, this statistical core has served as a hub through which key ideasin one discipline are developed, refined and transported to other disciplines.
Supervised and unsupervised learning. Machine learning has classically empha-sized “supervised learning” problems (i.e., classification and regression problems), in whichcategorical labels or real-valued responses are attached to data points and the goal is topredict the response of a future data points. More recently many researchers have focusedtheir attention on “unsupervised learning,” a more diffusely-defined set of topics that in-cludes clustering, pattern mining, dimension reduction and manifold learning. In theseproblems, only unlabeled data points are available, and the goal is to identify significantregularities among the data points, or between data points and variables. Both supervisedand unsupervised learning are now highly developed areas of methodological and theoreticalresearch and the ties to classical statistical theory are increasingly clear. Recent work hasfocused on so-called semi-supervised learning, in which information in labeled data pointsis combined with that from more readily accessible unlabeled data for the purposes of classprediction.
Much of the particular flavor of machine learning methodology has to do with its strongties to optimization theory and numerical linear algebra. In particular, machine learningmethods are often characterized by the use of surrogate or approximate loss functionsto “convexify” or “relax” risk minimization problems. Examples include support vectormachines, boosting, L1 based methods for variable selection, and variational inference forgraphical models.
Machine learning methodology often emphasizes simple, flexible statistical models thatcan be remarkably effective in the context of very large data sets; examples include boosting,bagging, random forests and hierarchical Bayesian models. More complex dependencestructures can often be captured with graphical models, a formalism that merges graphtheory and probability theory, and allows complex models to be built by combining simplemodules.
17
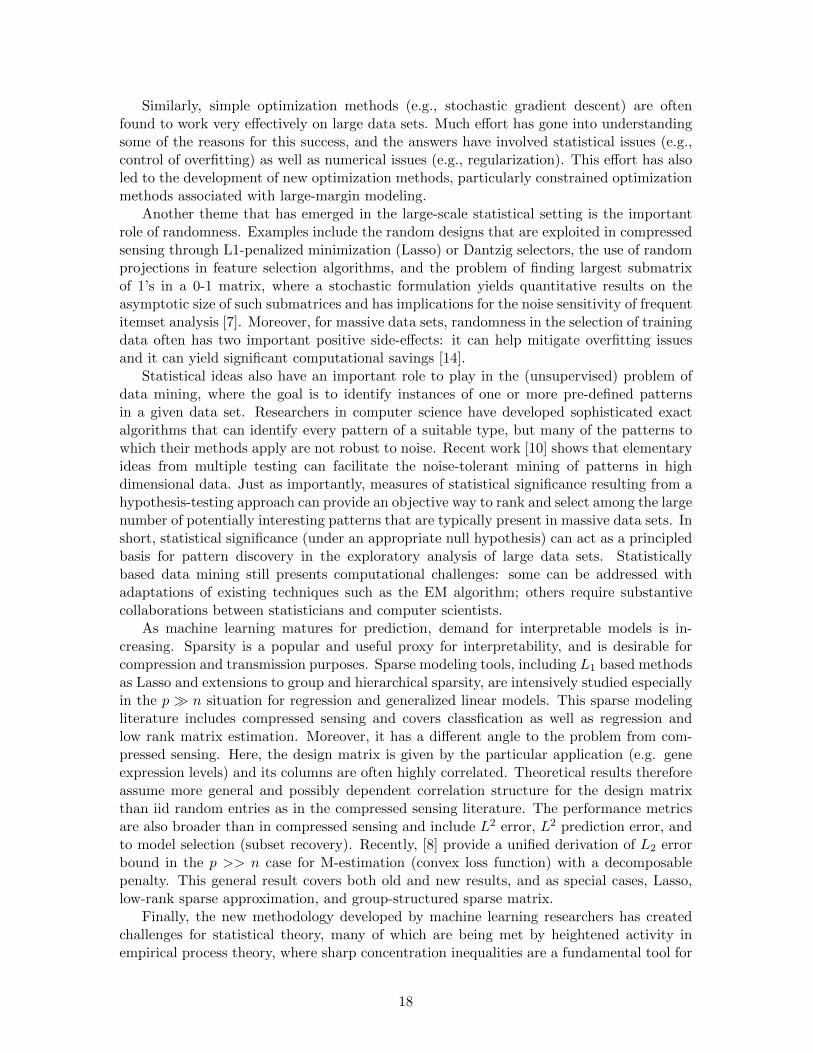
Similarly, simple optimization methods (e.g., stochastic gradient descent) are oftenfound to work very effectively on large data sets. Much effort has gone into understandingsome of the reasons for this success, and the answers have involved statistical issues (e.g.,control of overfitting) as well as numerical issues (e.g., regularization). This effort has alsoled to the development of new optimization methods, particularly constrained optimizationmethods associated with large-margin modeling.
Another theme that has emerged in the large-scale statistical setting is the importantrole of randomness. Examples include the random designs that are exploited in compressedsensing through L1-penalized minimization (Lasso) or Dantzig selectors, the use of randomprojections in feature selection algorithms, and the problem of finding largest submatrixof 1’s in a 0-1 matrix, where a stochastic formulation yields quantitative results on theasymptotic size of such submatrices and has implications for the noise sensitivity of frequentitemset analysis [7]. Moreover, for massive data sets, randomness in the selection of trainingdata often has two important positive side-effects: it can help mitigate overfitting issuesand it can yield significant computational savings [14].
Statistical ideas also have an important role to play in the (unsupervised) problem ofdata mining, where the goal is to identify instances of one or more pre-defined patternsin a given data set. Researchers in computer science have developed sophisticated exactalgorithms that can identify every pattern of a suitable type, but many of the patterns towhich their methods apply are not robust to noise. Recent work [10] shows that elementaryideas from multiple testing can facilitate the noise-tolerant mining of patterns in highdimensional data. Just as importantly, measures of statistical significance resulting from ahypothesis-testing approach can provide an objective way to rank and select among the largenumber of potentially interesting patterns that are typically present in massive data sets. Inshort, statistical significance (under an appropriate null hypothesis) can act as a principledbasis for pattern discovery in the exploratory analysis of large data sets. Statisticallybased data mining still presents computational challenges: some can be addressed withadaptations of existing techniques such as the EM algorithm; others require substantivecollaborations between statisticians and computer scientists.
As machine learning matures for prediction, demand for interpretable models is in-creasing. Sparsity is a popular and useful proxy for interpretability, and is desirable forcompression and transmission purposes. Sparse modeling tools, including L1 based methodsas Lasso and extensions to group and hierarchical sparsity, are intensively studied especiallyin the p � n situation for regression and generalized linear models. This sparse modelingliterature includes compressed sensing and covers classfication as well as regression andlow rank matrix estimation. Moreover, it has a different angle to the problem from com-pressed sensing. Here, the design matrix is given by the particular application (e.g. geneexpression levels) and its columns are often highly correlated. Theoretical results thereforeassume more general and possibly dependent correlation structure for the design matrixthan iid random entries as in the compressed sensing literature. The performance metricsare also broader than in compressed sensing and include L2 error, L2 prediction error, andto model selection (subset recovery). Recently, [8] provide a unified derivation of L2 errorbound in the p >> n case for M-estimation (convex loss function) with a decomposablepenalty. This general result covers both old and new results, and as special cases, Lasso,low-rank sparse approximation, and group-structured sparse matrix.
Finally, the new methodology developed by machine learning researchers has createdchallenges for statistical theory, many of which are being met by heightened activity inempirical process theory, where sharp concentration inequalities are a fundamental tool for
18
the analysis of nonparametric procedures, as well as in random matrix theory and convexgeometry.
Bayesian nonparametric methods. Much of the focus in machine learning researchhas been on methods that allow the complexity of the underlying model to grow withthe growth in the sample size; in statistical language these are nonparametric methods.Both the methods (e.g., the support vector machine and boosting) and their analysis havegenerally been developed within a frequentist framework in which one analyzes performanceof a method based on repeated draws of the training data. There is also, however, a segmentof the machine learning community interested in Bayesian methods, and most recentlythese researchers have begun to focus on Bayesian nonparametric methods. An existingliterature in statistics dating back to the 1960’s has provided an essential foundation forthis effort; in particular, this literature provides a general framework for working with priordistributions that are general stochastic processes, and provides connections to other areasof mathematics (such as probability theory, functional analysis, and combinatorics) thatare key to the manipulation of these stochastic processes.
Clustering is an important data analysis problem that has seen contributions from manyapplied communities (including machine learning). In Bayesian nonparametric statisticsclustering problems can be attacked via the use of a prior known as the Dirichlet process(DP); the DP provides an appealing solution because it does not require the number ofclusters to be known a priori. But the statistical framework provides something more; inBayesian statistics it is natural to consider hierarchical models, in which multiple modelsare coupled probabilistically. Thus it is natural to define a hierarchical Dirichlet process(HDP) and thereby solve multiple related clustering problems [12]. Interestingly, while theneed to solve the multiple clustering problem has been perceived within various appliedcommunities, the problem was not faced head on until it was posed in a general statisticalsetting. Subsequently, the HDP solution has had significant impact on applied communi-ties. Indeed, HDP-based models have yielded state-of-the-art solutions to problems suchas object recognition in computational vision, natural language parsing, protein backbonemodeling, haplotype inference in multiple subpopulations and image denoising.
Bayesian nonparametrics also provides methods for capturing and exploiting sparsity.In particular, the beta process is a stochastic process that yields a countably-infinite numberof coins, which when tossed repeatedly yield a sparse binary matrix of exchangeable randomvariables [13]. Each row of this matrix can be viewed as a sparse featural representation ofsome object. Moreover, hierarchical beta processes can be defined to share sparsity patternsamong collections of objects. There is currently significant activity in using the beta processfor compression and sparse regression, and connections to the frequentist literature arebeginning to be developed.
Challenges. The multiple clustering problem is a special case of the data integrationor data fusion problem. Such problems arise frequently in the analysis of large data sets,in part because of the need to decompose large data sets into manageable pieces andin part because complex phenomena often provide many different views. For example,in understanding biological phenomena there is a pressing need to integrate across thegreat variety of genomic, genetic, proteomic and metabolomic data sets that are available.Climatology is another area in which data integration is paramount, and where issues ofspatial and temporal scale make integration particularly challenging. Other challengingissues are also facing us:
• Could we as a community formalize canonical data processing operations that might
19
influence database design?
• What kind of a role can traditional exploratory data analysis play in the extractionof information from massive data sets?
• How should we go about trying to systematically visualize the outputs of modernstatistical methods?
• How do we decide on the importance of variables?
• Streaming data requires considerations of compression and transmission in additionto computation. Can we develop a useful theory to encompass statistical estimation,computation, and data storage and transmission?
3.7 Network Modeling
What distinguishes network data from other examples of large scale data problems is theinherent dependencies among units. Indeed it is these dependencies or link that are aprimary focus of analysis. Networks are usually characterized in terms of a set of n nodes,a set of N links among the nodes, and a set of r relations that characterize the links.
Examples and Models Galore. Examples of network datasets and problems in-volving relational data arise in diverse setting and areas. There are the early datasetsfrom Stanley Milgram’s 1960s small world experiments. Examples of other forms of net-work data include: (1) Social networks: Sampson’s noviates in a monastery, Classroomfriendship, My Space, Facebook, (2) Organization theory, (3) Homeland security, (4) Poli-tics: Congressional voting behavior, bill co-sponsorship, (5) Public health: Needle sharing,Spread of AIDS, (6) Computer science: Email networks (Enron), Internet links, WWWrouting systems, (7) Biology: Protein-protein interactions.
Often networks are embedded in policy problems such as those involving public healthstrategies, the design of economic markets, and alternative structures such as airline “huband spoke” systems.
Researchers approach these with different analytical tools in different substantive areas:Erdos-Renyi random graph models and their generalizations, social network models such asp1 and exponential random graph models, statistical physics approaches, and most recentlylatent variable models. Much of the substantive work in network modeling suffers fromforms of “casual empiricism.” Thus, there is an array of interesting network modelingproblems to which statisticians can contribute. Most notable is the need to integrate acrossthe different approaches to develop a common and reasonably flexible class of models thatcould then be adapted to the specifics of specific applications and problems of interest.
Two classes of problems have received limited statistical attention: (1) the design andanalysis of studies involving dynamic networks in which nodes and links evolve over time.(2) integration of models based on attributes of nodes and models focused on the attributesof links. In addition, networks often contain external information about the nodes–jointlymodeling node information with pairwise relationships is an important statistical issue. Forrecent descriptions of different classes of statistical models for networks see [5] and [4].
Some Overarching Statistical Issues. There are a number of major statisticalmodeling and inferential challenges in the analysis of network data that transcend individualmodels and classes of estimation methods. We mention six of these:
20
MMSB hierarchical model
α
.
.
.
y11
21
31
n1
y
y
y
.
.
.
y12
22
32
n2
y
y
y
.
.
.
y13
23
33
n3
y
y
y
.
.
.
y1n
2n
3n
nn
y
y
y
. . .
. . .
. . .
. . .
..
.
B
.
.
.
π1
2π
3π
nπ
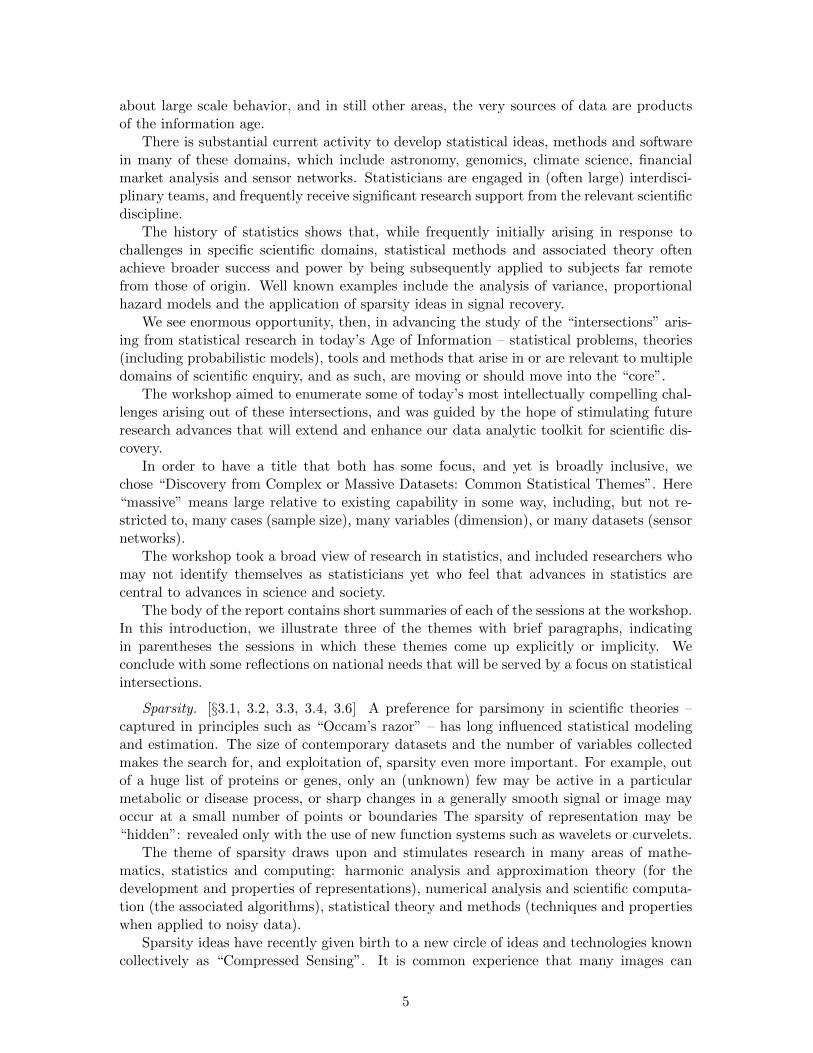
D. Blei Challenges in Statistical Network Analysis 13 / 26
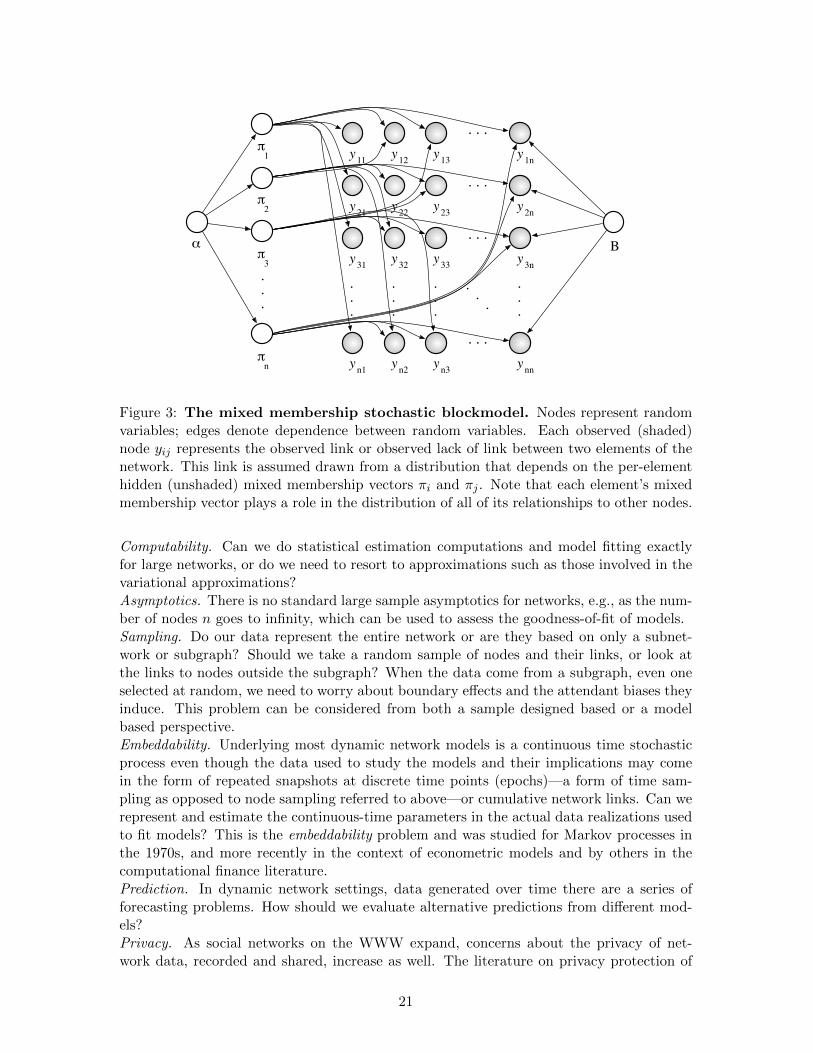
Figure 3: The mixed membership stochastic blockmodel. Nodes represent randomvariables; edges denote dependence between random variables. Each observed (shaded)node yij represents the observed link or observed lack of link between two elements of thenetwork. This link is assumed drawn from a distribution that depends on the per-elementhidden (unshaded) mixed membership vectors πi and πj . Note that each element’s mixedmembership vector plays a role in the distribution of all of its relationships to other nodes.
Computability. Can we do statistical estimation computations and model fitting exactlyfor large networks, or do we need to resort to approximations such as those involved in thevariational approximations?Asymptotics. There is no standard large sample asymptotics for networks, e.g., as the num-ber of nodes n goes to infinity, which can be used to assess the goodness-of-fit of models.Sampling. Do our data represent the entire network or are they based on only a subnet-work or subgraph? Should we take a random sample of nodes and their links, or look atthe links to nodes outside the subgraph? When the data come from a subgraph, even oneselected at random, we need to worry about boundary effects and the attendant biases theyinduce. This problem can be considered from both a sample designed based or a modelbased perspective.Embeddability. Underlying most dynamic network models is a continuous time stochasticprocess even though the data used to study the models and their implications may comein the form of repeated snapshots at discrete time points (epochs)—a form of time sam-pling as opposed to node sampling referred to above—or cumulative network links. Can werepresent and estimate the continuous-time parameters in the actual data realizations usedto fit models? This is the embeddability problem and was studied for Markov processes inthe 1970s, and more recently in the context of econometric models and by others in thecomputational finance literature.Prediction. In dynamic network settings, data generated over time there are a series offorecasting problems. How should we evaluate alternative predictions from different mod-els?Privacy. As social networks on the WWW expand, concerns about the privacy of net-work data, recorded and shared, increase as well. The literature on privacy protection of
21
traditional statistical databases has burgeoned over the past decade, but a fundamentalassumption regarding most disclosure limitation methodologies is the independence of datafor different individuals or units of analysis. The depends among units that are the focusof network analysis make the privacy protection of network data a major challenge.
What statisticians can bring to the table here is not only the full set of statistical toolsand methods used in other settings, but also the ability to abstract key elements fromdifferent modeling traditions to create a general theory which can in turn be carried backto the applications and to new statistical problems.
4 Acknowledgements
We are grateful for financial and planning support from NSF/DMS through Peter March,Deborah Lockhart, Grace Yang, Gabor Szekely, and Yazhen Wang. Organizational supportwas provided by Jianqing Fan and Alexis Kelley at Princeton.
The report was prepared through the efforts of many of the participants (listed below):session summaries were drafted and edited by the session chairs and/or the speakers. Theoverall document was shepherded by Peter Bickel, Iain Johnstone and Bin Yu.
5 Workshop Presenters
The workshop was held October 16-17, 2007 at the Mathematical Association of America(MAA) Conference Center in Washington D.C. Session organizers and presenters are listedbelow. In addition, there were opening remarks by Peter March, Director, NSF-DMS,Deborah Lockhart, Executive Officer NSF-DMS, and Iain Johnstone, Stanford U. Therewas a panel discussion on infrastructure needs led by Mary Ellen Bock, Purdue, Alan Karr(NISS), and Bruce Lindsay (Penn State).
1. Statistics in Biological Sciences [Peter Bickel, UC Berkeley]
• Wing Wong, Stanford University
• Xihong Lin, Harvard University
• Samuel Kou, Harvard University
2. Sparsity [Iain Johnstone, Stanford University]
• David Donoho, Stanford University
3. Computer Models [Jim Berger, Duke University and SAMSI]
• Douglas Nychka, NCAR
• Chris Jones, UNC-Chapel Hill
4. Statistics in Particle & Astrophysics [Tom Kurtz, Wisconsin]
• Harrison Prospper, Florida State
• Larry Wasserman, Carnegie Mellon
5. Economics/Finance/Risk Management [Jianqing Fan, Princeton]
• Chris Sims, Princeton
22
• Paul Embrechts, ETH Zurich
6. Machine Learning [Bin Yu, UC Berkeley]
• Andrew Nobel, UNC-Chapel Hill
• Mike Jordan, UC Berkeley
7. Network Modeling [Steve Fienberg, Carnegie Mellon]
• Mark Handcock, U. Washington
• David Blei, Princeton
References
[1] Bickel, P. J., Brown, J. B., Huang, H. and Li, Q. [2009], ‘An overview of recent developments ingenomics and associated statistical methods’, Philosophical Transactions of the Royal SocietyA: Mathematical, Physical and Engineering Sciences 367(1906), 4313–4337.
[2] Candes, E. J. [2006], Compressive sampling, in ‘International Congress of Mathematicians.Vol. III’, Eur. Math. Soc., Zurich, pp. 1433–1452.
[3] Donoho, D. L. [2006], ‘Compressed sensing’, IEEE Trans. Inform. Theory 52(4), 1289–1306.URL: http://dx.doi.org/10.1109/TIT.2006.871582
[4] Goldenberg, A., Zheng, A., Fienberg, S. and Airoldi, E. [2010], ‘A survey of statistical networkmodels’, Foundations and Trends in Machine Learning 2(2), 129–233.
[5] Kolaczyk, E. D. [2010], Statistical Analysis of Network Data, Springer, New York.
[6] Kou, S. C., Cherayil, B. J., Min, W., English, B. P. and Xie, X. S. [2005], ‘Single-moleculemichaelismenten equations’, The Journal of Physical Chemistry B 109(41), 19068–19081.PMID: 16853459.
[7] Liu, J., Paulsen, S., Sun, X., Wang, W., Nobel, A. B. and Prins, J. [2006], Mining approximatefrequent itemsets in the presence of noise: Algorithms and analysis., in ‘Proceedings of the2006 SIAM Conference on Data Mining (SDM)’, Bethesda, MD.
[8] Negahban, S., Ravikumar, P., Wainwright, M. and Yu, B. [2009], A unified framework forhigh-dimensional analysis of m-estimators with decomposable regularizers, in ‘Proc. NIPS’.
[9] on Mathematical Sciences Research for DOEs Computational Biology, N. C. [2005], Mathemat-ics and 21st Century Biology, National Academies Press. M. Olson, chair.
[10] Shabalin, A. A., Weigman, V. J., Perou, C. M. and Nobel, A. B. [2009], ‘Finding large averagesubmatrices in high dimensional data’, The Annals of Applied Statistics 3(3), 985–1012.
[11] Szalay, A. and Gray, J. [2006], ‘Science in an exponential world’, Nature 440, 413–414.
[12] Teh, Y. W., Jordan, M. I., Beal, M. J. and Blei, D. M. [2006], ‘Hierarchical Dirichlet processes’,Journal of the American Statistical Association 101(476), 1566–1581.
[13] Thibaux, R. and Jordan, M. I. [2009], Hierarchical beta processes and the indian buffet pro-cess., in M. Meila and X. S. (Eds.), eds, ‘Proceedings of the Eleventh Conference on ArtificialIntelligence and Statistics (AISTATS)’, Puerto Rico.
[14] Yu, B. [2007], ‘Embracing Statistical Challenges in the Information Technology Age’, Techno-metrics 49(3), 237–248.
23