
Deletion of transcription factor binding motifs using the … · MEL/ch11 cells carrying a human...
31
Deletion of transcription factor binding motifs using the CRISPR/spCas9 system in the β-globin LCR Yea Woon Kim 1 and AeRi Kim 1 1 Department of Molecular Biology, College of Natural Sciences, Pusan National University, Busan 46241, Republic of Korea Keywords: CRISPR/spCas9, binding motifs, transcription factors Correspondence AeRi Kim, Department of Molecular Biology, College of Natural Sciences, Pusan National University, Busan 46241, Republic of Korea Tel: 82-51-510-3683 Fax: 82-51-513-9258 Email: [email protected] ACCEPTED MANUSCRIPT 10.1042/BSR20170976 . Please cite using the DOI 10.1042/BSR20170976 http://dx.doi.org/ up-to-date version is available at encouraged to use the Version of Record that, when published, will replace this version. The most this is an Accepted Manuscript, not the final Version of Record. You are : Bioscience Reports ). http://www.portlandpresspublishing.com/content/open-access-policy#Archiving Policy of Portland Press ( which the article is published. Archiving of non-open access articles is permitted in accordance with the Archiving Use of open access articles is permitted based on the terms of the specific Creative Commons Licence under
Transcript of Deletion of transcription factor binding motifs using the … · MEL/ch11 cells carrying a human...
Deletion of transcription factor binding motifs using the CRISPR/spCas9 system in
the β-globin LCR
Yea Woon Kim1 and AeRi Kim1
1 Department of Molecular Biology, College of Natural Sciences,
Pusan National University, Busan 46241, Republic of Korea
Keywords: CRISPR/spCas9, binding motifs, transcription factors
Correspondence
AeRi Kim, Department of Molecular Biology, College of Natural Sciences,
Pusan National University, Busan 46241, Republic of Korea
Tel: 82-51-510-3683
Fax: 82-51-513-9258
Email: [email protected]
AC
CE
PT
ED
MA
NU
SC
RIP
T
10.1042/BSR20170976. Please cite using the DOI 10.1042/BSR20170976http://dx.doi.org/up-to-date version is available at
encouraged to use the Version of Record that, when published, will replace this version. The most this is an Accepted Manuscript, not the final Version of Record. You are:Bioscience Reports
). http://www.portlandpresspublishing.com/content/open-access-policy#ArchivingPolicy of Portland Press (which the article is published. Archiving of non-open access articles is permitted in accordance with the Archiving Use of open access articles is permitted based on the terms of the specific Creative Commons Licence under
2
ABSTRACT
Transcription factors play roles in gene transcription through direct binding to their motifs in
genome, and inhibiting this binding provides an effective strategy for studying their roles. Here
we applied the CRISPR/spCas9 system to mutate the binding motifs of transcription factors.
Binding motifs for erythroid specific transcription factors were mutated in the locus control
region hypersensitive sites of the human β-globin locus. Guide RNAs targeting binding motifs
were cloned into lentiviral CRISPR vector containing the spCas9 gene, and transduced into
MEL/ch11 cells carrying a human chromosome 11. DNA mutations in clonal cells were initially
screened by quantitative PCR in genomic DNA and then clarified by sequencing. Mutations in
binding motifs reduced occupancy by transcription factors in a chromatin environment.
Characterization of mutations revealed that the CRISPR/spCas9 system mainly induced deletions
in short regions of <20 bp and preferentially deleted nucleotides around the fifth nucleotide
upstream of Protospacer adjacent motifs. These results indicate that the CRISPR/Cas9 system is
suitable for mutating the binding motifs of transcription factors, and, consequently, would
contribute to elucidate the direct roles of transcription factors.
INTRODUCTION
Transcription factors regulate the transcriptions of target genes by binding to motifs present in
regulatory regions of the genome. The roles of transcription factors have been elucidated by
inhibiting their expressions in a cellular environment [1,2] or by mutating their binding motifs in
extrachromosomal loci [3-7]. Such expressional inhibition can demonstrate their direct roles, but
3
cannot exclude indirect effects because transcription factors often affect the expressions of other
transcription factors. Thus, mutation at binding motifs can better reveal the direct roles of
transcription factors. However such mutations have not been commonly tried in a genome
context because of technical difficulties in genome editing. Furthermore, binding motifs for
different transcription factors are closely located in regulatory regions such as enhancers or
promoters.
Recently, an effective genome editing tool was developed from bacterial adaptive immune
system type II, clustered, regularly interspaced, short palindromic repeats (CRISPR) [8,9]. In the
bacterial CRISPR system, CRISPR RNA (crRNA) hybridizes with trans-activating crRNA
(tracrRNA) [10]. The crRNA-tracrRNA duplex directs CRISPR-associated protein 9 (Cas9)
endonuclease into target sequences by base-pairing crRNA with DNA [11]. DNA cleavage by
Cas9 requires a Protospacer adjacent motif (PAM) next to target sequences [8,11,12]. In the
CRISPR/Cas9 system for genome editing, the crRNA-tracrRNA duplex has been simplified to a
single guide RNA (sgRNA) [8,13], which usually contains 20 nucleotides for base paring with
target sequences. sgRNA-directed Cas9 has been shown to generate double strand breaks in
target sequences [8,11]. These breaks are repaired in a non-homologous end joining manner,
resulting in mutations in target sequences [13-15]. The CRISPR/Cas9 system has been used for
knocking out genes by disrupting coding regions in various cell lines and organisms [16-22].
spCas9 derived from Streptococcus pyogenes uses 5′-NGG-3′ sequences as PAMs [8,23]. These
sequences occur every 8 bases in the human genome [13], which suggests almost all genome
sequences can be cleaved by the spCas9. Genome targeting using spCas9 gives rise to the
4
deletion of <10 bp in most cases and the insertion or substitutions of short sequences in low
frequency [16,24]. Here, we applied the CRISPR/spCas9 system to mutate the binding motifs of
transcription factors in a genome context, because these motifs are typically ~10 bp [25]. The
locus control region (LCR) hypersensitive sites (HSs) of the human β-globin locus were used as
model regulatory regions, which contain binding motifs for tissue specific transcription factors
such as GATA-1, TAL1 and KLF1 [26]. To clearly analyze changes by genome editing, we
employed mouse MEL/ch11 cells that contain a human chromosome 11 where the β-globin locus
is present [27]. We found that the CRISPR/spCas9 system can effectively mutate the binding
motifs of transcription factors in a genome context and believe that it will contribute to studies
on the direct roles of transcription factors.
MATERIALS AND METHODS
Cloning guide sequences of sgRNA into CRISPR vectors
Guide sequences of sgRNA were cloned into lentiCRISPRv2 vector (Addgene #52961) [18] as
suggested by manufacturer, but with modifications in the digestion and dephosphorylation steps.
To use the BsmBI site for cloning in lentiCRISPRv2 vector, ‘CACCG’ were added to the 5′ end
of oligonucleotides for guide sequences, and ‘AAAC’ and ‘C’ were added to the 5′ and 3′ ends of
oligonucleotides for complementary sequences, respectively. A pair of oligonucleotides (10 nM)
was phosphorylated with T4 polynucleotide kinase (NEB M0201S) at 37 °C for 1 h in 10 µl of
reaction volume, annealed by heating to 95 °C for 5 min and cooling to 25 °C at 0.5 °C/min, and
then diluted to 1:1000 in sterile water. One µg of lentiCRISPRv2 vector was digested and
dephosphorylated with FastDigest BsmBI (Thermo Scientific FD0454) and FastAP (Thermo
5
Scientific EF0651) at 37 °C for 30 min in 20 µl of reaction volume. Fifty ng of digested vector
and 1 µl of diluted oligonucleotide duplex were ligated with Quick T4 DNA ligase (NEB
M2200S) at 25 °C for 20 min in 11 µl of reaction volume. Ligated plasmid vectors were
introduced into competent Stbl3 bacteria. For cloning into pLH-spsgRNA2 vector (Addgene
#64114) [28], oligonucleotides were synthesized by adding ‘ACCG’ to the 5′ end of target
sequences and ‘AAAC’ to 5′ end of complementary sequences. This pair of oligonucleotides was
phosphorylated and annealed as described above, and then cloned into BbsI (NEB R0539S) site
in pLH-spsgRNA2 vector. Ligated plasmid vectors were introduced into competent Stbl3
bacteria. All plasmid vectors were prepared using Plasmid midi kits (Qiagen). The EGFP
sequences (5′-GGGCGAGGAGCTGTTCACCG-3′) were used as control guide sequences [18].
Cell culture and lentiviral transduction
MEL/ch11 and 293FT cells were cultured in DMEM medium (Gibco) supplemented with 10%
fetal bovine serum (Gibco) and 1% penicillin-streptomycin (Gibco). To produce lentivirus, 0.5
µg lentiviral vector and 1.5 µg packaging mix (pLP1, pLP2 and pLP/VSVG) were diluted in 125
µl Opti-MEM (Gibco), and 6 µl Lipofectamine 2000 (Invitrogen) in another 125 µl Opti-MEM.
After incubation for 5 min at room temperature, they were mixed and incubated for an additional
20 min. The mixture was added to 1 × 10⁶ 293FT cells in 6-well plate and medium was changed
to complete medium the next day. At 72 h after transfection, lentiviral supernatants were
harvested and filtered through a 0.45 µm membrane. MEL/ch11 cells were infected with
lentiviral supernatants in presence of 6 µg/ml polybrene (Sigma) and medium was replaced with
fresh one the next day. Cells were selected using 2 µg/ml puromycin (Sigma) for lentiCRISPRv2
6
vector or 500 µg/ml hygromycin (Invitrogen) for pLH-spsgRNA2 vector at 72 h after
transduction.
Screening of mutant cell clones
Clonal cells were grown in the wells of 96-well plates after antibiotics selection, and then
transferred to 24-well plates when cell numbers reached to 1 × 10⁵ per well. To screen clones
with mutations in sequences targeted by sgRNA, genomic DNA was isolated using a QIAamp
DNA mini kit (Qiagen) from 1 × 10⁶ cells, and amplified by quantitative PCR (qPCR) using the
following parameters: 20 ng genomic DNA, 4.5 µM forward primer, 4.5 µM reverse primer, and
1× Power SYBR Green PCR master mix (Applied Biosystems) in 10 μl of reaction volume using
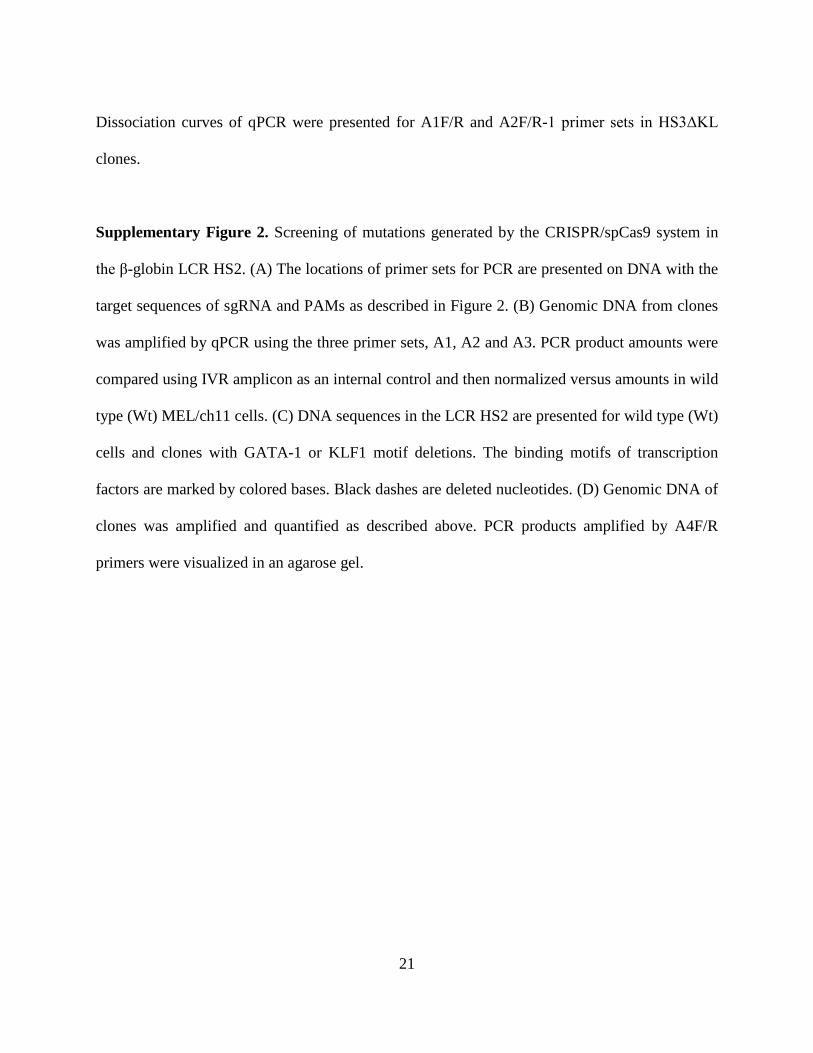
the 7300 Real-time PCR system (Applied Biosystems). Dissociation curves of qPCR were
analyzed using qPCR program and PCR products were visualized on agarose gels. Mutations
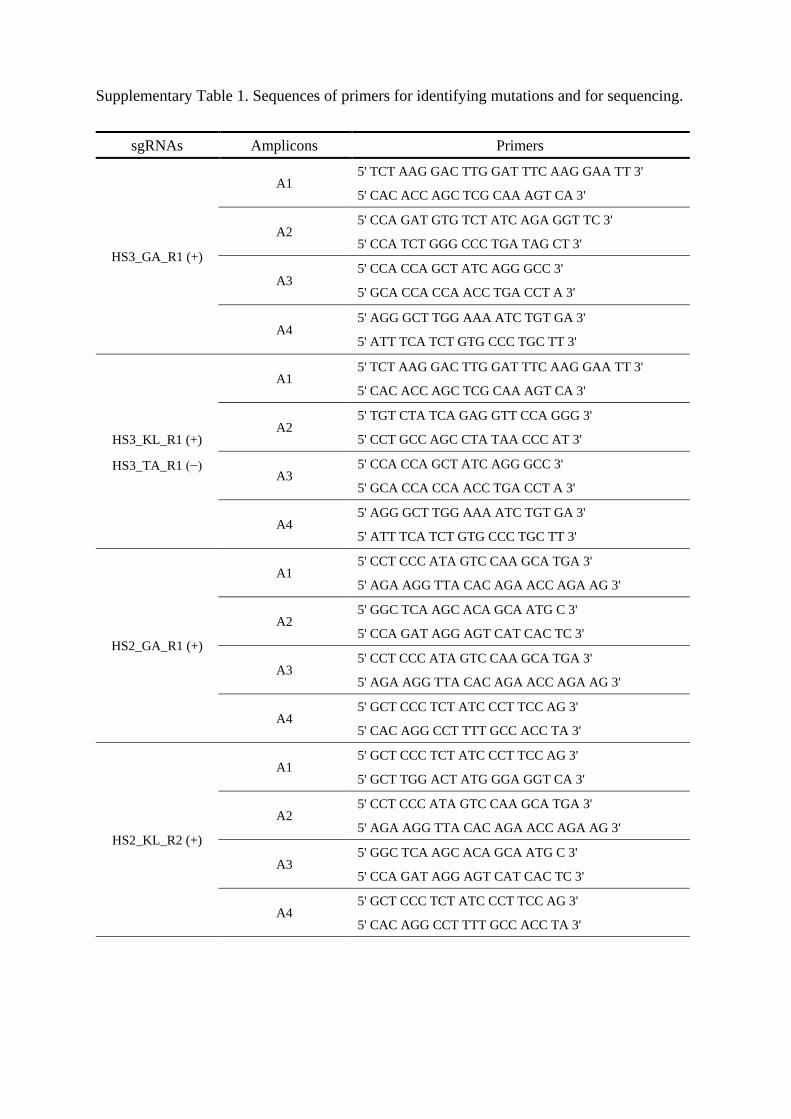
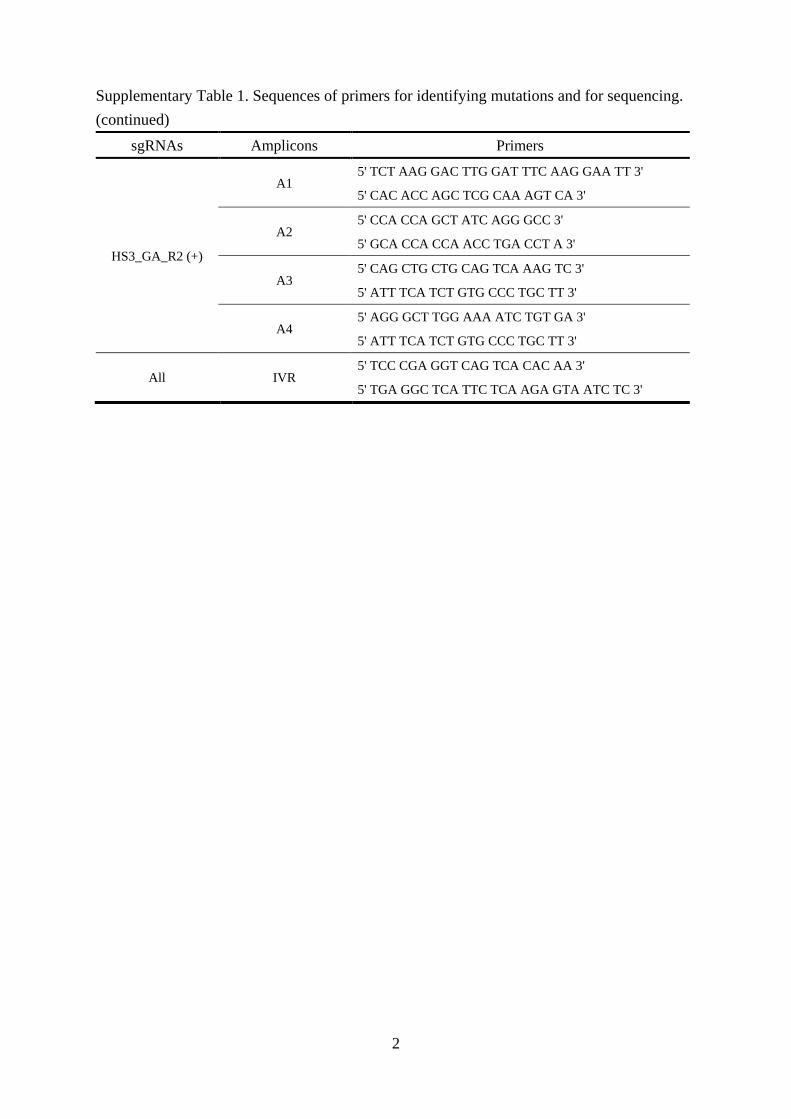
were clarified by DNA sequencing analysis. The sequences of primers used for PCR are
presented in Supplementary Table 1.
Chromatin immunoprecipitation (ChIP)
Clonal MEL/ch11 cells were cultured at 1.5 × 10⁵ cells per ml in 5 mM HMBA (Sigma) for 72 h
to activate the β-globin locus. To cross-link protein to genomic DNA, 1 × 10⁷ cells were
incubated in culture medium containing 1% formaldehyde (Sigma) at 25 °C for 10 min with
shaking, and then glycine (Invitrogen) was added to a final concentration of 0.125 M. After PBS
washing, cross-linked cells were incubated in Cell lysis buffer (10 mM Tris, 10 mM NaCl, 0.2%
NP-40, pH 8.0) at 4 °C for 10 min and centrifuged at 600 g for 5 min to isolate nuclei. The nuclei
was treated with 100 U of MNase (Worthington) at 37 °C for 15 min, incubated in Nuclei lysis
7
buffer (50 mM Tris, 10 mM EDTA, 1% SDS) at 4 °C for 10 min and then sonicated to digest
chromatin to mainly mono-nucleosomes. After pre-clearing with protein G agarose beads
(Millipore), chromatin was reacted with antibodies at 4 °C for 3 h, and protein-DNA complexes
were collected using protein G agarose beads. DNA was purified by phenol extraction and
ethanol precipitation and then dissolved in 150 µl of Tris-EDTA buffer. DNA obtained by ChIP
was analyzed by qPCR using TaqMan chemistry and the following parameters: 2 µl DNA, 2 µM
TaqMan probe, 4.5 µM primers, and 1× TaqMan universal master mix II (Applied Biosystems)
in 10 μl of reaction volume using the 7300 Real-time PCR system (Applied Biosystems).
Antibodies used for ChIP were normal goat IgG (sc-2028), GATA-1 (sc-1233) and TAL1 (sc-
12984) from Santa Cruz Biotechnology and KLF1 (ab2483) from Abcam. The sequences of
probes and primers used for ChIP assay are presented in Supplementary Table 2.
RESULTS AND DISCUSSION
Application of the CRISPR/spCas9 system to the mutation of the binding motifs of
transcription factors in the human β-globin LCR HSs
The human β-globin LCR HSs, which act as enhancers for the β-like globin genes, contain
binding motifs for erythroid specific transcription factors, GATA-1, TAL1 and KLF1 [26]. To
mutate these motifs in the LCR HS2 and HS3, we obtained candidate guide sequences for
sgRNA in the CRISPR/spCas9 system using an online tool (http://crispr.mit.edu) and chose that
their putative cutting sites are located in binding motifs (Figure 1A, B). This tool provides scores
for guide sequences that are inversely related to the possibility of binding to off-target DNA. The
scores of the chosen guide sequences exceeded 70, except for sequences targeting the KLF1
8
motif in LCR HS3 (HS3_KL_R1) (Figure 1B). Next, we cloned the guide sequences into
lentiCRISPRv2 vector and transduced them into MEL/ch11 cells using lentiviral system (Figure
1C), because suspension cells, like MEL cells, are inefficiently transfected using reagents such as
lipofectamine. Transduced cells were selected using puromycin, diluted, and grown in 96-well
plates to obtain clonal cells.
Screening of mutations generated by the CRISPR/spCas9 system
It is important to screen cell clones that are desirably mutated in target sequences by the
CRISPR/spCas9 system. For initially screening, genomic DNA was purified and analyzed by
PCR. Primer sets for PCR were designed for guide sequences (A2F/R) and both side regions
(A1F/R, A3F/R) (Figure 2A). Figure 2B shows the results of qPCR for wild type MEL/ch11
cells and clones in which the LCR HS3 GATA-1 motif (HS3ΔGA) or the TAL1 motif (HS3ΔTA)
was targeted by guided spCas9. Genomic DNA was similarly amplified using A1 or A3 primer
sets in wild type cells and HS3ΔGA and HS3ΔTA clones. However, A2 primer set did not
amplify DNA in HS3ΔGA and HS3ΔTA clones, indicating that mutations occurred in regions
annealed by A2 primers (Figure 2B, Supplementary Figure 1A).
To screen clones in which the LCR HS3 KLF1 motif was targeted, A2F-1 primer was designed
in the outside region of target sequences because of high GC contents in target sequences.
Deletions in target sequences were detected by comparing sizes of PCR products (Figure 2C) and
by comparing dissociation curves of qPCR (Supplementary Figure 1B). The reduction of PCR
product sizes resulted in the changes of dissociation curves. Finally mutated regions were
identified by DNA sequencing using A4F/R primers. Sequencing results showed that 22 bp and
9
12 bp, which include a GATA-1 binding motif, were deleted in HS3ΔGA #1 and #2 clones,
respectively (Figure 2D). Mutations of the TAL1 and KLF1 motifs were sequenced in HS3ΔTA
and HS3ΔKL clones. These results show that binding motifs for transcription factors can be
mutated by sgRNAs of the CRISPR/spCas9 system in a genome context.
On the other hand, we found some clones in which genomic DNA was not amplified by the A1
or A3 primer set in addition to A2 primer set (Figure 2E). It indicates that large regions,
including target sequences, were deleted by the attack of guided-spCas9. To determine the
approximate lengths of deleted regions, we performed PCR using A4F/R primers, which cover
large regions including A1, A2 and A3 amplicons, and ran PCR products in 0.8% agarose gel. It
was found that deleted regions had lengths up to 400 bp. Using the same strategy, clones with
mutations in the GATA-1 or KLF1 motifs of LCR HS2 were screened and sequenced
(Supplementary Figure 2).
The mutations of target sequences can be analyzed using various methods. Mismatch cleavage
assay is most commonly used to analyze genome edited by CRISPR/Cas9 [29]. This assay uses
heteroduplex DNA that is formed by denaturing and annealing PCR products and digests it using
Surveyor nuclease or T7E1 nuclease [29]. However, this assay cannot be used for haploid cells
or single chromosomes, such as sex chromosomes, and does not provide information about
mutated regions. In contrast to the mismatch cleavage assay, analysis using qPCR can provide
information about the locations and approximate lengths of deletions. In addition, many clones
can be screened and analyzed in one time by qPCR. Even deletion and/or insertion in a couple of
base pair can be missed out in genome screening using qPCR and agarose gel ruing, this qPCR
10
strategy still provides a simple and efficient means for screening mutant clones for transcription
factor binding motifs.
Deletion of binding motifs for transcription factors inhibited their binding in a chromatin
environment
To determine whether the deletion of binding motifs results in the loss of transcription factor
binding, we carried out ChIP assays on three mutant clones, that are HS3ΔGA#2, HS3ΔTA#1
and HS3ΔKL#2. The HS3ΔGA#2 and HS3ΔTA#1 clones showed decreases of approximately 50%
in the occupancies of GATA-1 and TAL1 in the LCR HS3, respectively, as compared with
control cells (Figure 3A, B). KLF1 occupancy was more strongly decreased in the HS3ΔKL#2
clone (Figure 3C). The incomplete loss of occupancy for GATA-1 and TAL1 may have been due
to other binding motifs near target motifs. Indeed, there are two or more GATA-1 and TAL1
motifs within 200 bp in the human β-globin LCR HS3, whereas only one cluster of KLF1 motifs
in the LCR HS3, which was deleted in the HS3ΔKL#2 clone. These results indicate binding
motif deletion can inhibit the binding of transcription factor in a chromatin environment.
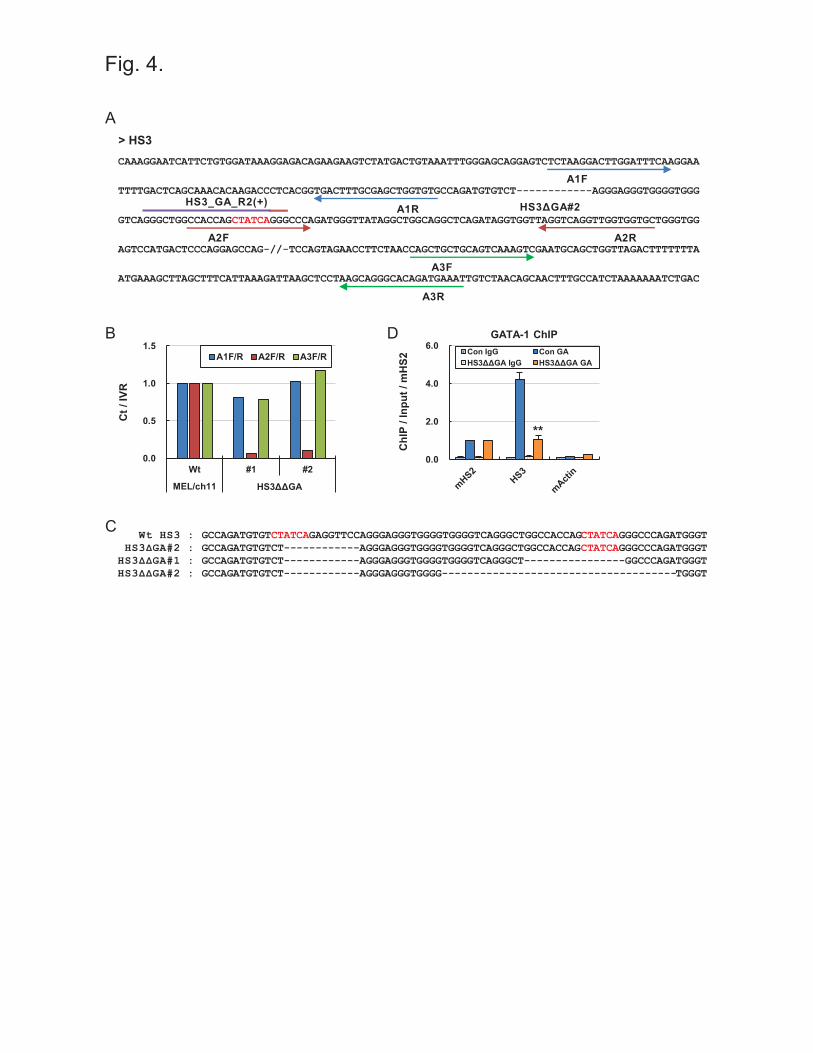
Double deletion of GATA-1 binding motifs in the human β-globin LCR HS3
To more strictly inhibit GATA-1 binding in the LCR HS3, we tried to mutate another GATA-1
binding motif located near the first GATA-1 motif. Guide sequences targeting the second
GATA-1 binding motif (HS3_GA_R2) were cloned into pLH-spsgRNA2 vector, which has the
hygromycin resistance gene as a selectable marker, and then transduced into the HS3ΔGA#2
clone using the procedure described in Figure 1C. After hygromycin selection, clones were
analyzed by qPCR using the primer sets shown in Figure 4A. In clone #1 and #2 of HS3ΔΔGA,
11
genomic DNA was not properly amplified by A2 primers (Figure 4B). DNA sequencing revealed
that 16 bp and 37 bp including the second GATA-1 motif were deleted in HS3ΔΔGA #1 and #2,
respectively, in addition to the deletion of 12 bp for the first GATA-1 motif (Figure 4C). Finally,
we analyzed the occupancy of GATA-1 by ChIP. It was found GATA-1 occupancy was strongly
decreased in the LCR HS3 (Figure 4D). These result shows that two motifs for the same
transcription factor can be sequentially deleted using CRISPR/Cas9 systems with different
selection markers, and that this results in greater inhibition of factor binding.
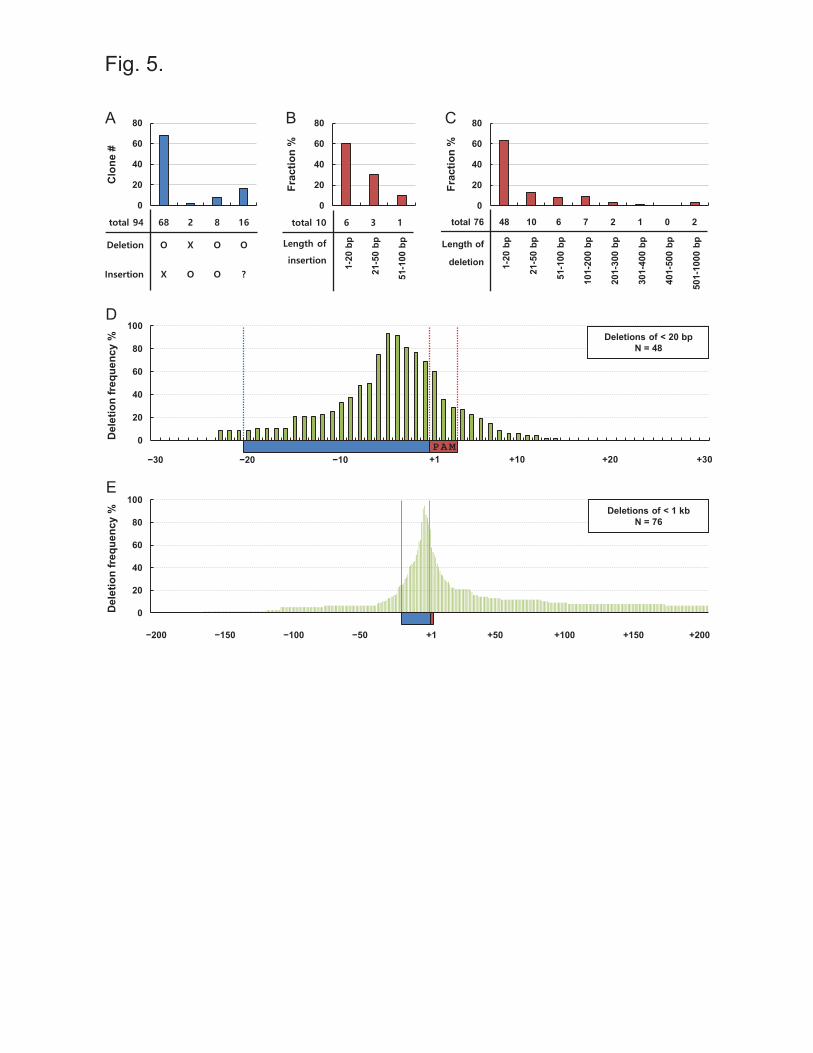
Characterization of mutations generated by the CRISPR/spCas9 system
The CRISPR/Cas9 technique has evolved over several years and has been utilized to knockout
gene expression in many studies [16-22]. To determine whether this genome editing technique
using spCas9 is suitable for mutating binding motifs of transcription factors, we analyzed 94
clones that we obtained with 6 kinds of sgRNA. We could missed out clones having mutations in
a couple of base pair because of the limited resolution of agarose gels in screening processes.
Initially, clones were sorted by the type of mutation (Figure 5A). Sixty eight clones were found
to only exhibit deletion of nucleotides in and near target sequences. Insertion occurred in 2
clones without deletion and in 8 clones with deletion. Sixteen clones had a deletion of a region
exceeding 1 kb, as demonstrated by PCR using various pairs of primers. The number of inserted
nucleotides was under 20 bp in 6 of 10 clones (Figure 5B). The lengths of deleted regions were
under 20 bp in 48 of 76 clones (Figure 5C). These mutation patterns are similar to those reported
previously, but the lengths of deleted regions was longer in our clones as compared with clones
in that gene bodies were targeted [14,16]. This may have been due to the open chromatin
structure of the LCR HSs, which make them susceptible to attack by Cas9 endonuclease. In spite
12
high sensitivity in enhancer regions, our results show that the CRISPR/spCas9 system generates
alterations mainly in short regions, that is, under 20 bp.
Next, we determined the locations of deleted nucleotides with respect to the guide sequences of
sgRNA in 48 clones containing deletions of under 20 bp (Figure 5D). The fourth and fifth
nucleotides upstream from PAMs were deleted in the clones over 90%, and several nucleotides
near them were deleted in relatively high frequencies. These deletion patterns are consistent with
those found in previous studies on plasmids or oligonucleotides, in which a putative cleavage site
was identified between the third and fourth nucleotides upstream of PAMs [8,11]. Figure 5E
shows the deletion pattern in 76 clones containing deletions of < 1 kb. No directional preference
was observed to the up or downstream regions from the highly deleted nucleotides between -1
and -6 from PAMs, although the downstream region was deleted further in a small number of
clones. This deletion pattern provides guideline regarding the choice of guide sequences for
sgRNA.
In summary, we mutated the binding motifs of transcription factors using the CRISPR/spCas9
system in a genome context, and observed reductions in transcription factor occupancies in a
chromatin environment. Our findings imply the CRISPR/spCas9 system can be used to study the
direct roles of transcription factors for target genes without disturbing the expressions of other
transcription factors. Furthermore, DNA breaks caused by the CRISPR/spCas9 system resulted
in mainly deletions or insertions of less than 20 nucleotides, which indicates this system is
suitable for mutating short cis-elements, such as transcription factor binding motifs. Due to this
restriction to short regions, other cis-elements near target sequences might be maintained during
13
genome editing using the CRISPR/spCas9 system, which would allow study of the individual
roles of cis-elements. In addition, the deletion of binding motifs for transcription factors using
the CRISPR/Cas9 system would be useful for inhibiting the expressions of target genes without
side effects, because the mutations of gene coding regions could result in the expressions of
abnormal polypeptides by nucleotide deletion or frameshift in translation. In recent studies, the
ALAS2 gene transcription was severely inhibited by a GATA-1 motif deletion generated using
the CRISPR/Cas9 system [30,31]. Enhancer deletion of the BCL11A gene using the
CRISPR/Cas9 system suggested the therapeutic possibility for the β-haemoglobinopathies by
failing BCL11A expression and resulting in induction of the fetal γ-globin expression [32].
Overall, the CRISPR/Cas9 system is believed to effectively mutate the binding motifs of
transcription factors in a genome context, and consequently the mutations can regulate the
binding of transcription factors in chromatin and might regulate gene expression.
AUTHOR CONTRIBUTION
Yea Woon Kim and AeRi Kim designed research and Yea Woon Kim performed experiments
and analysed data. Yea Woon Kim and AeRi Kim wrote the manuscript.
FUNDING
This research was supported by Basic Science Research Program through the National Research
Foundation of Korea (NRF) funded by the Ministry of Science, ICT and future Planning (NRF-
2014R1A2A1A11051702) and by the Ministry of Education (NRF-2014R1A1A2009565).
14
REFERENCES
1 Kim, Y.W., Kim, S., Kim, C.G. and Kim, A. (2011) The distinctive roles of erythroid
specific activator GATA-1 and NF-E2 in transcription of the human fetal γ-globin genes.
Nucleic Acids Res. 39, 6944-6955
2 Zhou, D., Liu, K., Sun, C.W., Pawlik, K.M. and Townes, T.M. (2010) KLF1 regulates
BCL11A expression and γ- to β-globin gene switching. Nat. Genet. 42, 742-744
3 Anderson, K.P., Crable, S.C. and Lingrel, J.B. (2000) The GATA-E box-GATA motif in
the EKLF promoter is required for in vivo expression. Blood 95, 1652-1655
4 Lee, W., Mitchell, P. and Tjian, R. (1987) Purified transcription factor AP-1 interacts
with TPA-inducible enhancer elements. Cell 49, 741-752
5 Maire, P., Wuarin, J. and Schibler, U. (1989) The role of cis-acting promoter elements in
tissue-specific albumin gene expression. Science (New York, N.Y.) 244, 343-346
6 Rudge, T.L. and Johnson, L.F. (2002) Synergistic activation of the TATA-less mouse
thymidylate synthase promoter by the Ets transcription factor GABP and Sp1. Exp. Cell
Res. 274, 45-55
7 Li, D., Lin, Y., Liu, Z., Zhang, Y., Rong, Z. and Liu, X. (2012) Transcriptional regulation
of human novel gene SPATA12 promoter by AP-1 and HSF. Gene 511, 18-25
8 Jinek, M., Chylinski, K., Fonfara, I., Hauer, M., Doudna, J.A. and Charpentier, E. (2012)
A programmable dual-RNA-guided DNA endonuclease in adaptive bacterial immunity.
Science (New York, N.Y.) 337, 816-821
15
9 Barrangou, R., Fremaux, C., Deveau, H., Richards, M., Boyaval, P., Moineau, S.,
Romero, D.A. and Horvath, P. (2007) CRISPR provides acquired resistance against
viruses in prokaryotes. Science (New York, N.Y.) 315, 1709-1712
10 Deltcheva, E., Chylinski, K., Sharma, C.M., Gonzales, K., Chao, Y., Pirzada, Z.A.,
Eckert, M.R., Vogel, J. and Charpentier, E. (2011) CRISPR RNA maturation by trans-
encoded small RNA and host factor RNase III. Nature 471, 602-607
11 Gasiunas, G., Barrangou, R., Horvath, P. and Siksnys, V. (2012) Cas9-crRNA
ribonucleoprotein complex mediates specific DNA cleavage for adaptive immunity in
bacteria. Proc. Natl. Acad. Sci. U. S. A. 109, E2579-2586
12 Anders, C., Niewoehner, O., Duerst, A. and Jinek, M. (2014) Structural basis of PAM-
dependent target DNA recognition by the Cas9 endonuclease. Nature 513, 569-573
13 Cong, L., Ran, F.A., Cox, D., Lin, S., Barretto, R., Habib, N., Hsu, P.D., Wu, X., Jiang,
W., Marraffini, L.A. et al. (2013) Multiplex genome engineering using CRISPR/Cas
systems. Science (New York, N.Y.) 339, 819-823
14 Mali, P., Yang, L., Esvelt, K.M., Aach, J., Guell, M., DiCarlo, J.E., Norville, J.E. and
Church, G.M. (2013) RNA-guided human genome engineering via Cas9. Science (New
York, N.Y.) 339, 823-826
15 Cho, S.W., Kim, S., Kim, J.M. and Kim, J.S. (2013) Targeted genome engineering in
human cells with the Cas9 RNA-guided endonuclease. Nat. biotechnol. 31, 230-232
16 Wang, T., Wei, J.J., Sabatini, D.M. and Lander, E.S. (2014) Genetic screens in human
cells using the CRISPR-Cas9 system. Science (New York, N.Y.) 343, 80-84
16
17 Shalem, O., Sanjana, N.E., Hartenian, E., Shi, X., Scott, D.A., Mikkelsen, T.S., Heckl, D.,
Ebert, B.L., Root, D.E., Doench, J.G. et al. (2014) Genome-scale CRISPR-Cas9
knockout screening in human cells. Science (New York, N.Y.) 343, 84-87
18 Sanjana, N.E., Shalem, O. and Zhang, F. (2014) Improved vectors and genome-wide
libraries for CRISPR screening. Nat. Methods 11, 783-784
19 Shen, B., Zhang, J., Wu, H., Wang, J., Ma, K., Li, Z., Zhang, X., Zhang, P. and Huang, X.
(2013) Generation of gene-modified mice via Cas9/RNA-mediated gene targeting. Cell
Res. 23, 720-723
20 Hai, T., Teng, F., Guo, R., Li, W. and Zhou, Q. (2014) One-step generation of knockout
pigs by zygote injection of CRISPR/Cas system. Cell Res. 24, 372-375
21 Wang, H., Yang, H., Shivalila, C.S., Dawlaty, M.M., Cheng, A.W., Zhang, F. and
Jaenisch, R. (2013) One-step generation of mice carrying mutations in multiple genes by
CRISPR/Cas-mediated genome engineering. Cell 153, 910-918
22 Yang, D., Xu, J., Zhu, T., Fan, J., Lai, L., Zhang, J. and Chen, Y.E. (2014) Effective gene
targeting in rabbits using RNA-guided Cas9 nucleases. J. Mol. Cell Biol. 6, 97-99
23 Heler, R., Samai, P., Modell, J.W., Weiner, C., Goldberg, G.W., Bikard, D. and
Marraffini, L.A. (2015) Cas9 specifies functional viral targets during CRISPR-Cas
adaptation. Nature 519, 199-202
24 Canver, M.C., Bauer, D.E., Dass, A., Yien, Y.Y., Chung, J., Masuda, T., Maeda, T., Paw,
B.H. and Orkin, S.H. (2014) Characterization of genomic deletion efficiency mediated by
clustered regularly interspaced palindromic repeats (CRISPR)/Cas9 nuclease system in
mammalian cells. J. Biol. Chem. 289, 21312-21324
17
25 Stewart, A.J., Hannenhalli, S. and Plotkin, J.B. (2012) Why transcription factor binding
sites are ten nucleotides long. Genetics 192, 973-985
26 Liang, S., Moghimi, B., Yang, T.P., Strouboulis, J. and Bungert, J. (2008) Locus control
region mediated regulation of adult β-globin gene expression. J .Cell Biochem. 105, 9-16
27 Kim, S., Kim, Y.W., Shim, S.H., Kim, C.G. and Kim, A. (2012) Chromatin structure of
the LCR in the human β-globin locus transcribing the adult δ- and β-globin genes. Int. J.
Biochem. Cell Biol. 44, 505-513
28 Ma, H., Naseri, A., Reyes-Gutierrez, P., Wolfe, S.A., Zhang, S. and Pederson, T. (2015)
Multicolor CRISPR labeling of chromosomal loci in human cells. Proc. Natl. Acad. Sci.
U. S. A. 112, 3002-3007
29 Zischewski, J., Fischer, R. and Bortesi, L. (2017) Detection of on-target and off-target
mutations generated by CRISPR/Cas9 and other sequence-specific nucleases. Biotechnol.
Adv. 35, 95-104
30 Tanimura, N., Miller, E., Igarashi, K., Yang, D., Burstyn, J.N., Dewey, C.N. and
Bresnick, E.H. (2016) Mechanism governing heme synthesis reveals a GATA
factor/heme circuit that controls differentiation. EMBO reports 17, 249-265
31 Wakabayashi, A., Ulirsch, J.C., Ludwig, L.S., Fiorini, C., Yasuda, M., Choudhuri, A.,
McDonel, P., Zon, L.I. and Sankaran, V.G. (2016) Insight into GATA1 transcriptional
activity through interrogation of cis elements disrupted in human erythroid disorders.
Proc. Natl. Acad. Sci. U. S. A. 113, 4434-4439
32 Canver, M.C., Smith, E.C.,, Sher, F., Pinello, L., Sanjana, N.E., Shalem, O., Chen, D.D.,
Schupp, P.G., Vinjamur, D.S., Garcia, S.P. et al. (2015) BCL11A enhancer dissection by
Cas9-mediated in situ saturating mutagenesis. Nature 527,192-197
18
FIGURE LEGENDS
Figure 1 The CRISPR/spCas9 strategy for mutating binding motifs for transcription
factors (A) The human β-globin locus is presented. Vertical gray arrows indicate DNase I HSs in
the LCR and 3′HS1. The five globin genes, ε, Gγ, Aγ, δ and β are represented by rectangle in
sequence. DNA sequences are for the LCR HS3 and HS2, and the binding motifs of transcription
factors are marked by colored bases; GATA-1 motif - red, KLF1 motif - green and TAL1 motif -
blue. Target sequences for sgRNA are indicated by purple lines with PAMs in red lines. (B)
Guide sequences of sgRNA are listed with names, scores and PAM sequences, where (+) and (-)
mean guide sequences are positive or negative strand DNA, respectively. (C) Experimental
procedure for mutating binding motifs for transcription factors in MEL/ch11 cells is illustrated
and described in Materials and methods.
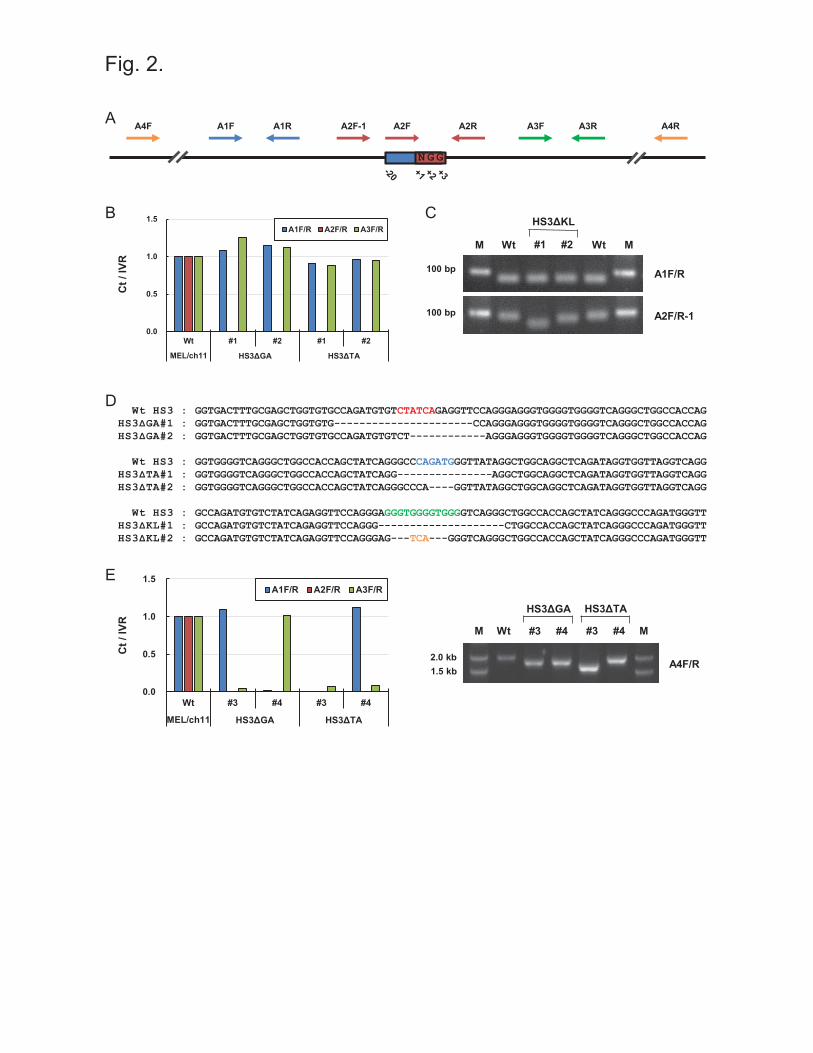
Figure 2 Screening of mutations generated by the CRISPR/spCas9 system (A) The locations
of primer sets for PCR are presented on DNA with respect to the target sequences of sgRNA.
The target sequences are 20 nucleotides in length, and ‘NGG’ nucleotides acting as PAMs are
numbered as ‘+1’, ‘+2’ and ‘+3’. One primer in A2 amplicon (red arrows) locates on the target
sequences, and A2R-1 primer is on next to the target sequences. A1 (blue arrows) and A3
primers (green arrows) locate in both flanking regions of the target sequences. A4F/R (yellow
arrows) primers amplify large region including A1, A2 and A3 amplicons. (B) Genomic DNA
from clones targeted by the CRISPR/spCas9 system, was amplified by qPCR using the three
primer sets, A1, A2 and A3. PCR product amounts were compared using IVR amplicon for
intervening region between the LCR and ε-globin gene as an internal control and then
19
normalized versus amounts in wild type (Wt) MEL/ch11 cells. (C) In HS3ΔKL clones, PCR
products amplified by A1F/R and A2F/R-1 primers were visualized on an agarose gel. M is the
DNA marker. (D) DNA sequences in the LCR HS3 are presented for wild type (Wt) cells and
clones with GATA-1, TAL1 or KLF1 motif deletions. The binding motifs of transcription factors
are marked by colored bases as described in Figure 1. Black dashes represent deleted nucleotides
and yellow bases are inserted nucleotides. (E) Genomic DNA of clones was amplified and
quantified as described above. PCR products amplified by A4F/R primers were visualized in an
agarose gel.
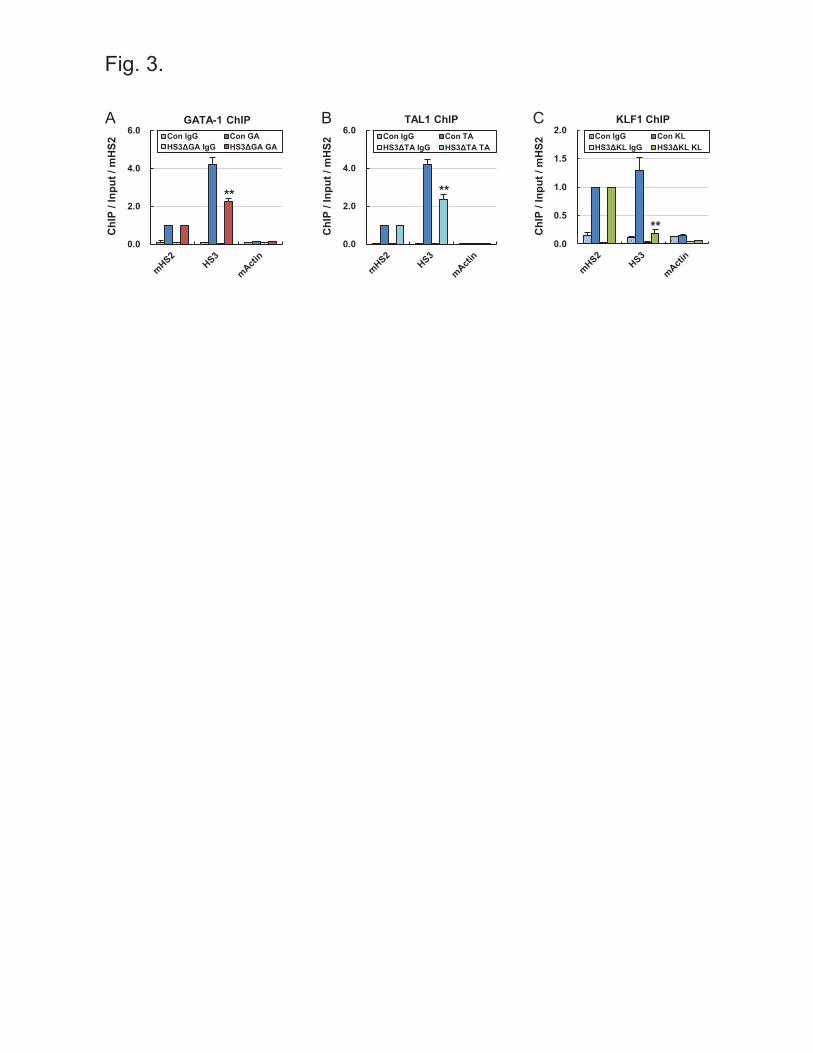
Figure 3 Occupancy of transcription factors in binding motif mutant clones Control cells
and Clones with GATA-1 (A), TAL1 (B) or KLF1 (C) motif deletion were subjected to ChIP
using antibodies specific for GATA-1, TAL1 or KLF1. Amounts of immunoprecipitated DNA
were compared with input DNA and then normalized versus amounts of immunoprecipitated
DNA in the mouse β-globin LCR HS2. The mouse Actin gene served as an internal negative
control and normal goat IgG (IgG) as an experimental negative control. Results are the means ±
SEMs of two independent experiments. **P < 0.01.
Figure 4. Double deletion of GATA-1 binding motifs in the human β-globin LCR HS3 (A)
DNA sequences of HS3 in the HS3ΔGA#2 clone are presented with target sequences (purple line)
for sgRNA. Another GATA-1 motif is indicated by 6 red bases. A2F primer (red arrows) is on
the GATA-1 motif. (B) Genomic DNA was amplified by PCR in the HS3ΔΔGA clones.
Amounts of PCR products were measured as described in Figure 2. (C) DNA sequences in the
LCR HS3 are presented for wild type (Wt), HS3ΔGA#2 clone, and HS3ΔΔGA#1 and #2 clones.
20
(D) ChIP was performed with antibodies specific for GATA-1 in the HS3ΔΔGA#1. Amounts of
immunoprecipitated DNA were determined as described in Figure 3. **P < 0.01.
Figure 5. Characterization of mutations generated by the CRISPR/spCas9 system (A)
Mutations in 94 clones generated using 6 kinds of sgRNA were sorted by deletion and insertion.
Mutations were analyzed by qPCR and/or DNA sequencing. (B) Ten clones with an insertion or
an insertion and a deletion were sorted depending on the lengths of inserted nucleotides. (C)
Seventy six clones with a deletion of < 1 kb were sorted depending on the lengths of deleted
nucleotides. (D) Deletion frequencies were calculated at each nucleotide with respect to target
sequences of sgRNA in 48 clones with deletions of < 20 bp. The first nucleotide of PAM ‘NGG’
sequences in the red rectangle is indicated by ‘+1’, and nucleotides upstream and downstream of
PAMs are indicated by ‘-’ and ‘+’, respectively. (E) Using 76 clones with deletions of < 1 kb,
deletion frequencies were calculated at each nucleotide with respect to target sequences of
sgRNA.
SUPPLEMENTARY MATERIAL
Supplementary Table 1. Sequences of primers for identifying mutations and for sequencing.
Supplementary Table 2. Sequences of primers and probes for the ChIP assay.
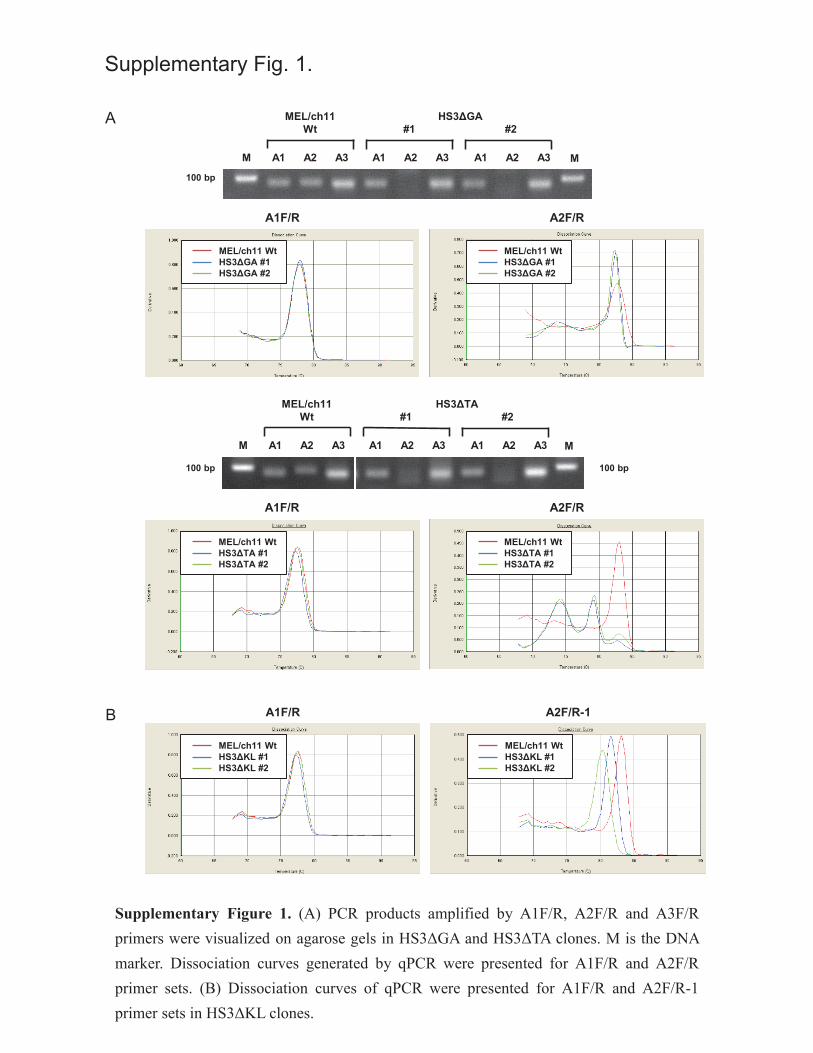
Supplementary Figure 1. (A) PCR products amplified by A1F/R, A2F/R and A3F/R primers
were visualized on agarose gels in HS3ΔGA and HS3ΔTA clones. M is the DNA marker.
Dissociation curves generated by qPCR were presented for A1F/R and A2F/R primer sets. (B)
21
Dissociation curves of qPCR were presented for A1F/R and A2F/R-1 primer sets in HS3ΔKL
clones.
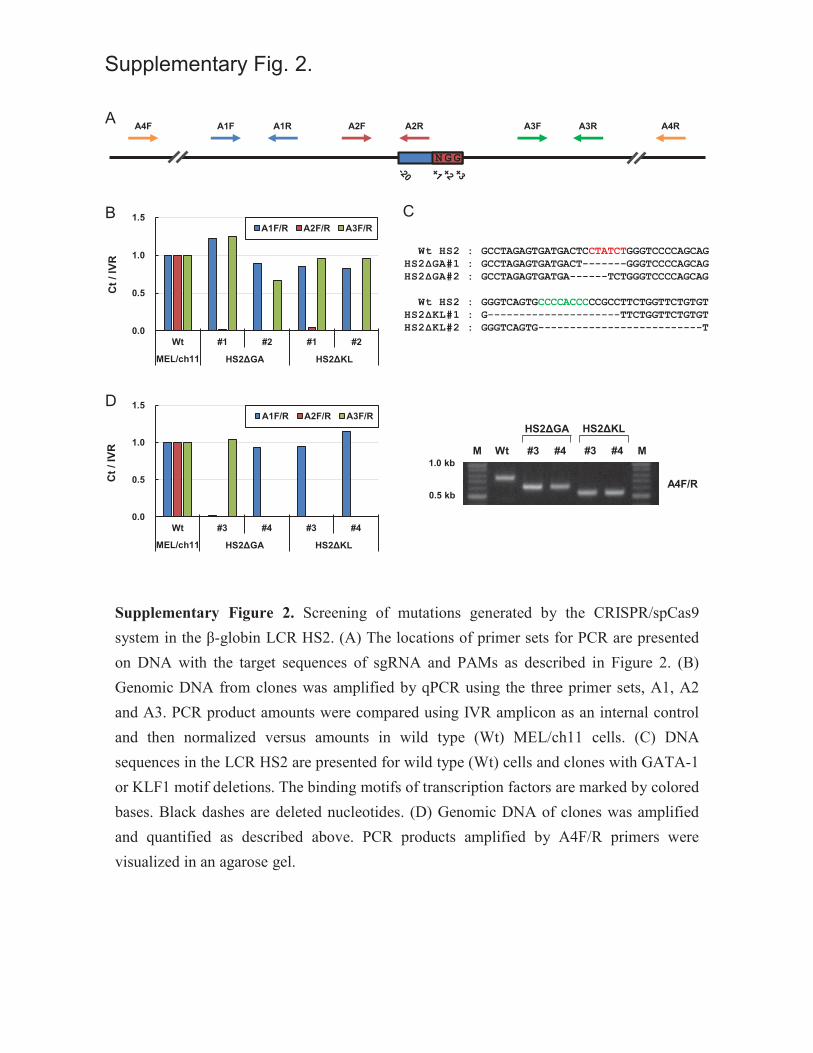
Supplementary Figure 2. Screening of mutations generated by the CRISPR/spCas9 system in
the β-globin LCR HS2. (A) The locations of primer sets for PCR are presented on DNA with the
target sequences of sgRNA and PAMs as described in Figure 2. (B) Genomic DNA from clones
was amplified by qPCR using the three primer sets, A1, A2 and A3. PCR product amounts were
compared using IVR amplicon as an internal control and then normalized versus amounts in wild
type (Wt) MEL/ch11 cells. (C) DNA sequences in the LCR HS2 are presented for wild type (Wt)
cells and clones with GATA-1 or KLF1 motif deletions. The binding motifs of transcription
factors are marked by colored bases. Black dashes are deleted nucleotides. (D) Genomic DNA of
clones was amplified and quantified as described above. PCR products amplified by A4F/R
primers were visualized in an agarose gel.
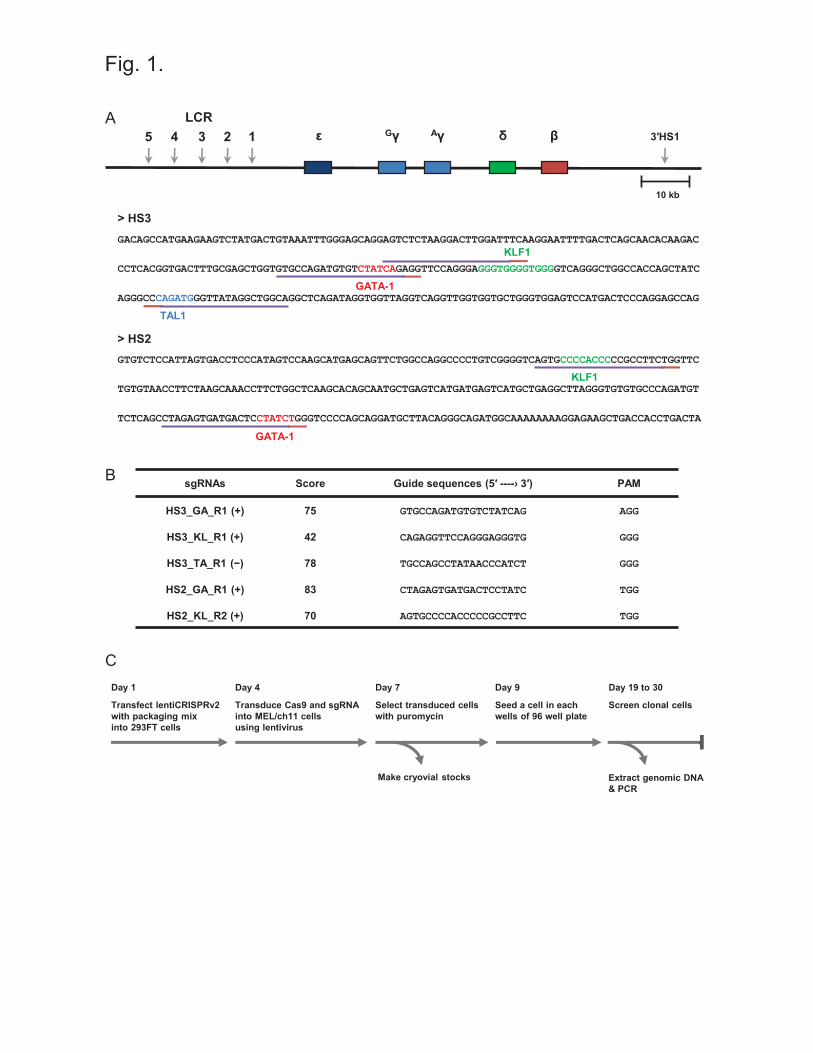
Fig. 1.
A
B
10 kb
4 2 15 3 ε δ βGγ AγLCR
3′HS1
GACAGCCATGAAGAAGTCTATGACTGTAAATTTGGGAGCAGGAGTCTCTAAGGACTTGGATTTCAAGGAATTTTGACTCAGCAACACAAGAC
CCTCACGGTGACTTTGCGAGCTGGTGTGCCAGATGTGTCTATCAGAGGTTCCAGGGAGGGTGGGGTGGGGTCAGGGCTGGCCACCAGCTATC
AGGGCCCAGATGGGTTATAGGCTGGCAGGCTCAGATAGGTGGTTAGGTCAGGTTGGTGGTGCTGGGTGGAGTCCATGACTCCCAGGAGCCAG
> HS3
GATA-1
KLF1
TAL1
GTGTCTCCATTAGTGACCTCCCATAGTCCAAGCATGAGCAGTTCTGGCCAGGCCCCTGTCGGGGTCAGTGCCCCACCCCCGCCTTCTGGTTC
TGTGTAACCTTCTAAGCAAACCTTCTGGCTCAAGCACAGCAATGCTGAGTCATGATGAGTCATGCTGAGGCTTAGGGTGTGTGCCCAGATGT
TCTCAGCCTAGAGTGATGACTCCTATCTGGGTCCCCAGCAGGATGCTTACAGGGCAGATGGCAAAAAAAAGGAGAAGCTGACCACCTGACTA
> HS2
KLF1
GATA-1
sgRNAs Score Guide sequences (5′ ----› 3′) PAM
HS3_GA_R1 (+) 75 GTGCCAGATGTGTCTATCAG AGG
HS3_KL_R1 (+) 42 CAGAGGTTCCAGGGAGGGTG GGG
HS3_TA_R1 (−) 78 TGCCAGCCTATAACCCATCT GGG
HS2_GA_R1 (+) 83 CTAGAGTGATGACTCCTATC TGG
HS2_KL_R2 (+) 70 AGTGCCCCACCCCCGCCTTC TGG
C
Make cryovial stocks Extract genomic DNA& PCR
Day 1
Transfect lentiCRISPRv2 with packaging mix into 293FT cells
Day 4
Transduce Cas9 and sgRNAinto MEL/ch11 cells using lentivirus
Day 7
Select transduced cells with puromycin
Day 9
Seed a cell in each wells of 96 well plate
Day 19 to 30
Screen clonal cells
Wt HS3 : GGTGACTTTGCGAGCTGGTGTGCCAGATGTGTCTATCAGAGGTTCCAGGGAGGGTGGGGTGGGGTCAGGGCTGGCCACCAGHS3ΔGA#1 : GGTGACTTTGCGAGCTGGTGTG----------------------CCAGGGAGGGTGGGGTGGGGTCAGGGCTGGCCACCAGHS3ΔGA#2 : GGTGACTTTGCGAGCTGGTGTGCCAGATGTGTCT------------AGGGAGGGTGGGGTGGGGTCAGGGCTGGCCACCAG
Wt HS3 : GGTGGGGTCAGGGCTGGCCACCAGCTATCAGGGCCCAGATGGGTTATAGGCTGGCAGGCTCAGATAGGTGGTTAGGTCAGG HS3ΔTA#1 : GGTGGGGTCAGGGCTGGCCACCAGCTATCAGG---------------AGGCTGGCAGGCTCAGATAGGTGGTTAGGTCAGGHS3ΔTA#2 : GGTGGGGTCAGGGCTGGCCACCAGCTATCAGGGCCCA----GGTTATAGGCTGGCAGGCTCAGATAGGTGGTTAGGTCAGG
Wt HS3 : GCCAGATGTGTCTATCAGAGGTTCCAGGGAGGGTGGGGTGGGGTCAGGGCTGGCCACCAGCTATCAGGGCCCAGATGGGTTHS3ΔKL#1 : GCCAGATGTGTCTATCAGAGGTTCCAGGG--------------------CTGGCCACCAGCTATCAGGGCCCAGATGGGTTHS3ΔKL#2 : GCCAGATGTGTCTATCAGAGGTTCCAGGGAG---TCA---GGGTCAGGGCTGGCCACCAGCTATCAGGGCCCAGATGGGTT
C
Ct /
IVR
B
Ct /
IVR
E
NGG
A1F A2F-1 A2F A3F A3RA1RA4F A4RA2R
A1F/R
A2F/R-1
100 bp
100 bp
D
0.0
0.5
1.0
1.5
Wt #3 #4 #3 #4
MEL/ch11 HS3ΔGA HS3ΔTA
A1F/R A2F/R A3F/R
Fig. 2.
HS3ΔKL
#1 #2WtM M Wt
A
1.5 kb 2.0 kb A4F/R
#3 #4WtM #3 #4 M
HS3ΔGA HS3ΔTA
0.0
0.5
1.0
1.5
Wt #1 #2 #1 #2
MEL/ch11 HS3ΔGA HS3ΔTA
A1F/R A2F/R A3F/R
0.0
0.5
1.0
1.5
2.0 Con IgG Con KLHS3ΔKL IgG HS3ΔKL KL
0.0
2.0
4.0
6.0 Con IgG Con GAHS3ΔGA IgG HS3ΔGA GA
**
B
ChIP
/ Inp
ut /
mHS
2
C
ChIP
/ Inp
ut /
mHS
2
GATA-1 ChIP
**
TAL1 ChIP
**
KLF1 ChIP
Fig. 3.
ChIP
/ Inp
ut /
mHS
2A
0.0
2.0
4.0
6.0 Con IgG Con TAHS3ΔTA IgG HS3ΔTA TA
0.0
2.0
4.0
6.0 Con IgG Con GAHS3ΔΔGA IgG HS3ΔΔGA GA
Wt HS3 : GCCAGATGTGTCTATCAGAGGTTCCAGGGAGGGTGGGGTGGGGTCAGGGCTGGCCACCAGCTATCAGGGCCCAGATGGGTHS3ΔGA#2 : GCCAGATGTGTCT------------AGGGAGGGTGGGGTGGGGTCAGGGCTGGCCACCAGCTATCAGGGCCCAGATGGGT
HS3ΔΔGA#1 : GCCAGATGTGTCT------------AGGGAGGGTGGGGTGGGGTCAGGGCT----------------GGCCCAGATGGGTHS3ΔΔGA#2 : GCCAGATGTGTCT------------AGGGAGGGTGGGG-------------------------------------TGGGT
**
D
ChIP
/ Inp
ut /
mHS
2
GATA-1 ChIP
C
0.0
0.5
1.0
1.5
Wt #1 #2
MEL/ch11 HS3ΔΔGA
A1F/R A2F/R A3F/R
Ct /
IVR
B
Fig. 4.
CAAAGGAATCATTCTGTGGATAAAGGAGACAGAAGAAGTCTATGACTGTAAATTTGGGAGCAGGAGTCTCTAAGGACTTGGATTTCAAGGAA
TTTTGACTCAGCAAACACAAGACCCTCACGGTGACTTTGCGAGCTGGTGTGCCAGATGTGTCT------------AGGGAGGGTGGGGTGGG
GTCAGGGCTGGCCACCAGCTATCAGGGCCCAGATGGGTTATAGGCTGGCAGGCTCAGATAGGTGGTTAGGTCAGGTTGGTGGTGCTGGGTGG
AGTCCATGACTCCCAGGAGCCAG-//-TCCAGTAGAACCTTCTAACCAGCTGCTGCAGTCAAAGTCGAATGCAGCTGGTTAGACTTTTTTTA
ATGAAAGCTTAGCTTTCATTAAAGATTAAGCTCCTAAGCAGGGCACAGATGAAATTGTCTAACAGCAACTTTGCCATCTAAAAAAATCTGAC
> HS3
HS3ΔGA#2HS3_GA_R2(+)
A1F
A1R
A2RA2F
A3F
A3R
A
0
20
40
60
80
100
"-…
"-…
"-…
"-…
"-…
"-…
-2…
-1…
-1+1
+1…
+2…
"+…
"+…
"+…
"+…
"+…
"+…
0
20
40
60
80
100
−30 −20 −10 +1 +10 +20 +30
Fig. 5.
Dele
tion
freq
uenc
y %
E
D
Dele
tion
freq
uenc
y %
Clon
e #
Frac
tion
%
C
0
20
40
60
80
1 2 3 4
0
20
40
60
80
0
20
40
60
80
Frac
tion
%
B
1-20
bp
21-5
0 bp
51-1
00 b
p
total 76 48 10 6 7 2 1 0 2
Length of
deletion 1-20
bp
21-5
0 bp
51-1
00 b
p
101-
200
bp
201-
300
bp
301-
400
bp
401-
500
bp
501-
1000
bp
PAM
Deletions of < 20 bpN = 48
−200 −150 −100 −50 +1 +50 +100 +150 +200
Deletions of < 1 kb N = 76
A
Supplementary Table 1. Sequences of primers for identifying mutations and for sequencing.
sgRNAs Amplicons Primers
HS3_GA_R1 (+)
A1 5' TCT AAG GAC TTG GAT TTC AAG GAA TT 3'
5' CAC ACC AGC TCG CAA AGT CA 3'
A2 5' CCA GAT GTG TCT ATC AGA GGT TC 3'
5' CCA TCT GGG CCC TGA TAG CT 3'
A3 5' CCA CCA GCT ATC AGG GCC 3'
5' GCA CCA CCA ACC TGA CCT A 3'
A4 5' AGG GCT TGG AAA ATC TGT GA 3'
5' ATT TCA TCT GTG CCC TGC TT 3'
HS3_KL_R1 (+)
HS3_TA_R1 (−)
A1 5' TCT AAG GAC TTG GAT TTC AAG GAA TT 3'
5' CAC ACC AGC TCG CAA AGT CA 3'
A2 5' TGT CTA TCA GAG GTT CCA GGG 3'
5' CCT GCC AGC CTA TAA CCC AT 3'
A3 5' CCA CCA GCT ATC AGG GCC 3'
5' GCA CCA CCA ACC TGA CCT A 3'
A4 5' AGG GCT TGG AAA ATC TGT GA 3'
5' ATT TCA TCT GTG CCC TGC TT 3'
HS2_GA_R1 (+)
A1 5' CCT CCC ATA GTC CAA GCA TGA 3'
5' AGA AGG TTA CAC AGA ACC AGA AG 3'
A2 5' GGC TCA AGC ACA GCA ATG C 3'
5' CCA GAT AGG AGT CAT CAC TC 3'
A3 5' CCT CCC ATA GTC CAA GCA TGA 3'
5' AGA AGG TTA CAC AGA ACC AGA AG 3'
A4 5' GCT CCC TCT ATC CCT TCC AG 3'
5' CAC AGG CCT TTT GCC ACC TA 3'
HS2_KL_R2 (+)
A1 5' GCT CCC TCT ATC CCT TCC AG 3'
5' GCT TGG ACT ATG GGA GGT CA 3'
A2 5' CCT CCC ATA GTC CAA GCA TGA 3'
5' AGA AGG TTA CAC AGA ACC AGA AG 3'
A3 5' GGC TCA AGC ACA GCA ATG C 3'
5' CCA GAT AGG AGT CAT CAC TC 3'
A4 5' GCT CCC TCT ATC CCT TCC AG 3'
5' CAC AGG CCT TTT GCC ACC TA 3'
2
Supplementary Table 1. Sequences of primers for identifying mutations and for sequencing.
(continued)
sgRNAs Amplicons Primers
HS3_GA_R2 (+)
A1 5' TCT AAG GAC TTG GAT TTC AAG GAA TT 3'
5' CAC ACC AGC TCG CAA AGT CA 3'
A2 5' CCA CCA GCT ATC AGG GCC 3'
5' GCA CCA CCA ACC TGA CCT A 3'
A3 5' CAG CTG CTG CAG TCA AAG TC 3'
5' ATT TCA TCT GTG CCC TGC TT 3'
A4 5' AGG GCT TGG AAA ATC TGT GA 3'
5' ATT TCA TCT GTG CCC TGC TT 3'
All IVR 5' TCC CGA GGT CAG TCA CAC AA 3'
5' TGA GGC TCA TTC TCA AGA GTA ATC TC 3'
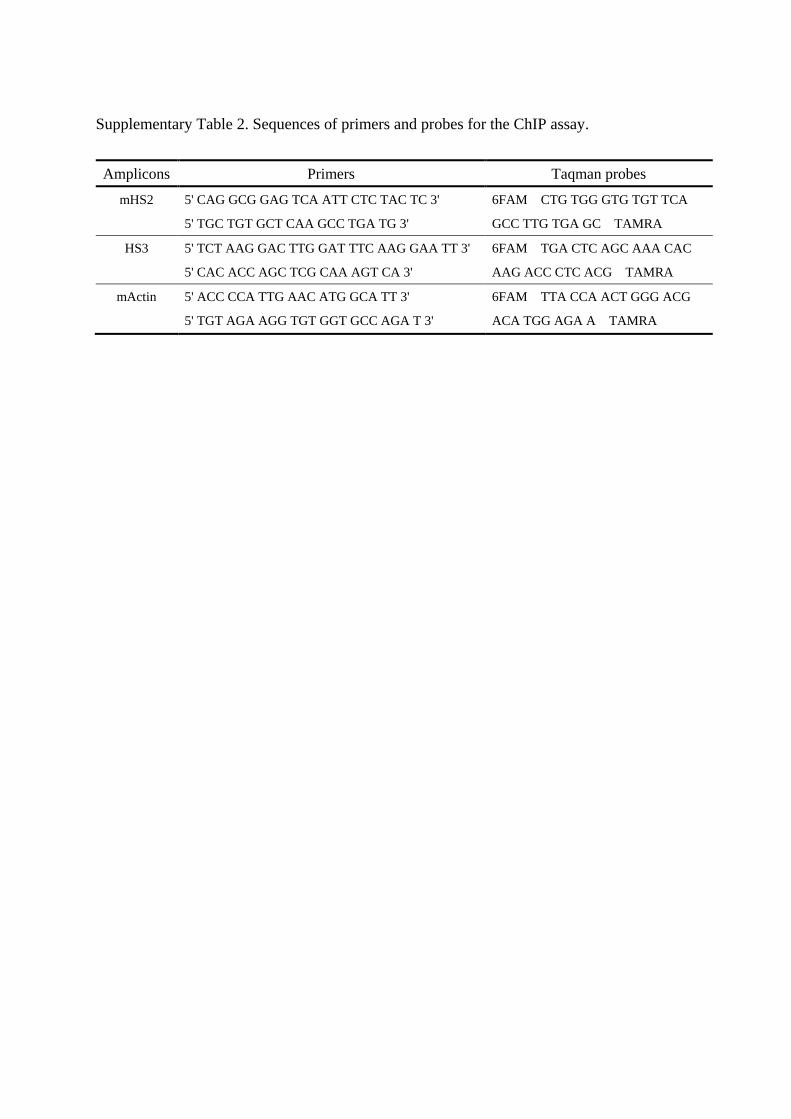
Supplementary Table 2. Sequences of primers and probes for the ChIP assay.
Amplicons Primers Taqman probes
mHS2 5' CAG GCG GAG TCA ATT CTC TAC TC 3'
5' TGC TGT GCT CAA GCC TGA TG 3'
6FAM CTG TGG GTG TGT TCA
GCC TTG TGA GC TAMRA
HS3 5' TCT AAG GAC TTG GAT TTC AAG GAA TT 3'
5' CAC ACC AGC TCG CAA AGT CA 3'
6FAM TGA CTC AGC AAA CAC
AAG ACC CTC ACG TAMRA
mActin 5' ACC CCA TTG AAC ATG GCA TT 3'
5' TGT AGA AGG TGT GGT GCC AGA T 3'
6FAM TTA CCA ACT GGG ACG
ACA TGG AGA A TAMRA
Supplementary Fig. 1.
A
B
100 bp 100 bp
MEL/ch11Wt
HS3ΔGA#1 #2
A1 A2 A3 A1 A2 A3 A1 A2 A3M M
MEL/ch11 WtHS3ΔKL #1 HS3ΔKL #2
MEL/ch11 WtHS3ΔKL #1 HS3ΔKL #2
A1F/R A2F/R-1
A1F/R A2F/R
MEL/ch11 WtHS3ΔTA #1 HS3ΔTA #2
MEL/ch11 WtHS3ΔTA #1 HS3ΔTA #2
A1F/R A2F/R
MEL/ch11 WtHS3ΔGA #1 HS3ΔGA #2
MEL/ch11 WtHS3ΔGA #1 HS3ΔGA #2
Supplementary Figure 1. (A) PCR products amplified by A1F/R, A2F/R and A3F/Rprimers were visualized on agarose gels in HS3ΔGA and HS3ΔTA clones. M is the DNAmarker. Dissociation curves generated by qPCR were presented for A1F/R and A2F/Rprimer sets. (B) Dissociation curves of qPCR were presented for A1F/R and A2F/R-1primer sets in HS3ΔKL clones.
100 bp100 bp
MEL/ch11Wt
HS3ΔTA#1 #2
A1 A2 A3 A1 A2 A3 A1 A2 A3M M
Supplementary Fig. 2.
Ct /
IVR
Ct /
IVR
Wt HS2 : GCCTAGAGTGATGACTCCTATCTGGGTCCCCAGCAGHS2ΔGA#1 : GCCTAGAGTGATGACT-------GGGTCCCCAGCAGHS2ΔGA#2 : GCCTAGAGTGATGA------TCTGGGTCCCCAGCAG
Wt HS2 : GGGTCAGTGCCCCACCCCCGCCTTCTGGTTCTGTGTHS2ΔKL#1 : G---------------------TTCTGGTTCTGTGTHS2ΔKL#2 : GGGTCAGTG--------------------------T
C
0.0
0.5
1.0
1.5
Wt #1 #2 #1 #2
MEL/ch11 HS2ΔGA HS2ΔKL
A1F/R A2F/R A3F/R
0.0
0.5
1.0
1.5
Wt #3 #4 #3 #4
MEL/ch11 HS2ΔGA HS2ΔKL
A1F/R A2F/R A3F/R
NGG
A1F A2F A2R A3F A3RA1RA4F A4RA
B
D
0.5 kb
1.0 kb
A4F/R
#3 #4WtM #3 #4 M
HS2ΔGA HS2ΔKL
Supplementary Figure 2. Screening of mutations generated by the CRISPR/spCas9system in the β-globin LCR HS2. (A) The locations of primer sets for PCR are presentedon DNA with the target sequences of sgRNA and PAMs as described in Figure 2. (B)Genomic DNA from clones was amplified by qPCR using the three primer sets, A1, A2and A3. PCR product amounts were compared using IVR amplicon as an internal controland then normalized versus amounts in wild type (Wt) MEL/ch11 cells. (C) DNAsequences in the LCR HS2 are presented for wild type (Wt) cells and clones with GATA-1or KLF1 motif deletions. The binding motifs of transcription factors are marked by coloredbases. Black dashes are deleted nucleotides. (D) Genomic DNA of clones was amplifiedand quantified as described above. PCR products amplified by A4F/R primers werevisualized in an agarose gel.