D. Waddicor, G. Vaughan, K. Bower, T. Choularton, H. Coe, M. Flynn, M. Gallagher, P. Williams...
15
D. Waddicor, G. Vaughan, K. Bower, T. Choularton, H. Coe, M. Flynn, M. Gallagher, P. Williams Aerosol observations Aerosol observations and growth rates in and growth rates in the TTL the TTL
-
date post
21-Dec-2015 -
Category
Documents
-
view
217 -
download
0
Transcript of D. Waddicor, G. Vaughan, K. Bower, T. Choularton, H. Coe, M. Flynn, M. Gallagher, P. Williams...
D. Waddicor, G. Vaughan, K. Bower, T. Choularton, H. Coe, M. Flynn, M. Gallagher, P. Williams
Aerosol observations and Aerosol observations and growth rates in the TTLgrowth rates in the TTL
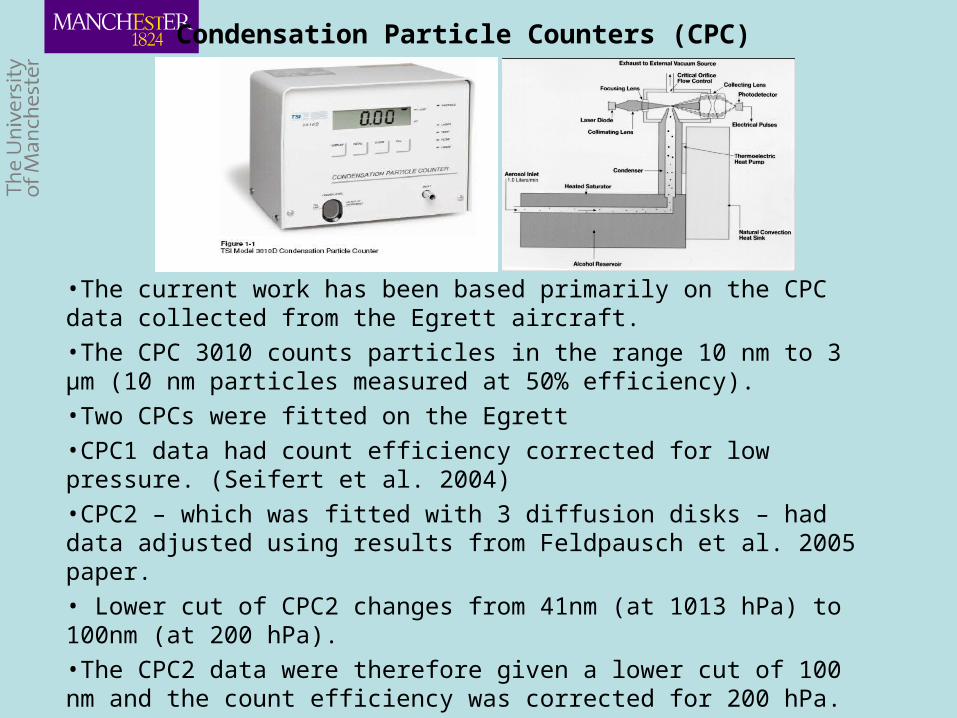
Condensation Particle Counters (CPC)
•The current work has been based primarily on the CPC data collected from the Egrett aircraft.
•The CPC 3010 counts particles in the range 10 nm to 3 μm (10 nm particles measured at 50% efficiency).
•Two CPCs were fitted on the Egrett
•CPC1 data had count efficiency corrected for low pressure. (Seifert et al. 2004)
•CPC2 – which was fitted with 3 diffusion disks – had data adjusted using results from Feldpausch et al. 2005 paper.
• Lower cut of CPC2 changes from 41nm (at 1013 hPa) to 100nm (at 200 hPa).
•The CPC2 data were therefore given a lower cut of 100 nm and the count efficiency was corrected for 200 hPa.
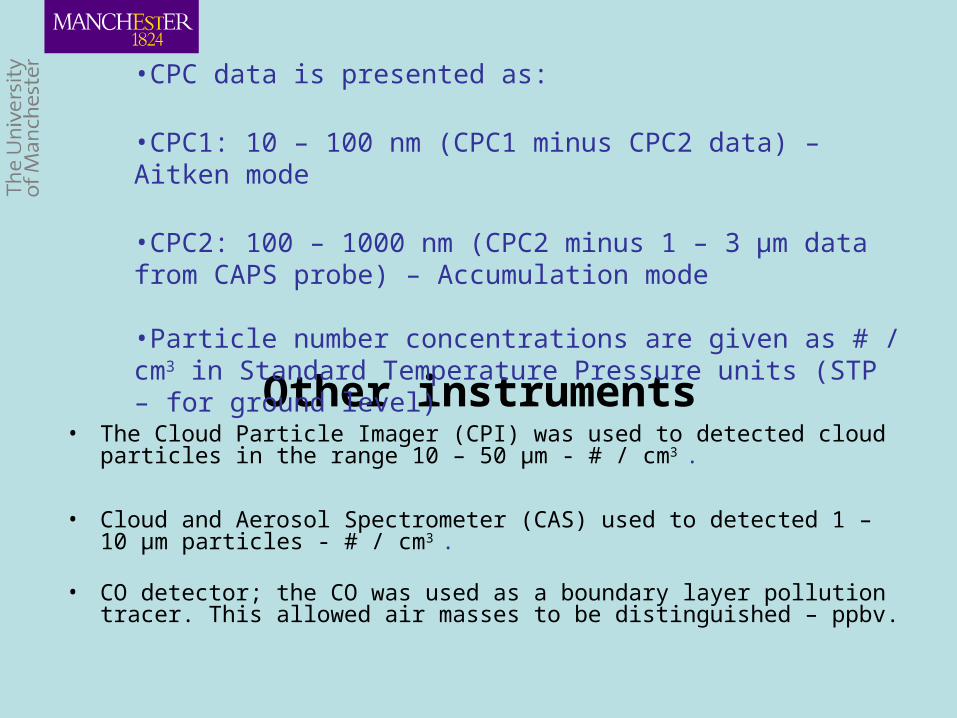
Other instruments• The Cloud Particle Imager (CPI) was used to detected cloud particles in the
range 10 – 50 μm - # / cm3 .
• Cloud and Aerosol Spectrometer (CAS) used to detected 1 – 10 μm particles - # / cm3 .
• CO detector; the CO was used as a boundary layer pollution tracer. This allowed air masses to be distinguished – ppbv.
•CPC data is presented as:
•CPC1: 10 – 100 nm (CPC1 minus CPC2 data) – Aitken mode
•CPC2: 100 – 1000 nm (CPC2 minus 1 – 3 μm data from CAPS probe) – Accumulation mode
•Particle number concentrations are given as # / cm3 in Standard Temperature Pressure units (STP – for ground level)
Planetary Boundary Layer (PBL) Aerosol
• The BL provides inflow material for the convective storms during ACTIVE• ACTIVE aimed to find the effect of the PBL loading on the evolution of the storm and
the subsequent aerosol and chemical composition of the TTL
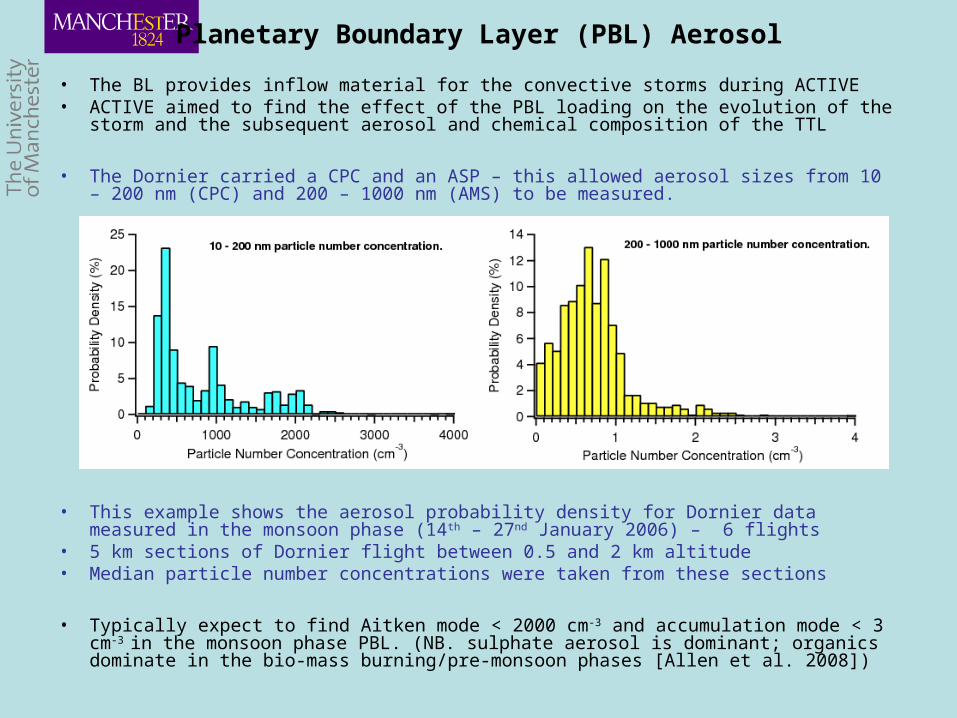
• The Dornier carried a CPC and an ASP – this allowed aerosol sizes from 10 – 200 nm (CPC) and 200 – 1000 nm (AMS) to be measured.
• This example shows the aerosol probability density for Dornier data measured in the monsoon phase (14th – 27nd January 2006) – 6 flights
• 5 km sections of Dornier flight between 0.5 and 2 km altitude• Median particle number concentrations were taken from these sections
• Typically expect to find Aitken mode < 2000 cm-3 and accumulation mode < 3 cm-3 in the monsoon phase PBL. (NB. sulphate aerosol is dominant; organics dominate in the bio-mass burning/pre-monsoon phases [Allen et al. 2008])
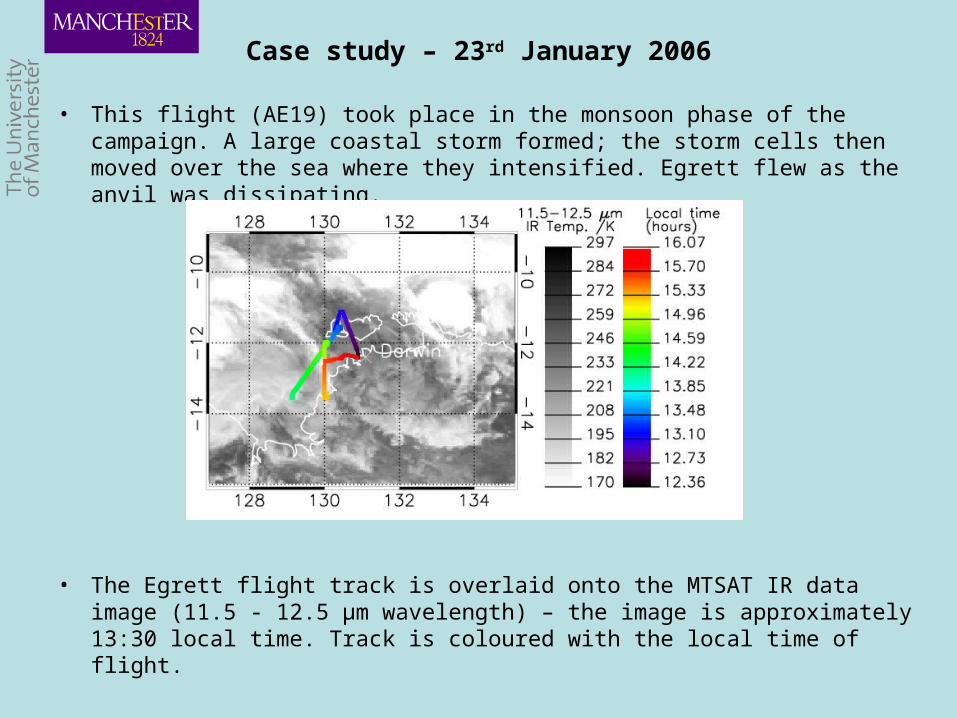
Case study – 23rd January 2006
• This flight (AE19) took place in the monsoon phase of the campaign. A large coastal storm formed; the storm cells then moved over the sea where they intensified. Egrett flew as the anvil was dissipating.
• The Egrett flight track is overlaid onto the MTSAT IR data image (11.5 - 12.5 μm wavelength) – the image is approximately 13:30 local time. Track is coloured with the local time of flight.
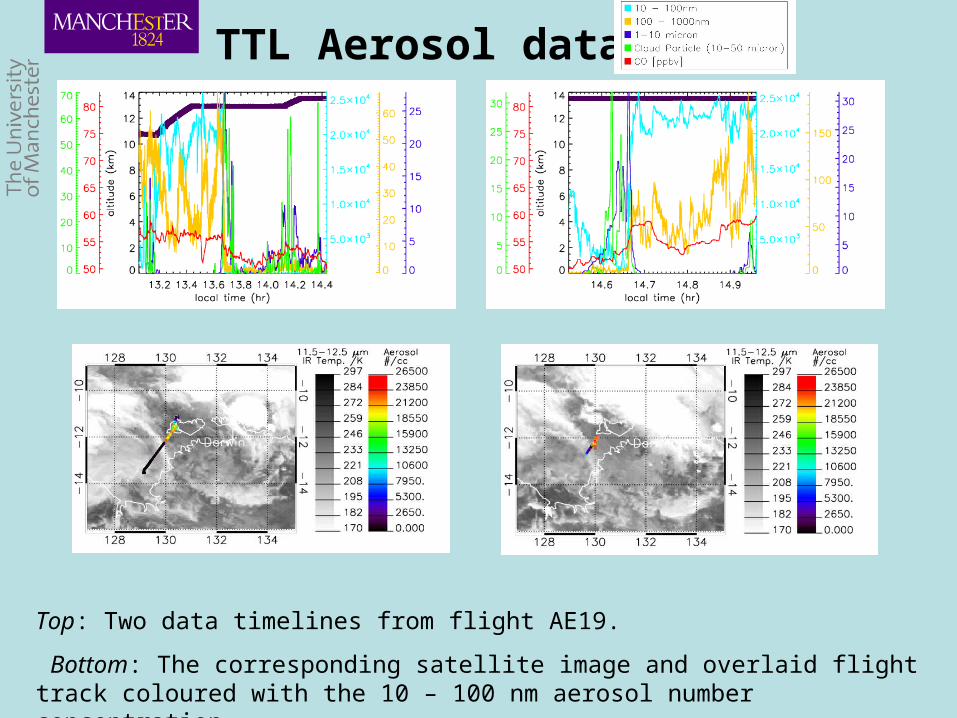
TTL Aerosol data
Top: Two data timelines from flight AE19.
Bottom: The corresponding satellite image and overlaid flight track coloured with the 10 – 100 nm aerosol number concentration.
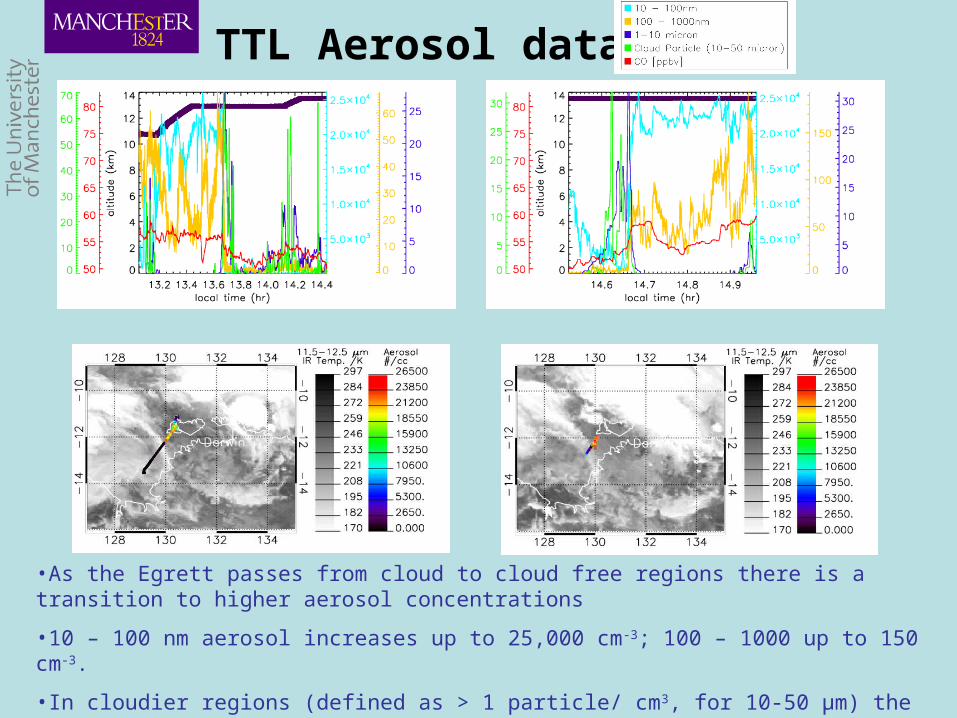
TTL Aerosol data
•As the Egrett passes from cloud to cloud free regions there is a transition to higher aerosol concentrations
•10 – 100 nm aerosol increases up to 25,000 cm-3; 100 – 1000 up to 150 cm-3.
•In cloudier regions (defined as > 1 particle/ cm3, for 10-50 μm) the aerosol is significantly lower, typically < 2000 cm-3 for 10 – 100 nm and < 10 cm-3 for 100 – 1000 nm.
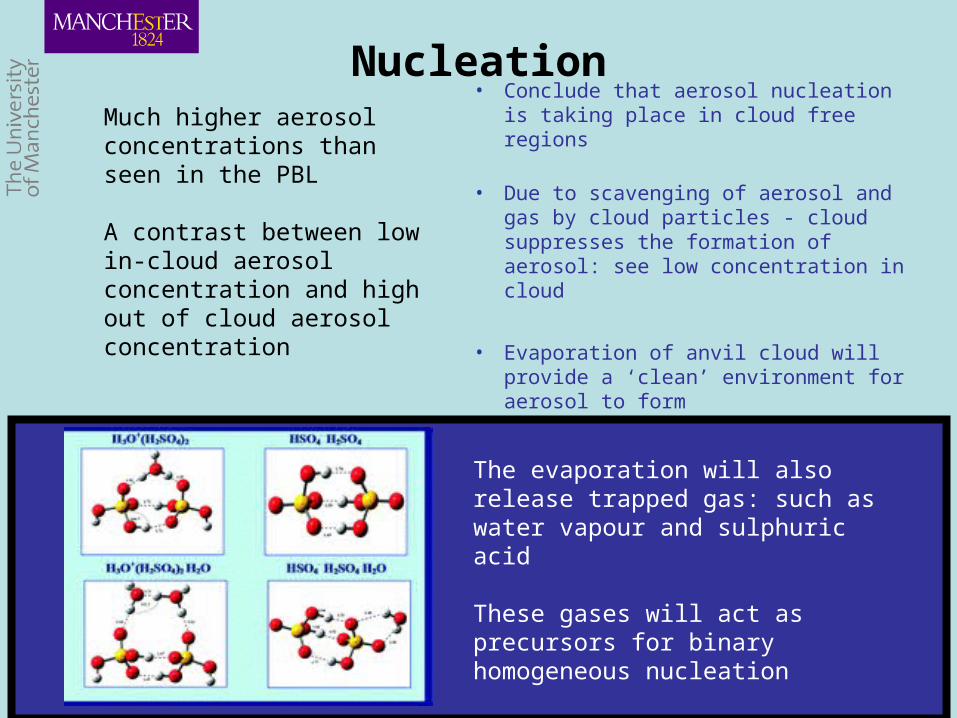
Nucleation• Conclude that aerosol nucleation is
taking place in cloud free regions
• Due to scavenging of aerosol and gas by cloud particles - cloud suppresses the formation of aerosol: see low concentration in cloud
• Evaporation of anvil cloud will provide a ‘clean’ environment for aerosol to form
Much higher aerosol concentrations than seen in the PBL
A contrast between low in-cloud aerosol concentration and high out of cloud aerosol concentration
The evaporation will also release trapped gas: such as water vapour and sulphuric acid
These gases will act as precursors for binary homogeneous nucleation
Origin of the aerosol
• Turn our attention to where the aerosol is coming from
• Need to confirm that aerosol is indeed a product of the convective storms
• And if possible, provide some timescales for the aerosol nucleation
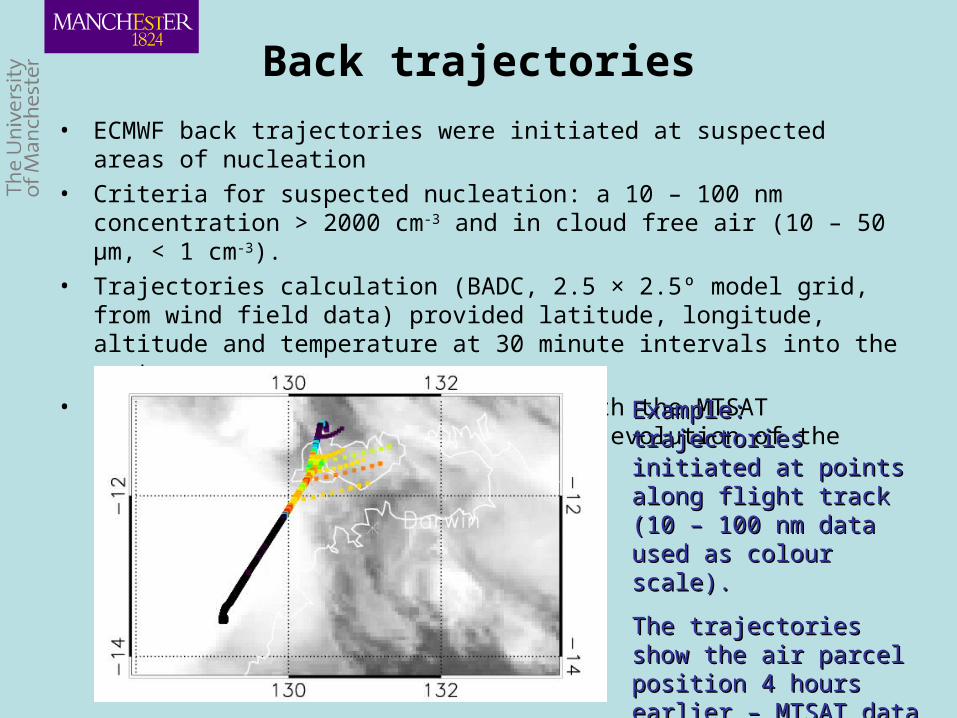
Back trajectories
• ECMWF back trajectories were initiated at suspected areas of nucleation
• Criteria for suspected nucleation: a 10 – 100 nm concentration > 2000 cm-3 and in cloud free air (10 – 50 μm, < 1 cm-3).
• Trajectories calculation (BADC, 2.5 × 2.5º model grid, from wind field data) provided latitude, longitude, altitude and temperature at 30 minute intervals into the past.
• The trajectories were integrated with the MTSAT satellite infrared data to find the evolution of the aerosol air parcel.
Example: trajectories Example: trajectories initiated at points along initiated at points along flight track (10 – 100 nm flight track (10 – 100 nm data used as colour scale).data used as colour scale).
The trajectories show the The trajectories show the air parcel position 4 hours air parcel position 4 hours earlier – MTSAT data earlier – MTSAT data image is also 4 hours image is also 4 hours earlier.earlier.
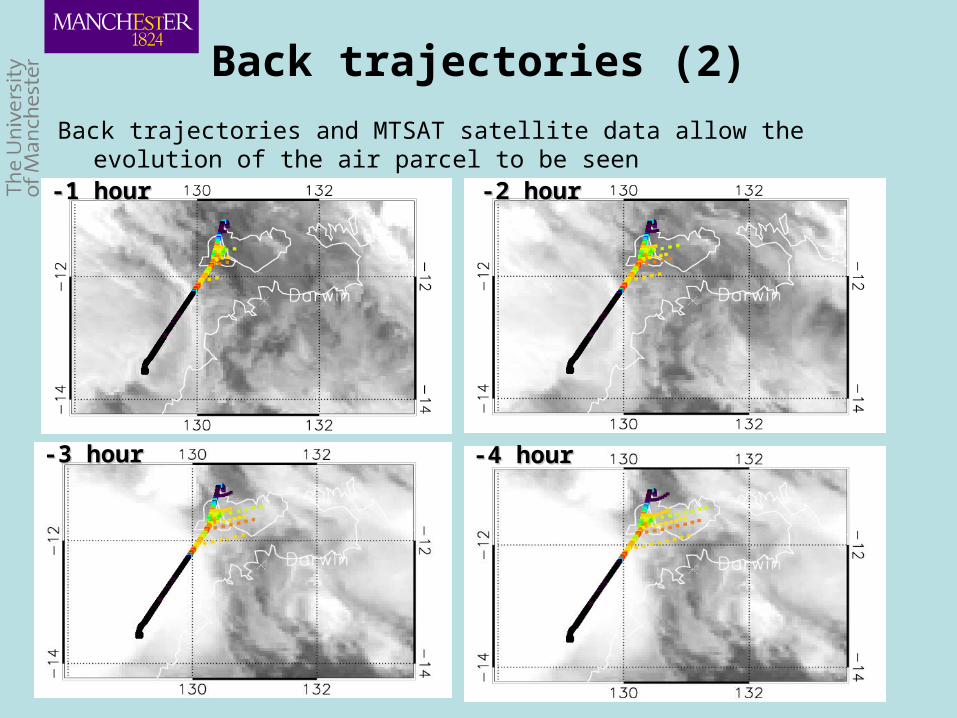
Back trajectories (2)
Back trajectories and MTSAT satellite data allow the evolution of the air parcel to be seen
-1 hour-1 hour -2 hour-2 hour
-3 hour-3 hour -4 hour-4 hour
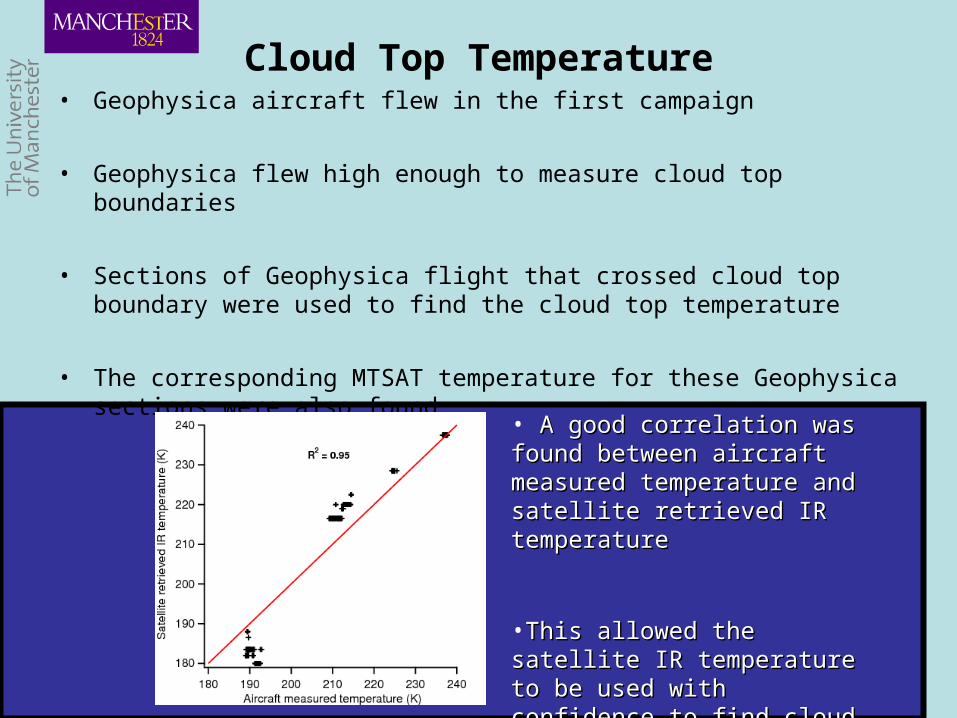
Cloud Top Temperature• Geophysica aircraft flew in the first campaign
• Geophysica flew high enough to measure cloud top boundaries
• Sections of Geophysica flight that crossed cloud top boundary were used to find the cloud top temperature
• The corresponding MTSAT temperature for these Geophysica sections were also found
• A good correlation was found A good correlation was found between aircraft measured between aircraft measured temperature and satellite temperature and satellite retrieved IR temperatureretrieved IR temperature
•This allowed the satellite IR This allowed the satellite IR temperature to be used with temperature to be used with confidence to find cloud top confidence to find cloud top temperaturetemperature
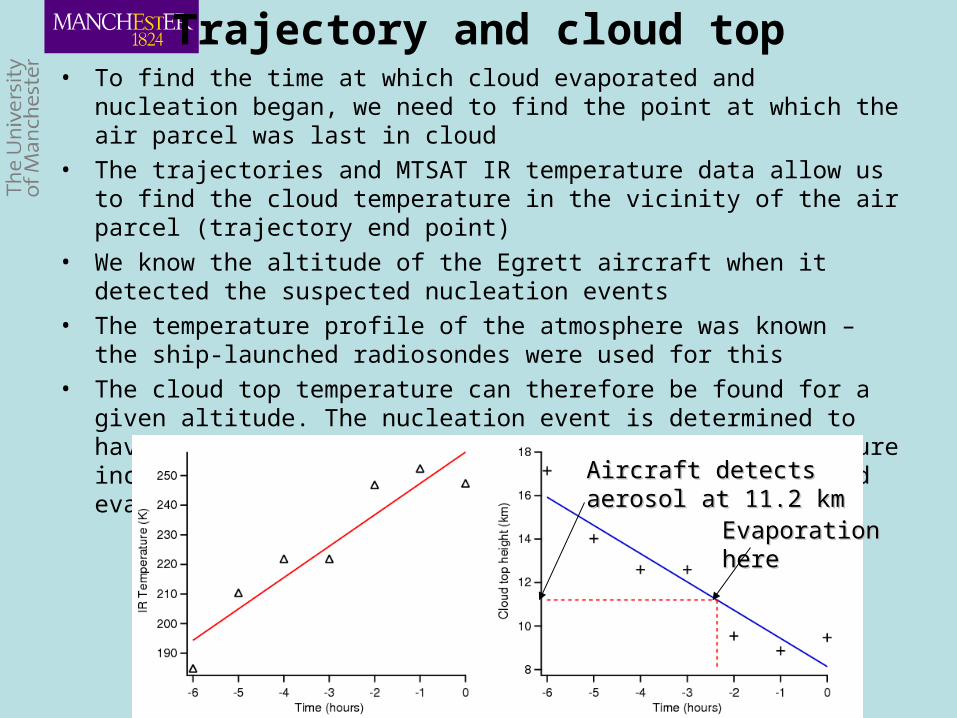
Trajectory and cloud top• To find the time at which cloud evaporated and nucleation began, we need
to find the point at which the air parcel was last in cloud
• The trajectories and MTSAT IR temperature data allow us to find the cloud temperature in the vicinity of the air parcel (trajectory end point)
• We know the altitude of the Egrett aircraft when it detected the suspected nucleation events
• The temperature profile of the atmosphere was known – the ship-launched radiosondes were used for this
• The cloud top temperature can therefore be found for a given altitude. The nucleation event is determined to have begun when the satellite-detected cloud temperature increases beyond the temperature for that altitude and evaporates.
Aircraft detects aerosol at Aircraft detects aerosol at 11.2 km11.2 km
Evaporation hereEvaporation here
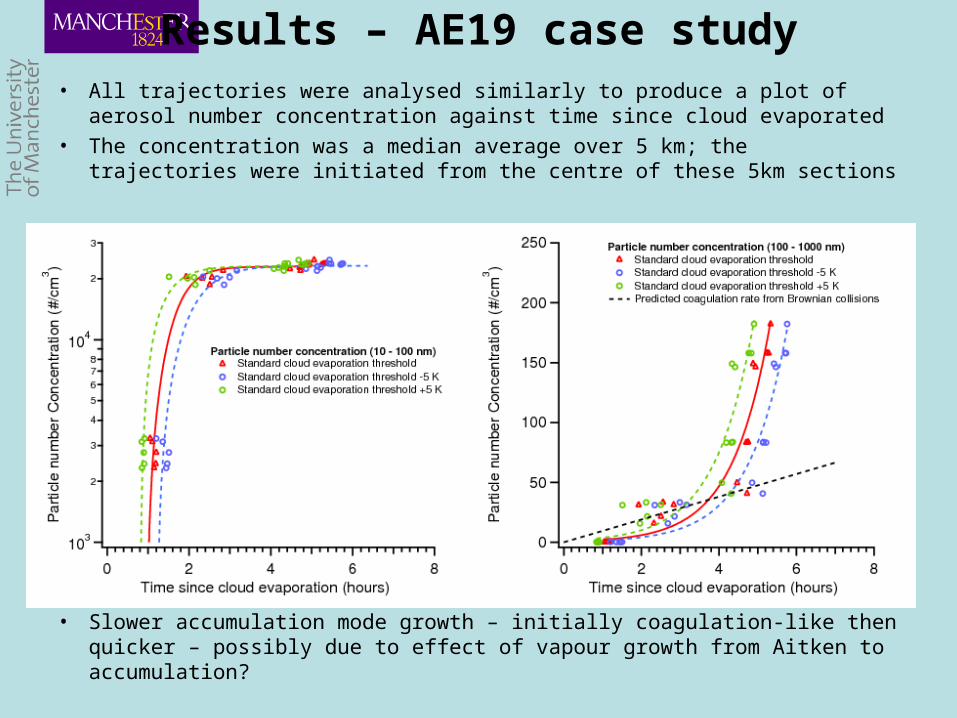
Results – AE19 case study• All trajectories were analysed similarly to produce a plot of aerosol number
concentration against time since cloud evaporated
• The concentration was a median average over 5 km; the trajectories were initiated from the centre of these 5km sections
• Rapid growth of Aitken mode – up to 25,000 cm-3 from 4 – 5 hours• Slower accumulation mode growth – initially coagulation-like then quicker –
possibly due to effect of vapour growth from Aitken to accumulation?
Summary
• Convection does have an impact on the TTL aerosol population: convection provides the precursor material (sulphuric acid, water) for later aerosol nucleation.
• This, rather than direct transport of PBL aerosol, seems to be the most dominant influence on TTL aerosol population.
• Evaporated anvil cloud provides necessary conditions for binary nucleation to occur: cold TTL temperature, high concentrations of precursor gases, and a ‘clean’ environment (absence of ice particles – reduced surface area – low probability of scavenging).
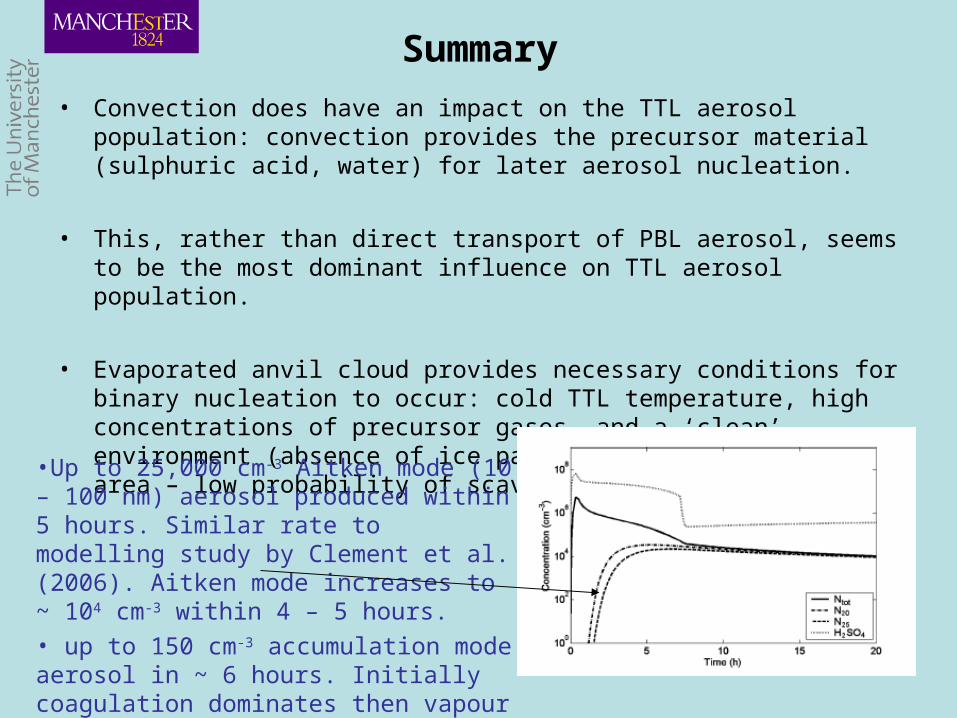
•Up to 25,000 cm-3 Aitken mode (10 – 100 nm) aerosol produced within 5 hours. Similar rate to modelling study by Clement et al. (2006). Aitken mode increases to ~ 104 cm-3 within 4 – 5 hours.
• up to 150 cm-3 accumulation mode aerosol in ~ 6 hours. Initially coagulation dominates then vapour deposition contributes.
![Introduzione alla Teoria Analitica dei Numeri - unipr.itpeople.dmi.unipr.it/alessandro.zaccagnini/psfiles/...Il libro di Montgomery & Vaughan [129] contiene gli sviluppi della teoria](https://static.fdocument.org/doc/165x107/6122c5fd5c419240fa32645f/introduzione-alla-teoria-analitica-dei-numeri-unipr-il-libro-di-montgomery.jpg)


![Ursinyova, N. , Bedford, R. B., & Gallagher, T. (2016). Copper- … · alkyl halides and (b) with key modifications including an external iodide sourcetoprovideboronicester 2a .[a]Enantiomericpurityof](https://static.fdocument.org/doc/165x107/607b466c804c7425625e49f3/ursinyova-n-bedford-r-b-gallagher-t-2016-copper-alkyl-halides.jpg)