Crystal structure of human DGCR8 core Sun Young Sohn, Won ... · Crystal structure of human DGCR8...
13
0.75 1.00 0.25 n = 2.1 ± 0.2 K d = 2.1 ± 1.1 μM 0.50 log 10 [P](log 10 μM) -1 0 1 2 log 10 θ/(1-θ) 0.0 1.0 2.0 2.5 3.0 3.5 4.0 5.0 6.0 9.0 pri-miR-16-1 DGCR8M- pri-miR-16-1 a b DGCR8M (µM) Supplementary Figure 1. The binding analysis between DGCR8M and pri-miR-16-1 (a) The binding between wild type DGCR8M (0 to 9 uM) and pri-miR-16-1 (0.25nM) was analyzed by EMSA. (b) The Hill plot of integration data from (a) is shown. The Hill constant (n) and Kd are mean values of three independent experiments. Crystal structure of human DGCR8 core Sun Young Sohn, Won Jin Bae, Jeong Joo Kim, Kyu-Hyeon Yeom, V. Narry Kim and Yunje Cho
Transcript of Crystal structure of human DGCR8 core Sun Young Sohn, Won ... · Crystal structure of human DGCR8...
0.75 1.000.25
n = 2.1 ± 0.2Kd = 2.1 ± 1.1 μM
0.50
log10[P](log10μM)-1
0
1
2
log 10
θ/(1
-θ)
0.0 1.0 2.0 2.5 3.0 3.5 4.0 5.0 6.0 9.0
pri-miR-16-1
DGCR8M- pri-miR-16-1
a bDGCR8M (µM)
Supplementary Figure 1. The binding analysis between DGCR8M and pri-miR-16-1
(a) The binding between wild type DGCR8M (0 to 9 uM) and pri-miR-16-1 (0.25nM) was analyzed by EMSA.
(b) The Hill plot of integration data from (a) is shown. The Hill constant (n) and Kd are mean values of three independent experiments.
Crystal structure of human DGCR8 core
Sun Young Sohn, Won Jin Bae, Jeong Joo Kim, Kyu-Hyeon Yeom, V. Narry Kim and Yunje Cho
y = -1.6294x + 7.7709R2 = 0.995
3.0
3.5
4.0
4.5
5.0
5.5
6.0
6.5
1.0 1.2 1.4 1.6 1.8 2.0 2.2 2.4
Ve/Vo
log(
Mw
)
a b
pri-miR-16-1& DGCR8M
100 150 200 250 3000
35
70
280 nm260 nm
DGCR8M
100 150 200 250 3000
5
10
Abs
orba
nce
(mA
U)
pri-miR-16-1
100 150 200 250 3000
50
100
280 nm260 nm
280 nm260 nm
669 440 150 66 29 12.4 kDa
Elution volume (ml)
200 ml (101.8 kDa)
230ml (38.4 kDa)
204 ml (87.1 kDa)
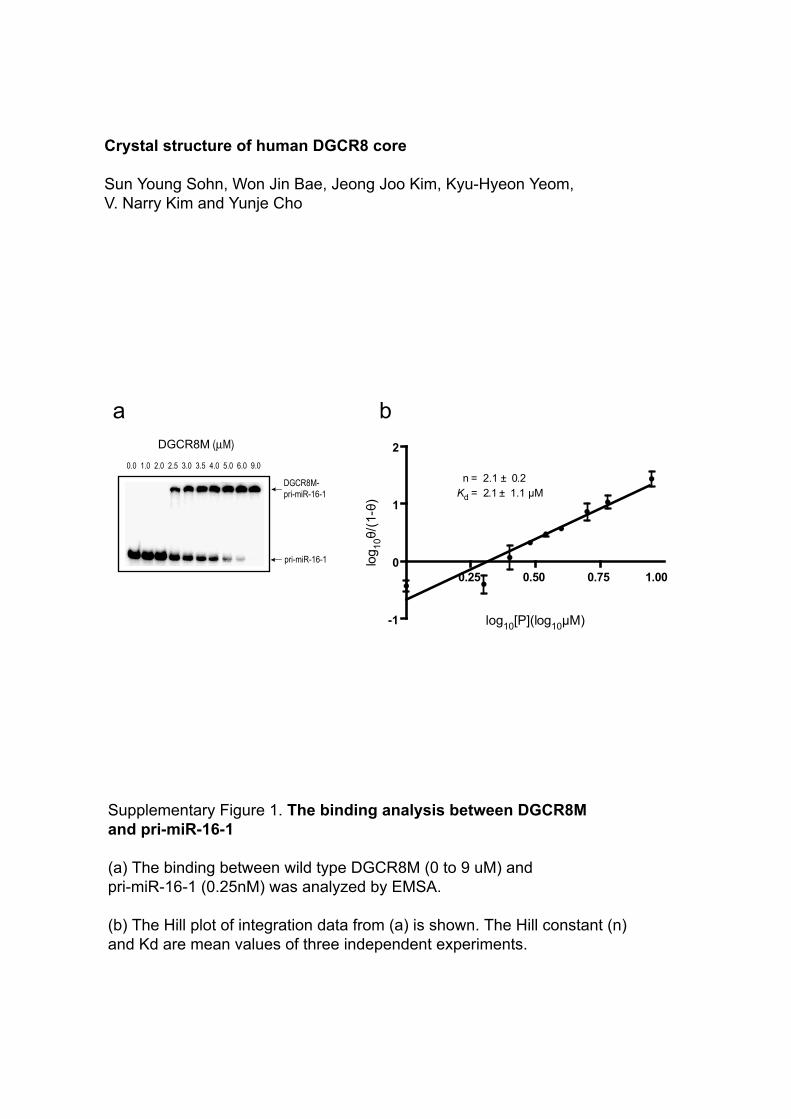
Supplementary Figure 2. SEC analysis of the DGCR8M-pri-miR-16-1 complex (a) The standard curves for SEC experiments. The formula (indicated in figure) was derived from the linear regression curve and used to estimate the molecular weight of the DGCR8M-pri-miR-16-1 complex. The standard curves for SEC experiments were obtained from the following proteins: cytochrome C, 12.4 kDa; carbinic anhydrorase, 29 kDa; Bovin serum albumin, 66 kDa; Alcohol dehydroganase, 150 kDa; Ferritin, 440 kDa; thyroglobulin, 480 kDa. The formula was derived from the linear regression curve and used to estimate the molecular weight of the hDGCR8M-pri-miR-16-1 complex.
(b) SEC results of the DGCR8M-pri-miR-16-1 complex (top), DGCR8M (middle), and pri-miR-16-1 (bottom).
Crystal structure of human DGCR8 core
Sun Young Sohn, Won Jin Bae, Jeong Joo Kim, Kyu-Hyeon Yeom, V. Narry Kim and Yunje Cho
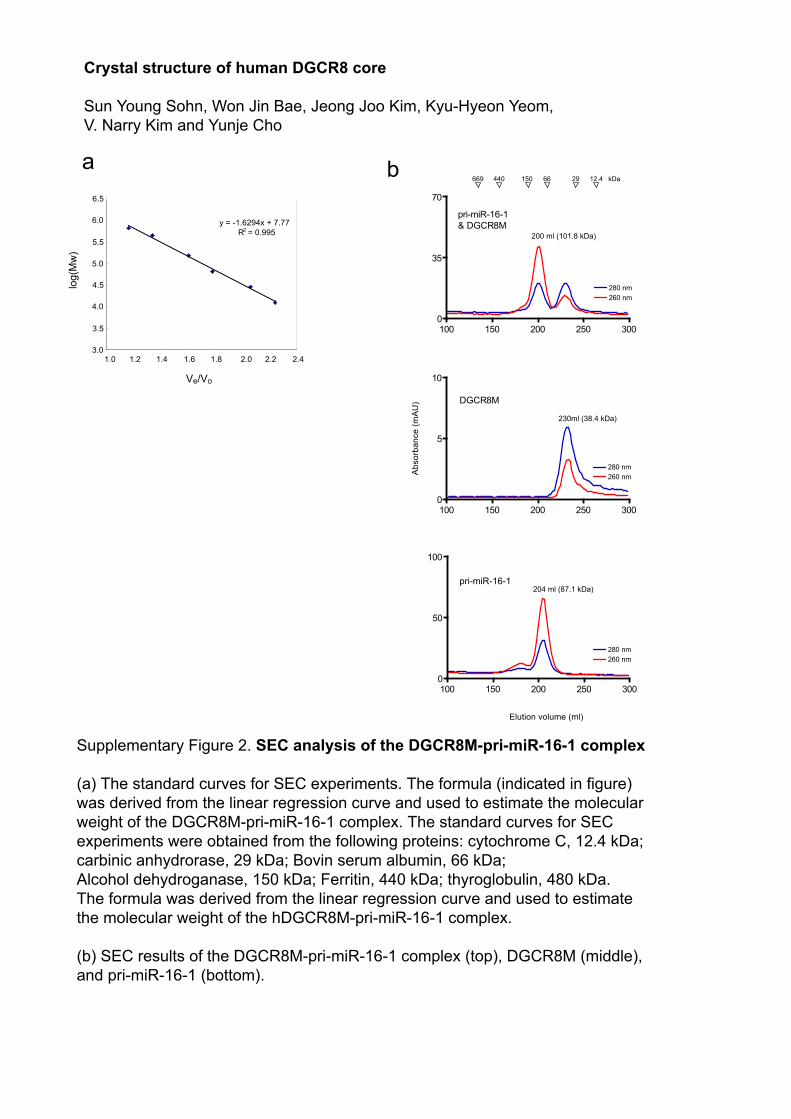
Molecular weight of DGCR8M−pri-miR-16-1 complex from equilibrium sedimentation
Concentration of
DGCR8M (mM)
Concentration of
pri-miR-16-1 (mM)
Estimated MW
(kDa)
Monomer MW of
DGCR8M (kDa)
Monomer MW of
pri-miR-16-1(kDa)
MW estimated /
MW monomer of
DGCR8M and
pri-miR-16-1
1 0.5 62.4 27 35 1.01
Model: Single ideal speciesVariance: 5.94153E-5Speed:12000 rpmTemp: 15 ℃ V-bar: 0Rho : 1MW: 62417 Da
Radius (cm)
Abo
sorb
ance
Res
idua
lsCrystal structure of human DGCR8 core
Sun Young Sohn, Won Jin Bae, Jeong Joo Kim, Kyu-Hyeon Yeom, V. Narry Kim and Yunje Cho
Supplementary Figure 3. Analytical ultracentrifuge analysis ofthe DGCR8M-pri-miR-16-1 complex
The equilibrium fit results of analytical ultracentrifuge for the DGCR8M-pri-miR-16-1 complex. Fitted overlay (red line) to experimental data (blue circles) is shown in the bottom panel; residuals are shown in upper panel. The fitted parameter for the weight-average molecular weight (Mwapp) was estimated at 62,417 gm-1.
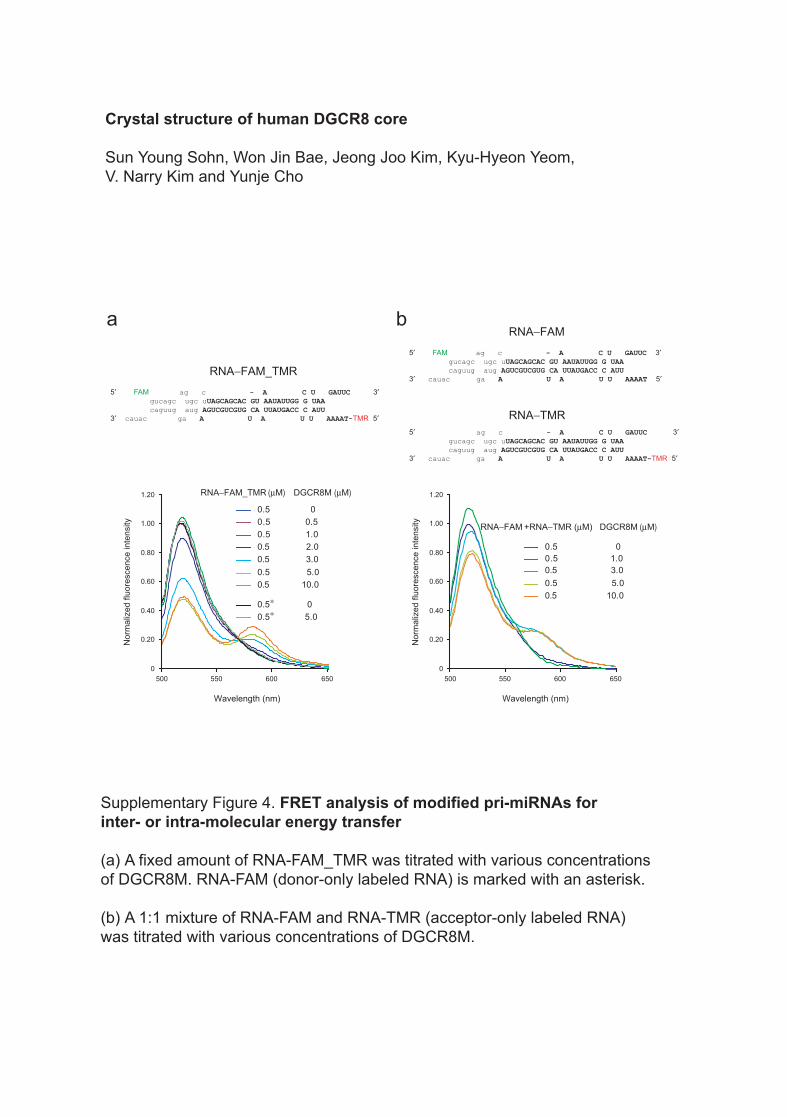
5′ ag c - A C U GAUUC 3′ gucagc ugc uUAGCAGCAC GU AAUAUUGG G UAA caguug aug AGUCGUCGUG CA UUAUGACC C AUU 3′ cauac ga A U A U U AAAAT-TMR 5′
b
RNA−TMR
5′ FAM ag c - A C U GAUUC 3′ gucagc ugc uUAGCAGCAC GU AAUAUUGG G UAA caguug aug AGUCGUCGUG CA UUAUGACC C AUU 3′ cauac ga A U A U U AAAAT 5′
RNA−FAM a
5′ FAM ag c - A C U GAUUC 3′ gucagc ugc uUAGCAGCAC GU AAUAUUGG G UAA caguug aug AGUCGUCGUG CA UUAUGACC C AUU 3′ cauac ga A U A U U AAAAT-TMR 5′
RNA−FAM_TMR
Wavelength (nm)
Nor
mal
ized
fluo
resc
ence
inte
nsity
0
0.20
0.40
0.60
0.80
1.00
1.20
500 550 600 650
0.5 00.5 0.5 0.5 1.0 0.5 2.0 0.5 3.0 0.5 5.0 0.5 10.0
0.5∗ 00.5∗ 5.0
RNA−FAM_TMR (µM) DGCR8M (µM)
Wavelength (nm)
Nor
mal
ized
fluo
resc
ence
inte
nsity
0
0.20
0.40
0.60
0.80
1.00
1.20
500 550 600 650
0.5 00.5 1.0 0.5 3.0 0.5 5.0 0.5 10.0
RNA−FAM +RNA−TMR (µM) DGCR8M (µM)
Supplementary Figure 4. FRET analysis of modified pri-miRNAs forinter- or intra-molecular energy transfer
(a) A fixed amount of RNA-FAM_TMR was titrated with various concentrations of DGCR8M. RNA-FAM (donor-only labeled RNA) is marked with an asterisk.
(b) A 1:1 mixture of RNA-FAM and RNA-TMR (acceptor-only labeled RNA) was titrated with various concentrations of DGCR8M.
Crystal structure of human DGCR8 core
Sun Young Sohn, Won Jin Bae, Jeong Joo Kim, Kyu-Hyeon Yeom, V. Narry Kim and Yunje Cho

Protein Kd (μM) Kd (μM)
DGCR8∆N483 2.0 ± 1.4 × 10 −6 3.0 ± 1.4 × 10 −6
DGCR8L 3.1 ± 1.1 × 10 −6 4.2 ± 1.2 × 10 −6
DGCR8M 2.1 ± 1.1 × 10 −6 4.1 ± 1.3 × 10 −6
DGCR8S 2.2 ± 1.5 × 10 −6 2.9 ± 1.6 × 10 −6
5′ g ag c - A C U GAUU gucagc ugc uUAGCAGCAC GU AAUAUUGG G UAA C caguug aug AGUCGUCGUG CA UUAUGACC C AUU U 3′ ga A U A U U AAAA
pri-miR-16 ∆BS
5′ ggugauagcaau ag c - A C U GAUU gucagc ugc uUAGCAGCAC GU AAUAUUGG G UAA C caguug aug AGUCGUCGUG CA UUAUGACC C AUU U 3′ caucucauac ga A U A U U AAAA
pri-miR-16-1 WT
Supplementary Table 1. Dissociation constants for DGCR8∆N483, DGCR8L, DGCR8M and DGCR8S to the pri-miR-16-1 wild type RNA and pri-miR-16 ∆BS.
Crystal structure of human DGCR8 core
Sun Young Sohn, Won Jin Bae, Jeong Joo Kim, Kyu-Hyeon Yeom, V. Narry Kim and Yunje Cho
Crystal structure of human DGCR8 core
Sun Young Sohn, Won Jin Bae, Jeong Joo Kim, Kyu-Hyeon Yeom,
V. Narry Kim and Yunje Cho
SUPPLEMENTARY METHODS
Protein Expression and Purification. All constructs were generated using a
standard PCR-based cloning strategy, and entire coding sequences were
verified by sequencing. The whole gene of human DCGR8 (residues 1–773)
was cloned from HEK293T cDNA, inserted into pGEX-2T vector (Amersham),
and expressed in E. coli BL21 as GST fusion protein and purified using a
glutathion Sepharose column. They were then cleaved with thrombin. Full
length DGCR8 was further purified by anion exchange and gel-filtration
chromatography. To aid crystallization, we used combination information of
limited proteolysis and sequence alignment analysis. This characterization
identified the conserved core DGCR8S (residues 493-720), which was used for
structural analysis.
His-tagged DGCR8S (residues 493-720) was also synthesized by PCR,
digested, inserted into pET28a (Novagen) vector, and transformed into E. coli
BL21 (DE3). DGCR8S was purified using a Ni-column and then subjected to
cation exchange (Mono-S) and gel-filtration chromatography (Superdex 75
column). DGCR8S used for the crystallization was first concentrated to 8 mg/ml.
DGCR8M (residues 493 to 738), DGCR8L (residues 484 to 750), and
DGCR8ΔN483 (residues 484 to 773) were cloned into pET28a and expressed
in E. coli strain BL21 (DE3). The overall purification procedure used for these
1
proteins was the same at that used for DGCR8S.
Preparation of pri-miRNA for EMSA. pri-miRNAs were prepared by in vitro
transcription. Template DNAs for pri-miR-16-1 or the pri-miR-16-ΔBS transcript
were amplified by PCR using pGEM vector containing the pri-miR-16-1 gene.
The forward primers used for PCR contained the T7 promoter sequence at their
5’ ends. The sequences of the primers used were; 5’-
TAATACGACTCACTATAGGTGATAGCAATGTCAGCAGTGCCTTAGCAG-3’
(forward primer for pri-miR-16-1), 5’-GTAGAGTATGGTCAACCTTACTTCAGCA
G-3’ (reverse primer for pri-miR-16-1), 5’-TAATACGACTCACTATAG
GTCAGCAGTG –CCTTAGCAG - 3’ (forward primer for pri-miR 16-ΔBS) and 5’-
GTCAACCTTACTTCAGCAG-3’ (reverse primer for pri-miR-16-ΔBS). The PCR
products so obtained were then used as templates for in vitro transcription to
prepare pri-miR-16-1 transcripts. Pri-miR-16-1 and pri-miR-16-ΔBS transcripts
were then purified by 8(w/v)% polyacrylamide/ 7(w/v)% urea gel electrophoresis.
Mutation, purification, and protein modification for FRET. DGCR8 mutants
were constructed using a PCR based protocol and purified using the procedure
described above for wild-type DGCR8. All five native cysteines (Cys514,
Cys535, Cys627, Cys666 and Cys675) were replaced by serine by site-directed
mutagenesis to eliminate ambiguous fluorophore labeling. Additional single site
mutations (S493C, V581C or S638C) were introduced into this mutant to create
unique cysteine residues. The Trp699 residue of mutant
(C514S/C535S/C627S/C666S/C675S/V581C) was also mutated to phenyl
2
alanine making it the only Trp donor (Trp665). Incorporations of these mutations
were confirmed by DNA sequencing.
N-(iodoacetyl)-N’-(5-sulfo-1-naphthyl) ethylenediamine (1,5-IAEDANS)
was obtained from Molecular Probes. A 10-fold molar excess of 1,5-IAEDANS
was added to DGCR8M-WC protein solution in labeling buffer containing 25mM
Tris-HCl and 200mM NaCl at pH 7.3. The labeling reaction was allowed to
proceed for 18hr at 18℃. Cysteine-labeled proteins were extensively dialyzed in
storage buffer to remove excess label.
Two DGCR8 mutants, DGCR8L-S493C and DGCR8L-S638C, were
constructed to investigate DGCR8-pri-miRNA binding modes by FRET after
labeling with Cy5 fluorophore. The modification of DGCR8M using Cy5
maleimides (Amersham) was carried out using the protocols described above.
Extents of cysteine labeling were determined by measuring AEDANS
dye concentrations at 336nm (ε=5,700 M-1·cm-1) and Cy5 dye concentrations at
650nm (ε=250,000 M-1·cm-1). Labeling efficiencies were typically >0.95 labels
per protein.
Preparation of pri-miRNA for FRET. pri-miRNAs were prepared using the
protocol described for EMSA using the following primers; 5’-
TAATACGACTCACTATAGGTGATAGCAATGTCAGCAGTGCCTTAGCAG-3’
(forward primer for the miR-16-1 Δ3’ construct) and 5’-
CACAGTTAATACTGGAGAT-3’ (reverse primer for the miR-16-1 Δ3’ construct).
Partial pri-miRNAs either labeled or unlabeled on their 5’ or 3’ ends with a
fluorophore Cy3, FAM(fluorescein) and TMR(rhodamine) purchased from
3
Samchully Pharmaceuticals. The following RNAs are synthesized; 5’-
gcugcugaaguaagguugaccauacucuac-Cy3-3’, 5’-
gcaaugucagcagugccuuagcagcacguaaauauuggcguuaagauuc-3’, 5-
aaaauuaucuccaguauuaacugugcugcugaaguaagguugaccauac-3’, 5’-FAM-
gucagcagugccuuagcagcacguaaauauuggcguuaagauuc-3’, 5-TMR-T-
aaaauuaucuccaguauuaacugugcugcugaaguaagguugaccauac-3’.
The sense-antisense pairs (RNA-FAM and RNA-FAM_TMR) were
annealed into duplexes in 1X universal buffer (6 mM HEPES-KOH, pH 7.5, 20
mM KCl, and 0.2 mM MgCl2). RNAs were denatured at 94 ºC for 1 min and
annealed by slowly (1ºC/min) decreasing temperature to 4ºC. Annealed pri-
miRNA derivatives were purified by native polyacrylamide gel electrophoresis,
recovered by soaking in elution buffer (0.5M CH3COONH4, 0.1mM EDTA, 1mM
MgCl2, 0.1 % SDS), and dialyzed against 100mM NaCl and 25mM Tris-HCl at
pH 7.3. Pri-miR-16-1 derivatives labeled with Cy3 or dual-labeled with FAM
and TMR were then used to analyze the characteristics of binding between
DGCR8 and pri-miRNA.
Fluorescence measurements and FRET calculations. Fluorescence was
measured using a Cary Eclipse Fluorescence spectrophotometer (VARIAN
Australia, Inc) equipped with a Peltier-temperature controlled sample chamber,
which was maintained at 20ºC. Steady-state fluorescence experiments were
performed with the spectrofluorimeter thermostat set at 20ºC. Fluorescence
spectrophotometer’s slits were adjusted to 5 nm. All FRET experiments were
performed over three times independently and each sample was monitored over
4
four scans.
Measurement of RNA-FAM_TMR FRET: To examine the possible RNA
conformational change, a fixed amount (0.5 μM) of FAM and TMR dual-labeled
RNA (RNA-FAM_TMR) or FAM single-labeled RNA (RNA-FAM) was titrated
with various concentrations of DGCR8M (0.5 - 10 μM). DGCR8M was added to
pri-miRNA and incubated for 5 min before measuring the fluorescence spectrum
of RNA. The samples were directly excited at 490 nm and emission signal was
collected at 500 - 650 nm during an average of four scans. The background
fluorescence caused by direct excitation of TAMRA (acceptor) at 490 nm was
measured in separate titration and subtracted. Fluorescence spectra of excess
concentration of RNA (0.5 – 2.5 μM) in the presence of a fixed concentration of
DGCR8 (0.25 μM) were also measured.
Measurement of DGCR8M-WC and DGCR8M-W_Ad: 10 μM of pri-miR-16-1
were added to same concentration of DGCR8M-WC or DGCR8M-W-Ad and
incubated for 5 min before measuring the DGCR8M derivative’s spectrum.
Fluorescence spectra were collected over a range of emission wavelengths
(λex=290 nm and λem=300–560 nm) over four scans. The background
fluorescence caused by direct excitation of AEDANS acceptor at 290 nm was
measured separately and subtracted.
Measurement the orientation of pri-miR-16-1: 0.5 μM of DGCR8L-
S493C_Cy5 or DGCR8M-S638C_Cy5 was added to a fixed concentration of
pri-miR-16-1 labeled Cy3 on 3’ end (pri-miR-16-1-Cy3, 0.2 μM) and incubated
for 5 min before measuring the spectrum. Fluorescence spectra were collected
5
over a range of emission wavelengths (λex = 550 nm, λem = 560-700 nm).
FRET calculation: The efficiency of fluorescence resonance energy transfer
(ET) was determined from donor fluorescence intensity reductions using the
following equation: ET = (1- FDA/ FD) Eq.1
Where FD and FDA are donor fluorescence intensities for donor-only and for
donor and acceptor, respectively. Measurements were performed using the
same buffer under identical concentrations, and FDA/FD ratios were averaged
over a range of 60 nm about the fluorescence maximum.
Distances between donor and acceptor were calculated from FRET
efficiencies using:
R = R0 (1/ ET-1) 1/6 Eq.2
Where R is a distance between fluorophores and R0 is the Förster distance
(defined as the distance at which energy transfer is 50 % of the maximum
value). The Foster distances (R0) between FAM and TMR, and between Cy3
and Cy5 were calculated to be 55 and 60Å, respectively 1,2.
Mutant Protein Structural Changes and Stabilities. The structural changes of
mutant proteins (10 µM) versus the wild type were monitored by circular
dichroism (CD) spectrophotometry (Jasco J-715) at wavelengths between 200-
250 nm. All samples were prepared in the buffer used for size exclusion analysis.
Size exclusion chromatography. All SEC experiments were performed using
a Hi-Load Superdex 200 26/60 column (Amersham) at 4ºC and running buffer
contained 25 mM Tris-HCl, pH 7.5, 150 mM NaCl and 1 mM DTT. To
6
characterize the stoichiometry of the DGCR8-pri-miRNA complex, pri-miR-16-1
was added to 10 molar excess concentration of DGCR8M (final concentration of
RNA: protein = 0.2: 2.0 μM) in running buffer and incubated at 4ºC for 4 hrs.
Analytical ultracentrifugation. The molecular mass of DGCR8M, pri-miR-16-1
and the DGCR8M-pri-miR-16-1 complex were analyzed by means of an
analytical ultracentrifuge optima XL-A (Beckman, PaloAlto, CA) using the
sedimentation equilibrium technique. Sedimentation equilibrium data were
evaluated using a nonlinear least-squares curvefitting algorithm (XL-A Data
Analysis Software). The value of 0.736 mlg-1 was used as the partial specific
volume. All samples were analyzed in binding buffer containing 25 mM Tris-HCl,
pH 7.5, 150 mM NaCl. For equilibrium analysis, scans at equilibrium from
multiple speeds (9,000; 12,000 and 15,000 rpm) were collected at 15ºC,
measuring absorbance at 280 nm.
7
SUPPLEMENTARY REFERENCES
1. Chapados, B.R., Hosfield, D.J., Han, S., Qiu, J., Yelent, B., Shen, B. & Tainer,
J.A. Structural Basis for FEN-1 Substrate Specificity and PCNA-Mediated
Activation in DNA Replication and Repair. Cell 116, 39-50 (2004).
2. Bowen, M.E., Weninger, K., Ernst, J., Chu, S. & Brunger, A.T. Single-
Molecule Studies of Synaptotagmin and Complexin Binding to the SNARE
Complex. Biophys. J. 89, 690–702 (2005).
8