Cost of Capital - CAMPUT€¦ · BOOTH CAMPUT 2013 Cost of Capital . Professor Laurence Booth . CIT...
30
BOOTH CAMPUT 2013 Cost of Capital Professor Laurence Booth CIT Chair in Structured Finance Rotman School of Management University of Toronto
Transcript of Cost of Capital - CAMPUT€¦ · BOOTH CAMPUT 2013 Cost of Capital . Professor Laurence Booth . CIT...
BOOTH CAMPUT 2013
Cost of Capital
Professor Laurence Booth CIT Chair in Structured Finance Rotman School of Management
University of Toronto
BOOTH CAMPUT 2013
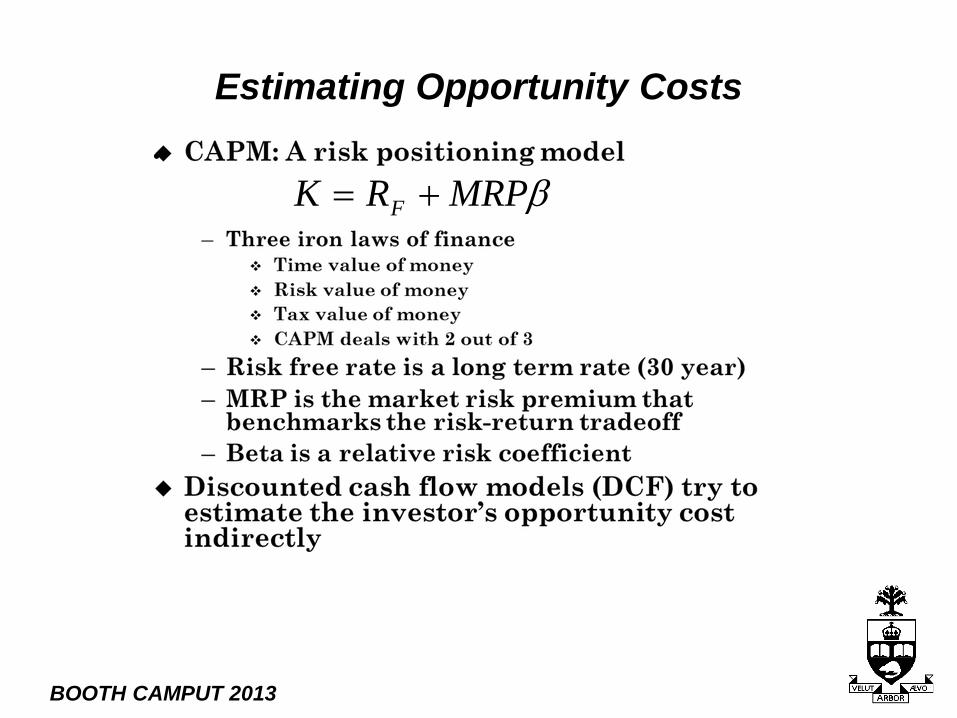
Estimating Opportunity Costs •
βMRPRK F +=
BOOTH CAMPUT 2013
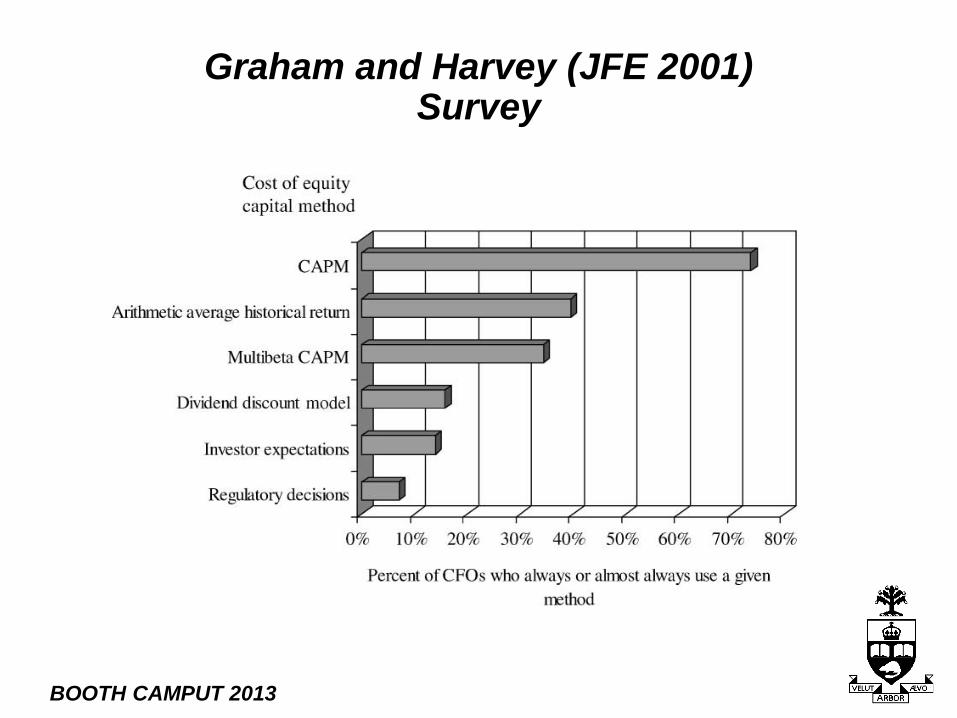
Graham and Harvey (JFE 2001) Survey
BOOTH CAMPUT 2013
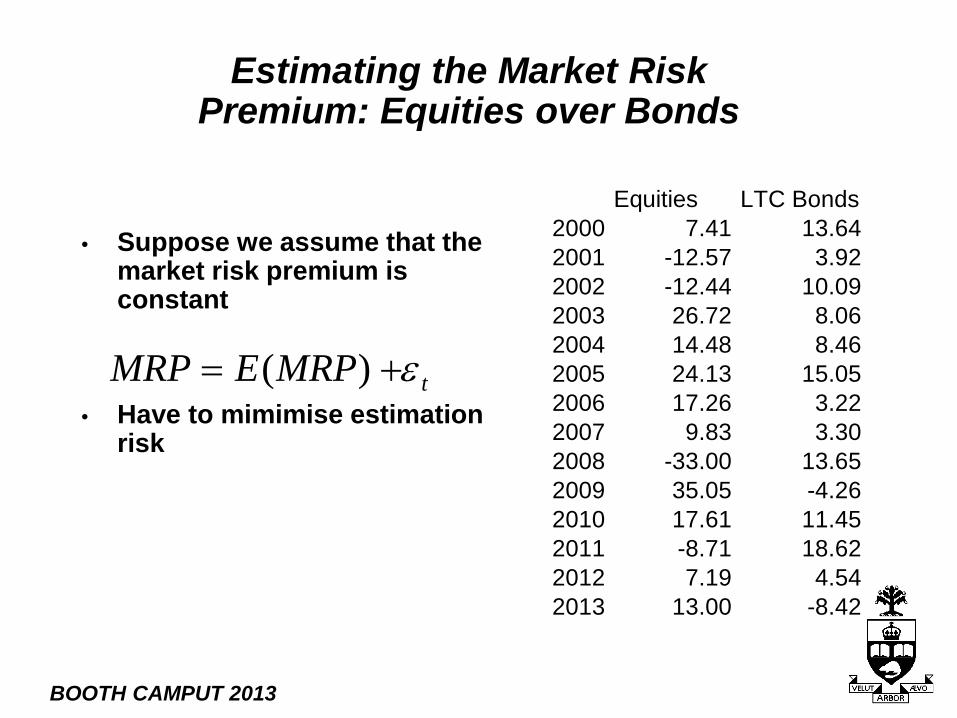
Estimating the Market Risk Premium: Equities over Bonds
• Suppose we assume that the market risk premium is constant
• Have to mimimise estimation risk
tMRPEMRP ε+= )(
Equities LTC Bonds2000 7.41 13.642001 -12.57 3.922002 -12.44 10.092003 26.72 8.062004 14.48 8.462005 24.13 15.052006 17.26 3.222007 9.83 3.302008 -33.00 13.652009 35.05 -4.262010 17.61 11.452011 -8.71 18.622012 7.19 4.542013 13.00 -8.42
BOOTH CAMPUT 2013
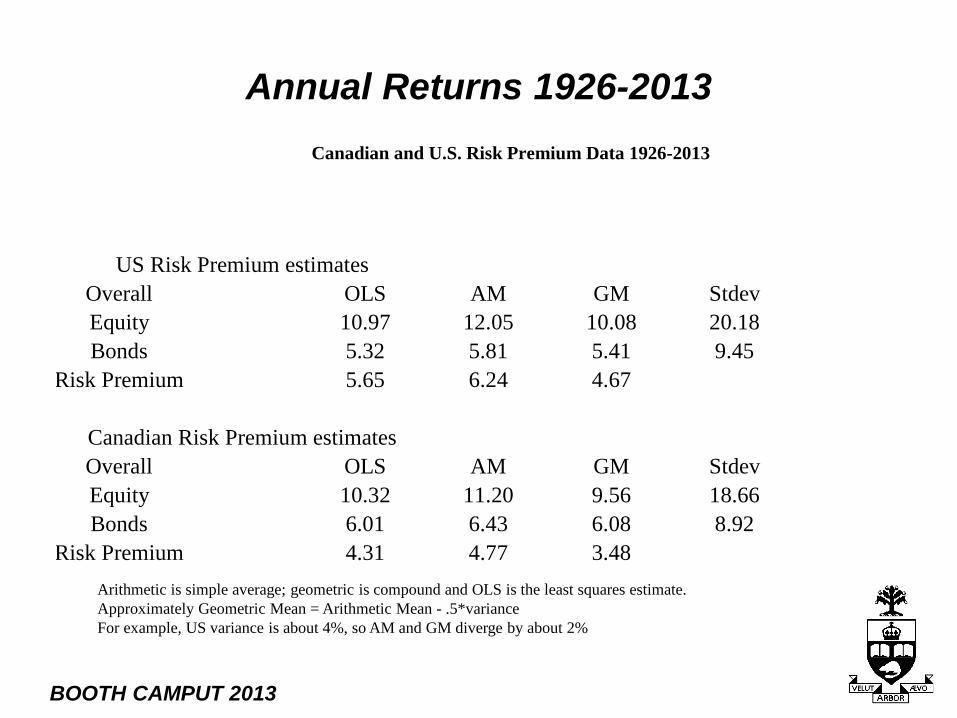
Annual Returns 1926-2013
Arithmetic is simple average; geometric is compound and OLS is the least squares estimate. Approximately Geometric Mean = Arithmetic Mean - .5*variance For example, US variance is about 4%, so AM and GM diverge by about 2%
Canadian and U.S. Risk Premium Data 1926-2013
US Risk Premium estimatesOverall OLS AM GM StdevEquity 10.97 12.05 10.08 20.18Bonds 5.32 5.81 5.41 9.45
Risk Premium 5.65 6.24 4.67
Canadian Risk Premium estimatesOverall OLS AM GM StdevEquity 10.32 11.20 9.56 18.66Bonds 6.01 6.43 6.08 8.92
Risk Premium 4.31 4.77 3.48
BOOTH CAMPUT 2013
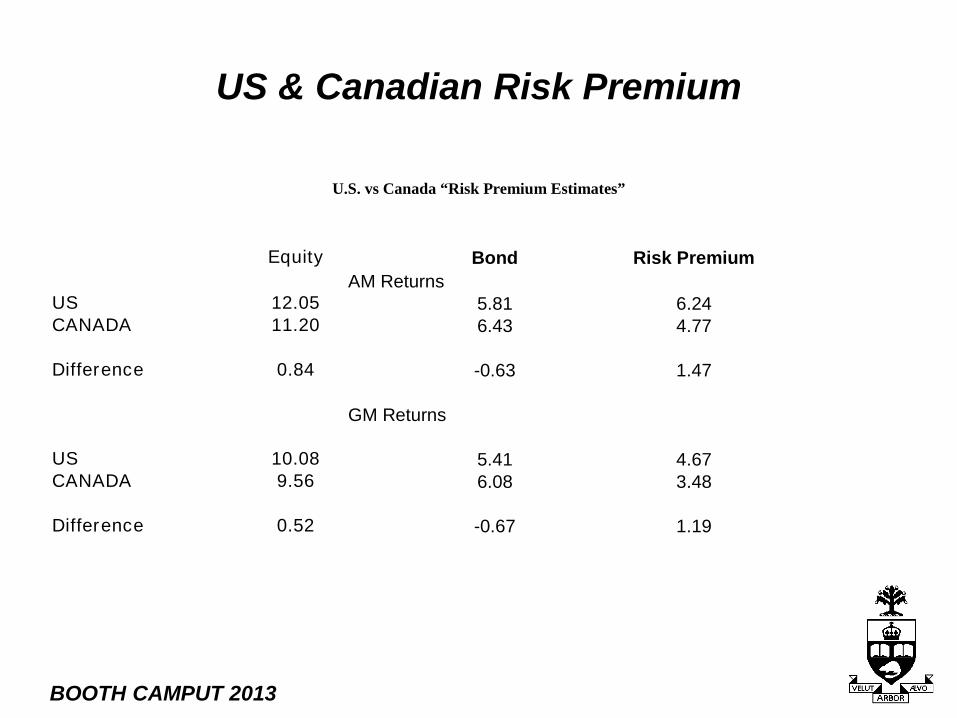
US & Canadian Risk Premium
U.S. vs Canada “Risk Premium Estimates”
Equity Bond Risk PremiumAM Returns
US 12.05 5.81 6.24CANADA 11.20 6.43 4.77
Difference 0.84 -0.63 1.47
GM Returns
US 10.08 5.41 4.67CANADA 9.56 6.08 3.48
Difference 0.52 -0.67 1.19
BOOTH CAMPUT 2013
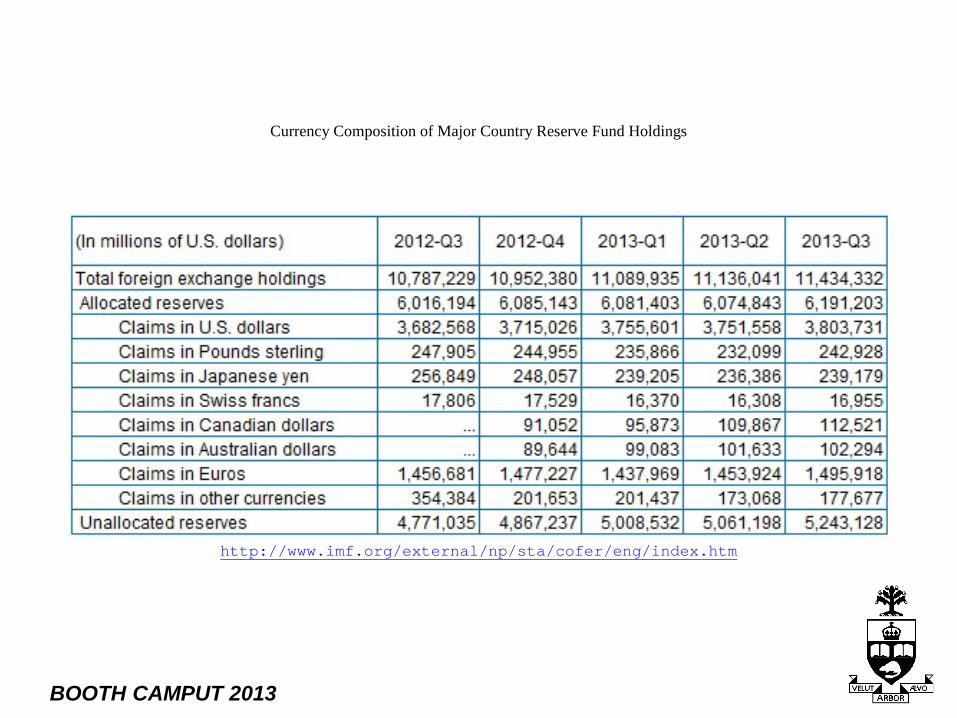
Currency Composition of Major Country Reserve Fund Holdings
http://www.imf.org/external/np/sta/cofer/eng/index.htm
BOOTH CAMPUT 2013
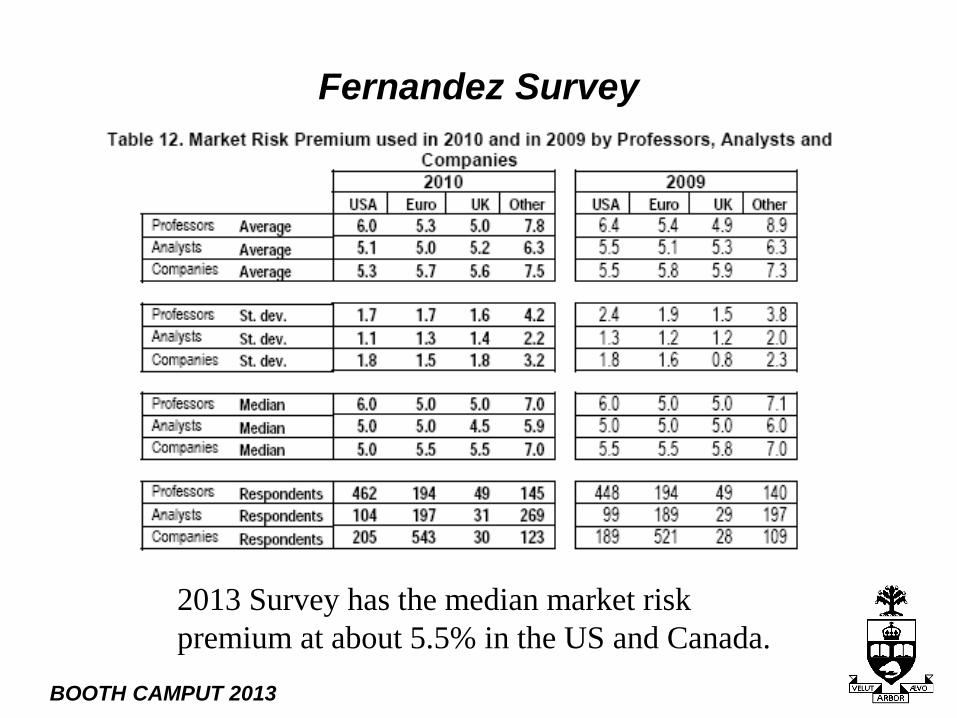
Fernandez Survey
2013 Survey has the median market risk premium at about 5.5% in the US and Canada.
BOOTH CAMPUT 2013
Utility Business Risk
• Short run • Ability to earn the allowed ROE • Return on capital
• Long run
• Stranded asset risk • Return of capital • “I want my money back!” (Greece and
PIIGS)
BOOTH CAMPUT 2013
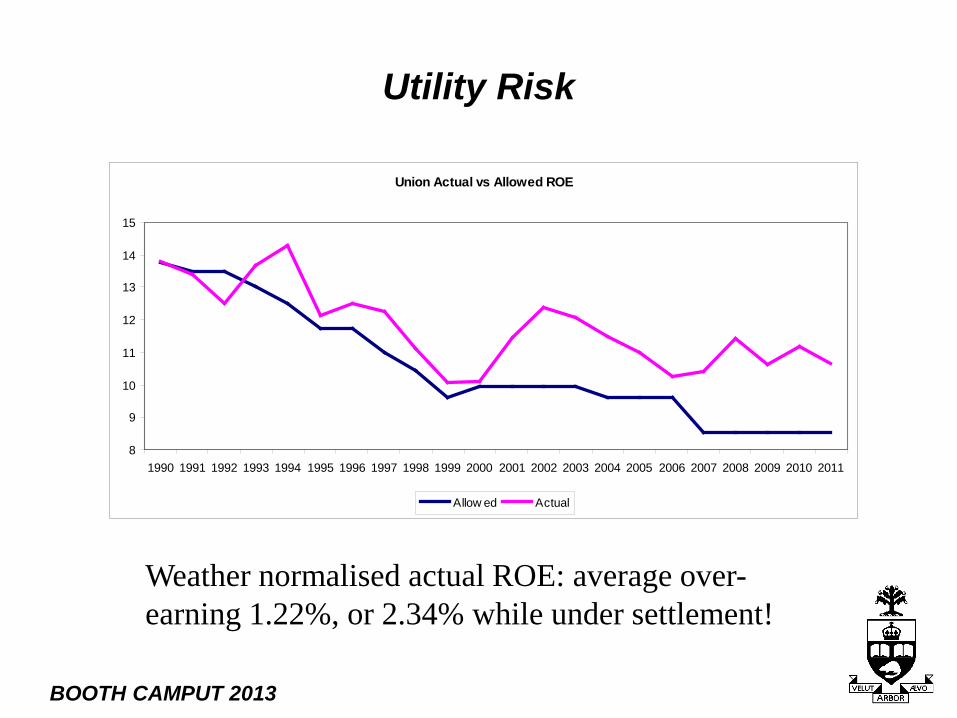
Utility Risk
Union Actual vs Allowed ROE
8
9
10
11
12
13
14
15
1990 1991 1992 1993 1994 1995 1996 1997 1998 1999 2000 2001 2002 2003 2004 2005 2006 2007 2008 2009 2010 2011
Allow ed Actual
Weather normalised actual ROE: average over-earning 1.22%, or 2.34% while under settlement!
BOOTH CAMPUT 2013
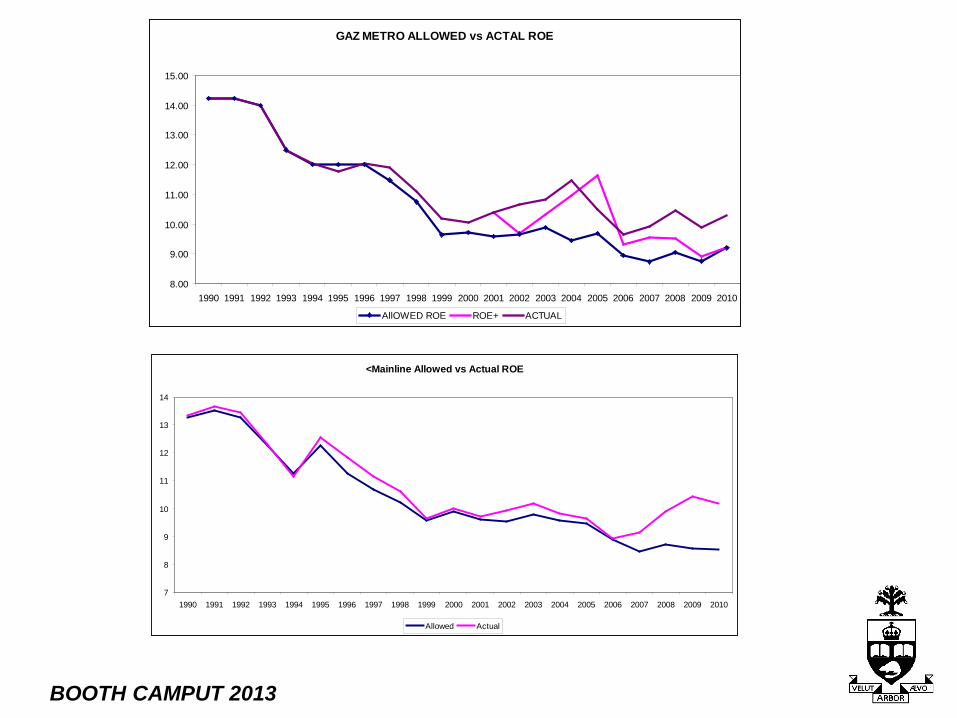
GAZ METRO ALLOWED vs ACTAL ROE
8.00
9.00
10.00
11.00
12.00
13.00
14.00
15.00
1990 1991 1992 1993 1994 1995 1996 1997 1998 1999 2000 2001 2002 2003 2004 2005 2006 2007 2008 2009 2010
AllOWED ROE ROE+ ACTUAL
<Mainline Allowed vs Actual ROE
7
8
9
10
11
12
13
14
1990 1991 1992 1993 1994 1995 1996 1997 1998 1999 2000 2001 2002 2003 2004 2005 2006 2007 2008 2009 2010
Allowed Actual
BOOTH CAMPUT 2013
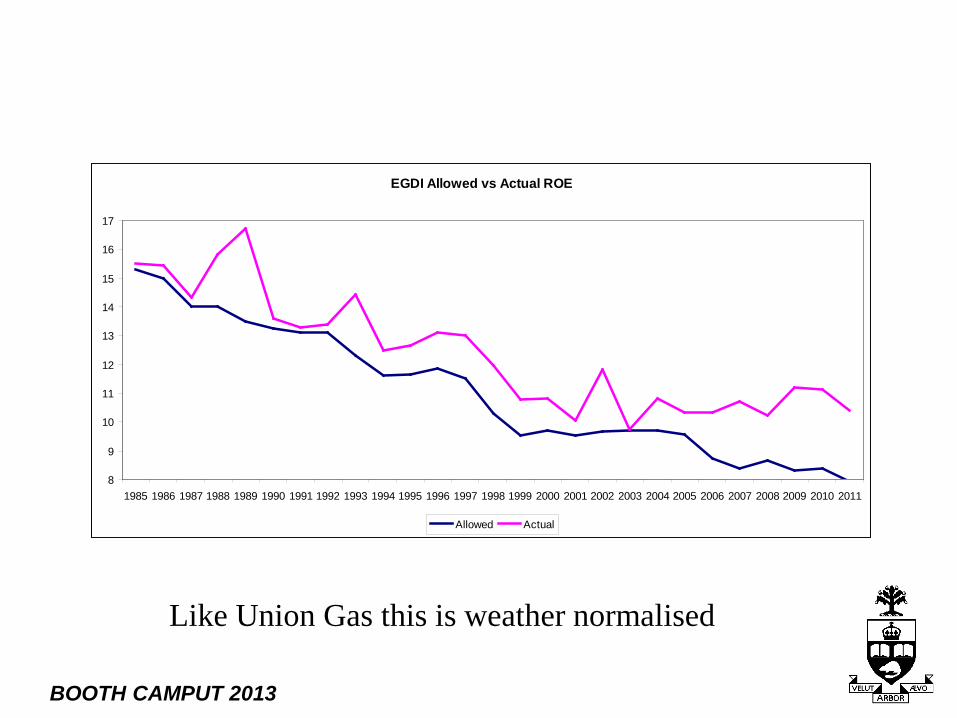
EGDI Allowed vs Actual ROE
8
9
10
11
12
13
14
15
16
17
1985 1986 1987 1988 1989 1990 1991 1992 1993 1994 1995 1996 1997 1998 1999 2000 2001 2002 2003 2004 2005 2006 2007 2008 2009 2010 2011
Allowed Actual
Like Union Gas this is weather normalised
BOOTH CAMPUT 2013
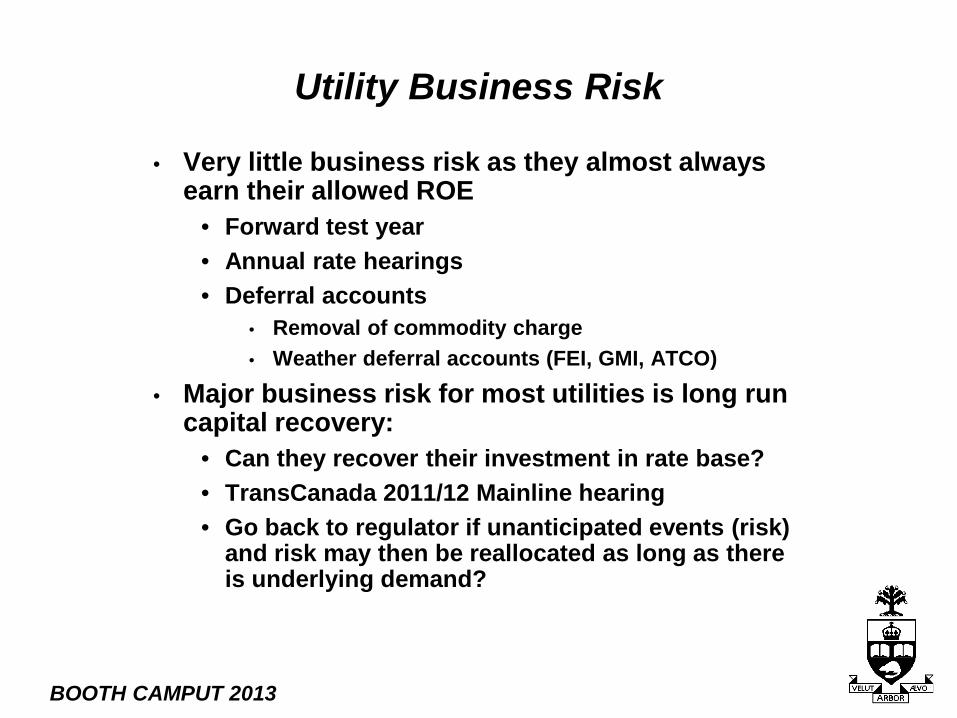
Utility Business Risk
• Very little business risk as they almost always earn their allowed ROE
• Forward test year • Annual rate hearings • Deferral accounts
• Removal of commodity charge • Weather deferral accounts (FEI, GMI, ATCO)
• Major business risk for most utilities is long run capital recovery:
• Can they recover their investment in rate base? • TransCanada 2011/12 Mainline hearing • Go back to regulator if unanticipated events (risk)
and risk may then be reallocated as long as there is underlying demand?
BOOTH CAMPUT 2013
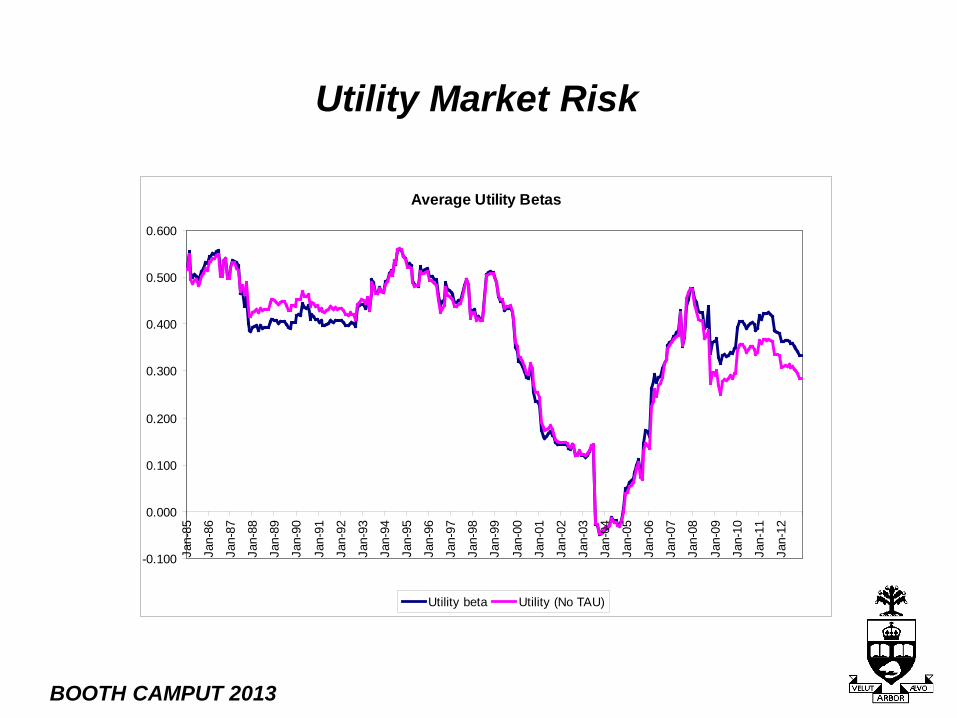
Utility Market Risk
Average Utility Betas
-0.100
0.000
0.100
0.200
0.300
0.400
0.500
0.600
Jan-
85
Jan-
86
Jan-
87
Jan-
88
Jan-
89
Jan-
90
Jan-
91
Jan-
92
Jan-
93
Jan-
94
Jan-
95
Jan-
96
Jan-
97
Jan-
98
Jan-
99
Jan-
00
Jan-
01
Jan-
02
Jan-
03
Jan-
04
Jan-
05
Jan-
06
Jan-
07
Jan-
08
Jan-
09
Jan-
10
Jan-
11
Jan-
12
Utility beta Utility (No TAU)
BOOTH CAMPUT 2013
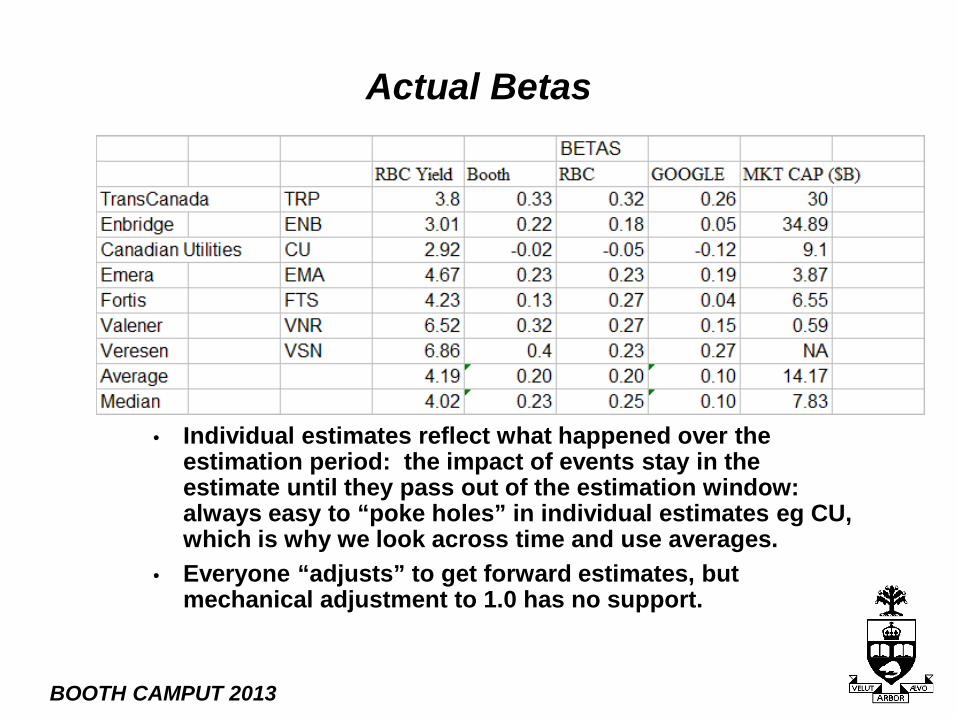
Actual Betas
• Individual estimates reflect what happened over the estimation period: the impact of events stay in the estimate until they pass out of the estimation window: always easy to “poke holes” in individual estimates eg CU, which is why we look across time and use averages.
• Everyone “adjusts” to get forward estimates, but mechanical adjustment to 1.0 has no support.
BOOTH CAMPUT 2013
Summary on CAPM Fair ROE
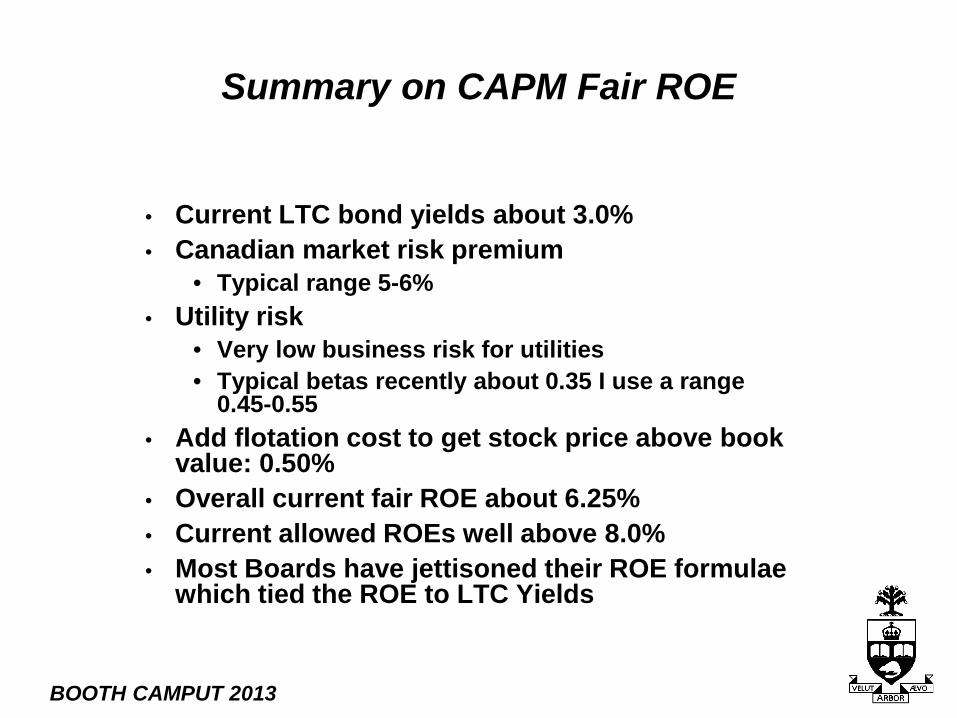
• Current LTC bond yields about 3.0% • Canadian market risk premium
• Typical range 5-6% • Utility risk
• Very low business risk for utilities • Typical betas recently about 0.35 I use a range
0.45-0.55 • Add flotation cost to get stock price above book
value: 0.50% • Overall current fair ROE about 6.25% • Current allowed ROEs well above 8.0% • Most Boards have jettisoned their ROE formulae
which tied the ROE to LTC Yields
BOOTH CAMPUT 2013
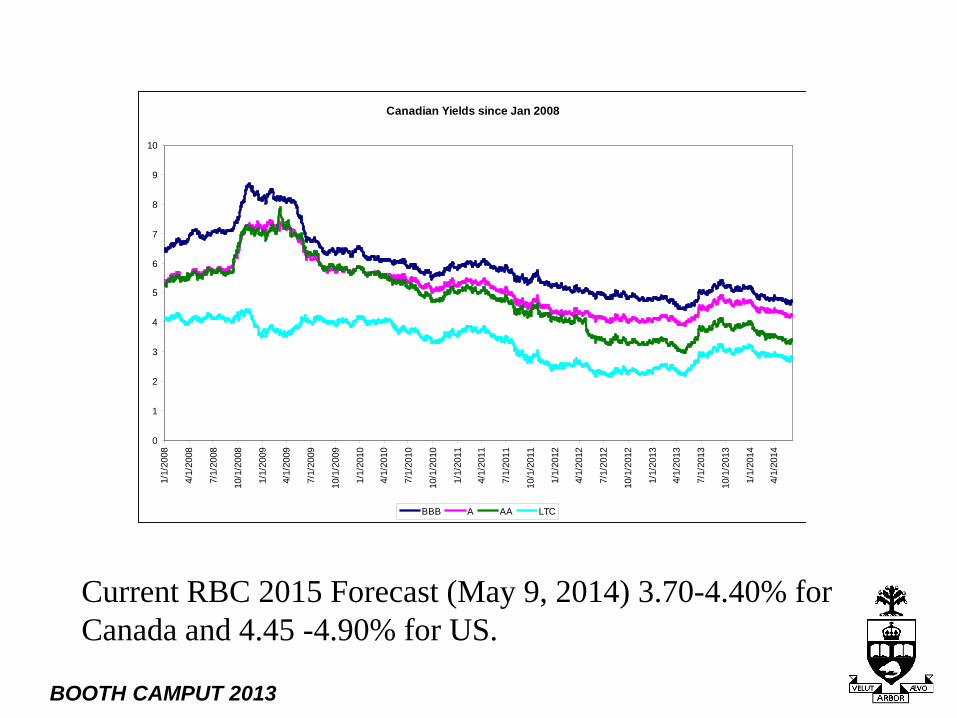
Current RBC 2015 Forecast (May 9, 2014) 3.70-4.40% for Canada and 4.45 -4.90% for US.
Canadian Yields since Jan 2008
0
1
2
3
4
5
6
7
8
9
10
1/1/
2008
4/1/
2008
7/1/
2008
10/1
/200
8
1/1/
2009
4/1/
2009
7/1/
2009
10/1
/200
9
1/1/
2010
4/1/
2010
7/1/
2010
10/1
/201
0
1/1/
2011
4/1/
2011
7/1/
2011
10/1
/201
1
1/1/
2012
4/1/
2012
7/1/
2012
10/1
/201
2
1/1/
2013
4/1/
2013
7/1/
2013
10/1
/201
3
1/1/
2014
4/1/
2014
BBB A AA LTC
BOOTH CAMPUT 2013
Discounted Cash Flow (DCF)
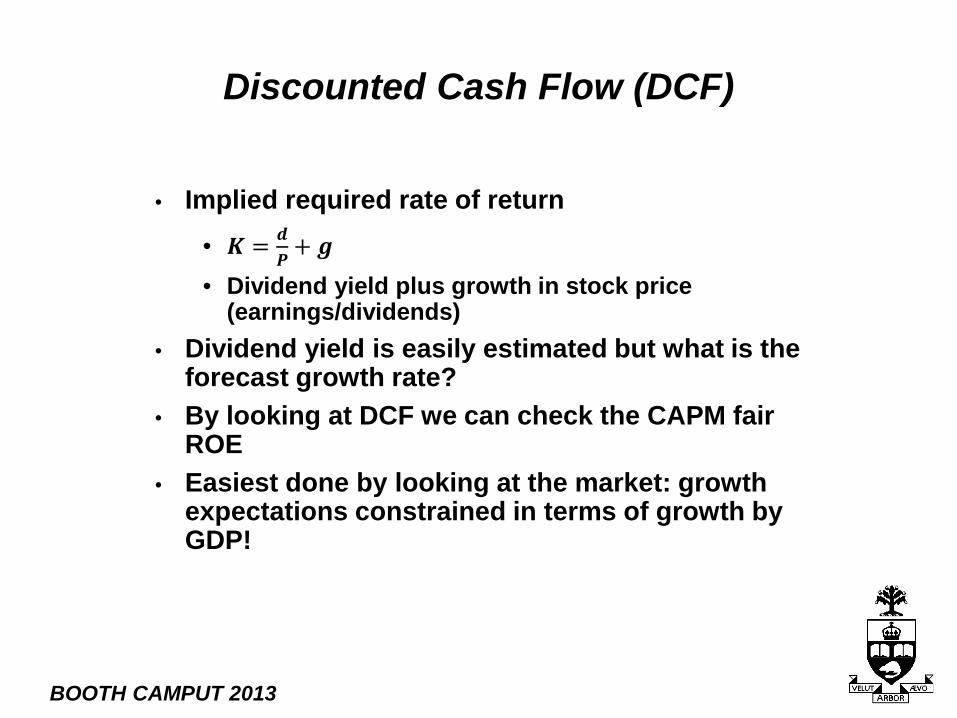
• Implied required rate of return • 𝑲 = 𝒅
𝑷+ 𝒈
• Dividend yield plus growth in stock price (earnings/dividends)
• Dividend yield is easily estimated but what is the forecast growth rate?
• By looking at DCF we can check the CAPM fair ROE
• Easiest done by looking at the market: growth expectations constrained in terms of growth by GDP!
BOOTH CAMPUT 2013
DCF Checks
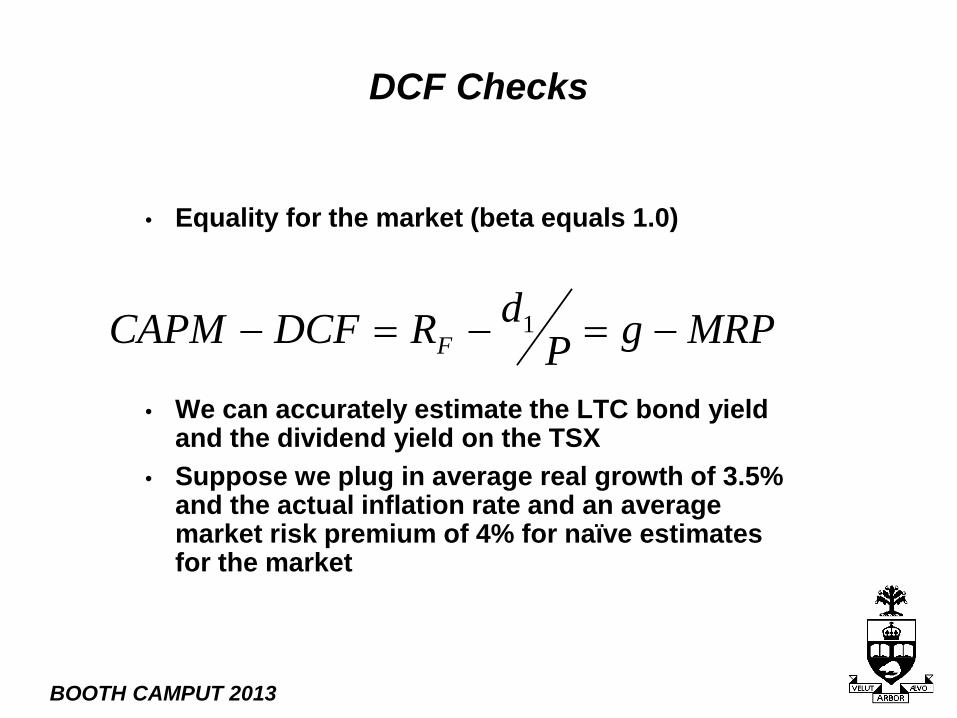
• Equality for the market (beta equals 1.0)
• We can accurately estimate the LTC bond yield and the dividend yield on the TSX
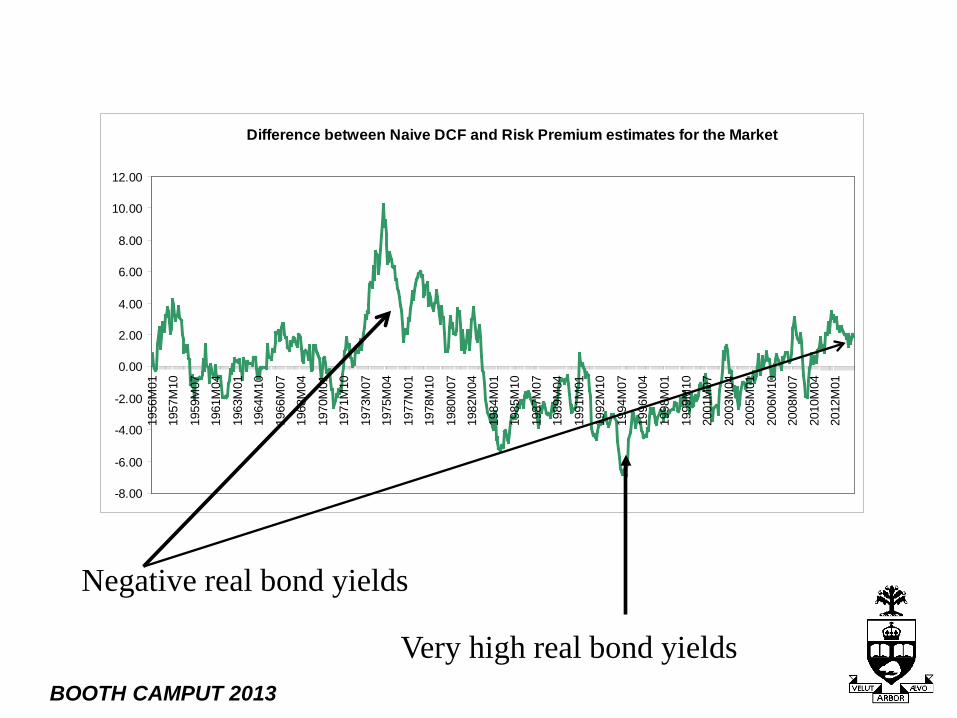
• Suppose we plug in average real growth of 3.5% and the actual inflation rate and an average market risk premium of 4% for naïve estimates for the market
MRPgPdRDCFCAPM F −=−=− 1
BOOTH CAMPUT 2013
Negative real bond yields
Very high real bond yields
Difference between Naive DCF and Risk Premium estimates for the Market
-8.00
-6.00
-4.00
-2.00
0.00
2.00
4.00
6.00
8.00
10.00
12.00
1956
M01
1957
M10
1959
M07
1961
M04
1963
M01
1964
M10
1966
M07
1968
M04
1970
M01
1971
M10
1973
M07
1975
M04
1977
M01
1978
M10
1980
M07
1982
M04
1984
M01
1985
M10
1987
M07
1989
M04
1991
M01
1992
M10
1994
M07
1996
M04
1998
M01
1999
M10
2001
M07
2003
M04
2005
M01
2006
M10
2008
M07
2010
M04
2012
M01
BOOTH CAMPUT 2013
Insights
• DCF estimates exceed risk premium estimates during high inflation periods or low real bond yield periods
• CAPM estimates exceed DCF estimates during high real bond yield periods
• Current LTC yields of 3.0% have increased by 0.50% over the past year, but with expected inflation of 2% are not a good investment for a taxable investor: built in loss of money.
• CAPM may under-estimate fair ROE if you use current forecast LTC yields, but not as bad as a year ago
BOOTH CAMPUT 2013
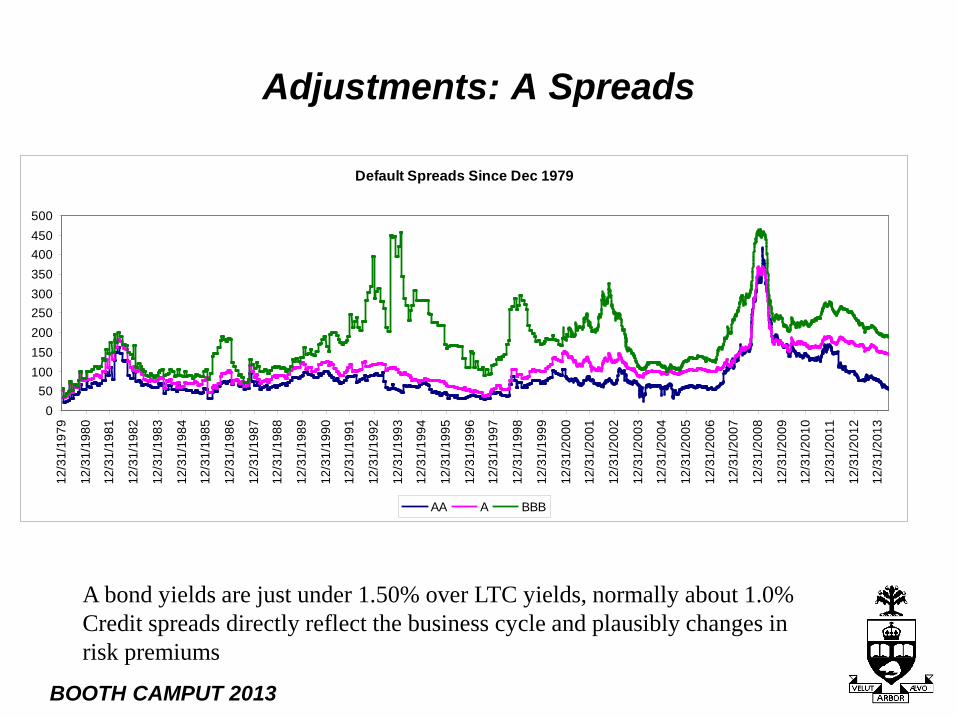
Adjustments: A Spreads
A bond yields are just under 1.50% over LTC yields, normally about 1.0% Credit spreads directly reflect the business cycle and plausibly changes in risk premiums
Default Spreads Since Dec 1979
050
100150200250300350400450500
12/3
1/19
79
12/3
1/19
80
12/3
1/19
81
12/3
1/19
82
12/3
1/19
83
12/3
1/19
84
12/3
1/19
85
12/3
1/19
86
12/3
1/19
87
12/3
1/19
88
12/3
1/19
89
12/3
1/19
90
12/3
1/19
91
12/3
1/19
92
12/3
1/19
93
12/3
1/19
94
12/3
1/19
95
12/3
1/19
96
12/3
1/19
97
12/3
1/19
98
12/3
1/19
99
12/3
1/20
00
12/3
1/20
01
12/3
1/20
02
12/3
1/20
03
12/3
1/20
04
12/3
1/20
05
12/3
1/20
06
12/3
1/20
07
12/3
1/20
08
12/3
1/20
09
12/3
1/20
10
12/3
1/20
11
12/3
1/20
12
12/3
1/20
13
AA A BBB
BOOTH CAMPUT 2013
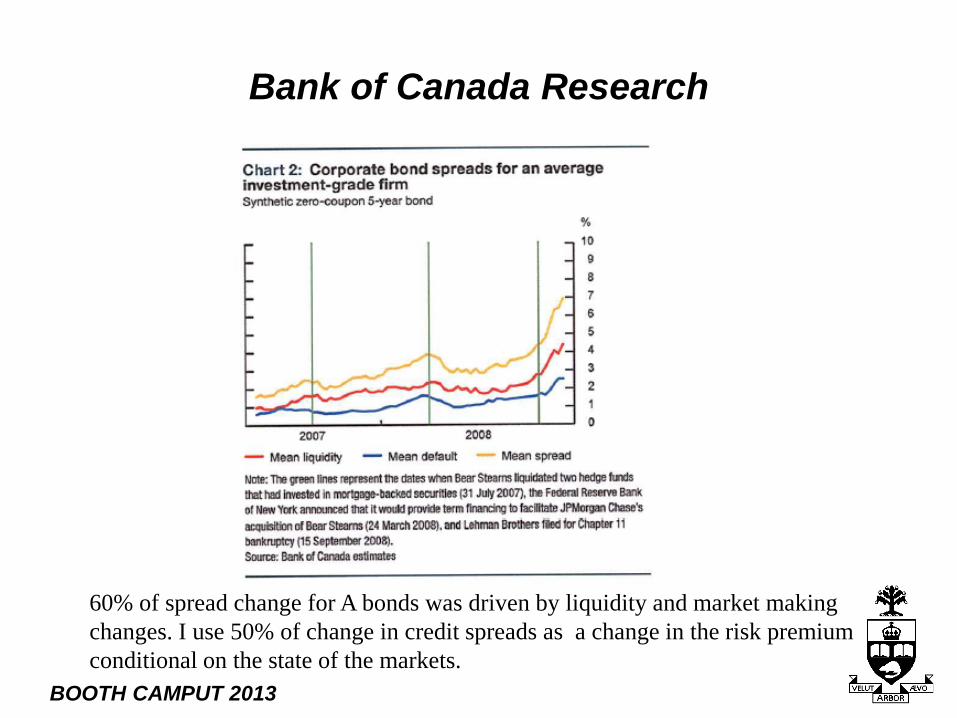
Bank of Canada Research
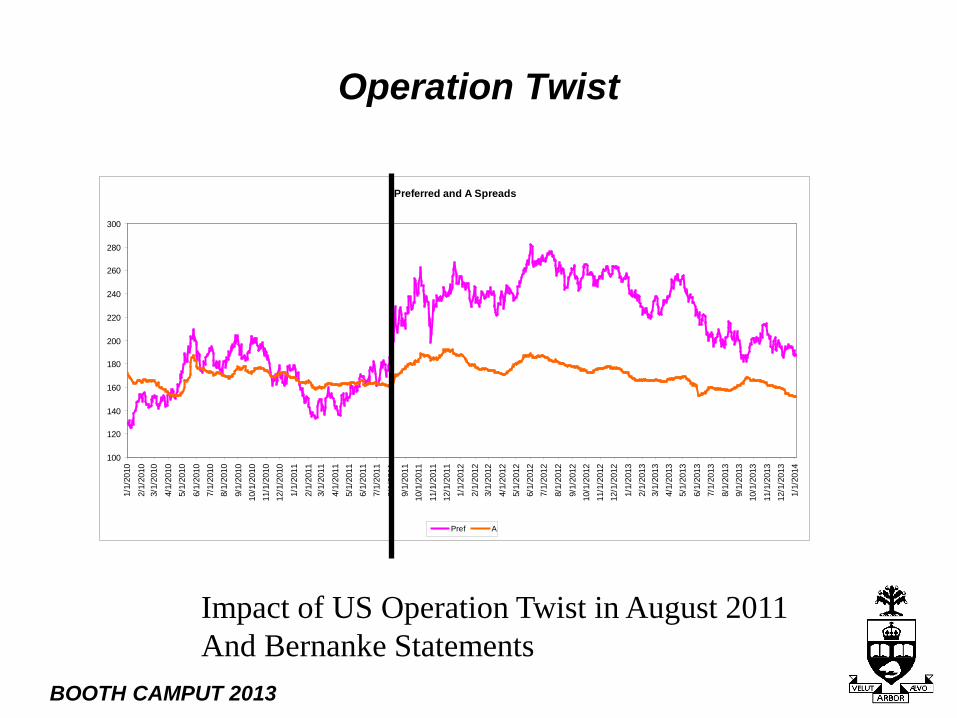
60% of spread change for A bonds was driven by liquidity and market making changes. I use 50% of change in credit spreads as a change in the risk premium conditional on the state of the markets.
BOOTH CAMPUT 2013
Impact of US Operation Twist in August 2011 And Bernanke Statements
Operation Twist
Preferred and A Spreads
100
120
140
160
180
200
220
240
260
280
300
1/1/
2010
2/1/
2010
3/1/
2010
4/1/
2010
5/1/
2010
6/1/
2010
7/1/
2010
8/1/
2010
9/1/
2010
10/1
/201
011
/1/2
010
12/1
/201
0
1/1/
2011
2/1/
2011
3/1/
2011
4/1/
2011
5/1/
2011
6/1/
2011
7/1/
2011
8/1/
2011
9/1/
2011
10/1
/201
1
11/1
/201
112
/1/2
011
1/1/
2012
2/1/
2012
3/1/
2012
4/1/
2012
5/1/
2012
6/1/
2012
7/1/
2012
8/1/
2012
9/1/
2012
10/1
/201
211
/1/2
012
12/1
/201
2
1/1/
2013
2/1/
2013
3/1/
2013
4/1/
2013
5/1/
2013
6/1/
2013
7/1/
2013
8/1/
2013
9/1/
2013
10/1
/201
3
11/1
/201
312
/1/2
013
1/1/
2014
Pref A
BOOTH CAMPUT 2013
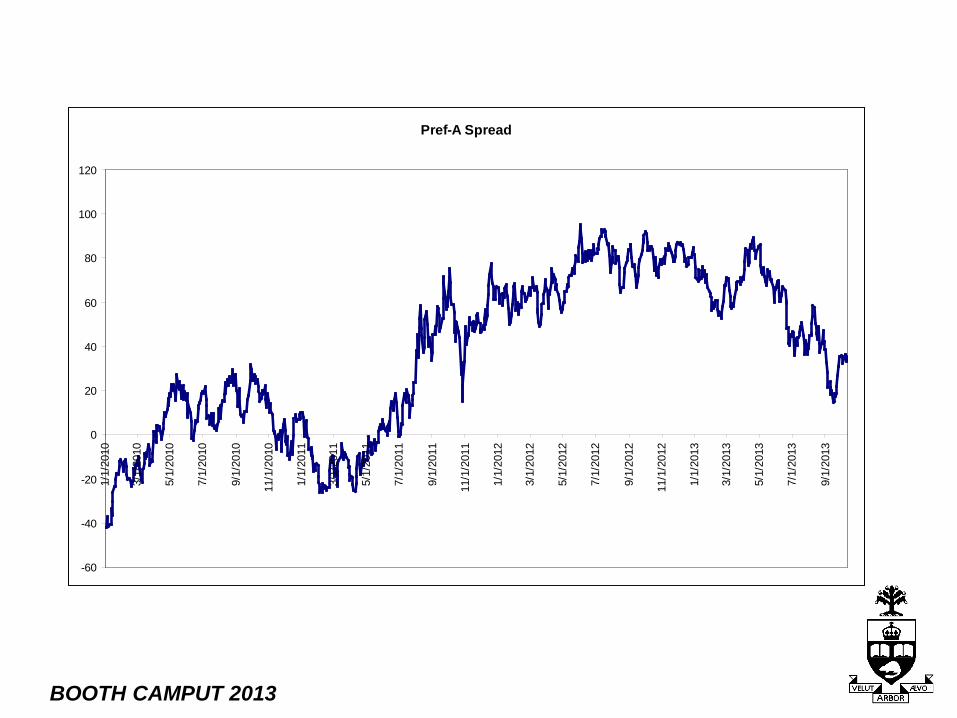
Pref-A Spread
-60
-40
-20
0
20
40
60
80
100
120
1/1/
2010
3/1/
2010
5/1/
2010
7/1/
2010
9/1/
2010
11/1
/201
0
1/1/
2011
3/1/
2011
5/1/
2011
7/1/
2011
9/1/
2011
11/1
/201
1
1/1/
2012
3/1/
2012
5/1/
2012
7/1/
2012
9/1/
2012
11/1
/201
2
1/1/
2013
3/1/
2013
5/1/
2013
7/1/
2013
9/1/
2013
BOOTH CAMPUT 2013
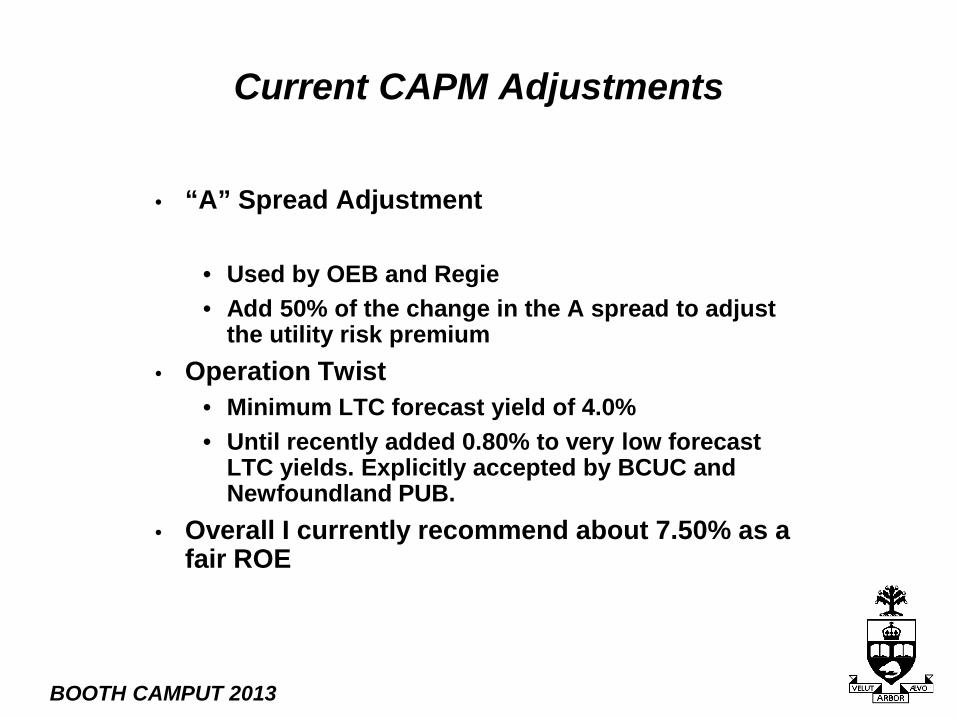
Current CAPM Adjustments
• “A” Spread Adjustment
• Used by OEB and Regie • Add 50% of the change in the A spread to adjust
the utility risk premium • Operation Twist
• Minimum LTC forecast yield of 4.0% • Until recently added 0.80% to very low forecast
LTC yields. Explicitly accepted by BCUC and Newfoundland PUB.
• Overall I currently recommend about 7.50% as a fair ROE
BOOTH CAMPUT 2013
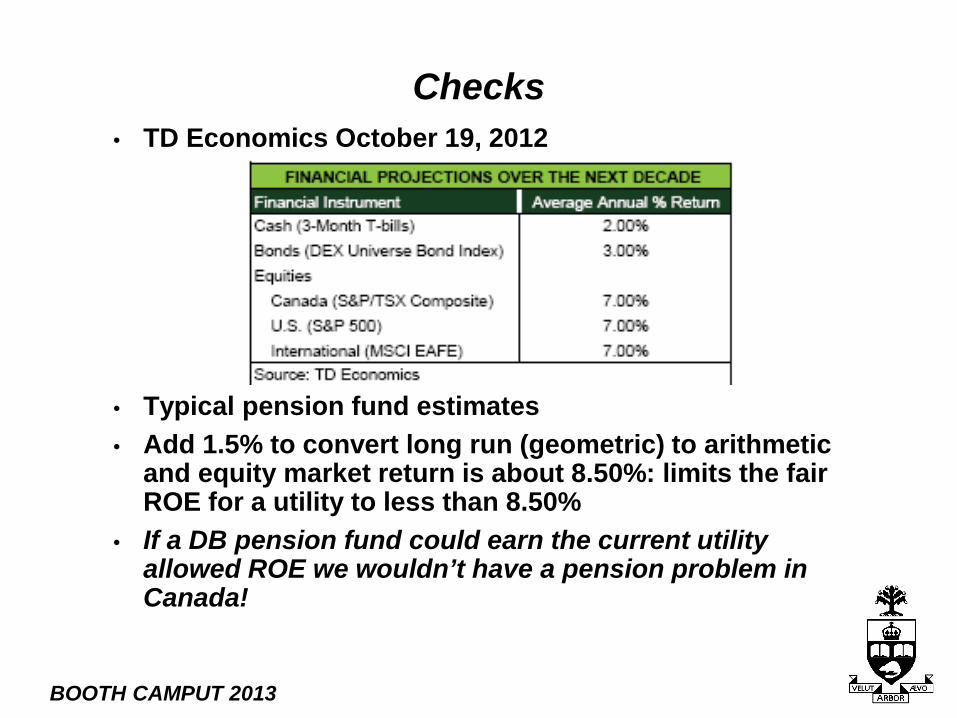
Checks • TD Economics October 19, 2012
• Typical pension fund estimates • Add 1.5% to convert long run (geometric) to arithmetic
and equity market return is about 8.50%: limits the fair ROE for a utility to less than 8.50%
• If a DB pension fund could earn the current utility allowed ROE we wouldn’t have a pension problem in Canada!

BOOTH CAMPUT 2013
“The most the owners in aggregate can earn between now and judgment day is what their businesses in aggregate earn.(italics in original) True by buying and selling that is clever or lucky, investor A may take more than his share of the pie at the expense of investor B. And yes, all investors feel richer when stocks soar. But an owner can exit only by having someone take his place. If one investor sells high, another must buy high. For owners as a whole, there is simply no magic - no shower of money from outer space – that will enable them to extract wealth from their companies beyond that created by the companies themselves.” Warren Buffet
BOOTH CAMPUT 2013
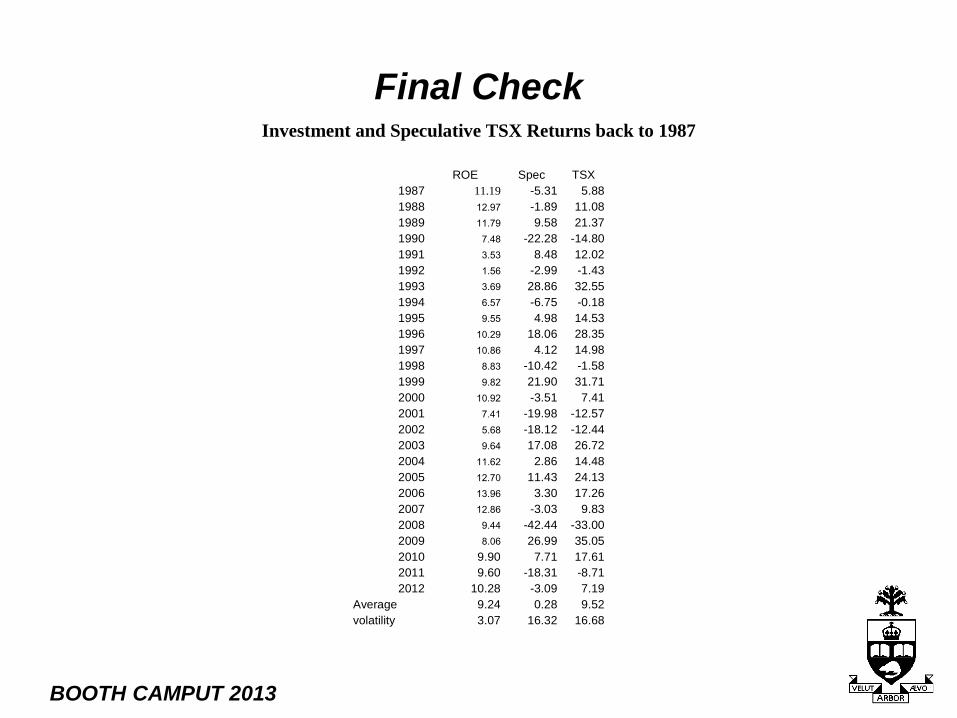
Final Check Investment and Speculative TSX Returns back to 1987
ROE Spec TSX1987 11.19 -5.31 5.881988 12.97 -1.89 11.081989 11.79 9.58 21.371990 7.48 -22.28 -14.801991 3.53 8.48 12.021992 1.56 -2.99 -1.431993 3.69 28.86 32.551994 6.57 -6.75 -0.181995 9.55 4.98 14.531996 10.29 18.06 28.351997 10.86 4.12 14.981998 8.83 -10.42 -1.581999 9.82 21.90 31.712000 10.92 -3.51 7.412001 7.41 -19.98 -12.572002 5.68 -18.12 -12.442003 9.64 17.08 26.722004 11.62 2.86 14.482005 12.70 11.43 24.132006 13.96 3.30 17.262007 12.86 -3.03 9.832008 9.44 -42.44 -33.002009 8.06 26.99 35.052010 9.90 7.71 17.612011 9.60 -18.31 -8.712012 10.28 -3.09 7.19
Average 9.24 0.28 9.52volatility 3.07 16.32 16.68
BOOTH CAMPUT 2013
Conclusions • Can not mechanically do much in finance
• Markets constantly changing • I have been accused of using judgment!
• Three iron laws of finance • Time value of money • Risk value of money • Tax value of money
• Business cycle effects on spreads and betas • Impact of US government in bond market
• Bond market currently not a market “opportunity cost” • Long rates being set by the global policy maker (RBC) • Stock market as a whole to earn 9-10%.