
Nutrition, physiological capital and economic growth
32
Health, Health, Health, Health, Health, Human Capital Human Capital Human Capital Human Capital Human Capital and Economic Growth Economic Growth Economic Growth Economic Growth Economic Growth k 0 dk/dt k t sk α t k* 0 (δ+g*+η)k t (δ+g 0 +η)k t . g* vH g H r (A) H* 0 (G) . . L Nutrition, Ph Nutrition, Ph Nutrition, Ph Nutrition, Ph Nutrition, Physiological ysiological ysiological ysiological ysiological Capital, and Economic Capital, and Economic Capital, and Economic Capital, and Economic Capital, and Economic Gr Gr Gr Gr Growth wth wth wth wth R R R ober ober ober ober ober t t t t t W W W . F . F . F . F . F og og og og og el el el el el Pr Pr Pr Pr Prog og og og ogram on Pub ram on Pub ram on Pub ram on Pub ram on Public P lic P lic P lic P lic Polic olic olic olic olicy and Health y and Health y and Health y and Health y and Health Di Di Di Di Division of vision of vision of vision of vision of Health and Human De Health and Human De Health and Human De Health and Human De Health and Human Development elopment elopment elopment elopment Pan American Health Organization R R R e e e gional Of gional Of gional Of gional Of gional Of f f f ice of ice of ice of ice of ice of the the the the the World Health Organization http://www.paho.org/English/HDP/HDD/fogel.pdf
-
Upload
alejandro-martinez-espinosa -
Category
Documents
-
view
251 -
download
0
description
El texto fue preparado para el seminario "Health, Human Capital and Economic Growth: Theory, Evidence and Policies" PAHO, 2002.
Transcript of Nutrition, physiological capital and economic growth
Health,Health,Health,Health,Health,Human CapitalHuman CapitalHuman CapitalHuman CapitalHuman Capital
andEconomic GrowthEconomic GrowthEconomic GrowthEconomic GrowthEconomic Growth
k0
dk/dt
kt
skαt
k*0
(δ+g*+η)kt
(δ+g0+η)kt.
g*
vH
g
Hr
(A)
H*0
(G)
..
L
Nutrition, PhNutrition, PhNutrition, PhNutrition, PhNutrition, PhysiologicalysiologicalysiologicalysiologicalysiologicalCapital, and EconomicCapital, and EconomicCapital, and EconomicCapital, and EconomicCapital, and EconomicGrGrGrGrGrooooowthwthwthwthwth
RRRRRoberoberoberoberobert t t t t WWWWW. F. F. F. F. Fogogogogogelelelelel
PrPrPrPrProgogogogogram on Pubram on Pubram on Pubram on Pubram on Public Plic Plic Plic Plic Policolicolicolicolicy and Healthy and Healthy and Healthy and Healthy and HealthDiDiDiDiDivision ofvision ofvision ofvision ofvision of Health and Human De Health and Human De Health and Human De Health and Human De Health and Human Devvvvvelopmentelopmentelopmentelopmentelopment
Pan American Health OrganizationRRRRReeeeegional Ofgional Ofgional Ofgional Ofgional Offffffice ofice ofice ofice ofice of the the the the the
World Health Organization
http://www.paho.org/English/HDP/HDD/fogel.pdf
Nutrition, Physiological Capital, and Economic Growth
By
Robert W. Fogel University of Chicago
The Graduate School of Business and National Bureau of Economic Research
A lecture prepared for presentation at the Senior Policy Seminar on Health, Human Capital and Economic
Growth: Theory, Evidence and Policies
of the
Pan American Health Organization (PAHO)
and Inter-American Development Bank (IADB)
PAHO Headquarters
Washington, DC October 3, 2002
©2002 Copyright Robert W. Fogel Not to be reproduced, quoted or cited without the permission of the author
Program on Public Policy and Health
Health and Human Development Division Pan American Health Organization
Washington, DC
Paper prepared for the Pan American Health Organization, under Contract CSA No. CSA-01-175 and PO 01/25223. July 2001.
1
Nutrition, Physiological Capital, and Economic Growth
If the impact of nutrition on long-term economic growth has not yet been recognized
adequately by the economics profession, it is due not to some sort of professional myopia but to the
complexity of the issue. Economics has had to await the clarification of a large number of issues in
biomedical sciences, including important recent developments in such fields as nutrition, the biology
of human growth, physiology, epidemiology, and molecular biology.
The obstacles to an accurate assessment of the impact of nutrition on economic growth are
revealed by considering the long debate over the extent of chronic malnutrition. This debate, which
began shortly after the close of World War II, has gone through several phases, and the points at
issue have shifted, but the debate has continued with undiminished intensity. The debate has been
largely between investigators associated with the FAO, WHO, and the World Bank (FAWOB) on
the one hand and critics who believe that their estimates of the extent of malnutrition are too high.
Few investigators have suggested that the FAWOB estimates are too low. One reason for
the neglect of this possibility is the tendency of investigators to explicitly or implicitly assume that
affluent persons in affluent countries reached genetic potential during the middle decades of the
twentieth century and that no further improvements in physiology were possible without some major
genetic breakthrough. That proposition, which was widely accepted in biomedical circles during the
1970s, has recently come under scrutiny by investigators concerned with problems of aging. The
question of whether there is an upper limit to life in the neighborhood of 85 ± 7 years has been
central to many recent aging studies. Some investigators have linked measures of biomedical and
socioeconomic stress early in life to the odds of getting specific chronic diseases or of dying from
2
specific causes at middle and late ages. Other studies have used animal models to demonstrate that
the age-specific mortality can be improved by changing environmental conditions, with life
expectation increased twofold. Still other studies have shown that age-specific mortality rates of
individuals at very late ages have been declining continuously for half a century in some 15 nations
for which reliable data are available.
Collectively, these studies do not rule out genetic factors but suggest something much less
rigid than genetic programming of absolute life spans. An emerging theory combines genetic
susceptibility of various organs with cumulative insults as a result of exposure to risk. One
important implication of this line of work is that a synergism between technological and
physiological improvements has produced a form of human evolution that is biological but not
genetic, rapid, culturally transmitted, and not necessarily stable. Dora Costa and I call this process,
which still is ongoing in both rich and developing nations, "technophysio evolution."
Unlike the genetic theory of evolution through natural selection, which applies to the whole
history of life on earth, technophysio evolution applies only to the last three hundred years of human
history, and particularly to the last century. Despite its limited scope, technophysio evolution
appears to be relevant to forecasting likely trends over the next century or so in longevity, the age of
onset of chronic diseases, body size, and the efficiency and durability of vital organ systems. The
theory also has implications for the measurement of the extent of chronic malnutrition in various
countries and for the measurement of long-term economic growth.
1. Changing Views of the Extent of Chronic Malnutrition and of the Methods of Measuring It.
Very little work was done on the measurement of chronic malnutrition prior to the end of
World War II. Nutritional science was still in its infancy during the early twentieth century. It was
3
not until the turn of the century that Wilbur O. Atwater and his collaborators estimated the energy
requirements of basal metabolism and developed the Atwater factors which established the energy
available per gram of protein, carbohydrates, and fat. Except for scurvy, specific nutrient
deficiencies were not discovered until after World War I: vitamin D for rickets in 1922; thiamine for
beriberi in 1933, and niacin for pellagra in 1937. It was not until 1943 that a committee set up by the
National Academy of Sciences issued the first recommended dietary allowances of essential
nutrients.
The attempt to measure the extent of malnutrition in various countries around the world was
first undertaken by the Food and Agriculture Organization of the United Nations (FAO) in 1946-47
and was repeated periodically thereafter. These surveys were based on the construction of food
balance sheets for many countries that made it possible to estimate the calories available for
consumption per capita. The information from food balance sheets was supplemented by household
dietary surveys based on reports of the food consumed by all the individuals in the household over
periods from one to several days. The food diaries generally revealed a substantially lower level of
food consumption than did the balance sheets. The validity of these methods of estimating the
consumption of food became central points of controversy.
Equally controversial were efforts to estimate average physiological requirements of food in
countries around the world. Equations were worked out relating the energy requirement for basal
metabolism to specific climatic conditions and to the height, weight, and surface areas of
individuals. In addition to estimating the energy required for basal metabolism, it was necessary to
estimate the minimal amount of energy required for maintenance as well as the specific amounts of
energy required for different tasks.
There was an important shift in the conception of nutritional diseases that began in the late
4
1950s and extended through the mid-1970s. Prior to that period the term “nutritional disease”
referred only to those caused by specific nutrient deficiencies, such as pellagra, rickets, and beriberi.
General undernutrition, so widespread in developing nations, was considered to be a normal, if
undesirable, characteristic of these societies. During the 1950s and 1960s physicians, nutritionists,
and epidemiologists began to define undernutrition as a disease called protein-energy malnutrition
(PEM). The term refers to a large number of syndromes apparent in the growth retardation of infants
and children caused by nutritional deficiencies. In the Ninth International Classification of Diseases
and in the publications of the World Health Organization (WHO), anthropometric indicators are
used to specify the degree of PEM.
Perhaps the most important development during this period was the discovery of a synergy
between infections and malnutrition. Scrimshaw et al. (1968) showed that while malnutrition makes
infections more severe, infections in turn increase the severity of malnutrition. Subsequent research
demonstrated the numerous pathways through which this synergism operates in utero, in infancy, in
childhood, and throughout the balance of the life cycle. Nutritional influences on the outcomes of
infections vary with the disease. Mechanisms through which malnutrition reduces resistance to
infection include reduced production of humoral antibodies, impaired cell-mediated immunity, and
weakened phagocytosis. Conversely, infections, regardless of the etiology of the infectious agent,
worsen nutritional status through increased metabolic loss of nutrients, reduced appetite, decreased
absorption, and the diversion of nutrients to combat the infection.
The transformation of undernutrition from a normal condition to a disease intensified the
criticisms of the FAWOB approach to chronic malnutrition. Three main lines of criticism emerged.
It was argued, first, that methods of constructing balance sheets grossly exaggerated the level of
nutrient consumption in rich countries (by underestimating losses in distribution and plate waste)
5
and underestimated the nutrients available in poor countries (by omitting nonstandard types of
foods). Second, the threshold of malnutrition was overestimated by a failure to take adequate
account of the extent to which undernourished individuals could successfully adapt to their situation.
A number of statistical criticisms were also raised with respect to methods used to establish the
caloric threshold of malnutrition as well as to the use of household diaries to relate the prevalence of
malnutrition to income levels.
The third line of criticism focused on the use of anthropometric measures to define PEM in
both children and adults. A cardinal aspect of this line of criticism was the use of the United States
and British growth standards as a basis for judging stunting and wasting among individuals in South
Asia and other regions in which malnutrition was prevalent. It was argued that even if Western
standards did not exaggerate the extent of stunting and wasting in Asia, the FAWOB analysis did not
address the costs of being small. The evidence showing that small individuals were more likely to
suffer illness was challenged as was the evidence on the nexus to the severity of illness. The claim
that large people were more productive than small ones was also contested. The counter
interpretation was summed up by the aphorism "small but healthy."
The Implications of Technophysio Evolution for the Assessment of Chronic Malnutrition and Economic Growth
A difficulty with the FAWOB approach to the measurement of chronic malnutrition is that
their standards are based on heights and weights derived either from British body builds of the early
1960s and 1970s or U.S. body builds of the early 1970s. Neither the British nor the U.S. claim that
their body builds are optimal. They claim only that they are representative of the actual distribution
of height, weight, and weight-for height at specific ages in their respective countries. In practice,
however, it has been assumed that the fiftieth centile of these distributions is normal.
Should the fiftieth centile of the British and American height distributions be accepted as the
6
standard for developing nations? Critics of FAWOB have called these standards too high. This line
of criticism has been strong among some analysts who have maintained that Indians are smaller than
the British and Americans for genetic reasons. However, a study of growth patterns of Indian
children revealed that the age-specific height and weight distributions of affluent Indian children
were quite similar to the distributions at corresponding ages obtained from the U.S. and Great
Britain (Agarwal et al. 1991).
That finding, important as it is, does not settle the issue. It merely confirms that the
environmental constraints on the growth of affluent Indians are similar to those prevailing in Britain.
The finding does not demonstrate that affluent Indian children are not stunted relative to their
genetic potential nor does the finding establish that the fiftieth centile of the British and American
height distributions is normal.
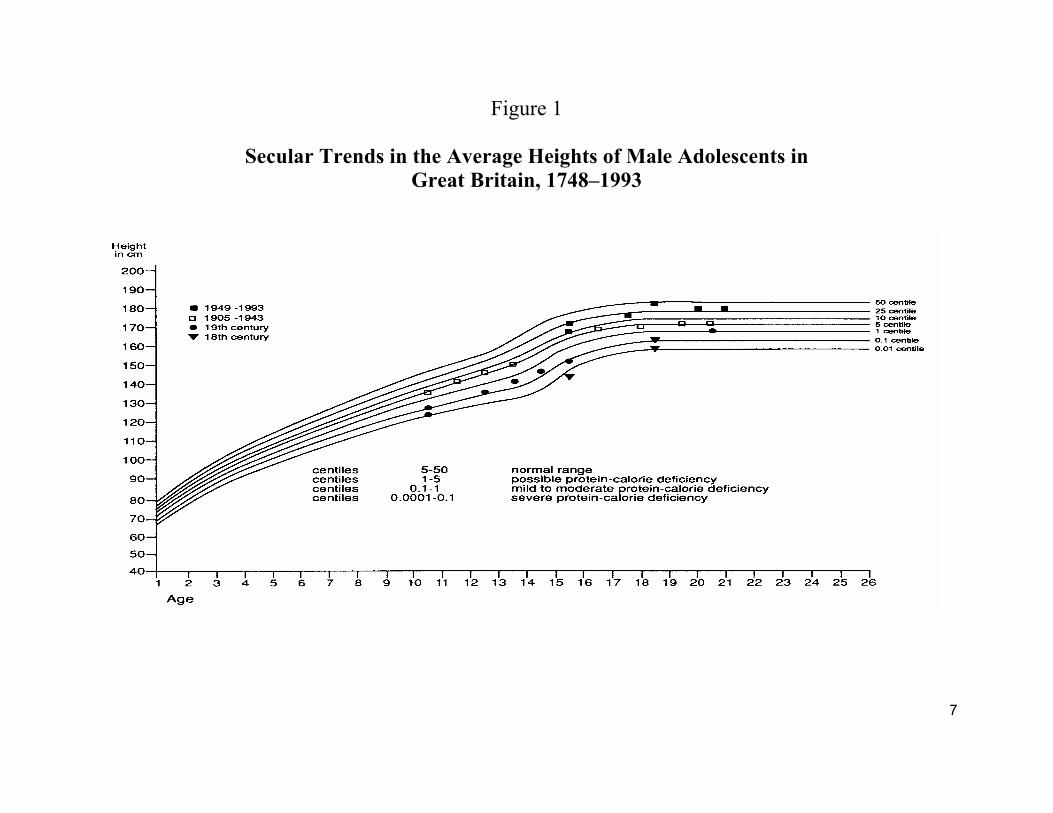
If human physiology was static there would be far less difficulty in establishing
anthropometric standards for measuring chronic malnutrition in poor nations. However, as is
illustrated by Figure 1, there have been enormous changes in British physiology over the past two
centuries. That figure presents the bottom half of current Dutch growth centiles. The average
heights of successive generations of male adolescents in Great Britain between 1748 and 1993 are
superimposed on that grid. It can be seen that as one generation succeeded another, the average
trajectory of adolescent growth moved up the grid. The upward movement was uneven. The largest
increase took place during the twentieth century.
7
Figure 1
Secular Trends in the Average Heights of Male Adolescents in Great Britain, 1748–1993
8
Obviously, a judgment of the severity of malnutrition in India today depends on which of the
height profiles shown in Figure 1 is chosen as the standard by which to judge the degree of Indian
malnutrition. Suppose we used, not the British height profiles of the 1960s as the standard for
judging the deficit in current Indian stature, but those of the 1920s or 1930s. The average stature of
British children in the 1920s and 1930s put them at the fifth centile of the Dutch standard today (see
Figure 1). The switch to the British standard of the 1930s would make Indian malnutrition seem less
severe because the nutritional status of British children 60 or 70 years ago was relatively poor by
current Dutch standards. Even British children of the early 1960s fall short of the current Dutch
standard by about a half a standard deviation.
I have used the Dutch standard to assess British stature because the Dutch are currently the
tallest population in the world, with males averaging about 181 cm at maturity, which is about 4 cm
greater than the stature of mature males in both Britain and the U. S. today. In 1860, however,
Dutch males were only 164 cm at maturity. British and American males were also shorter at
maturity in 1860 than they are today, but in 1860 the British were 4 cm taller than the Dutch while
the Americans were 8 cm taller than the Dutch. In other words, heights have grown substantially
over the past four generation in all three societies. But the Dutch have grown most rapidly, partly
because they were more stunted during the nineteenth century than were either the British or the
Americans.
Notice that a height of 164 cm at maturity would put the Dutch of 1860 below the first
percentile of the current Dutch height distribution (see Figure 1). In other words, if we use the
current Dutch standard, we would conclude that the Dutch in 1860 and Indians in the 1980s suffered
from similar degrees of chronic malnutrition. On the other hand, if we used the Dutch height
distribution of 1860 as the standard for good nutritional status, Indians in the 1980s would be judged
9
to have good levels of nutrition.
Obviously, it makes no sense to use European height distributions that go back to a time
when Europeans were severely malnourished as a standard of good nutrition. Of course, nobody
three or four generations ago realized that children who were then of average stature or weight were
severely malnourished since they had no way of predicting that stature and weight would increase as
much as they have. The question is, are the British and other West Europeans as well as North
Americans still malnourished by standards that will prevail in the future? Can we rule out the
possibility that body builds in these populations will increase as much in the next century as they did
in the previous one?
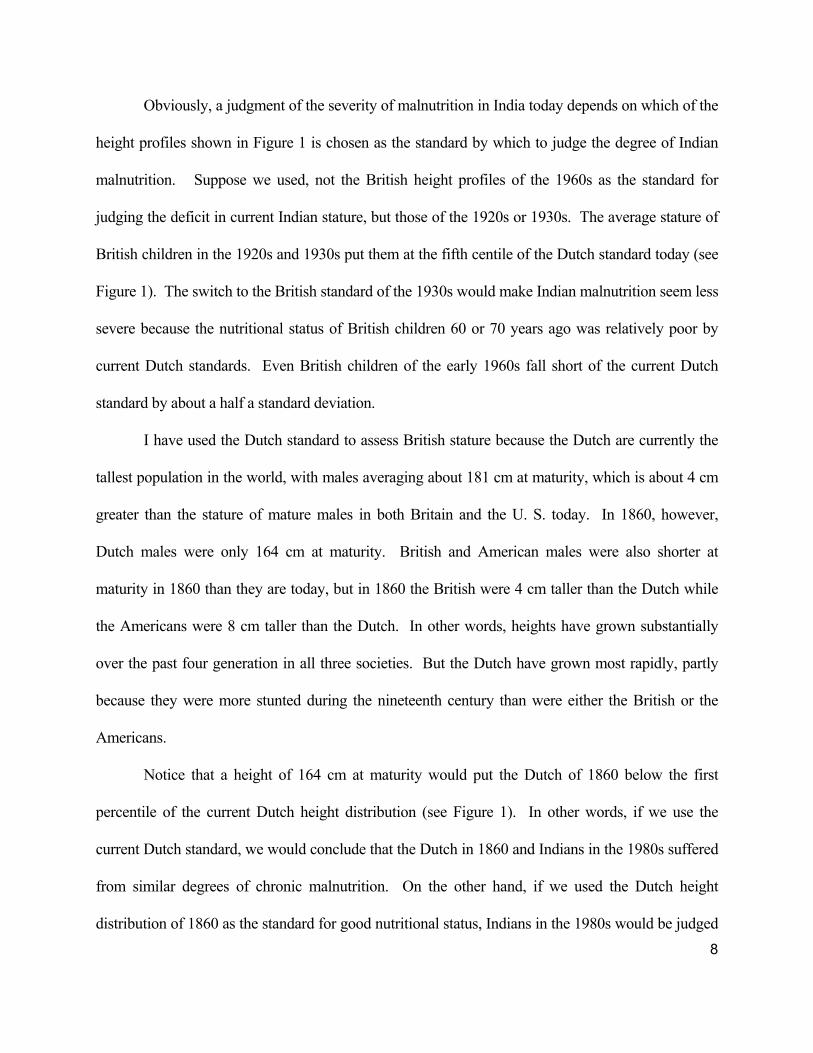
The answer to this question turns on two issues. One issue concerns the past, and the likely
future, of technological change. The other is the past and the likely future of technologically-
induced physiological change. Figure 2 provides an insight into the first issue. It shows how
dramatic the change in the control of the environment after 1700 has been. During its first 200,000
years or so years, Homo sapiens increased at an exceedingly slow rate. The discovery of agriculture
about 11,000 years ago broke the tight constraint on the food supply imposed by a hunting and
gathering technology, making it possible to release between 10 and 20 percent of the labor force
from the direct production of food, and also giving rise to the first cities. The new technology of
food production was so superior to the old one that it was possible to support a much higher rate of
population increase than had existed prior to c.9000 B.C. Yet the advances in the technology of food
production after the second Agricultural Revolution (which began about 1700 A.D.) were far more
dramatic than the earlier breakthrough, since they permitted population to increase at so high a rate
that the line of population appears to explode, rising almost vertically. The new technological
10
Figure 2 The Growth of World Population and
Some Major Events in the History of Technology
Sources: Cipolla 1974; Clark 1961; Fagan 1977; McNeill 1971; Piggott 1965; Derry and
Williams 1960; Trewartha 1969. See also Allen 1992, 1994; Slicher von Bath 1963 and Wrigley 1987.
Note: There is usually a lag between the invention (I) of a process or a machine and its
general application to production. “Beginning” (B) usually means the earliest stage of this diffusion process.
breakthroughs in manufacturing, transportation, trade, communications, energy production, leisure-
11
time services, and medical services were in many respects even more striking than those in
agriculture. The twentieth century witnessed a huge acceleration in both population and
technological change. The increase in world population between 1900 and 1990 was four times as
great as the increase during the whole previous history of humankind.
Not only has technological change accelerated dramatically since 1700 but the diffusion of
modern technology has also accelerated greatly over the past two centuries. Modern economic
growth began first in Great Britain early in the eighteenth century. It did not begin in the United
States until the late eighteenth century. France joined them after the Napoleonic era. By the middle
of the nineteenth century the circle expanded to include the Netherlands, Germany, Switzerland,
Denmark, Norway, Sweden, Canada and Australia. Japan, Russia, and Argentina did not enter onto
the path of modern economic growth until the end of the nineteenth century. For Italy and other
West European nations, modern economic growth was delayed until the beginning of the twentieth
century. Except for Japan, modern economic growth did not extend to Asia until after World War II.
Today, however, the most remarkable instances of rapid economic growth are in Asian and
Latin American countries, which together represent more than half of the population of the world.
This vast expansion of modern economic growth did not get underway until after World War II but
since then has proceeded with lightning speed. These changes first became evident in the
improvement in life expectation. In the case of India, for example, life expectation at birth increased
from 29 years in 1930 to 60 years in 1990. An increase of that magnitude required two and a half
centuries in England and France. The sharp drop in the death rates of developing nations led to an
enormous surge in the growth of population which in turn led to widespread fears that the food
supply could not keep up with population growth and that industrialization would be thwarted.
None of these forecasts has turned out to be true. Quite the contrary, first Japan, and then the
12
Asian Dragons (South Korea, Taiwan, Singapore, and Hong Kong) and more recently China,
Malaysia, Thailand, Indonesia, India, and more than a dozen other countries often referred to as
Emerging Market Economies began growing in both Gross Domestic Product and in per capita
income at rates that far exceeded the long-term experience of the early leaders. Japan has set the
standard for this pattern. Its Gross Domestic Product increased by nearly 14-fold in just 4 decades,
taking Japan from an impoverished land with characteristics typical of countries at low levels of
development to the second wealthiest nation in the world. That large a leap took more than a
century and a half in the West.
What has the rapidly accelerating pace of technological change meant for the food supply?
As a result of recent work by agricultural historians that question can now be answered. Their
estimates show that even in Britain, which had the most technically advanced agriculture during the
eighteenth century, chronic malnutrition was exceedingly severe. The average daily per capita
caloric supply in Britain in 1700 was at the current level of Bangladesh. Although caloric supplies
rose over the course of the eighteenth century, the British did not attain the level of the current
Indian per capita supply until the start of the nineteenth century. As late as the middle of the
nineteenth century the British per capita caloric supply was at or below the average calorie supply of
nations that the World Bank designates as "low-income economies." The situation in France during
the eighteenth century was even worse. Its per capita caloric supply put it at the level of poorest
nations today such as Mozambique, Ethiopia, and Somalia. It was not until well into the twentieth
century that France and Great Britain achieved the type of food abundance that is currently
characteristic of OECD nations (3,417 kcals).
Evidence on stature and the Body Mass Index (BMI is an index of weight adjusted for
height) indicates that the majority of the French were not only stunted but also wasted. Males were
13
12 centimeters shorter than they are today and their BMIs were perhaps twenty percent or more
below current levels. The English were only slightly better off.
Thus the escape from chronic malnutrition is a recent phenomenon even for the rich
countries of the world, belonging mainly to the twentieth century. The initial concepts of good
stature and good BMI were those prevailing in the OECD nations at the turn of the century. BMI in
the range of 20-24 was thought to be best, because the average BMI during the late nineteenth and
early twentieth century was relatively low by current experience. However, more recent evidence
suggests that the stature and BMI prevailing in the early decades of the twentieth still reflected both
continuing and residual effects of malnutrition on physiology.
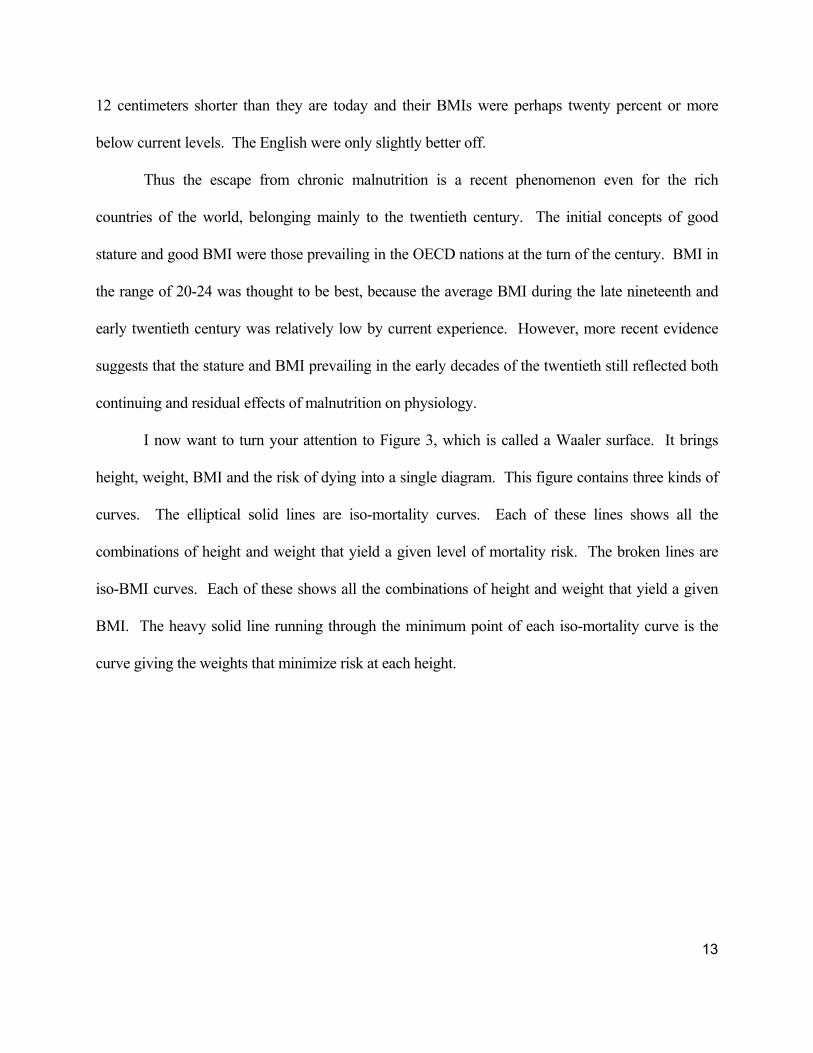
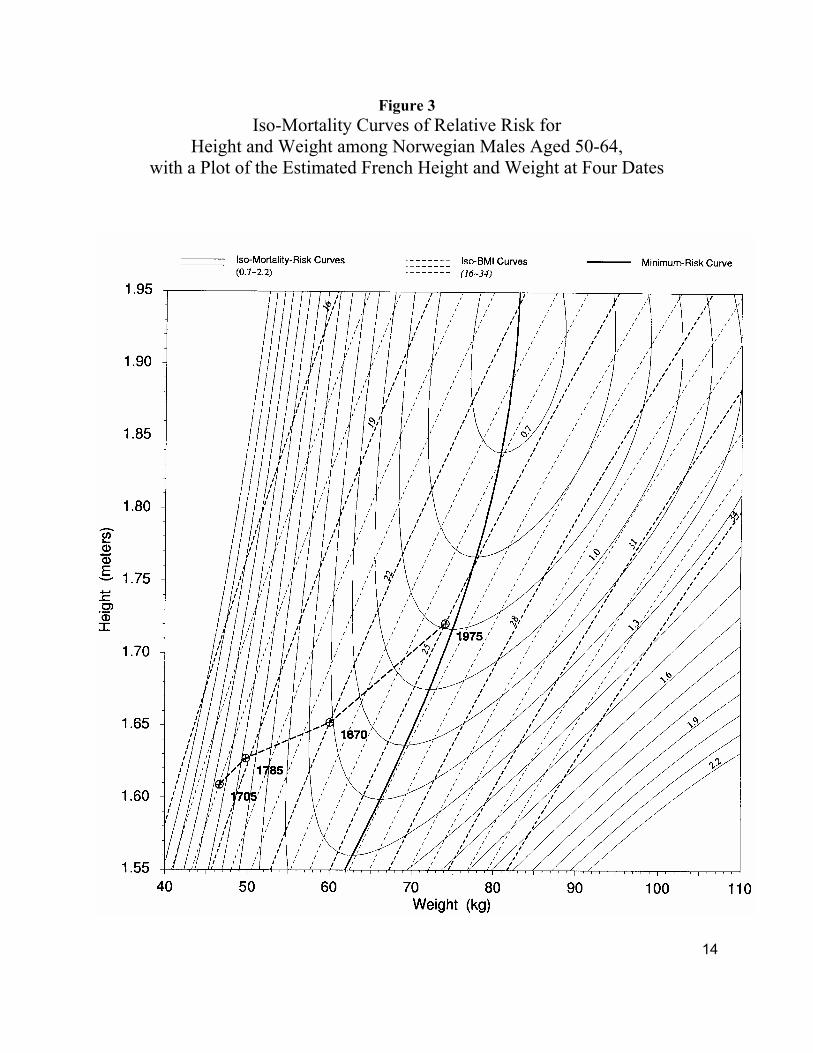
I now want to turn your attention to Figure 3, which is called a Waaler surface. It brings
height, weight, BMI and the risk of dying into a single diagram. This figure contains three kinds of
curves. The elliptical solid lines are iso-mortality curves. Each of these lines shows all the
combinations of height and weight that yield a given level of mortality risk. The broken lines are
iso-BMI curves. Each of these shows all the combinations of height and weight that yield a given
BMI. The heavy solid line running through the minimum point of each iso-mortality curve is the
curve giving the weights that minimize risk at each height.
14
Figure 3 Iso-Mortality Curves of Relative Risk for
Height and Weight among Norwegian Males Aged 50-64, with a Plot of the Estimated French Height and Weight at Four Dates
15
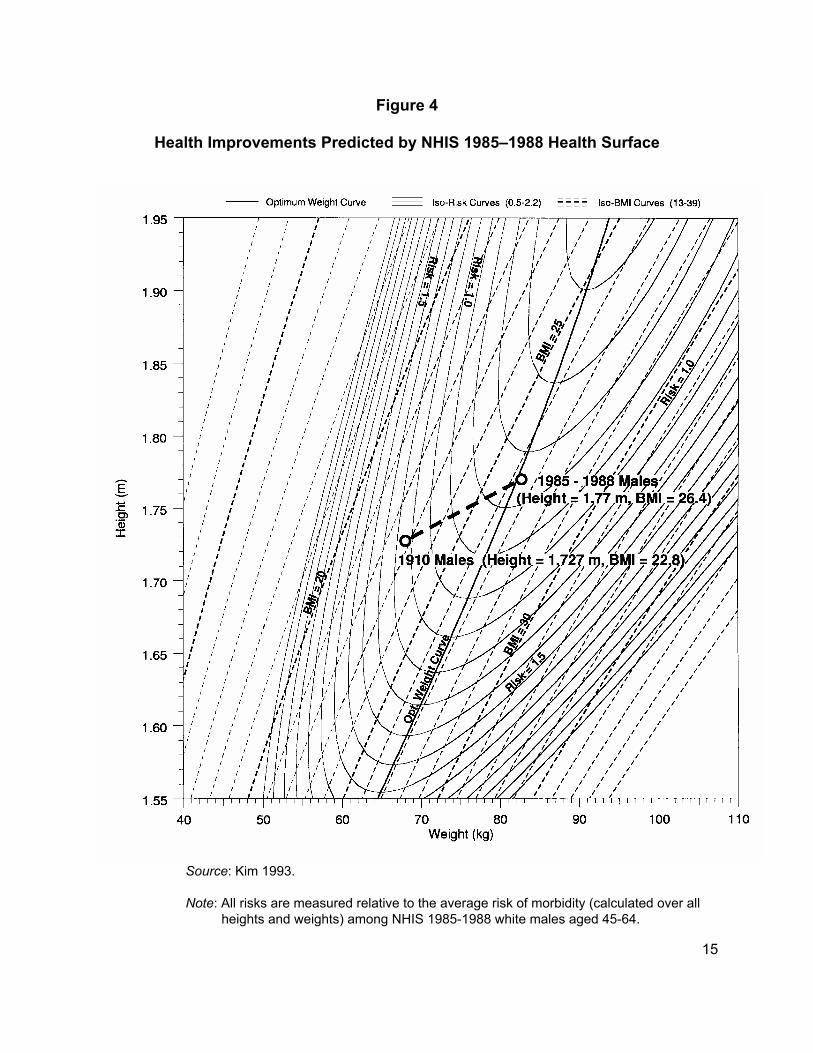
Figure 4
Health Improvements Predicted by NHIS 1985–1988 Health Surface
Source: Kim 1993. Note: All risks are measured relative to the average risk of morbidity (calculated over all
heights and weights) among NHIS 1985-1988 white males aged 45-64.
16
Some properties of this iso-mortality map are worth noting. The first is that the ideal BMI
is not constant. At 175 cm of height the optimal BMI is 25, but at 189 cm the optimal BMI is
just 23, while at short heights, 165 cm or less, the optimal BMI is 26. Hence, for most
individuals, Figure 3 indicates that the BMI that minimizes the risk of dying is higher than
suggested in some recently published standards. According to this figure, average current
weights appear to be more acceptable than is suggested by phrases such as "a pandemic of
obesity." Also notice that at a height of 182 cm, which is the current average final height of
males in the Netherlands, the risk of dying varies very little between BMIs of 22 and 27.
However, at a height of 165 cm, the range of negligible risk variation is somewhat smaller (from
24 - 28) and is further to the right.
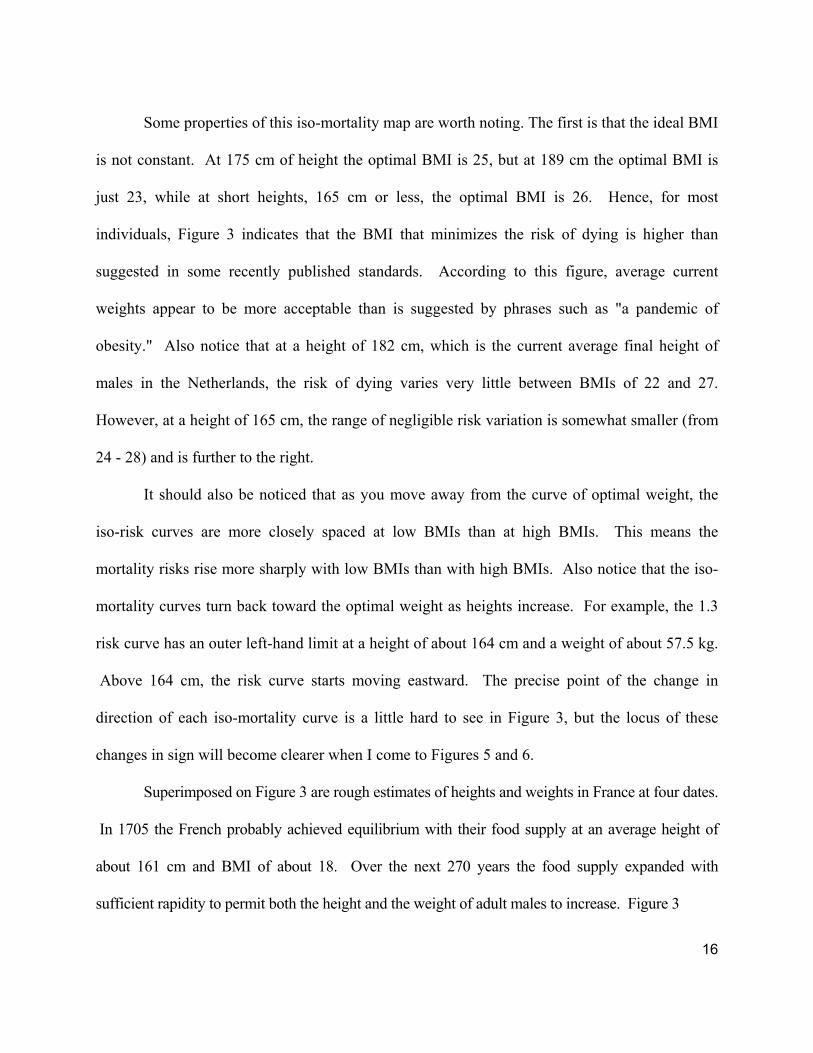
It should also be noticed that as you move away from the curve of optimal weight, the
iso-risk curves are more closely spaced at low BMIs than at high BMIs. This means the
mortality risks rise more sharply with low BMIs than with high BMIs. Also notice that the iso-
mortality curves turn back toward the optimal weight as heights increase. For example, the 1.3
risk curve has an outer left-hand limit at a height of about 164 cm and a weight of about 57.5 kg.
Above 164 cm, the risk curve starts moving eastward. The precise point of the change in
direction of each iso-mortality curve is a little hard to see in Figure 3, but the locus of these
changes in sign will become clearer when I come to Figures 5 and 6.
Superimposed on Figure 3 are rough estimates of heights and weights in France at four dates.
In 1705 the French probably achieved equilibrium with their food supply at an average height of
about 161 cm and BMI of about 18. Over the next 270 years the food supply expanded with
sufficient rapidity to permit both the height and the weight of adult males to increase. Figure 3
17
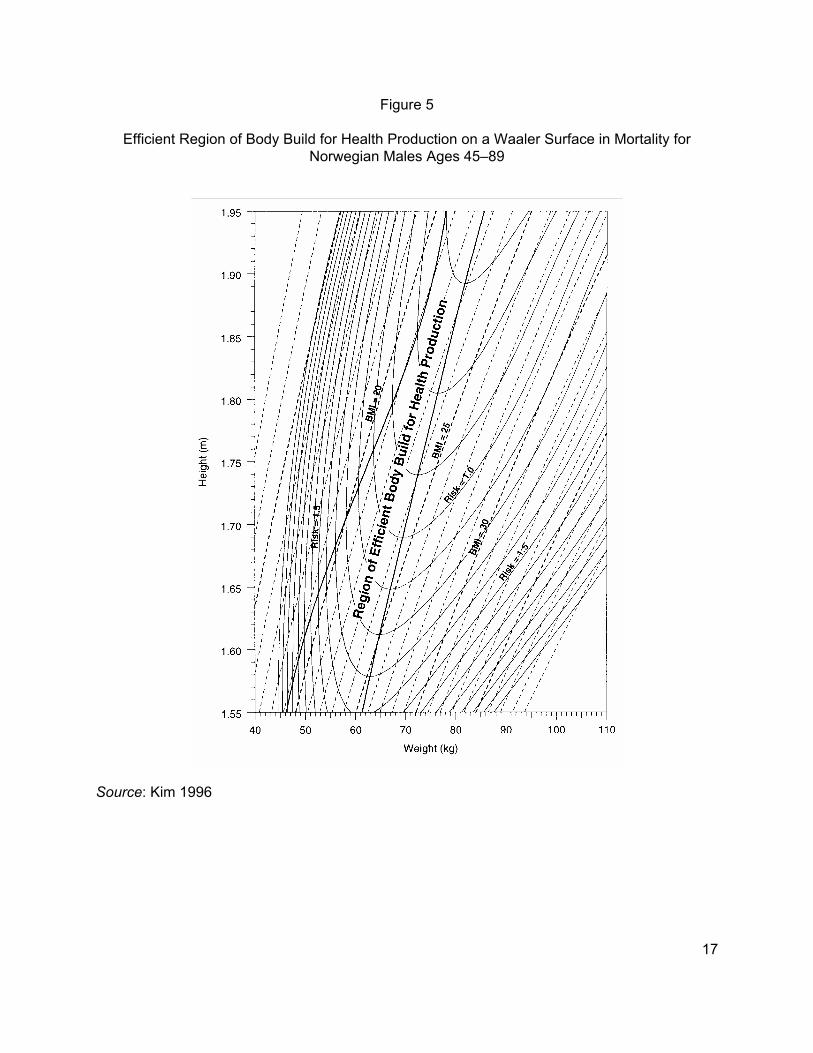
Figure 5
Efficient Region of Body Build for Health Production on a Waaler Surface in Mortality for Norwegian Males Ages 45–89
Source: Kim 1996
18
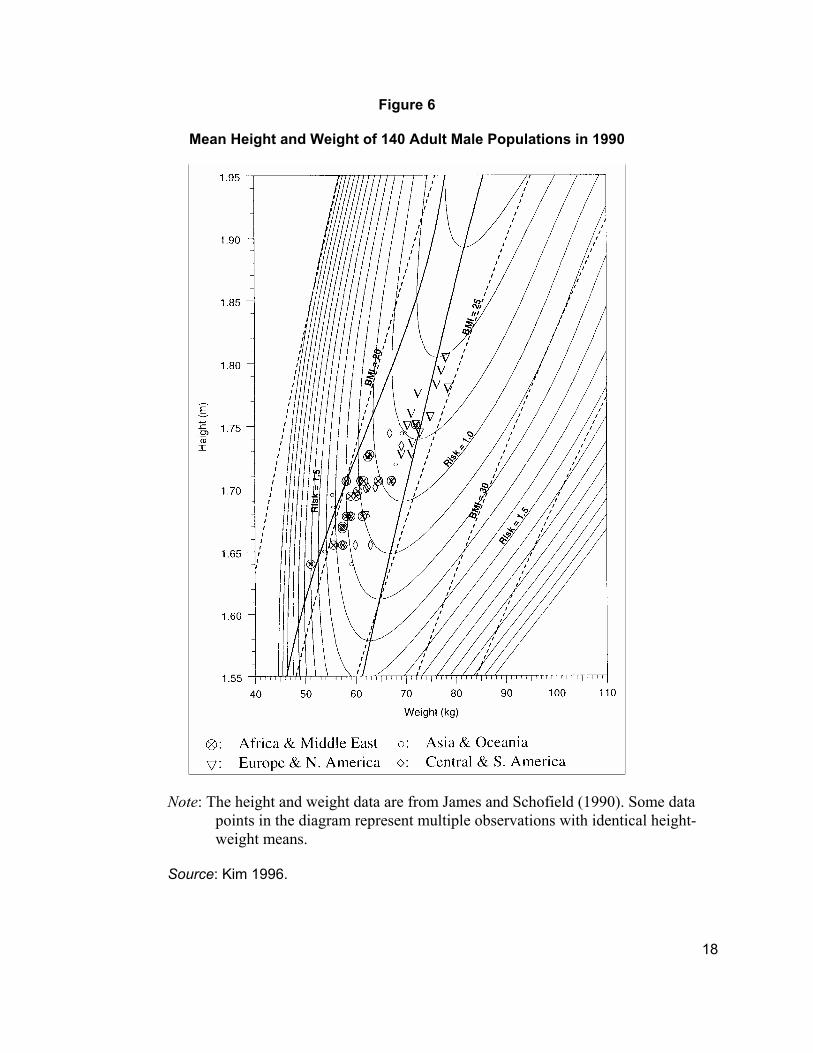
Figure 6
Mean Height and Weight of 140 Adult Male Populations in 1990
Note: The height and weight data are from James and Schofield (1990). Some data points in the diagram represent multiple observations with identical height-weight means.
Source: Kim 1996.
19
implies that while factors associated with height and weight jointly explain about 90 percent of the
estimated decline in French mortality rates over the period between c.1785 and c.1870, they only
explain about 50 percent of the decline in mortality rates during the past century.
Poor body builds increased vulnerability to diseases, not just contagious diseases, but
chronic diseases as well. American males born during the second quarter of the nineteenth century
were the first generation to reach age 65 in the twentieth century. They were not only stunted by
today's standards, but their BMIs at adult ages were about 15 percent lower than current U.S. levels.
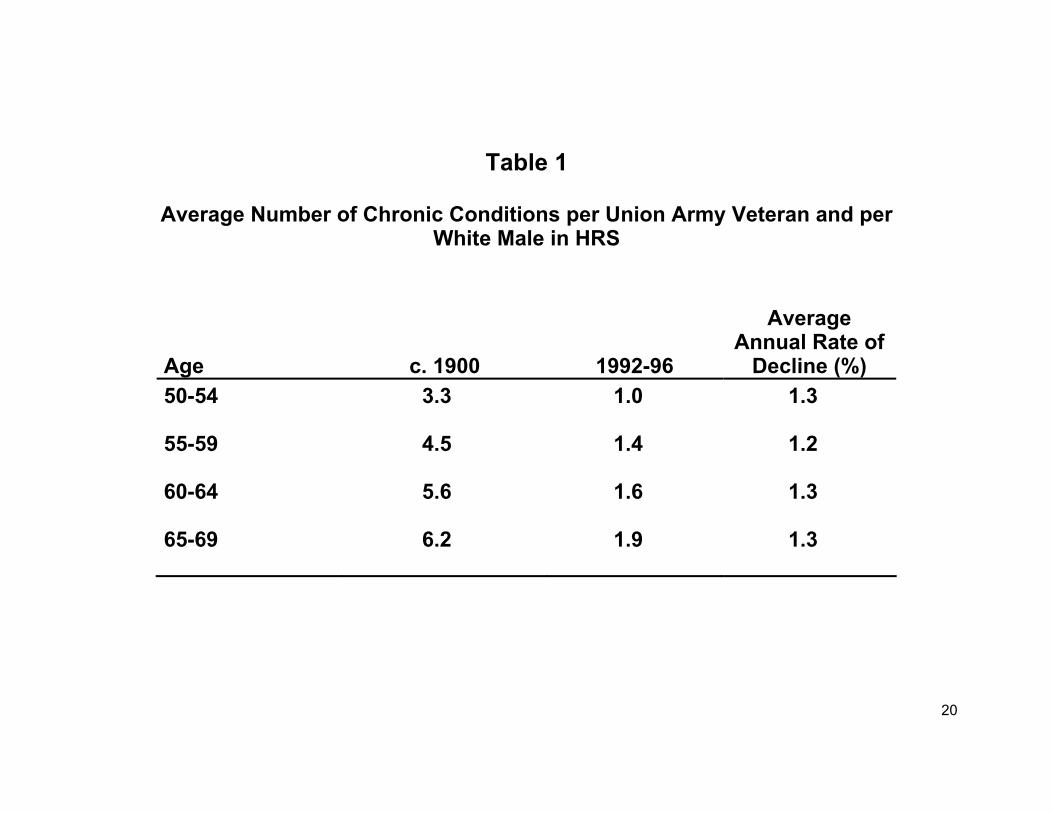
The implication of combined stunting and low BMI is brought out by Table 1, which shows the
average decline in the number of chronic diseases by age between 1900 and the 1990s. Comparison
of the Union Army data for c.1900 with those in the Health and Retirement Survey for the 1990s
indicated that there was a substantial decline in the number of chronic diseases at all ages between
50 and 70. Table 1 shows that over the course of the twentieth century the number of chronic
conditions declined by about two-thirds at each age interval. The average annual rate of decline was
about 1.3 percent.
Although today U. S. and British children and adults live longer and have less disease than
their counterparts in South Asia, it is not at all clear that they have as yet attained optimal nutritional
status. Analysis derived from Waaler surfaces suggests that final heights and current BMIs in the
U.S. and Britain may be suboptimal. There is, of course, a question as to whether any society can
reach an average height for males of 190 cm, which according to Figure 3 would be associated with
an increase in life expectancy by about 25 percent (e.g. e0 ≈ 95 years). Although no society has as yet
reached that average height, the possibility cannot now be ruled out. Few, if any, persons alive in
1800 forecast the increases in European stature that have occurred during the subsequent 200 years.
20
Table 1
Average Number of Chronic Conditions per Union Army Veteran and per White Male in HRS
Age
c. 1900
1992-96
Average Annual Rate of
Decline (%) 50-54 3.3 1.0 1.3
55-59 4.5 1.4 1.2
60-64 5.6 1.6 1.3
65-69 6.2 1.9 1.3
21
Physiological Capital and the Adaptation Controversy: Implications for the Measurement of Economic Growth
Figure 3 makes it clear that the limitation of body size has been one of the principal ways of
adapting to low levels of energy. The point is not merely that height and BMI increased as the per
capita supply of food increased. It is also that increases and decreases in body size represent
changes in physiological capacity that affected both the quality of life and the capacity to produce.
Consequently, when traditional agricultural technology was too inefficient to sustain a large average
body size, it also limited the capacity to acquire physiological capital. Under the prevailing
agricultural technology of 1800, Frenchmen could not have achieved the physiological capacity
associated with modern body sizes. If Frenchmen in 1800 had been as large on average as they are
today, there would not have been enough energy to produce the food supply, since all of the
available energy would have been required for basal metabolism.
Viewed historically, it makes little sense to talk about whether wasting or stunting is a
desirable form of adaptation since there was no alternative. Indeed, only when the technology of
food production became much more efficient than it had been during the eighteenth century did it
become possible to sustain large people. It was only at that point that individuals generally could
have chosen between more energy and more industrial goods or other nonfood commodities.
Figures 3 and 4 imply that the cost of adaptation to inadequate food supplies by wasted
and stunted individuals cannot be measured merely by using cross-sectional data to determine
whether productivity is positively correlated with stature. Such cross-sectional procedures do
not take into account the rate of decline in human capital over the life cycle. Since stunting
accelerates the rate of depreciation in human capital over the life cycle, the discounted present
22
value of output is, on average, lower than inferred from cross-sections. Even if, at a given age, a
short person who is still in the labor force is as productive as a tall one, more short than tall
persons of that age have left the labor force because of disability or death. Hence, there is ample
selection bias in econometric studies that omit from consideration those members of a cohort
who are no longer in the labor force. Even studies that show a positive effect of stature or BMI
on output have biased the effect downward unless they have taken account of the omitted
observations.
Figures 3 and 4 also point to another problem that is often overlooked. To equalize the
rate of depreciation in physiological capital, stunted individuals require higher BMIs than tall
individuals. For example, to equalize the odds of retaining good health in middle ages, a person
of 165 cm needs a BMI that is 25 percent higher than a person of 181 cm. Moreover, when risks
are equalized, the BMI of the stunted individual is greater than that of tall individuals. Figures 3
and 4 imply, therefore, that adaptation to malnutrition by saving on the energy for basal
metabolism requires an increased rate of depreciation in physiological capital. Hence, the
essence of adaptation via body size to an inadequate food supply is a trade off of current
metabolic needs for increased life-cycle risk of mortality. For example, for a male who is 165 cm
in height, a 5 percent reduction in the amount of food required for basal metabolism brought
about by a reduction in weight imposes a 15 percent increase in mortality risk.
I now want to direct your attention to Figures 5 and 6, which were constructed by John
Kim to describe a hitherto neglected aspect of what economists call "health capital." In this case
the Waaler surface is interpreted as a "health-production" surface. Up to a certain point, people
can produce better health by raising children with greater stature and greater BMIs. Figure 5
portrays the region of efficient body builds for the production of good health. This efficient zone
23
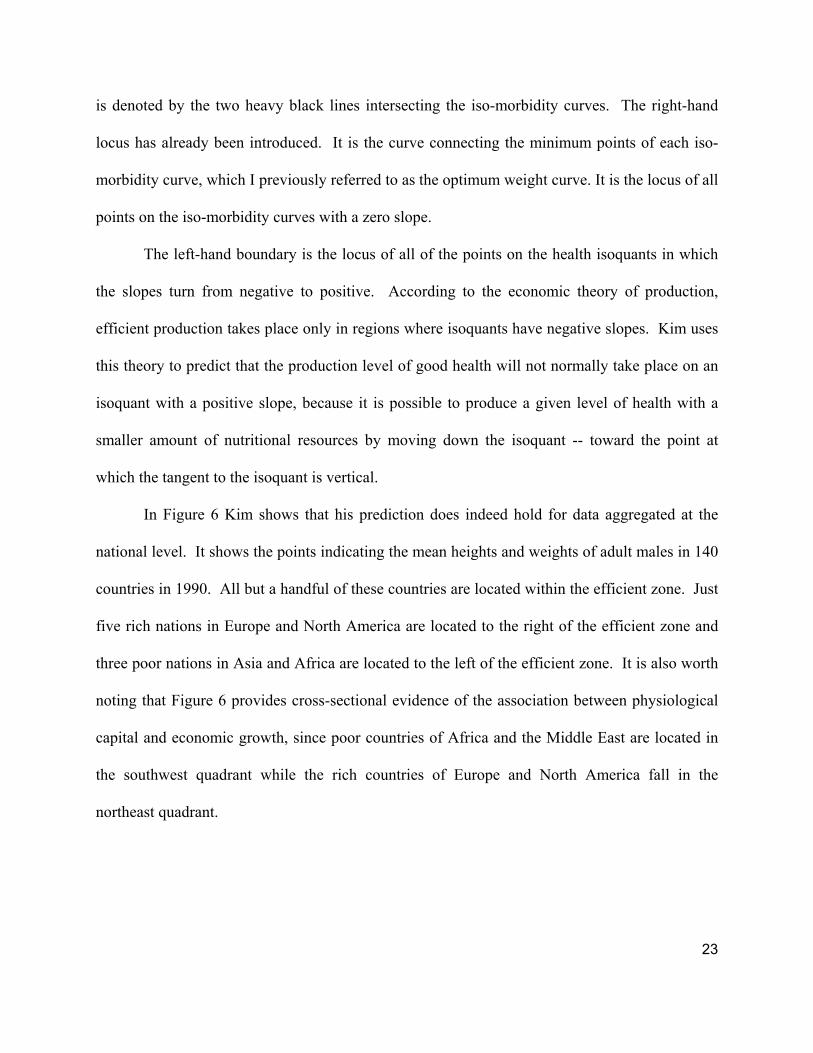
is denoted by the two heavy black lines intersecting the iso-morbidity curves. The right-hand
locus has already been introduced. It is the curve connecting the minimum points of each iso-
morbidity curve, which I previously referred to as the optimum weight curve. It is the locus of all
points on the iso-morbidity curves with a zero slope.
The left-hand boundary is the locus of all of the points on the health isoquants in which
the slopes turn from negative to positive. According to the economic theory of production,
efficient production takes place only in regions where isoquants have negative slopes. Kim uses
this theory to predict that the production level of good health will not normally take place on an
isoquant with a positive slope, because it is possible to produce a given level of health with a
smaller amount of nutritional resources by moving down the isoquant -- toward the point at
which the tangent to the isoquant is vertical.
In Figure 6 Kim shows that his prediction does indeed hold for data aggregated at the
national level. It shows the points indicating the mean heights and weights of adult males in 140
countries in 1990. All but a handful of these countries are located within the efficient zone. Just
five rich nations in Europe and North America are located to the right of the efficient zone and
three poor nations in Asia and Africa are located to the left of the efficient zone. It is also worth
noting that Figure 6 provides cross-sectional evidence of the association between physiological
capital and economic growth, since poor countries of Africa and the Middle East are located in
the southwest quadrant while the rich countries of Europe and North America fall in the
northeast quadrant.
24
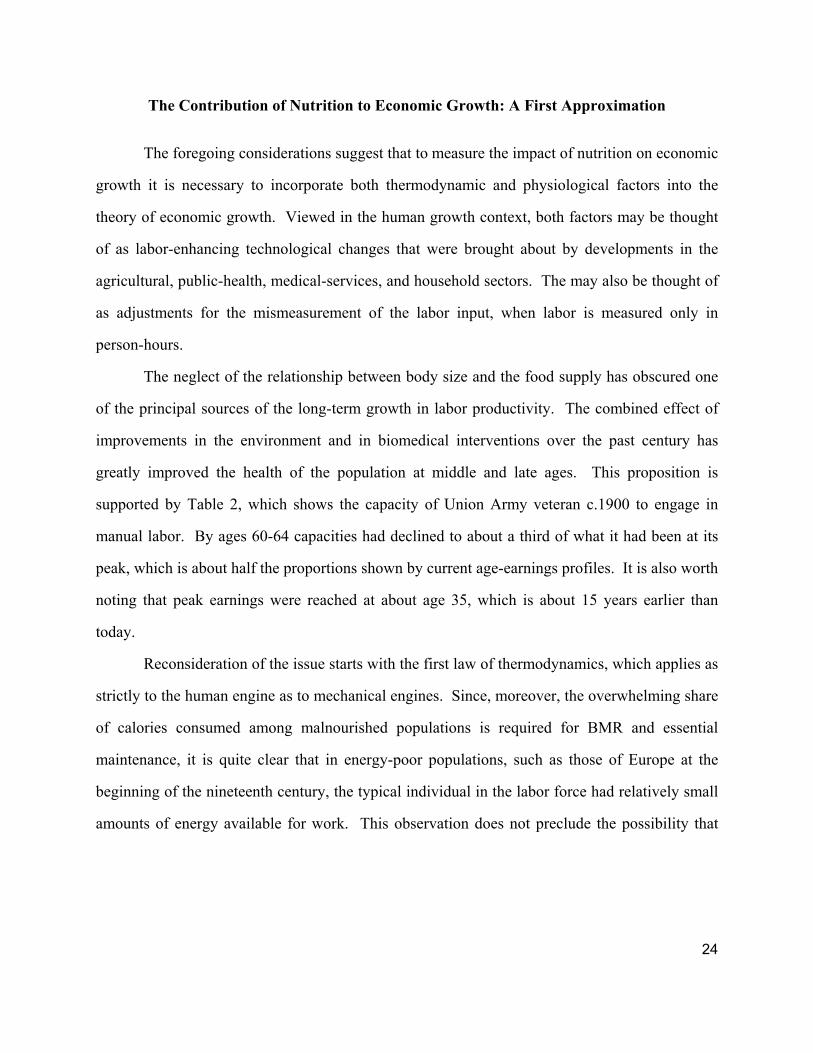
The Contribution of Nutrition to Economic Growth: A First Approximation
The foregoing considerations suggest that to measure the impact of nutrition on economic
growth it is necessary to incorporate both thermodynamic and physiological factors into the
theory of economic growth. Viewed in the human growth context, both factors may be thought
of as labor-enhancing technological changes that were brought about by developments in the
agricultural, public-health, medical-services, and household sectors. The may also be thought of
as adjustments for the mismeasurement of the labor input, when labor is measured only in
person-hours.
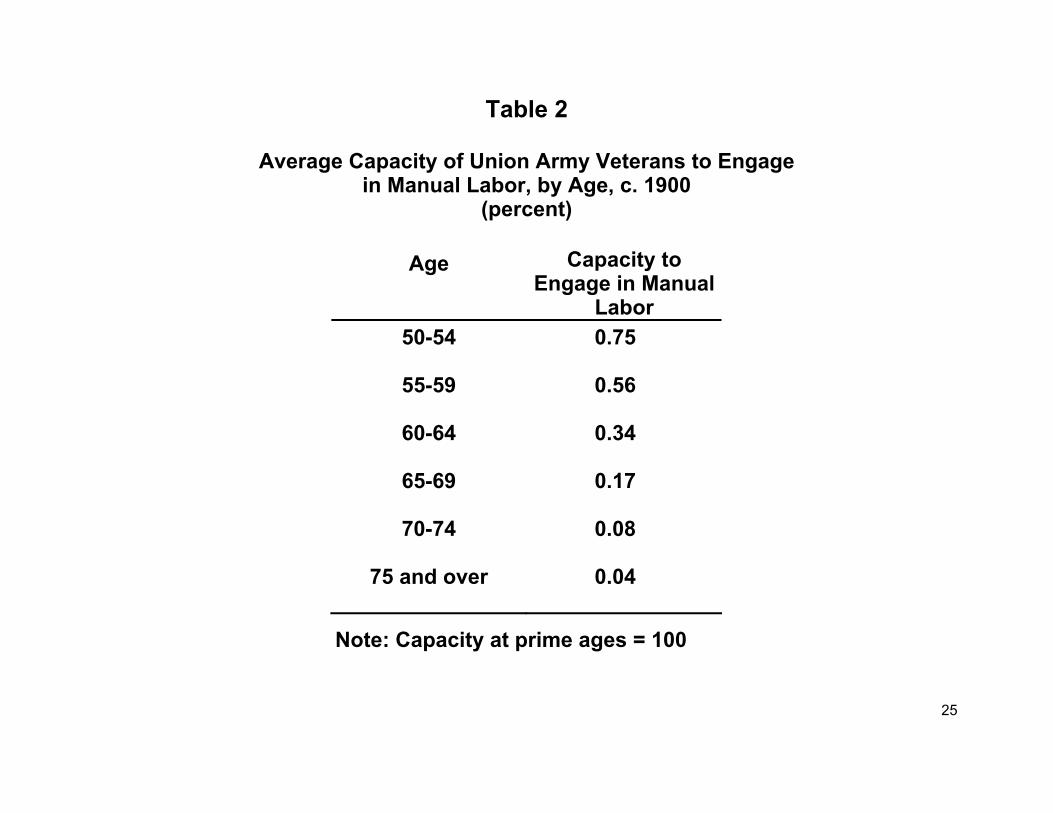
The neglect of the relationship between body size and the food supply has obscured one
of the principal sources of the long-term growth in labor productivity. The combined effect of
improvements in the environment and in biomedical interventions over the past century has
greatly improved the health of the population at middle and late ages. This proposition is
supported by Table 2, which shows the capacity of Union Army veteran c.1900 to engage in
manual labor. By ages 60-64 capacities had declined to about a third of what it had been at its
peak, which is about half the proportions shown by current age-earnings profiles. It is also worth
noting that peak earnings were reached at about age 35, which is about 15 years earlier than
today.
Reconsideration of the issue starts with the first law of thermodynamics, which applies as
strictly to the human engine as to mechanical engines. Since, moreover, the overwhelming share
of calories consumed among malnourished populations is required for BMR and essential
maintenance, it is quite clear that in energy-poor populations, such as those of Europe at the
beginning of the nineteenth century, the typical individual in the labor force had relatively small
amounts of energy available for work. This observation does not preclude the possibility that
25
Table 2
Average Capacity of Union Army Veterans to Engage in Manual Labor, by Age, c. 1900
(percent)
Age Capacity to Engage in Manual
Labor 50-54 0.75
55-59 0.56
60-64 0.34
65-69 0.17
70-74 0.08
75 and over 0.04
Note: Capacity at prime ages = 100
26
malnourished French or English farmers worked hard for relatively long hours at certain times of
the year, as at harvest time. Such work could have been sustained either by consuming more
calories than normal during such periods, or by drawing on body mass to provide the needed
energy.
It is quite clear, then, that the increase in the amount of calories available for work over
the past 200 years must have made a significant contribution to the growth rate of the per capita
income of countries such as France and Great Britain. That contribution had two effects, a
thermodynamic effect and a physiological effect. The thermodynamic effect increased the labor
force participation rate by bringing into the labor force the bottom 20 percent of the consuming
units, who, even assuming highly stunted individuals and low BMIs, had only enough energy
above maintenance for a few hours of strolling each day -- about the amount needed for just one
hour of heavy manual labor. Consequently, merely the elimination of the large class of paupers
and beggars, which was accomplished in England mainly during the last half of the nineteenth
century, contributed significantly to the growth of national product. The increase in the labor
force participation rate made possible by raising the nutrition of the bottom fifth of consuming
units above the threshold required for work, by itself, contributed 0.12 percent to the annual
British growth rate between 1800 and 1980 (1.25 0.00556 - 1 =0.00124).
In addition to raising the labor force participation rates, the supply of calories per
equivalent adult male available for work increased from about 848 per day in 1800 to about
1,793 in 1980. However, not all of these calories contributed to output, as output is defined by
the national income and product accounts (NIPA). Over the past two centuries there has been a
considerable increase in the share of the discretionary day devoted to leisure. Hence, although
the calories available for work in England increased by about 109 percent per equivalent adult,
27
the increases in calories use to produce output, as that term is defined by NIPA, is only about
41.7 percent. It follows that the increase in the amount of energy available for work contributed
about 0.19 percent per annum to the annual growth rate of per capita income (1.417 0.00556 - 1 =
0.00194).
Between 1800 and 1980, British per capita income grew at an annual rate of about 1.14
percent. Thus, through bringing the ultra poor into the labor force and through raising the energy
available for work by those in the labor force, the thermodynamic effect explains about 30
percent of the British growth in per capita income over the past two centuries.
The contention that the British intensity of effort increased over time may seem dubious
since the work day, week, and year (measured in hours) declined significantly over the past two
centuries. However, the British (and other Europeans) could not have worked at the same
average intensity per hour in 1800 as they do today, since that would have required a
considerably larger supply of dietary energy per capita than was actually available. Increases in
the intensity of labor per hour were also a factor in the American case, where food supplies were
far more abundant than in Europe. Even if it is assumed that the daily number of calories
available for work was the same in the United States in 1860 as today, the intensity of work per
hours would have been well below today's levels, since the average number of hours worked in
1860 was about 1.75 times as great as today. During the mid-19th century only slaves on
southern gang-system plantations appear to have worked at levels of intensity per hour
approaching current standards.
The physiological effect pertains to the efficiency with which the human engine converts
energy input into work output. Nutritionists, physiologists, and development economists have
contributed to the extensive literature on this topic. Since some important issues are unresolved,
28
a firm assessment of the physiological contribution to economic growth is not yet possible.
However, some aspects of the contribution can be indicated.
Changes in health, in the composition of diets, and in clothing and shelter can
significantly affect the efficiency with which ingested energy is converted into work output.
Reductions in the incidence of infectious diseases increase the proportion of ingested energy that
is available for work, both because of savings in the energy required to mobilize the immune
system and because the capacity of the gut to absorb nutrients is improved, especially as a
consequence of a reduction in diarrheal diseases. Thermodynamic efficiency has also increased
because of changes in the composition of the diet, including the shift from grains and other foods
with high fiber content to sugar and meats. These dietary changes raised the proportion of
ingested energy that can be metabolized (increased the average value of the "Atwater factors," to
use the language of nutritionists). Improvements in clothing and shelter have also increased
thermodynamic efficiency by reducing the amount of energy lost through radiation.
Individuals who are stunted but otherwise healthy at maturity will be at an increased risk
of incurring chronic diseases and of dying prematurely. To evaluate the significance of changes
in the rate of deterioration of the capacity to work over the life cycle, one needs to calculate the
effect of changes in stature and weight on the discounted present value of the difference between
earnings and maintenance over the life cycle. A procedure for estimating this effect is set forth
elsewhere, along with illustrative estimates of the key variables. The exercise indicates that the
discounted revenues would have increased by about 37 percent. This last figure, combined with
a guess on the effect of the shifting of Atwater factors, suggests that the average efficiency of the
human engine in Britain increased by about 53 percent between 1800 and 1980. The combined
effort of the increase in dietary energy available for work, and of the increased human efficiency
29
in transforming dietary energy into work output, appears to account for about 50 percent of the
British economic growth since 1800. In other words, the impact of nutrition on long-term
economic growth accounts for most of the previously unmeasured increase in British total factor
productivity.
This first approximation of the contribution of nutrition to economic growth probably
errs on the low side. It neglects, for example, the contribution of nutrition to the impact of
education on economic growth. Nutritionists and epidemiologists have demonstrated that the
capacity of individuals to benefit from education depends on overcoming malnutrition, since
malnutrition diminishes the effective operation of the central nervous system. Much remains to
be done in measuring the contribution of nutrition to economic growth.

More information on this and other papers related to this topic can be found at: http://www.paho.org/English/HDP/HDD/healthgrowth.htm
Program on Public Policy and Health Health and Human Development Division
PAN AMERICAN HEALTH ORGANIZATION 525 – 23rd Street NW Washington, DC 20037 Telephone: (202) 974-3482 Facsimile: (202) 974-3675 http://www.paho.org