Cosmic Ray Detector Software - Purdue University · 2012 QuarkNetSummer Workshop. Brief History •...
42
Cosmic Ray Detector Software Studying cosmic rays has never been easier… 1 Matthew Jones Purdue University 2012 QuarkNet Summer Workshop
Transcript of Cosmic Ray Detector Software - Purdue University · 2012 QuarkNetSummer Workshop. Brief History •...
Cosmic Ray Detector Software
Studying cosmic rays has never been easier…
1
Matthew Jones
Purdue University
2012 QuarkNet Summer Workshop
Brief History
• First cosmic ray detector built at Purdue in about
2005.
• We wanted to measure angular distribution of
cosmic rays
– Expected to follow 1+cos2θ distribution
• The i2u2 web interface couldn’t do it…
– No way to enter the geometry (eg, independent variable,
azimuthal angle)
– No way to graph count rates as a function of angle
• We wrote a simple software interface…
2
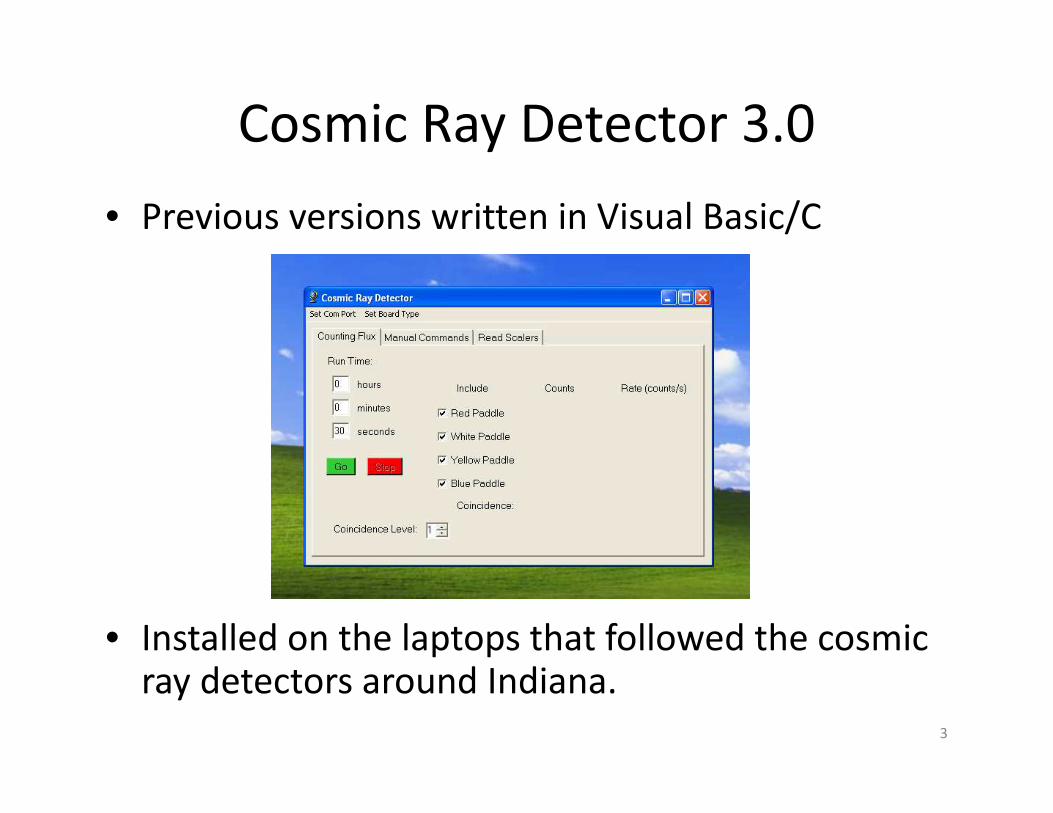
Cosmic Ray Detector 3.0
• Previous versions written in Visual Basic/C
• Installed on the laptops that followed the cosmic ray detectors around Indiana.
3
Brief History
• Apparently quite useful:
– You could do experiments in an hour or less
– Fast turn-around time when graphing data
– No need to upload data to i2u2 web site
• Still not applicable to several types of experiments:
– Muon lifetime
– Long term flux measurements
– Looking for air showers
• We wanted more…
– Frank Roetker from Jefferson High School had experience programming in Java and got the ball rolling…
4
5
Cosmic Ray Detector JavaTM Interface 2.0
• Why Java?
– Object oriented, high level language
– Fast to develop powerful graphical user interfaces
– Portable to a wide variety of machines and
operating systems without recompiling
• Disadvantage:
– You first need the Java Runtime Environment
– Easy to install if your IT people will let you…
6
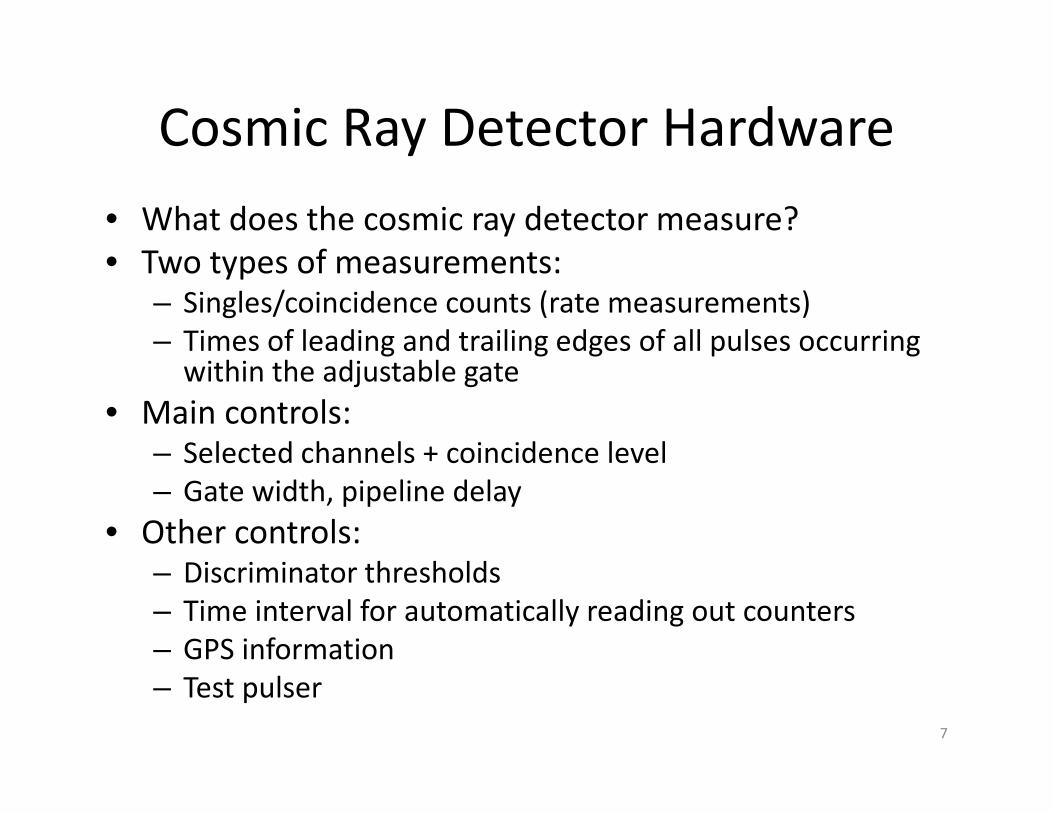
Cosmic Ray Detector Hardware
• What does the cosmic ray detector measure?
• Two types of measurements:– Singles/coincidence counts (rate measurements)
– Times of leading and trailing edges of all pulses occurring within the adjustable gate
• Main controls:– Selected channels + coincidence level
– Gate width, pipeline delay
• Other controls:– Discriminator thresholds
– Time interval for automatically reading out counters
– GPS information
– Test pulser
7
Software Design Model
• Send commands to the DAQ board
• Interpret data sent from the DAQ board
• A “stateless” model– Software does not need to remember what state the DAQ board is in
– Don’t have to worry about them getting out of sync
• The software acts as an intermediary:– Converts units you know and like (eg, nanoseconds or millivolts) to parameters that
the DAQ board uses
– Converts units the DAQ board uses (like hexadecimal numbers) to units you like (eg, nanoseconds, Hertz)
– Presents the data in the form of graphs or histograms
– Performs some of the more technical analysis of the data
• It also saves all the raw data– You can still upload it to i2u2 for the Cosmic Ray e-lab
– You can export the data and read it into Excel for doing other analyses
• It helps you do experiments but it doesn’t do them for you!
8
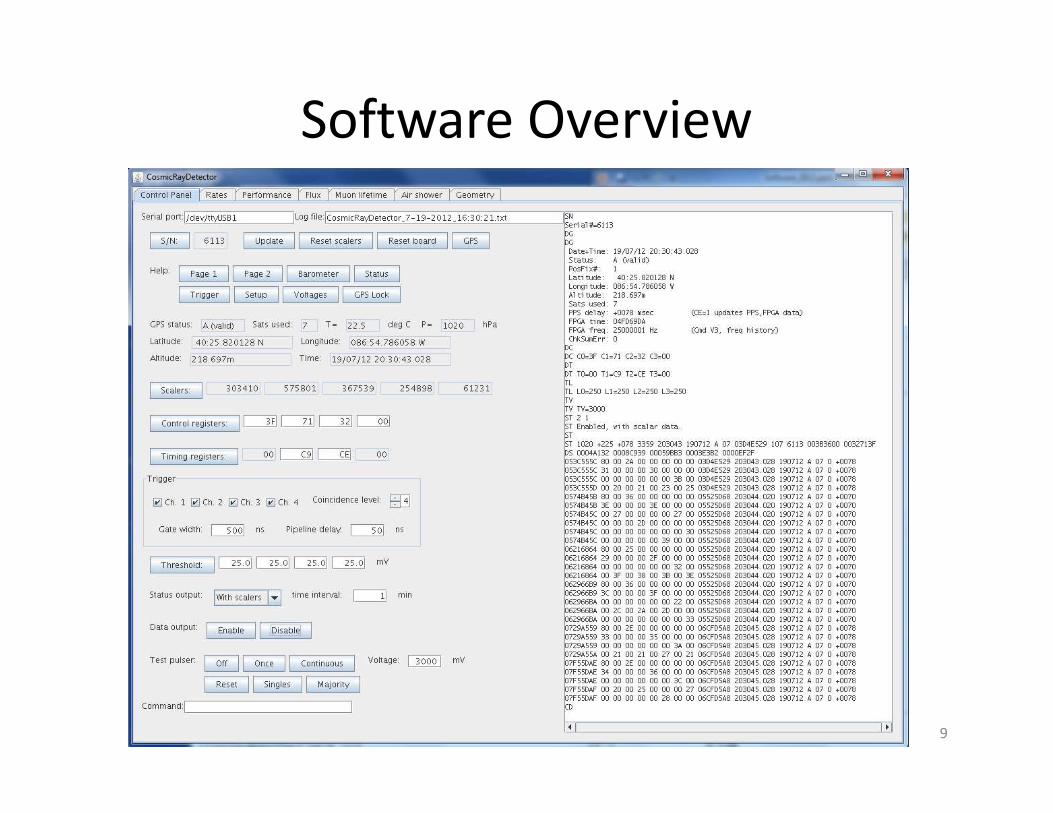
Software Overview
9
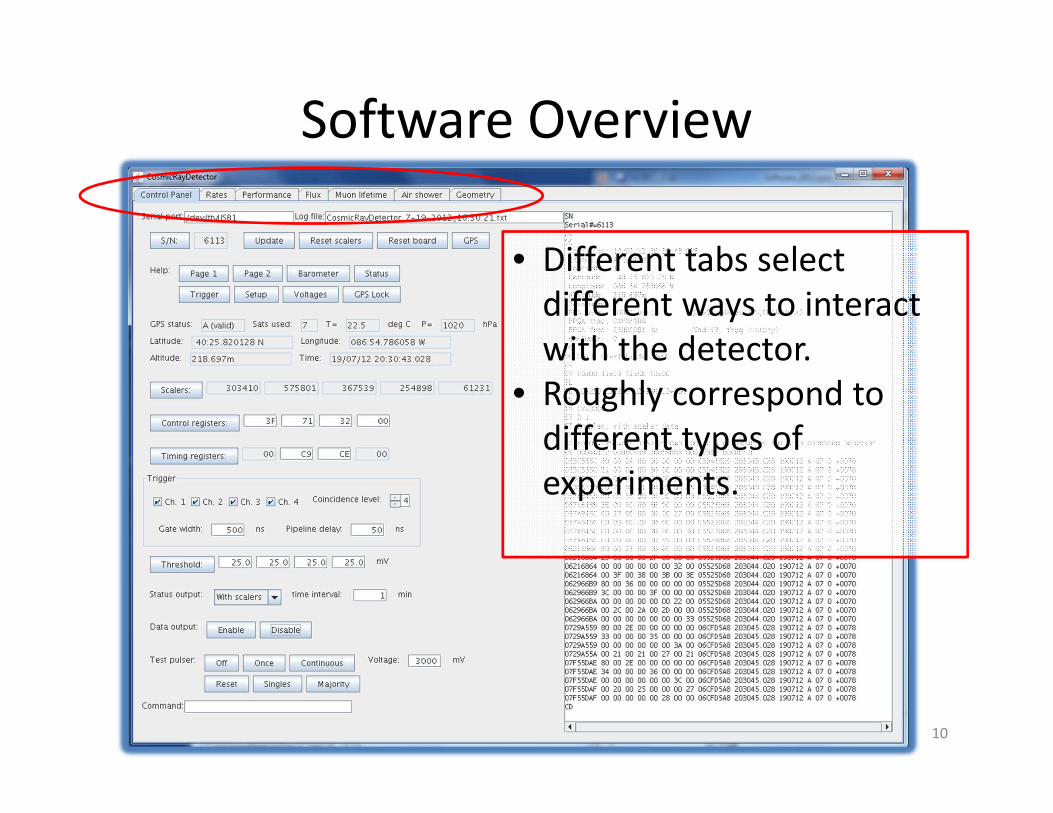
Software Overview
10
• Different tabs select
different ways to interact
with the detector.
• Roughly correspond to
different types of
experiments.
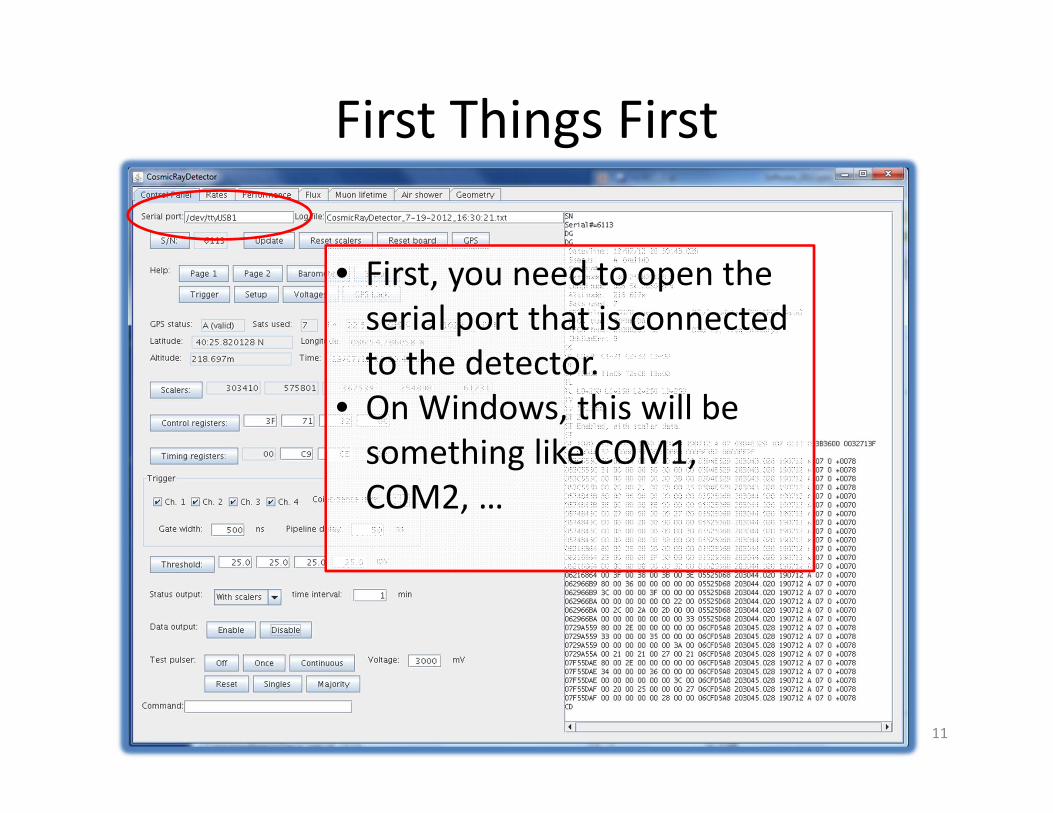
First Things First
11
• First, you need to open the
serial port that is connected
to the detector.
• On Windows, this will be
something like COM1,
COM2, …
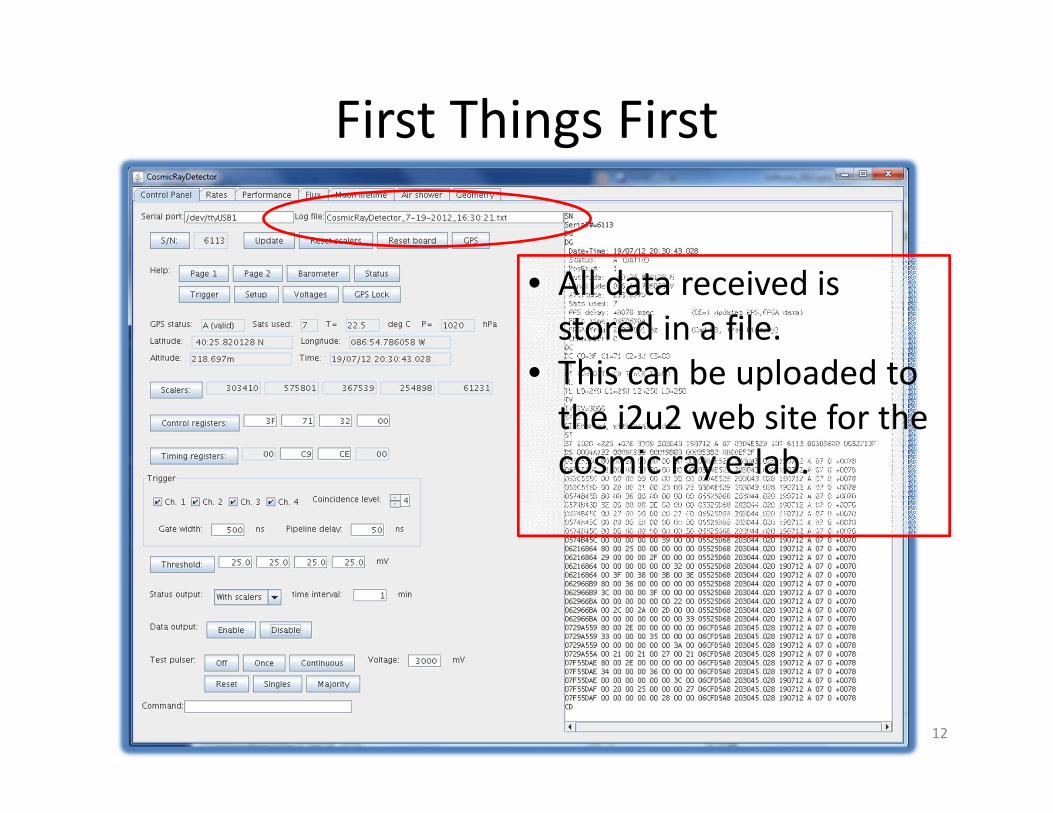
First Things First
12
• All data received is
stored in a file.
• This can be uploaded to
the i2u2 web site for the
cosmic ray e-lab.
The Control Panel
• The Control Panel lets you control all aspects of
the DAQ electronics
• Buttons send commands, text fields display the
results
• This is the main way to configure it for different
experiments
• Some controls you may never need to use (eg,
the “Control registers”)
• Some of the same controls appear on other tabs
13
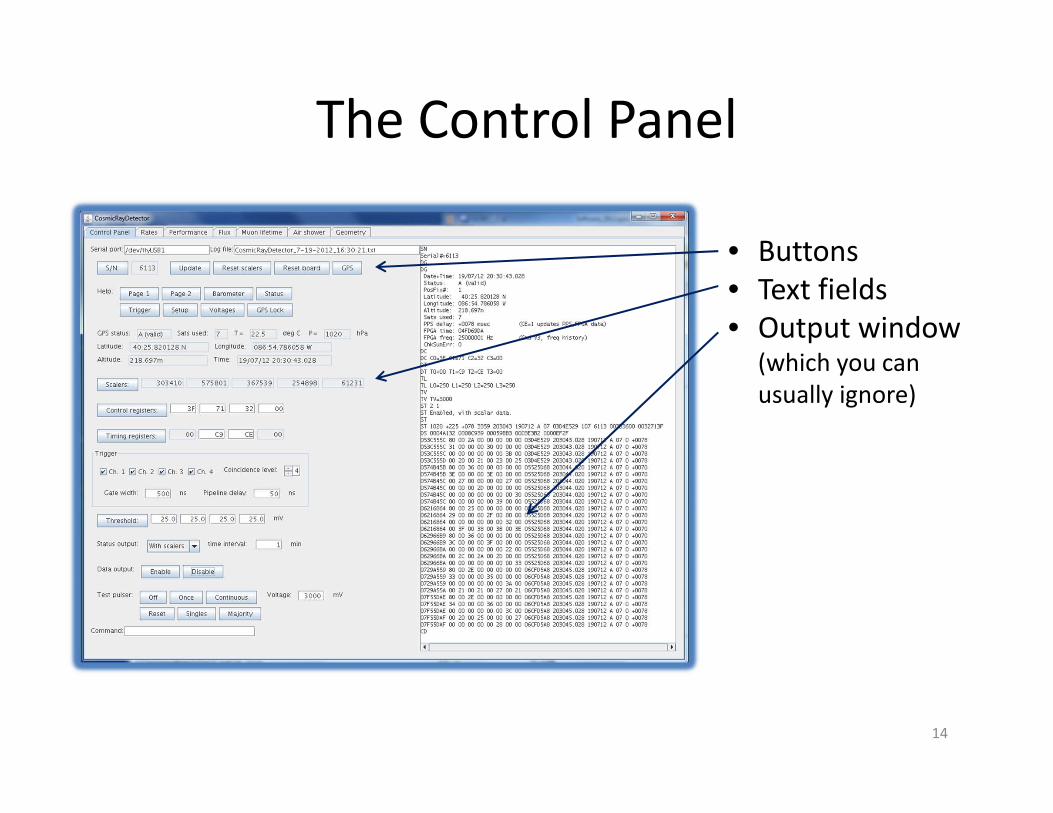
The Control Panel
14
• Buttons
• Text fields
• Output window (which you can
usually ignore)
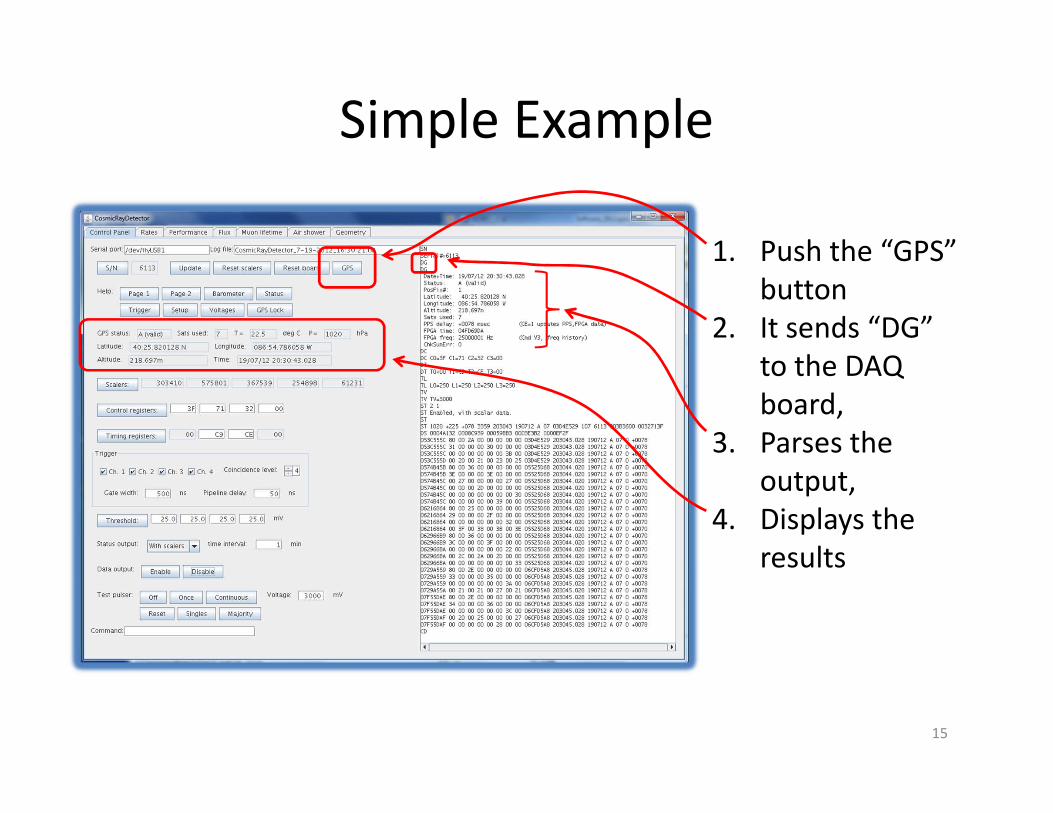
Simple Example
15
1. Push the “GPS”
button
2. It sends “DG”
to the DAQ
board,
3. Parses the
output,
4. Displays the
results
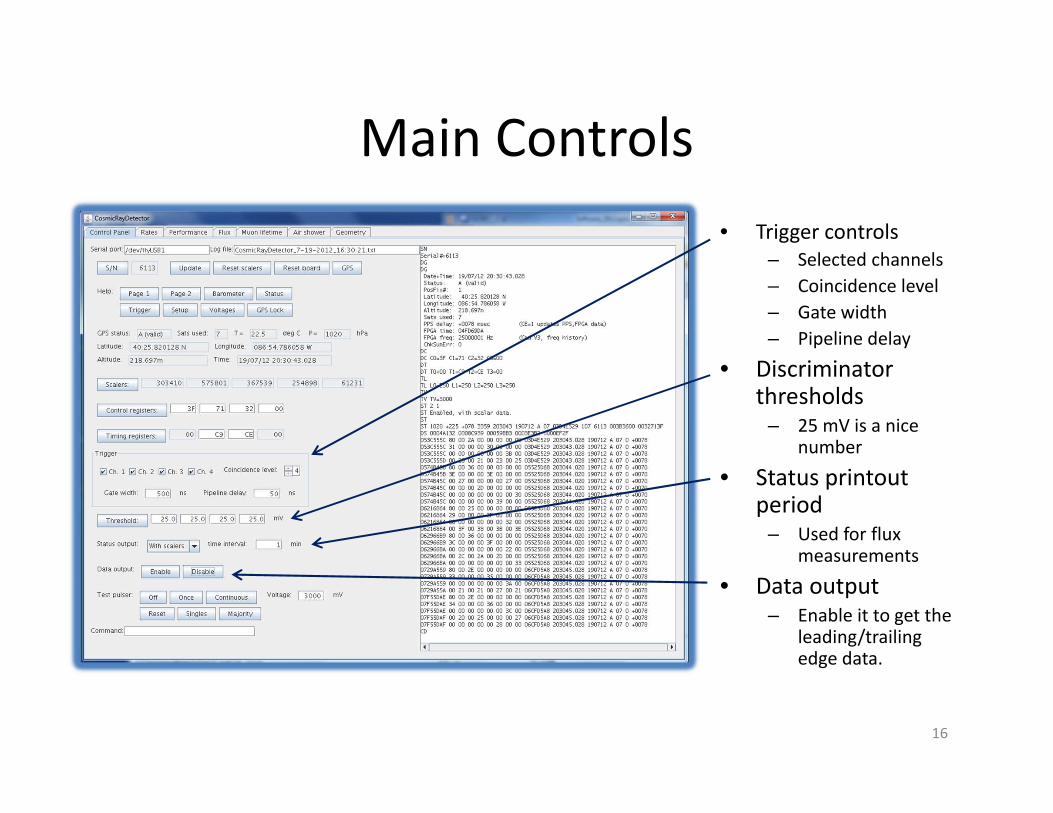
Main Controls
• Trigger controls
– Selected channels
– Coincidence level
– Gate width
– Pipeline delay
• Discriminator thresholds
– 25 mV is a nice number
• Status printout period
– Used for flux measurements
• Data output– Enable it to get the
leading/trailing edge data.
16
Rate Panel
17
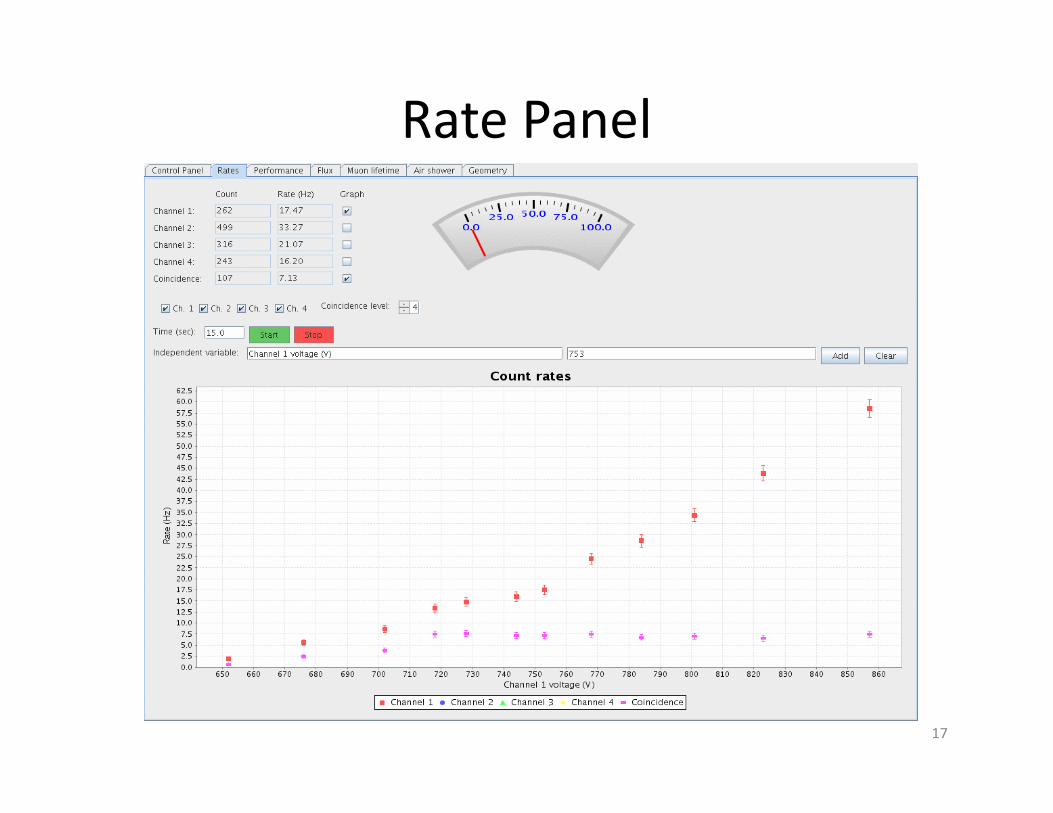
Rate Panel
• This closely resembles the old “Cosmic Ray Detector 3.0” program:– It measures count rates and coincidence rates in a specified
time interval
• Now it can graph the results for you
• Select which channels to put on the graph
• Independent variable is not specified… you can pick anything you want!– PMT voltage (eg, plateauing exercise)
– Which floor of the building you are on
– Azimuthal angle
– Distance between the scintillators
– Altitude (if you can fly the detector in an airplane)
– ???
18
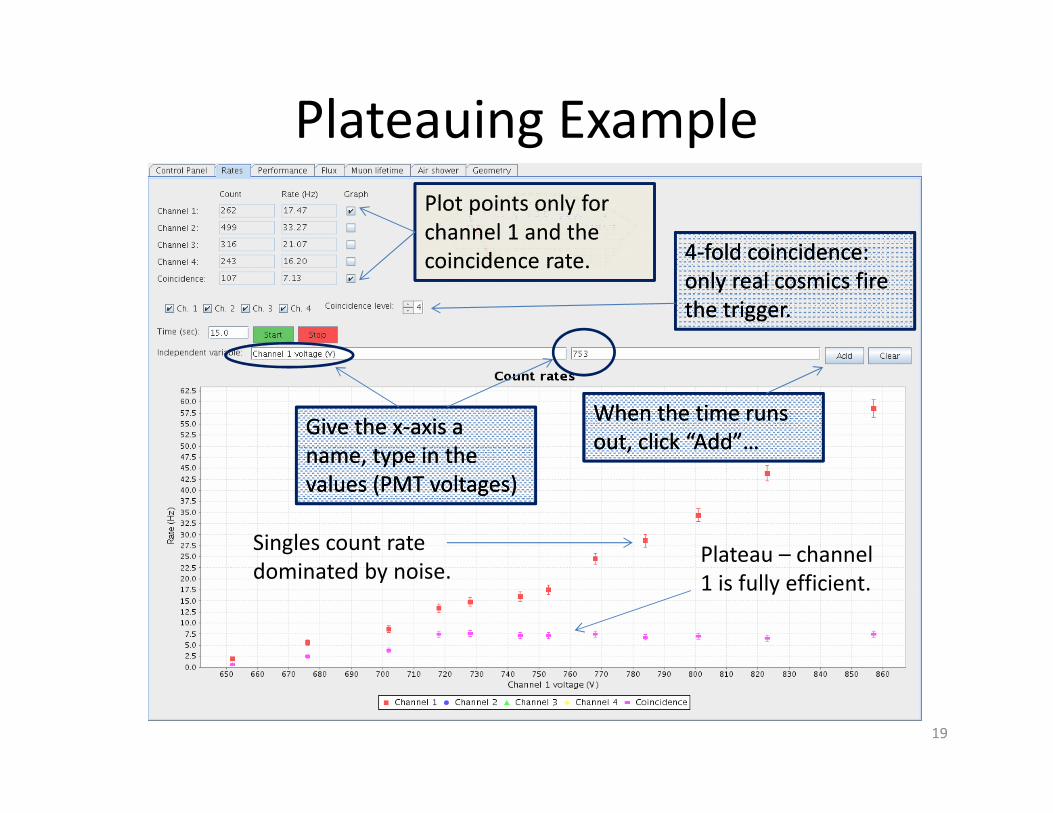
Plateauing Example
19
4-fold coincidence:
only real cosmics fire
the trigger.
4-fold coincidence:
only real cosmics fire
the trigger.
Plot points only for
channel 1 and the
coincidence rate.
Plot points only for
channel 1 and the
coincidence rate.
Give the x-axis a
name, type in the
values (PMT voltages)
Give the x-axis a
name, type in the
values (PMT voltages)
When the time runs
out, click “Add”…
When the time runs
out, click “Add”…
Plateau – channel
1 is fully efficient.
Singles count rate
dominated by noise.
Performance Panel
20
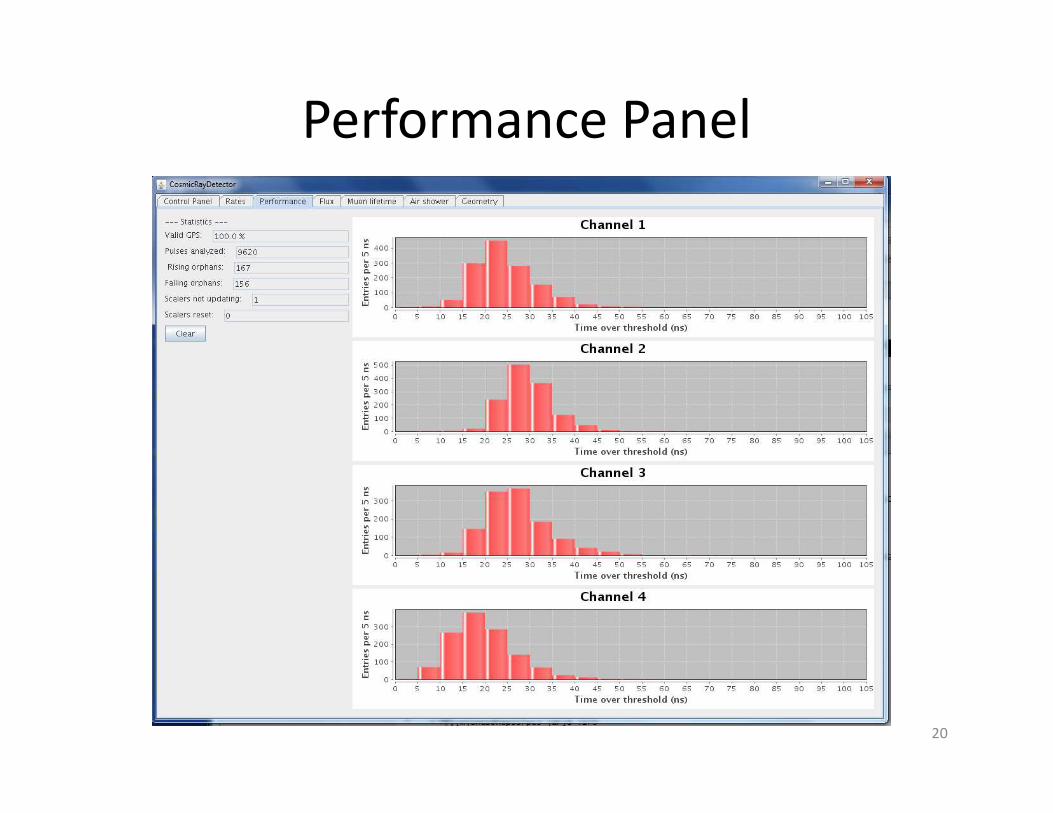
Performance Panel
• Makes histograms of time-over-threshold
• Don’t forget to enable data output!
• Checks data stream for:
– Valid/invalid GPS data
– Rising orphans (pulses that are cut off by the gate)
– Falling orphans (pulses that arrived before start of the gate)
– Number of times the counters didn’t change
– Number of times the counters were reset
• Roughly corresponds to criteria used to “bless” data sets uploaded for the cosmic ray e-lab
• Examples:
– Compare time-over-threshold distributions as the discriminator threshold is changed…
– Compare distributions with single and 4-fold coincidence.
– Are noise pulses and pulses from cosmics the same or different?
21
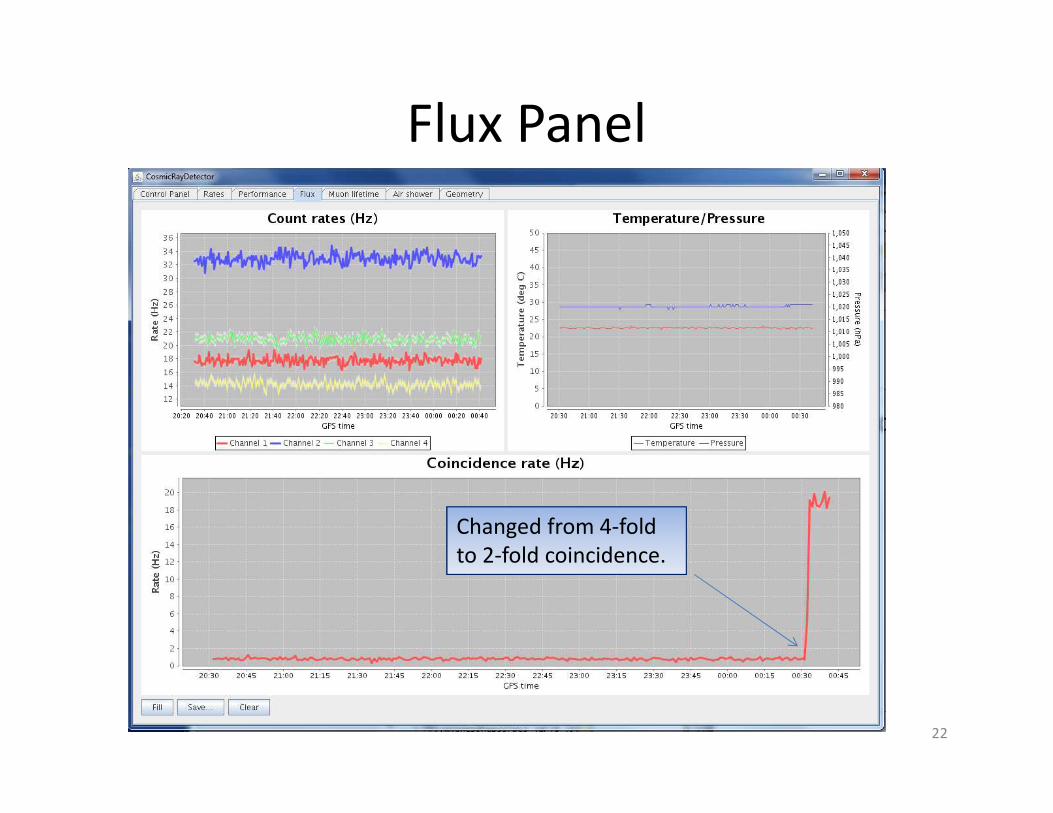
Flux Panel
22
Changed from 4-fold
to 2-fold coincidence.
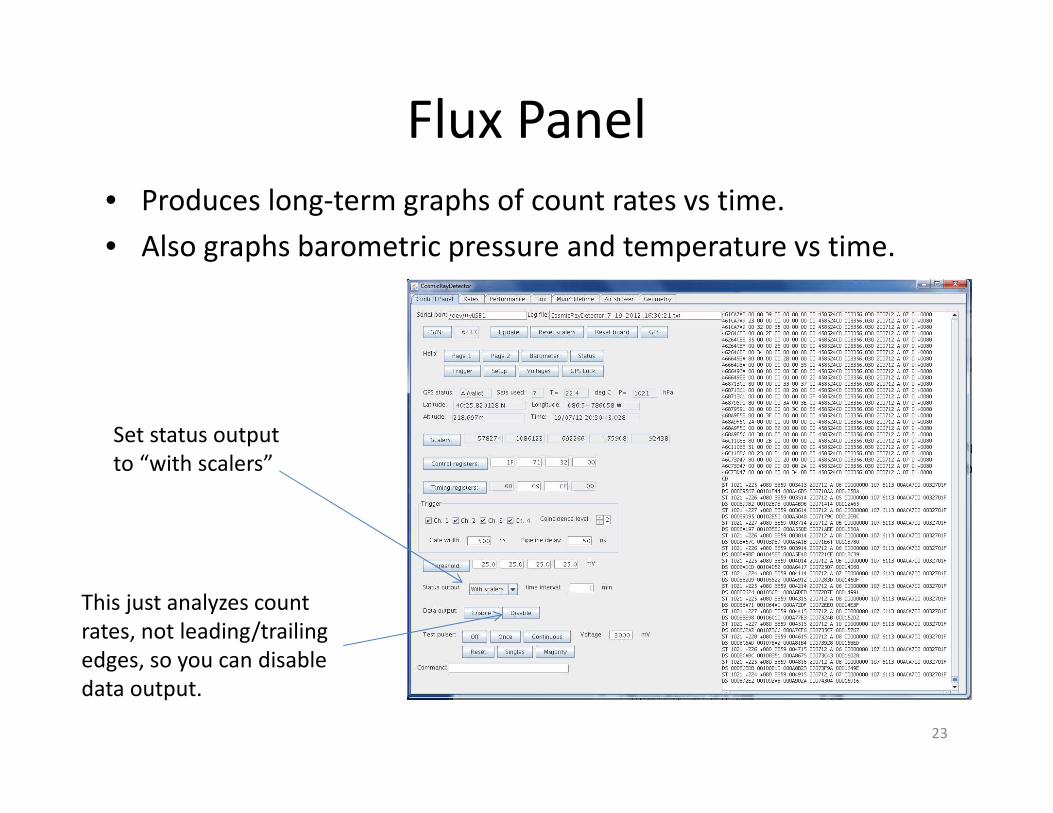
Flux Panel
• Produces long-term graphs of count rates vs time.
• Also graphs barometric pressure and temperature vs time.
23
Set status output
to “with scalers”
This just analyzes count
rates, not leading/trailing
edges, so you can disable
data output.
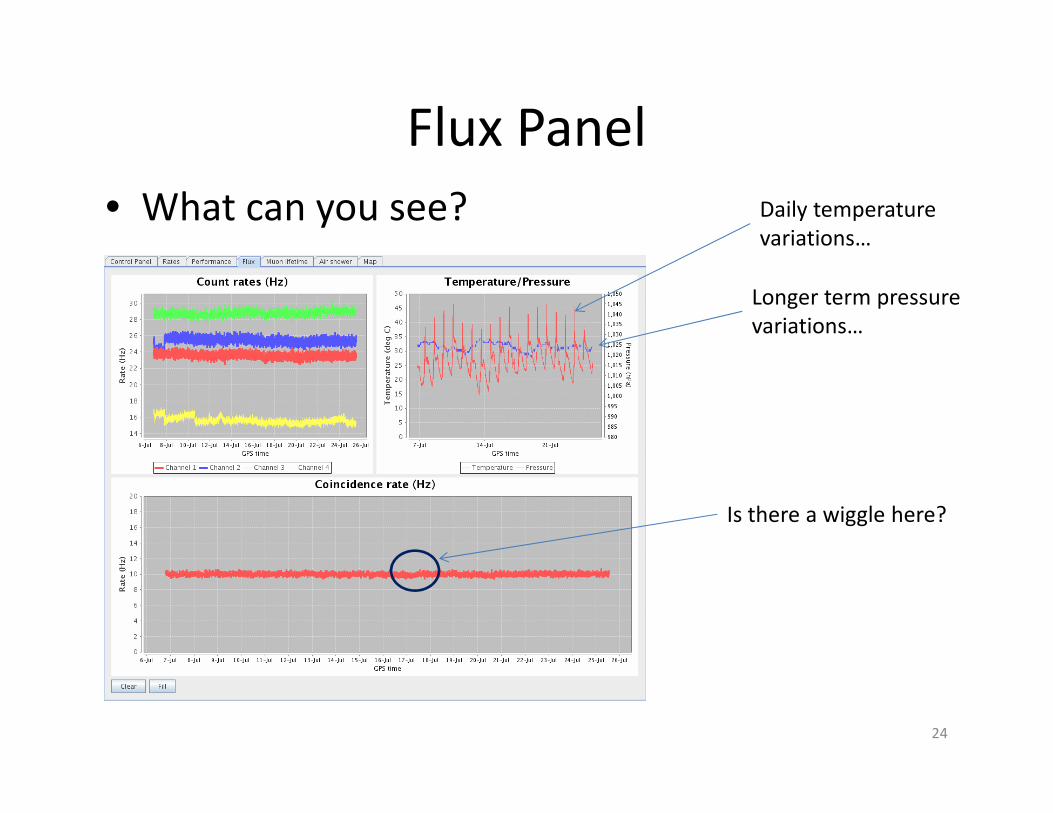
Flux Panel
• What can you see?
24
Daily temperature
variations…
Longer term pressure
variations…
Is there a wiggle here?

Solar Weather
• Solar flares produce lots of protons that eventually
reach earth
• They are low energy protons
– They do not make cosmic rays
– They do modify the Earth’s magnetic field
• The Earth’s magnetic field deflects high energy protons
– Modification of the Earths’ magnetic field should affect
counting rates
– But by how much?
• Can we observe solar flares?
25
Solar Flares
• Some resources:
– NOAA satellite data:
http://www.swpc.noaa.gov/Data/index.html
– Spaceweather.com:
http://www.spaceweather.com
• NASA satellites measure the strength of the
magnetic field every minute.
– You can download the data for free
– You can graph it in Excel (or whatever)
26
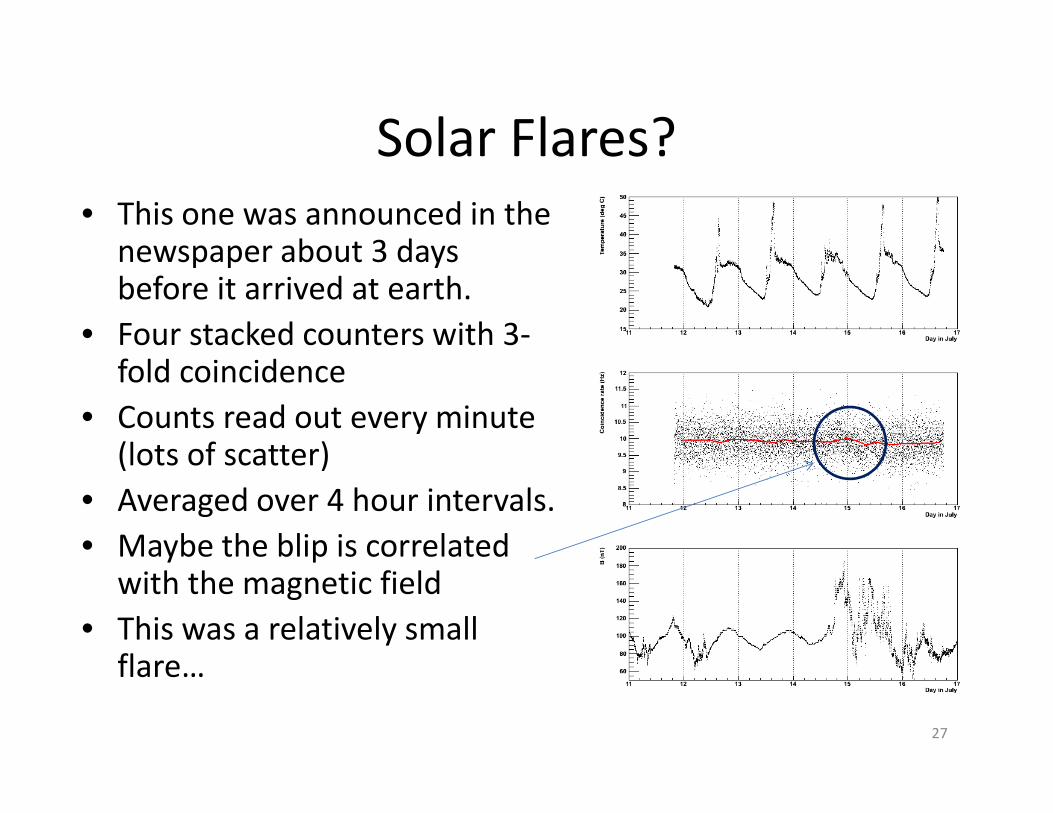
Solar Flares?
• This one was announced in the newspaper about 3 days before it arrived at earth.
• Four stacked counters with 3-fold coincidence
• Counts read out every minute (lots of scatter)
• Averaged over 4 hour intervals.
• Maybe the blip is correlated with the magnetic field
• This was a relatively small flare…
27
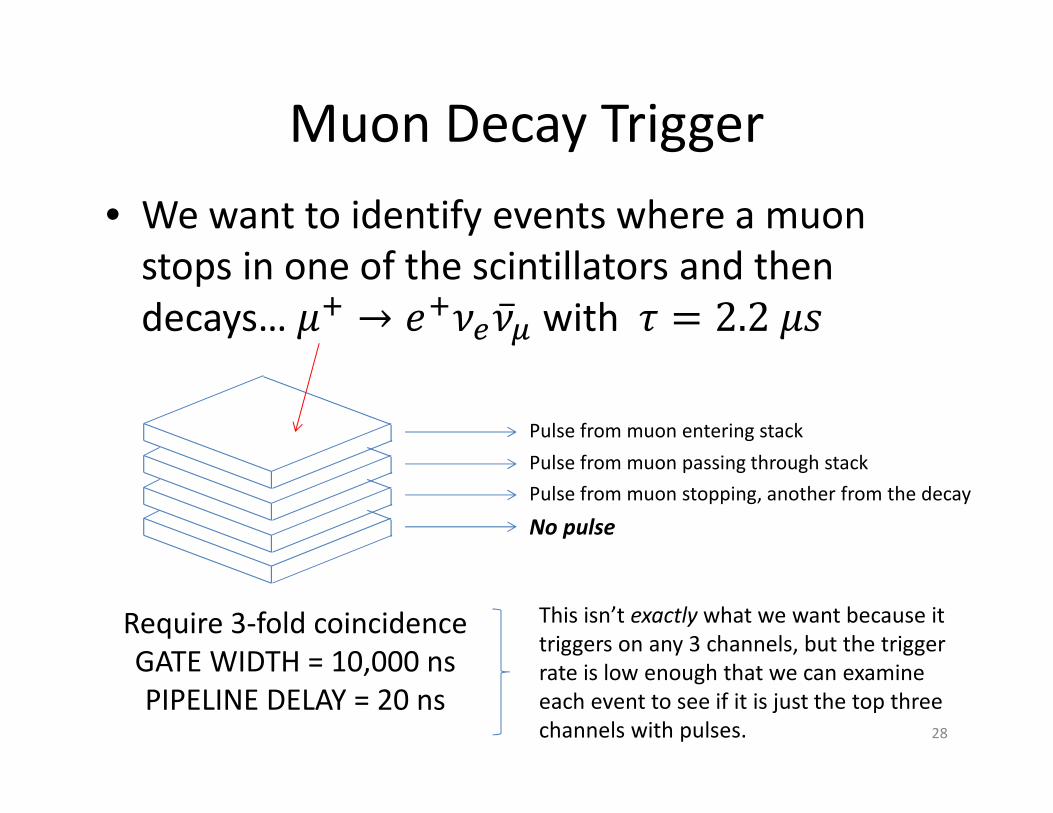
Muon Decay Trigger
• We want to identify events where a muon
stops in one of the scintillators and then
decays… �� → �����̅� with = 2.2��
Pulse from muon entering stack
Pulse from muon passing through stack
Pulse from muon stopping, another from the decay
No pulse
Require 3-fold coincidence
GATE WIDTH = 10,000 ns
PIPELINE DELAY = 20 ns
This isn’t exactly what we want because it
triggers on any 3 channels, but the trigger
rate is low enough that we can examine
each event to see if it is just the top three
channels with pulses. 28
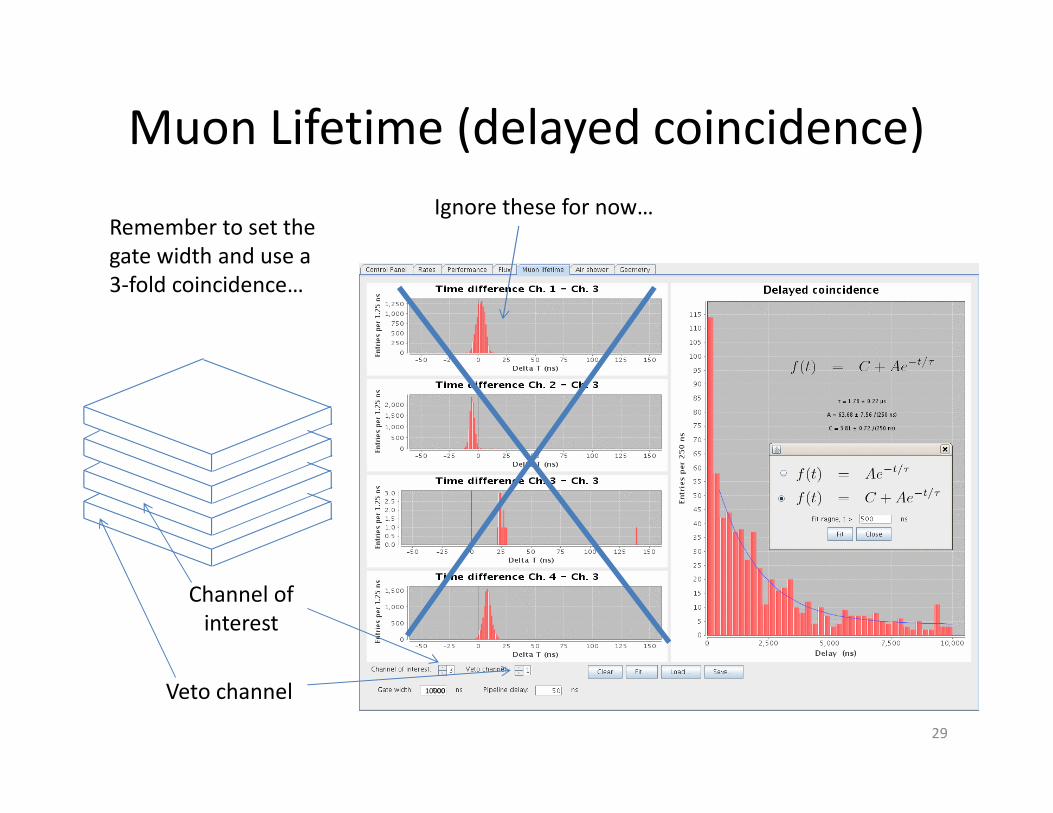
Muon Lifetime (delayed coincidence)
29
Veto channel
Channel of
interest
10000
Remember to set the
gate width and use a
3-fold coincidence…
Ignore these for now…
Muon Lifetime
• In about an hour you should get 5-10 muon decay events.
– Leave it running over night or over the weekend for better statistics
• The fit panel lets you chose whether to consider the possibility of a background component distributed uniformly in time.
• You can skip the early data since these might come from air showers.
– How does the fitted lifetime depend on these assumptions?
– How much data would you need to measure the muonlifetime with a precision of 10%?
– How about 1%?
30
Measuring the Speed of Cosmic Rays
• The “Muon Lifetime” panel also measures the time
between pulses on each channel and the “channel of
interest”
• It calculates the mean (with uncertainty) of the time
difference distributions.
• The time between pulses depends on the distance
between the scintillators.
• Remember, the speed of light is 1 ft/ns…
31
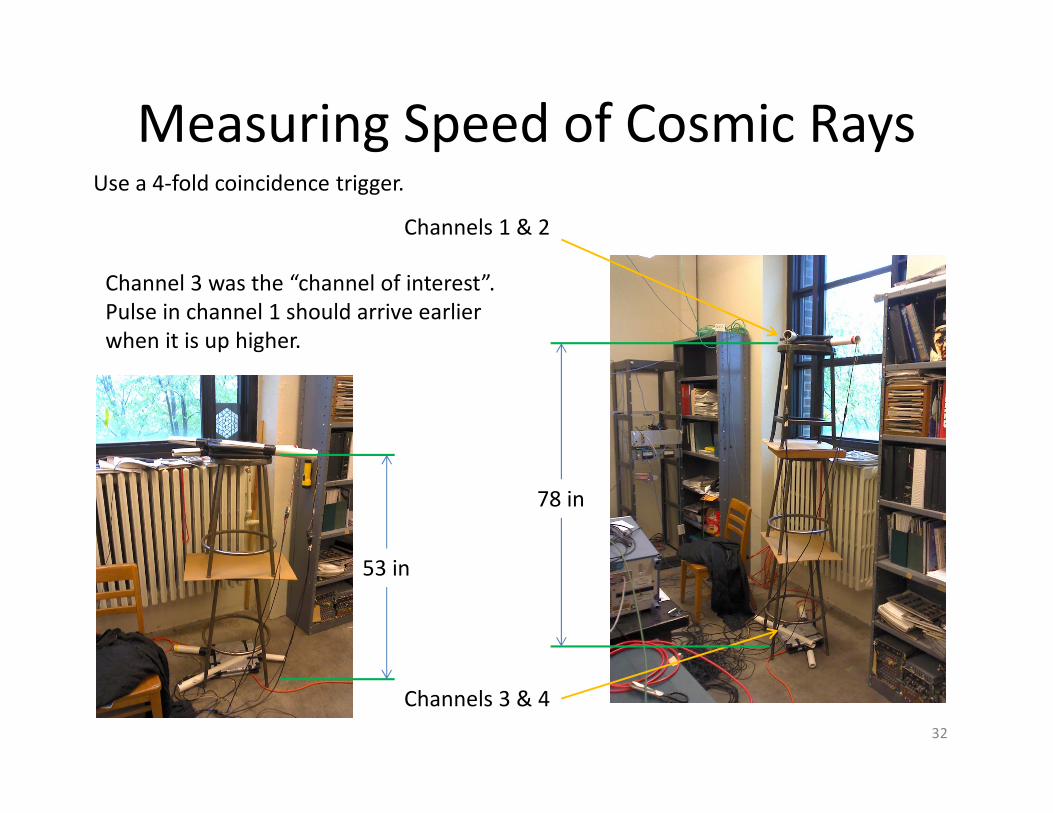
Measuring Speed of Cosmic Rays
32
Channels 1 & 2
Channels 3 & 4
53 in
78 in
Channel 3 was the “channel of interest”.
Pulse in channel 1 should arrive earlier
when it is up higher.
Use a 4-fold coincidence trigger.
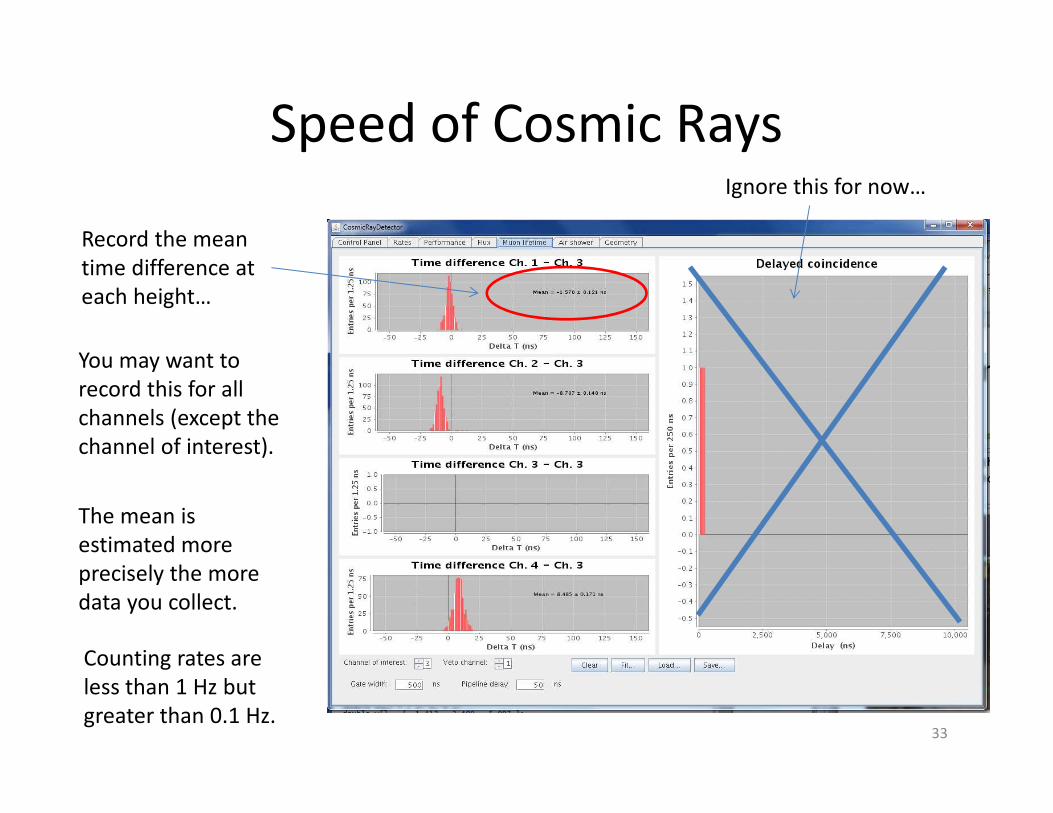
Speed of Cosmic Rays
33
Ignore this for now…
Record the mean
time difference at
each height…
You may want to
record this for all
channels (except the
channel of interest).
The mean is
estimated more
precisely the more
data you collect.
Counting rates are
less than 1 Hz but
greater than 0.1 Hz.
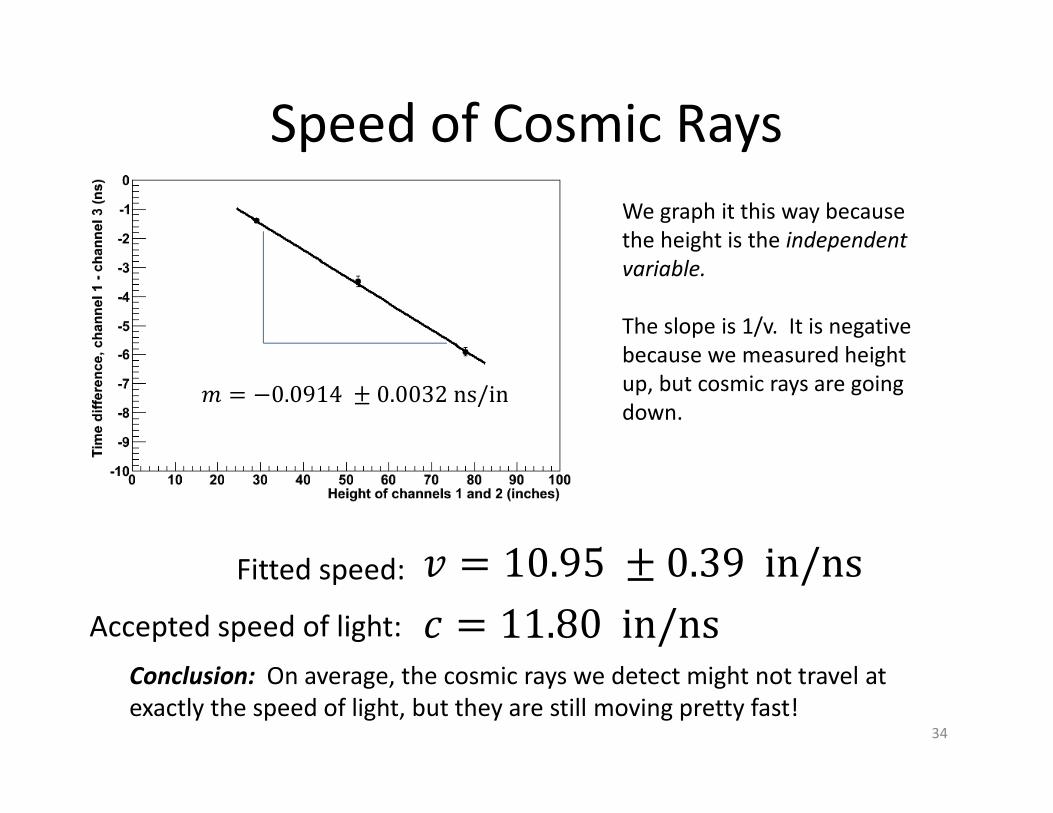
Speed of Cosmic Rays
34
We graph it this way because
the height is the independent
variable.
The slope is 1/v. It is negative
because we measured height
up, but cosmic rays are going
down.
� = 10.95 ± 0.39in/ns
� = 11.80in/nsAccepted speed of light:
Fitted speed:
� = −0.0914 ± 0.0032ns/in
Conclusion: On average, the cosmic rays we detect might not travel at
exactly the speed of light, but they are still moving pretty fast!
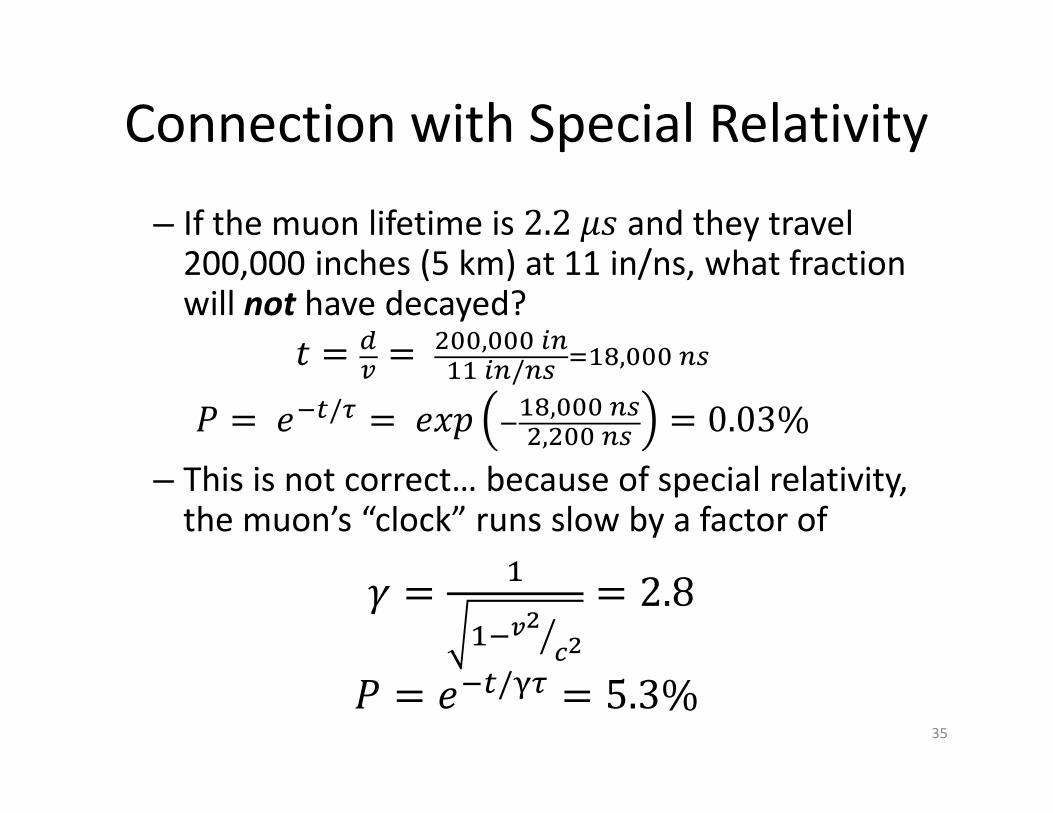
Connection with Special Relativity
– If the muon lifetime is 2.2�� and they travel 200,000 inches (5 km) at 11 in/ns, what fraction will not have decayed?
� = ! =
"##,###%&''%&/&( )'*,###&(
+ = �,-/. =�/0 ,'*,###&(","##&( = 0.03%
– This is not correct… because of special relativity, the muon’s “clock” runs slow by a factor of
2 ='
',34546
= 2.8
+ = �,-/7. = 5.3%35
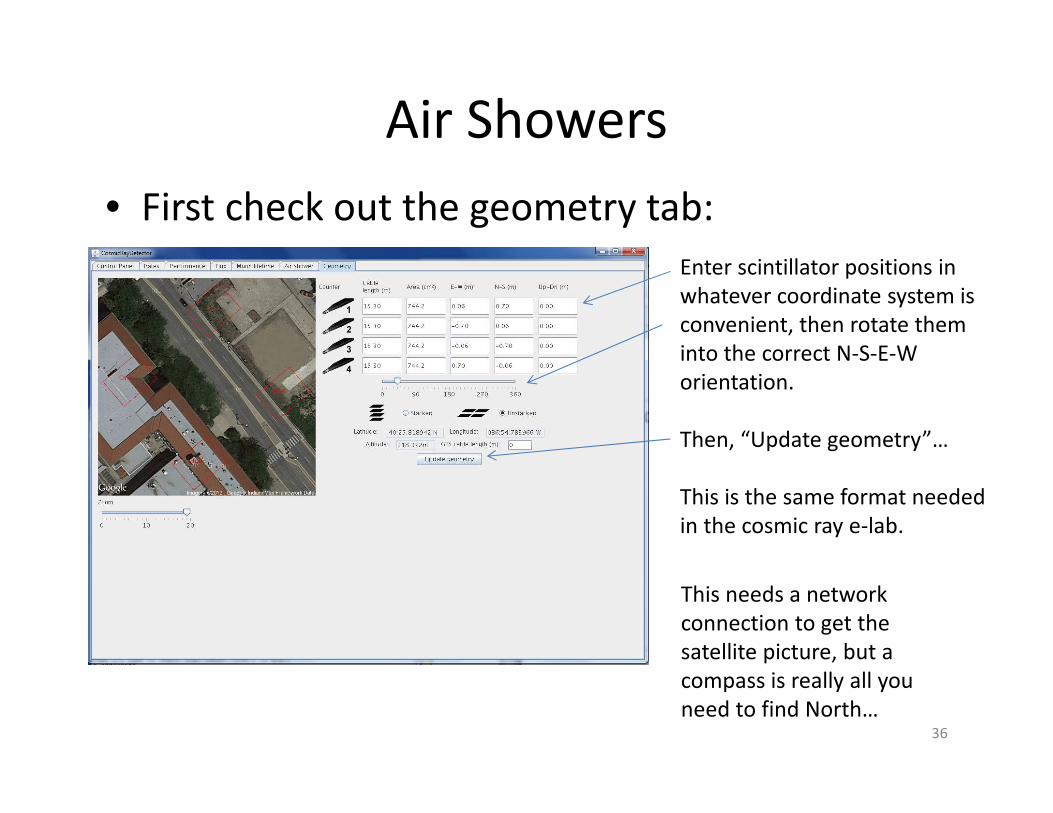
Air Showers
• First check out the geometry tab:
36
Enter scintillator positions in
whatever coordinate system is
convenient, then rotate them
into the correct N-S-E-W
orientation.
Then, “Update geometry”…
This is the same format needed
in the cosmic ray e-lab.
This needs a network
connection to get the
satellite picture, but a
compass is really all you
need to find North…
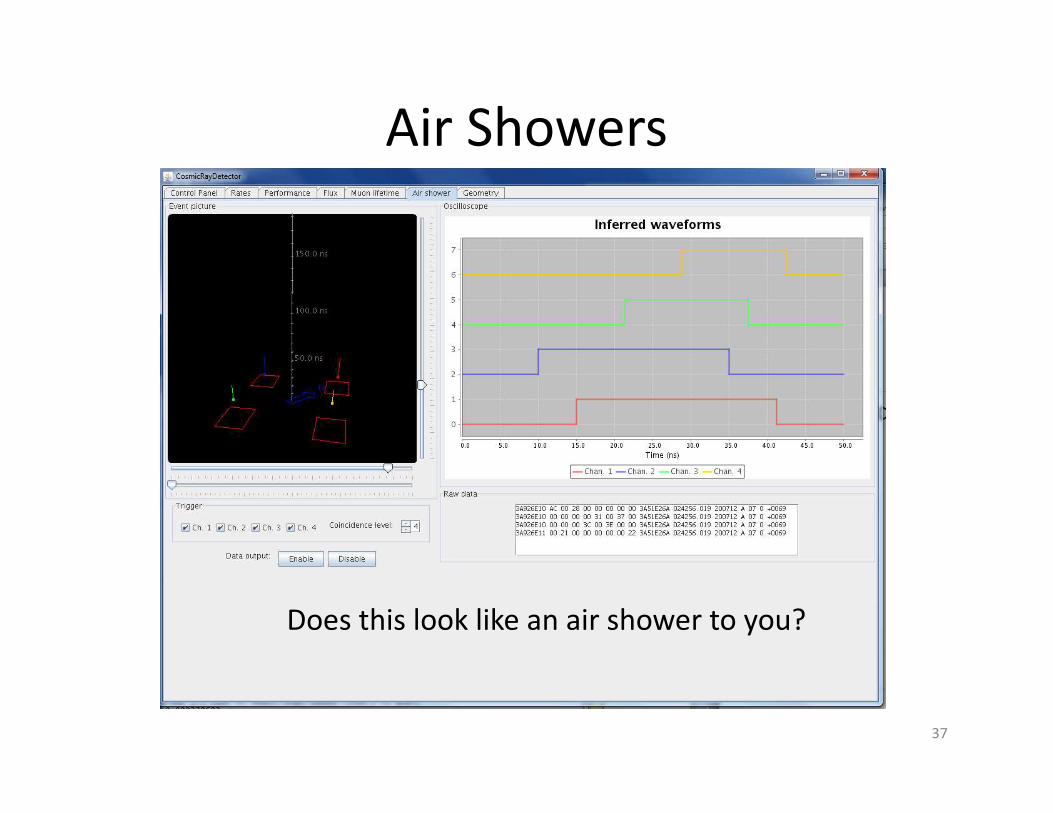
Air Showers
37
Does this look like an air shower to you?
Suggestions for Experiments
• Count rates:
– Plateauing exercise
– Coincidence rates with detector oriented N-S or E-W or as a function of angle
– Count rates on different floors of the building
– Does anyone have a pilot’s license? Could we fly the cosmic ray detector in an airplane and measure count rates as a function of altitude?
– Measure count rates for different discriminator thresholds
– Measure actual thresholds using the test pulser
38
Suggestions for Experiments
• Performance plots
– Compare time-over-threshold distributions for
single and 3-fold coincidence
– How does time-over-threshold distribution change
with PMT voltage?
– How does time-over-threshold distribution change
with discriminator threshold?
– Play with the test pulser…
39
Suggestions for Experiments
• Flux measurements:
– Does the 3-fold coincidence rate depend on
barometric pressure? Temperature? Weather?
– Can you see evidence for solar flares? Correlate
wiggles in count rate with NASA satellite data…
– Are count rates at different locations correlated?
40
Suggestions for Experiments
• Muon lifetime/delayed coincidence
– How much data do you need to collect to achieve a certain precision on the fitted lifetime?
– How does the fitted lifetime depend on the assumptions used in the fit? How robust is it?
– Speed of cosmic rays… fit data using linear regression in Excel. Can you estimate the uncertainty on the speed?
– Add extra cable… check that the time differences change the way you expect.
41
Summary
• We hope that the new software interface
makes the cosmic ray detector very easy to
use.
• There are lots of experiments you can do to
investigate the properties of cosmic rays.
• Most can be done or at least set up in less
than an hour.
• Have fun!
42