Copyright © 2009 Pearson Addison-Wesley. All rights reserved. Chapter 1 What Is Macroeconomics?
22
Copyright © 2009 Pearson Addison-Wesley. All rights reserved. Chapter 1 What Is Macroeconomics ?
-
date post
20-Dec-2015 -
Category
Documents
-
view
240 -
download
1
Transcript of Copyright © 2009 Pearson Addison-Wesley. All rights reserved. Chapter 1 What Is Macroeconomics?

Copyright © 2009 Pearson Addison-Wesley. All rights reserved.
Chapter 1
What Is Macroeconomics?
Copyright © 2009 Pearson Addison-Wesley. All rights reserved. 1-2
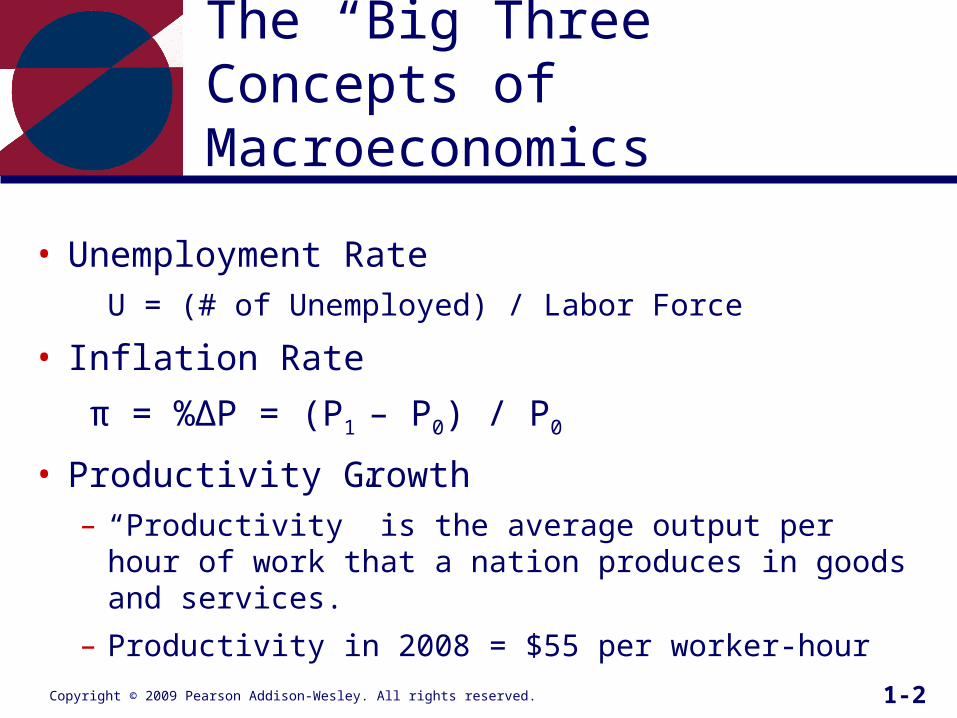
The “Big Three” Concepts of Macroeconomics
• Unemployment RateU = (# of Unemployed) / Labor Force
• Inflation Rate
π = %ΔP = (P1 – P0) / P0
• Productivity Growth– “Productivity” is the average output per hour of work that
a nation produces in goods and services.
– Productivity in 2008 = $55 per worker-hour
Copyright © 2009 Pearson Addison-Wesley. All rights reserved. 1-3
Macroeconomics vs. Microeconomics
• Macroeconomics deals with the totals, or aggregates, of the economy such as:– The unemployment rate (of all U.S. workers)
– Inflation (i.e. the rise of all prices in the U.S.)
• Microeconomics deals with parts of the economy like:– The unemployment rate of low-skilled workers in a
certain state
– The price of cars

Copyright © 2009 Pearson Addison-Wesley. All rights reserved. 1-4
Gross Domestic Product (GDP)
• Definition: (Nominal) GDP is the value of all currently produced goods and services sold on the market during a particular time interval.– Real GDP adjusts the value of total output to correct for
changes in prices.• Sometimes referred to as Actual Real GDP
– Natural Real GDP is the level of real GDP in which there is no tendency for inflation to rise or fall.

Copyright © 2009 Pearson Addison-Wesley. All rights reserved. 1-5
Figure 1-1 The Relation Between Actual and Natural Real GDP and the Inflation Rate
Copyright © 2009 Pearson Addison-Wesley. All rights reserved. 1-6
Unemployment: Actual and Natural
• Actual Unemployment (U) is the unemployment rate observed in the economy.
• The Natural Rate of Unemployment (U*) is the rate of unemployment at which there is no tendency for inflation to rise or fall.– If U > U* π rises
– If U < U* π falls
Copyright © 2009 Pearson Addison-Wesley. All rights reserved. 1-7
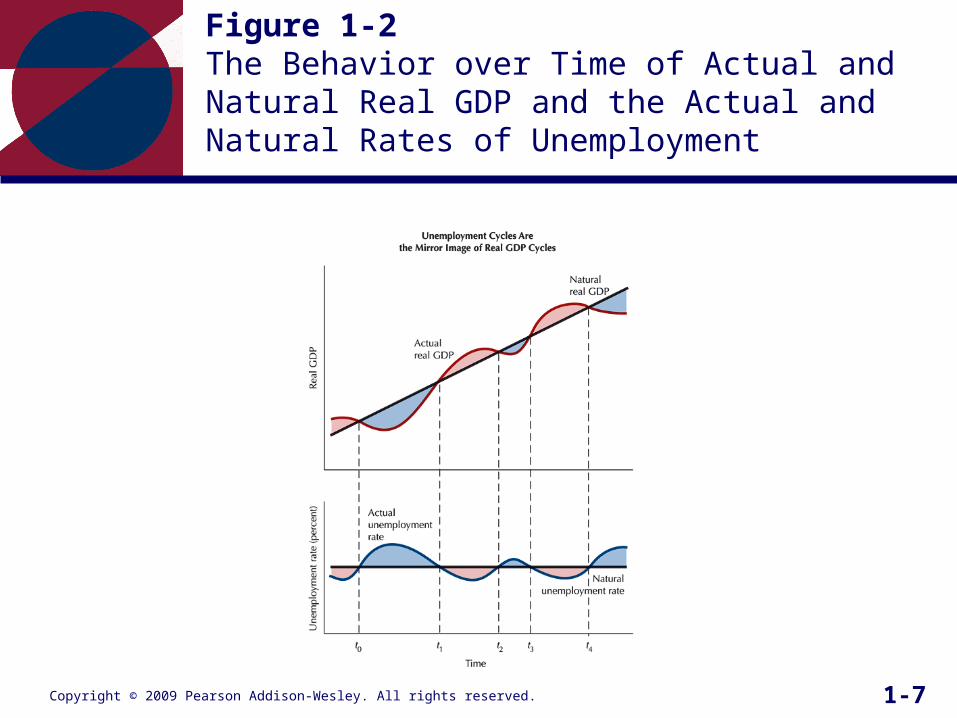
Figure 1-2 The Behavior over Time of Actual and Natural Real GDP and the Actual and Natural Rates of Unemployment

Copyright © 2009 Pearson Addison-Wesley. All rights reserved. 1-8
Short Run vs. Long Run
• The “short run” lasts from 1-5 years and the main issue is the stability of the economy.– The ups and downs (or “economic fluctuations”) of an
economy are part of the business cycle. The business cycle has the following phases:
• Expansion
• Contraction
• The “long run” ranges from one to several decades and is concerned with economic growth.
Copyright © 2009 Pearson Addison-Wesley. All rights reserved. 1-9
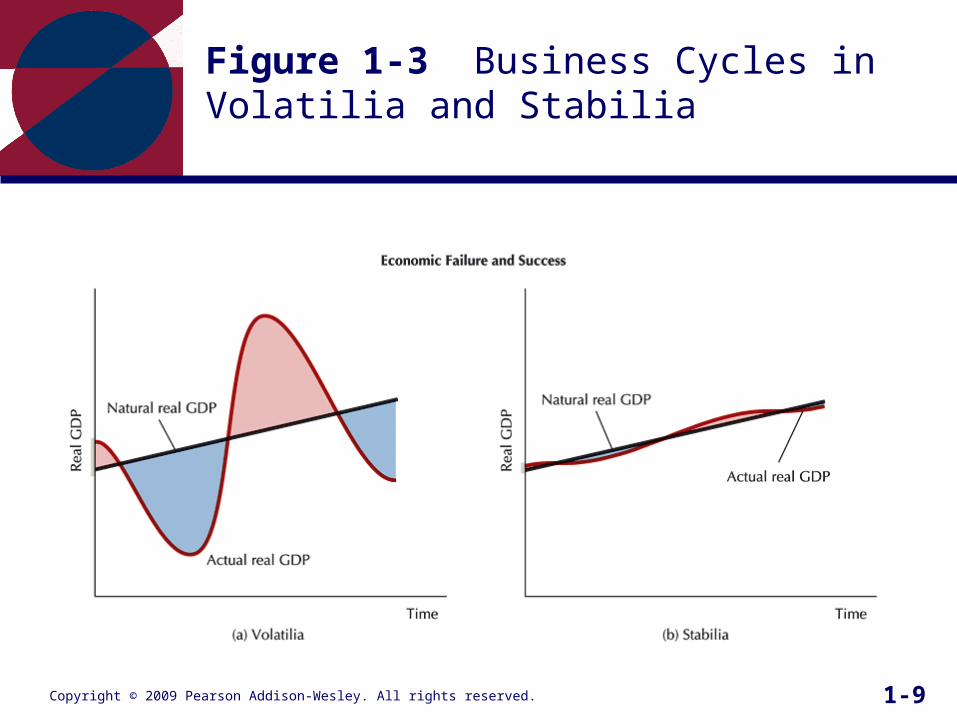
Figure 1-3 Business Cycles in Volatilia and Stabilia

Copyright © 2009 Pearson Addison-Wesley. All rights reserved. 1-10
Figure 1-4 Basic Business-Cycle Concepts

Copyright © 2009 Pearson Addison-Wesley. All rights reserved. 1-11
Figure 1-5 Economic Growth in Stag-Nation and Speed-Nation
Copyright © 2009 Pearson Addison-Wesley. All rights reserved. 1-12
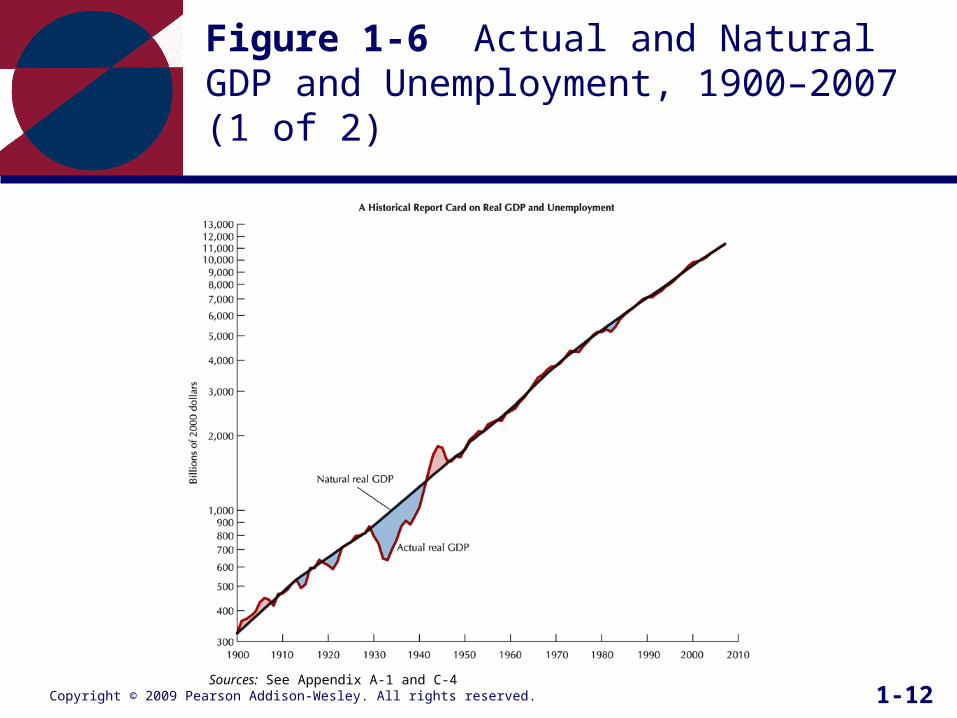
Figure 1-6 Actual and Natural GDP and Unemployment, 1900–2007 (1 of 2)
Sources: See Appendix A-1 and C-4

Copyright © 2009 Pearson Addison-Wesley. All rights reserved. 1-13
Figure 1-6 Actual and Natural GDP and Unemployment, 1900–2007 (2 of 2)
Sources: See Appendix A-1 and C-4

Copyright © 2009 Pearson Addison-Wesley. All rights reserved. 1-14
Figure 1-6 Actual and Natural GDP and Unemployment, 1900–2007
Sources: See Appendix A-1 and C-4
Copyright © 2009 Pearson Addison-Wesley. All rights reserved. 1-15
Macroeconomics at the Extremes
• Three examples of the breakdown of normal macroeconomic mechanisms:– The Great Depression of the 1930s
– The German hyperinflation of the 1920s
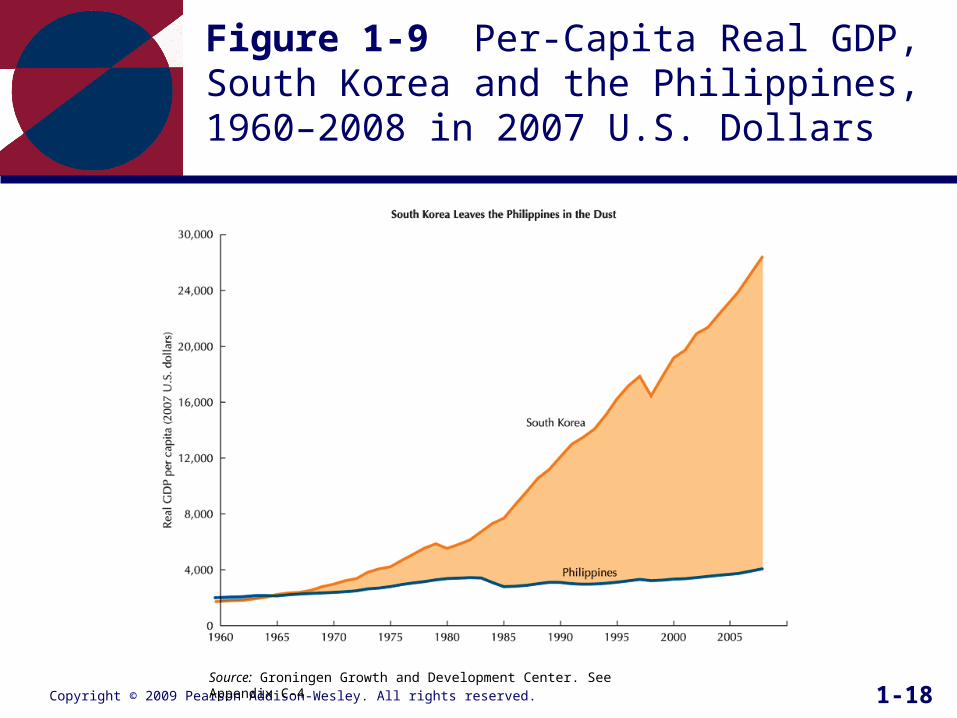
– South Korea vs. Philippines economic growth in the last 50 years
Copyright © 2009 Pearson Addison-Wesley. All rights reserved. 1-16
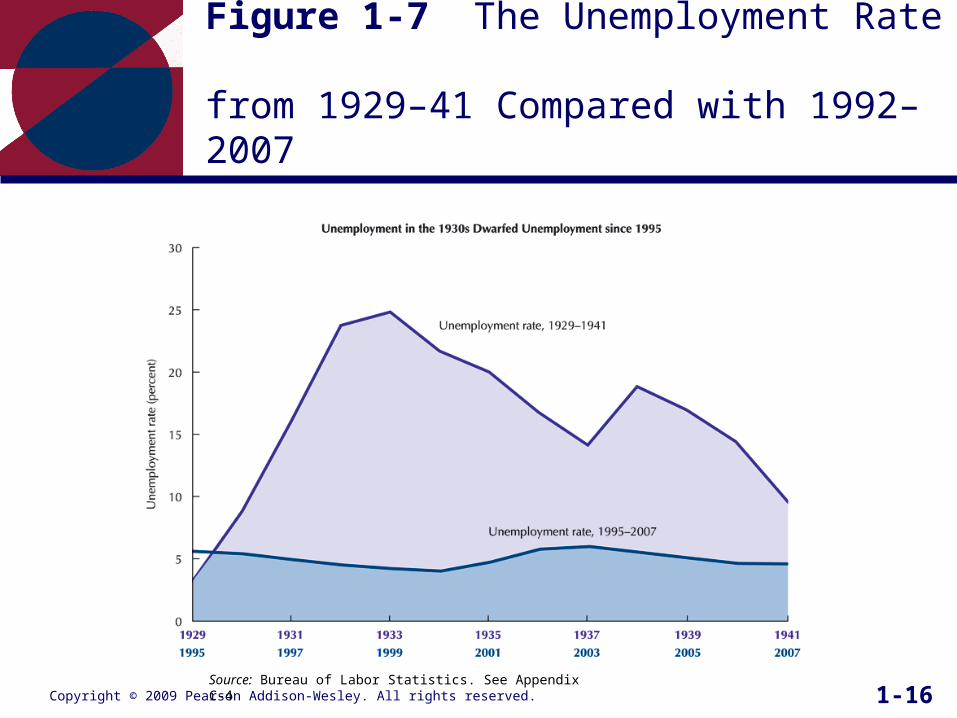
Figure 1-7 The Unemployment Rate from 1929–41 Compared with 1992–2007
Source: Bureau of Labor Statistics. See Appendix C-4
Copyright © 2009 Pearson Addison-Wesley. All rights reserved. 1-17
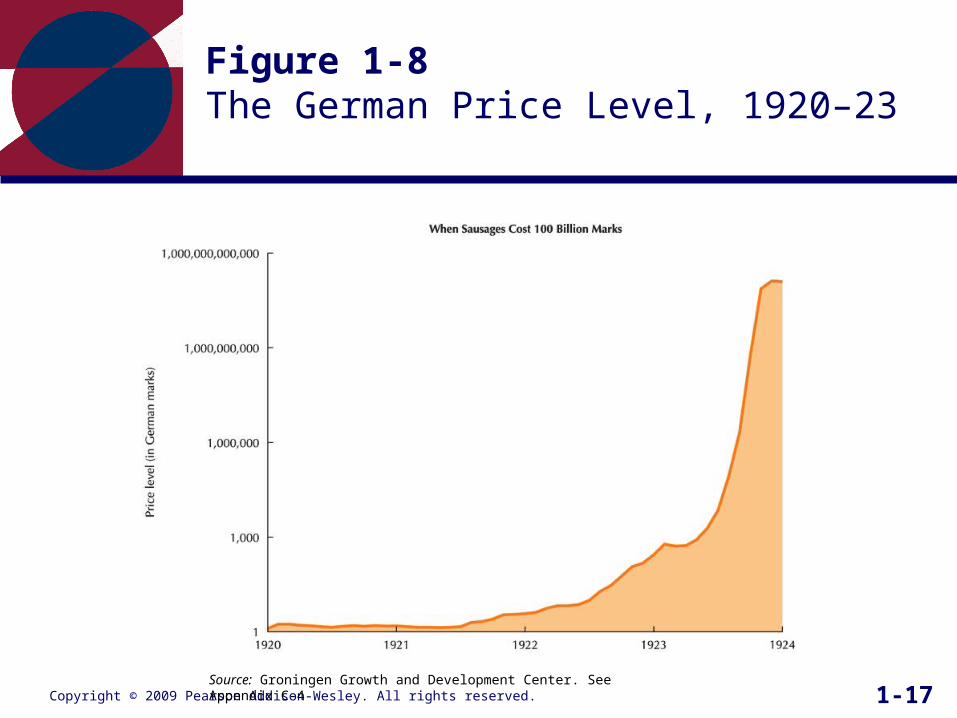
Figure 1-8 The German Price Level, 1920–23
Source: Groningen Growth and Development Center. See Appendix C-4
Copyright © 2009 Pearson Addison-Wesley. All rights reserved. 1-18
Figure 1-9 Per-Capita Real GDP, South Korea and the Philippines, 1960–2008 in 2007 U.S. Dollars
Source: Groningen Growth and Development Center. See Appendix C-4
Copyright © 2009 Pearson Addison-Wesley. All rights reserved. 1-19
Taming Business Cycles
• Macroeconomic analysts have two main tasks:– Analyze the causes of changes in macroeconomic
variables
– Predict the consequences of alternative policy changes
• Macroeconomic target variables important to analysts and policy makers include:– Inflation
– Unemployment
– Long-term growth of productivity
Copyright © 2009 Pearson Addison-Wesley. All rights reserved. 1-20
The Role of Stabilization Policy
• A Stabilization Policy is any policy that seeks to influence the level of aggregate demand.– Monetary policy tries to influence aggregate
demand by changing the money supply and/or interest rates.
– Fiscal policy tries to influence aggregate demand by changing government spending and/or tax rates.
Copyright © 2009 Pearson Addison-Wesley. All rights reserved. 1-21
The “Internationalization” of Macroeconomics
• A closed economy has no trade in goods, services, or financial assets with any other nations.– In the 1940s and 50s, the U.S. was relatively closed:
• Trade was 5% of the U.S. economy
• Exchange rates were fixed
• Financial flows to and from the U.S. were restricted
• An open economy exports and imports goods and services to and from other nations, and has financial flows to and from foreign nations.– Today the U.S. is increasingly open:
• Imports equal 17% of U.S. GDP
• Since 1973, the exchange rate of the $ has been flexible
• International financial flows are massive and almost instantaneous
Copyright © 2009 Pearson Addison-Wesley. All rights reserved. 1-22
Economic Performance of the U.S. vs. Europe
• Europe outperformed the U.S. from 1960–1985.
• But the U.S. has grown much more quickly than Europe since 1995.
• Puzzle #1: Why has European unemployment risen so much?
• Puzzle #2: Why has Europe not benefited from the adoption of computer and internet technology like the U.S?