
Comparison of an automated algorithm to expert physician interpretation of 80-lead body surface...
6
Comparison of an automated algorithm to expert physician interpretation of 80-lead body surface mapping in the evaluation of acute myocardial ischemia and infarction in patients presenting to the emergency department with chest pain: results from the Optimal Cardiovascular Diagnostic Evaluation Enabling Faster Treatment of Myocardial Infarction trial Cedric W. Lefebvre, MD, a, ⁎ Mitchell W. Krucoff, MD, b Brian C. Hiestand, MD, MPH, a Abhinav Chandra, MD, c Charles B. Cairns, MD, d Joseph Massaro, PhD, e James Hoekstra, MD a a Department of Emergency Medicine, Wake Forest University School of Medicine, Winston-Salem, NC, USA b Division of Cardiovascular Medicine, Duke University School of Medicine, Durham, NC, USA c Division of Emergency Medicine, Duke University School of Medicine, Durham, NC, USA d Department of Emergency Medicine, University of North Carolina School of Medicine, Chapel Hill, NC, USA e Boston University, School of Public Health, Boston, MA, USA Received 2 November 2011 Abstract Introduction/Background: Eighty-lead (80 L) body surface map (BSM) technology provides electrocardiogram data for the clinician to interpret. A BSM device also offers an automated interpretation. Little information is available about the performance of automated algorithm interpretation in comparison to human interpretation of the 80 L BSM. Methods: Interpretations of BSMs by automated algorithm and a core laboratory of physician readers from The Optimal Cardiovascular Diagnostic Evaluation Enabling Faster Treatment of Myocardial Infarction trial were compared. The κ statistic and its 95% confidence interval for concordance were calculated. The effect of BSM quality on concordance was also analyzed. Results: 3405 maps for 1601 subjects were reviewed by the core laboratory and automated algorithm. There was a combined concordance rate of 87.3% (κ =0.46; 95% confidence interval, 0.40-0.52). A decrease in signal quality was associated with a decrease in concordance between human and automated algorithm interpretation (κ =0.52 for good quality vs κ =0.30 for poor quality). Conclusion: A moderate degree of concordance was noted between physician and automated algorithm interpretation of 80 L BSMs. Signal quality of 80 L electrocardiographic BSM directly affected concordance. © 2012 Elsevier Inc. All rights reserved. Keywords: Body surface mapping; Electrocardiography; Eighty-lead ECG; 80-lead ECG; Twelve-lead ECG; 12-lead ECG; Automated algorithm; ECG interpretation; OCCULT MI trial Introduction Body surface mapping (BSM) has demonstrated an ability to improve the current diagnostic paradigm for acute myocardial infarction (AMI) and may become a practical and effective tool in the early evaluation of patients presenting with symptoms concerning for acute coronary syndrome. 1-10 The electrocardiographic data captured by a BSM device can be interpreted by the clinician at the bedside. Eighty-lead (80 L) BSM technology provides real-time electrocardiographic (ECG) tracings at each lead (Fig. 1), a colorimetric 2D map, and a 3D torso view which are available for review and interpretation (Fig. 2). The BSM device also offers an automated algorithmic interpretation. Little information is available, however, about the perfor- mance of automated algorithm interpretation in comparison to human interpretation of 80 L maps. We compared the interpretations of 80 L maps by a core laboratory of ex- perienced physician readers to the interpretations generated by an automated algorithm programmed into the PRIME Available online at www.sciencedirect.com Journal of Electrocardiology 45 (2012) 702 – 707 www.jecgonline.com ⁎ Corresponding author. Wake Forest University School of Medicine, 1 Medical Center Boulevard, Winston-Salem, NC 27106, USA. E-mail address: [email protected] 0022-0736/$ – see front matter © 2012 Elsevier Inc. All rights reserved. http://dx.doi.org/10.1016/j.jelectrocard.2012.07.002
Transcript of Comparison of an automated algorithm to expert physician interpretation of 80-lead body surface...

Available online at www.sciencedirect.com
Journal of Electrocardiology 45 (2012) 702–707www.jecgonline.com
Comparison of an automated algorithm to expert physician interpretationof 80-lead body surface mapping in the evaluation of acute myocardialischemia and infarction in patients presenting to the emergency departmentwith chest pain: results from the Optimal Cardiovascular DiagnosticEvaluation Enabling Faster Treatment of Myocardial Infarction trialCedric W. Lefebvre, MD, a,⁎ Mitchell W. Krucoff, MD, b Brian C. Hiestand, MD, MPH, a
Abhinav Chandra, MD, c Charles B. Cairns, MD, d Joseph Massaro, PhD, e James Hoekstra, MDa
aDepartment of Emergency Medicine, Wake Forest University School of Medicine, Winston-Salem, NC, USAbDivision of Cardiovascular Medicine, Duke University School of Medicine, Durham, NC, USA
c Division of Emergency Medicine, Duke University School of Medicine, Durham, NC, USAdDepartment of Emergency Medicine, University of North Carolina School of Medicine, Chapel Hill, NC, USA
e Boston University, School of Public Health, Boston, MA, USA
Received 2 November 2011
Abstract Introduction/Background: Eighty-lead (80L) body surface map (BSM) technology provides
⁎ Corresponding aMedical Center Boule
E-mail address: cl
0022-0736/$ – see frohttp://dx.doi.org/10.10
electrocardiogram data for the clinician to interpret. A BSM device also offers an automatedinterpretation. Little information is available about the performance of automated algorithminterpretation in comparison to human interpretation of the 80L BSM.Methods: Interpretations of BSMs by automated algorithm and a core laboratory of physicianreaders from The Optimal Cardiovascular Diagnostic Evaluation Enabling Faster Treatment ofMyocardial Infarction trial were compared. The κ statistic and its 95% confidence interval forconcordance were calculated. The effect of BSM quality on concordance was also analyzed.Results: 3405 maps for 1601 subjects were reviewed by the core laboratory and automated algorithm.There was a combined concordance rate of 87.3% (κ=0.46; 95% confidence interval, 0.40-0.52). Adecrease in signal quality was associated with a decrease in concordance between human andautomated algorithm interpretation (κ=0.52 for good quality vs κ=0.30 for poor quality).Conclusion: A moderate degree of concordance was noted between physician and automatedalgorithm interpretation of 80L BSMs. Signal quality of 80L electrocardiographic BSM directlyaffected concordance.© 2012 Elsevier Inc. All rights reserved.
Keywords: Body surface mapping; Electrocardiography; Eighty-lead ECG; 80-lead ECG; Twelve-lead ECG; 12-lead ECG;Automated algorithm; ECG interpretation; OCCULT MI trial
Introduction
Body surface mapping (BSM) has demonstrated an abilityto improve the current diagnostic paradigm for acutemyocardial infarction (AMI) and may become a practicaland effective tool in the early evaluation of patientspresenting with symptoms concerning for acute coronarysyndrome.1-10 The electrocardiographic data captured by a
uthor. Wake Forest University School of Medicine, 1vard, Winston-Salem, NC 27106, [email protected]
nt matter © 2012 Elsevier Inc. All rights reserved.16/j.jelectrocard.2012.07.002
BSM device can be interpreted by the clinician at the bedside.Eighty-lead (80L) BSM technology provides real-timeelectrocardiographic (ECG) tracings at each lead (Fig. 1),a colorimetric 2D map, and a 3D torso view which areavailable for review and interpretation (Fig. 2). The BSMdevice also offers an automated algorithmic interpretation.Little information is available, however, about the perfor-mance of automated algorithm interpretation in comparisonto human interpretation of 80L maps. We compared theinterpretations of 80L maps by a core laboratory of ex-perienced physician readers to the interpretations generatedby an automated algorithm programmed into the PRIME

Fig. 1. Eighty-lead BSM technology provides real-time ECG tracings at each lead. An 8-lead display (below) is also available for a more detailed review owaveform characteristics and signal quality. Tracings in red are excluded from interpretation due to poor signal quality.
703C.W. Lefebvre et al. / Journal of Electrocardiology 45 (2012) 702–707
80L BSM device (Heartscape, Inc, Bangor, NorthernIreland). The effect of map quality on this comparisonwas also analyzed. To our knowledge, this analysis ofOptimal Cardiovascular Diagnostic Evaluation EnablingFaster Treatment of Myocardial Infarction (OCCULT MI)trial data is the first comparison of human and computerinterpretation of 80L BSMs on a large scale.
Methods
The OCCULT MI trial was a prospective multicentercohort-blinded observational clinical trial investigating theutility of the PRIME ECG (Heartscape, Inc) 80L BSMtechnology in the evaluation of moderate- to high-riskpatients presenting to the emergency department with chestpain and has been described previously.9
Adult patients presenting with chest pain or symptomsconcerning for acute coronary syndrome were evaluated andtreated under standard of care by emergency physicians.Within 20 minutes of initial dedicated 12L ECG acquisitionand after informed consent was obtained, the 80L BSMapparatus was applied by study personnel or investigators.An array (vest) of 11 self-adhesive strips, containing a totalof 80 leads, was applied to the patient's anterior (64 leads)and posterior torso (16 leads) (Fig. 3). Operators performedreal-time analysis of ECG signals (displayed on the monitor)at each lead. Poor quality tracings were corrected by securing
f
the skin-lead interface at the lead(s) in question. Once overallsignal quality was optimized, ECG data was captured. Serial80L ECGs with simultaneously imbedded 12L ECGs wereobtained at the discretion of the treating physician. Up to 6serial 80L BSMs were generated for each subject; however,most subjects had 1, 2, or 3 BSMs. Patients receivedconventional aggressive care and the time constraints thereinoften precluded attainment of an 80L ECG. If the initialdedicated 12L ECG revealed ST-elevation myocardialinfarction (STEMI), an 80L ECG could not be obtained forsome subjects. The treating physician was blinded to 80LBSM data and to automated interpretation, while theimbedded real-time 12L ECG was available for review.
All 80L BSMs and 12L ECGs were submitted for inter-pretation by a core laboratory of emergency physicians and acardiologist at Duke Cardiovascular Research Institute,Durham, NC. Core laboratory physicians underwent stan-dardized training in 80L BSM interpretation. Theseexperienced physician interpreters were blinded to clinicaloutcomes and to the interpretations generated by theautomated algorithm of the BSM device (as portrayed inFig. 2). Corresponding embedded 12L ECGs were availablefor review but dedicated 12L ECGs obtained before BSMapplication were not available for review.
When analyzing 80L maps, core laboratory readersapproached each map in stepwise fashion. First, the ECGwaveforms at each of the 80 leads were assessed for quality.If the overall quality of a tracing was very poor and

Fig. 2. The BSM device creates a colorimetric 2D map and a 3D torso display which are available for review and interpretation. Red color depicts ST-segmentelevation above diagnostic threshold values while blue color corresponds to ST-segment depression.
Fig. 3. Electrocardiographic information is obtained by an array of 11 self-adhesive strips, containing a total of 80 leads, which are applied to thepatient's anterior (64 leads) and posterior torso (16 leads).
704 C.W. Lefebvre et al. / Journal of Electrocardiology 45 (2012) 702–707
precluded interpretation, the core laboratory designated it asa technical failure. Similarly, 80L and 12L ECGs with abundle-branch block (BBB) pattern were eliminated frominterpretation by the core laboratory. Next, each lead wasscrutinized in greater detail on the 8-lead display (Fig. 1). Ifthe device's software had not already identified anddisqualified a poor-quality lead from interpretation (markedin red), the physician reader could “reject” a particularlead(s) if deemed to be beyond reliable interpretation. Thisstep was repeated for all 80 leads. Next, the device calculatedand displayed ECG voltage measurements and generated atorso view for review. The BSM torso display (Fig. 2) wasreviewed to develop a general visual impression ofmyocardial regions with obvious colorimetric changes(signifying a breach of threshold values in those areas;blue for ST depression beyond the normal threshold, redfor ST elevation above the threshold). Core laboratorymembers were able to review voltage amplitude measure-ments at each lead in a zone of color and compare them topre-determined diagnostic threshold values. Adjacent andreciprocal leads or regions were analyzed to determine ifthreshold values were breached in a multitude of leads, andif so, whether or not this appeared to constitute a regionalpattern of ischemia or infarction.
Core laboratory members proceeded by identifying thepresence or absence of ischemia and/or infarction with a“yes/no” designation. If just one map, in a series of maps forthe same subject, contained evidence of ischemia or
infarction, the interpretation for that subject was “yes” forthe presence of ischemia or infarction. The designation of“infarction” was for acute infarction patterns only. Althoughserial ECGs acquired during a patient encounter could be
705C.W. Lefebvre et al. / Journal of Electrocardiology 45 (2012) 702–707
compared by the same core laboratory member, prior ECGtracings were not available for comparison.
The 80L device used during this study was the PRIMEECG (Heartscape, Inc). Its automated diagnostic feature is acomplex algorithm designed to incorporate a multitude ofECG data to generate a user-friendly interpretation availablefor use by the clinician. The device's custom softwarecalculates QRS width and axis, QRS and ST-T isointegrals(integration of ECG signal under the QRS and ST-T curvesat each electrode) and the potential at 0 and 60 millisecondsafter the J point (ST0 and ST60 isopotentials). The algorithmdetermines the degree of ST-segment deviation at ST0 andthe anatomic extent of this deviation. Similarly, it in-vestigates the degree and extent of reciprocal changes ifpresent. The algorithm applies programmed threshold valueswith regional specifications to determine if the degree of ST-segment deviation is sufficient to warrant further investiga-tion. Algorithm thresholds, however, are not necessarilystatic. The application of threshold values is adaptive suchthat more widespread ST-segment deviation may trigger alowering of the critical threshold value for a particularregion. Waveform morphology (ie, hyperacute T waves,QRS:ST ratios and R wave progression) is recognized by thesoftware and is considered in its algorithmic analysis as well.The presence of concerning morphology may also induce adecrease in diagnostic threshold values.
The ECG heartbeats displayed by the 80L system arenot averaged. During acquisition, the system captures 10seconds of data. The system automatically nominates beatswith excessive noise to be excluded from analysis thennominates a “representative” beat. ECG displays are limitedto approximately 4 seconds, but all data can be accessed. Thesystem sequentially interprets each heartbeat across all 80channels before it registers an overall diagnostic result.
The automated algorithm produced a variety of in-terpretations including, but not limited to, AMI, ischemia,early repolarization, old MI, and normal. For the purposes ofthis analysis, interpretations were categorized as “positivefor ischemia/infarction” and “no evidence of ischemia.” Theautomated algorithm rejected leads that it deemed poorquality and generated an interpretation based on remaininglead information. The algorithm offered an interpretation foreach BSM, regardless of overall signal quality or presence ofa conduction defect.
Core laboratory readers made subjective assessments ofthe quality for all recordings and designated each as “good,”“fair,” “poor,” or “technical failure.” When the core labo-ratory designated a tracing as not interpretable by reason oftechnical failure (ie, too many poor-quality leads), compar-ison to automated algorithm analysis was not possible.
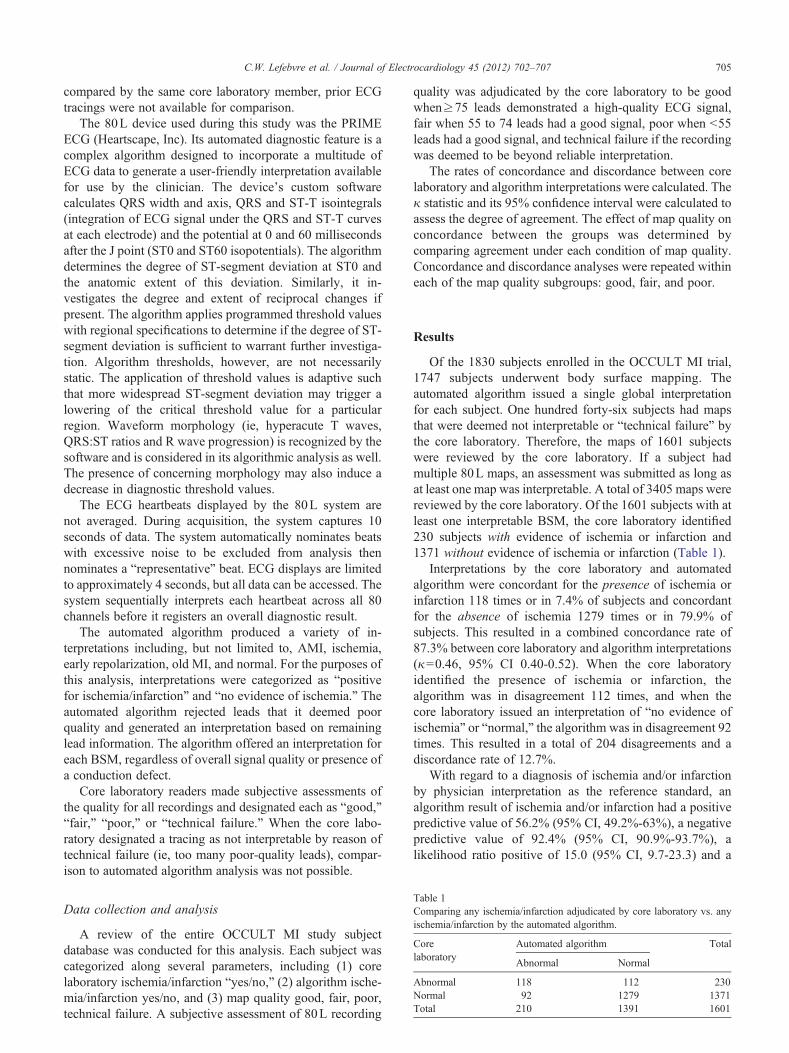
Table 1Comparing any ischemia/infarction adjudicated by core laboratory vs. anyischemia/infarction by the automated algorithm.
Corelaboratory
Automated algorithm Total
Abnormal Normal
Abnormal 118 112 230Normal 92 1279 1371Total 210 1391 1601
Data collection and analysis
A review of the entire OCCULT MI study subjectdatabase was conducted for this analysis. Each subject wascategorized along several parameters, including (1) corelaboratory ischemia/infarction “yes/no,” (2) algorithm ische-mia/infarction yes/no, and (3) map quality good, fair, poor,technical failure. A subjective assessment of 80L recording
quality was adjudicated by the core laboratory to be goodwhen≥75 leads demonstrated a high-quality ECG signal,fair when 55 to 74 leads had a good signal, poor when b55leads had a good signal, and technical failure if the recordingwas deemed to be beyond reliable interpretation.
The rates of concordance and discordance between corelaboratory and algorithm interpretations were calculated. Theκ statistic and its 95% confidence interval were calculated toassess the degree of agreement. The effect of map quality onconcordance between the groups was determined bycomparing agreement under each condition of map quality.Concordance and discordance analyses were repeated withineach of the map quality subgroups: good, fair, and poor.
Results
Of the 1830 subjects enrolled in the OCCULT MI trial,1747 subjects underwent body surface mapping. Theautomated algorithm issued a single global interpretationfor each subject. One hundred forty-six subjects had mapsthat were deemed not interpretable or “technical failure” bythe core laboratory. Therefore, the maps of 1601 subjectswere reviewed by the core laboratory. If a subject hadmultiple 80L maps, an assessment was submitted as long asat least one map was interpretable. A total of 3405 maps werereviewed by the core laboratory. Of the 1601 subjects with atleast one interpretable BSM, the core laboratory identified230 subjects with evidence of ischemia or infarction and1371 without evidence of ischemia or infarction (Table 1).
Interpretations by the core laboratory and automatedalgorithm were concordant for the presence of ischemia orinfarction 118 times or in 7.4% of subjects and concordantfor the absence of ischemia 1279 times or in 79.9% ofsubjects. This resulted in a combined concordance rate of87.3% between core laboratory and algorithm interpretations(κ=0.46, 95% CI 0.40-0.52). When the core laboratoryidentified the presence of ischemia or infarction, thealgorithm was in disagreement 112 times, and when thecore laboratory issued an interpretation of “no evidence ofischemia” or “normal,” the algorithm was in disagreement 92times. This resulted in a total of 204 disagreements and adiscordance rate of 12.7%.
With regard to a diagnosis of ischemia and/or infarctionby physician interpretation as the reference standard, analgorithm result of ischemia and/or infarction had a positivepredictive value of 56.2% (95% CI, 49.2%-63%), a negativepredictive value of 92.4% (95% CI, 90.9%-93.7%), alikelihood ratio positive of 15.0 (95% CI, 9.7-23.3) and a

706 C.W. Lefebvre et al. / Journal of Electrocardiology 45 (2012) 702–707
likelihood ratio negative of 0.68 (95% CI, 0.60-0.79). Usingphysician interpretation as the reference standard, thesensitivity of the algorithm for ischemia and/or infarctionwas 51.3% (95% CI, 44.6-57.9%) with a specificity of 93.7%(95% CI, 92.3%-94.9%). The core laboratory and theautomated algorithm were in agreement for the identifica-tion of infarction in 50% of STEMI cases (κ=0.37; 95% CI,0.27-0.46).
When the core laboratory identified positive ischemia orinfarction, the automated algorithm agreed 54.1% of the timeon “good” quality maps while agreement was reached only47.1% of the time on “poor” quality maps. When the corelaboratory adjudicated negative ischemia or infarction, thealgorithm agreed in 94.1% of cases when reading “good”quality maps and in 90.8% of cases when reading “poor”quality maps. A decrease in signal quality was associatedwith a decrease in overall concordance between human andautomated algorithm interpretation (κ=0.52 [95% CI, 0.42-0.62] for “good” quality maps, κ=0.30 [95% CI, 0.17-0.44]for “poor” quality maps).
Discussion
The characteristics of automated interpretation of 12LECG have been studied to determine degrees of concordancewith human interpretation and clinical accuracy. With regardto the comparison between computer and physician inter-pretation, a high level of concordance has been described forECG waveform measurements and Anderson-WilkinsAcuteness Score extractions in patients with anterior orinferior AMI (Pearson r correlation coefficient of 0.84 and0.93, Pb .01).11 Comparisons between manual and comput-erized measurements of J-, ST-, and T-wave deviations on12L ECGs have demonstrated “moderate correlation” in thedetection of ST elevation with a tendency toward underes-timation of ST elevation by the computer.12 In other studies,computerized algorithms had a tendency to over-calculateinjury patterns resulting in over-estimation of injury scoresand/or presence of ischemia.13,14 The analysis of a serialcomparison program by Ariet and colleagues evaluated theinterpretations of individual 12L ECGs and serial ECGs. Forthe interpretation of AMI among individual ECGs, agree-ment between a cardiologist and a computer program rangedfrom 22.0% to 53.7%.15 In another study, Willems et alreported a median level of agreement of 76.6% whencomparing 12L interpretations among multiple categoriesbetween nine different ECG computer programs andeight cardiologists. Concordance increased to 85.4% (95%CI, 83%-87%, Pb .001) when program results were com-bined.16 While the level of agreement (87.3%) in our studywas similar to, or higher than, prior studies involving 12LECG interpretation, it involved the analysis of 80 individualleads per recording, multiple recordings per subject andcolorimetric 3D torso maps. Therefore, direct comparisonsare difficult to draw.
With regard to clinical accuracy of computer interpreta-tion of 12L ECG, Kudenchuk and colleagues reported thesensitivity of an automated algorithm for AMI to be 52%,17
whereas Willems et al demonstrated a computer sensitivityof 77.1% for anterior MI, 58.8% for inferior MI and a mediantotal accuracy of 69.7%.16 More recently, Clark and col-leagues evaluated the efficacy of 2 ECG computer programsin detecting acute coronary syndrome in pre-hospitalpatients. They reported a sensitivity of 78% for both pro-grams with specificities of 91% and 94%.18 Although anoverall sensitivity of 51.3% for ischemia and/or infarction isreported in the OCCULT MI study, it should be noted thatthe aforementioned studies verified sensitivity using clinicaldata while sensitivity of the 80L algorithm was determinedusing physician interpretation as the reference standard.Therefore, direct comparisons are not possible. The sen-sitivity of the 80L algorithm with respect to clinical accuracyis the focus of future work.
There was a relatively low prevalence of abnormal 80Ltracings overall and relatively few cases of infarction. Thelatter was likely due to time constraints associated withSTEMI care. In light of a relatively low prevalence of dis-ease, the combined concordance rates and κ values should beinterpreted with prudence. Furthermore, a lower level ofagreement for cases of infarction (κ=0.37), modest sensi-tivity, and the presence of false-negative reports by thecomputer suggest that enhanced algorithm accuracy isnecessary. This also highlights the importance of physiciandiscretion in the clinical setting, as is the case with anydiagnostic technology. Results from the OCCULT MI trialshowed that 80L ECG had greater sensitivity for AMI thanembedded 12L ECG (19% vs 10.4%, P=.0014)19 and that80L ECG provides an incremental 27.5% increase inSTEMI detection over 12L ECG.9 A core laboratory ofphysicians experienced in reading 80L BSM providedinterpretative data for these analyses. Therefore, althoughthese results highlight the potential of 80L technology toprovide additional diagnostic information at the bedside,additional work is necessary to determine the potential valueof the algorithm to the clinician who is inexperienced inBSM interpretation.
Map quality had a direct impact on computer and humaninterpretations. Concordance was negatively affected bypoor signal quality. As one might expect, there is morevariability in map interpretation in the presence of ECGartifact. This raises several important issues. After disqua-lifying poor-quality data from its interpretive algorithm, thedevice attempted to make an assessment for all availableBSMs. Since concordance decreased in poor-quality sam-ples, one must question the accuracy of the device's assess-ments of these maps as well as its accuracy when readingBSMs that the core laboratory disqualified completely dueto excessive noise. Acceptance of the device's interpreta-tion by the bedside clinician without attention to the qualityof data being interpreted by that device could result inmisguided clinical impressions. This emphasizes theimportance of clinician scrutiny during BSM lead datacapture and subsequent data interpretation.
The core laboratory was more likely to disagree with theautomated algorithm's detection of ischemia and/or infarc-tion when reading maps of poor quality (9.2% rate ofdisagreement). These results suggest a possible reluctance

707C.W. Lefebvre et al. / Journal of Electrocardiology 45 (2012) 702–707
among core laboratory readers to adjudicate ischemia orinfarction unless there was clear convincing of such. In“poor” quality studies, useful ECG information in adjacentleads was absent which precluded a confident determination ofischemia or infarction. It is possible that the automatedalgorithm applied strict rules and was more likely to positivelyidentify ischemia when threshold values were triggered, evenwhen sorting suboptimal ECG data. It is also possible thathumans either cannot recognize interpretable waveforms in thepresence of signal distractions or mistakenly perceivedischemic patterns amongst signal artifact.
Limitations
A significant limitation of this analysis was the absence offormal inter-observer and intra-observer variability deter-minations. Members of the core laboratory did meet regularlyduring the study period for informal inter-observer assess-ments but the results from these sessions were not recorded.Although voltage threshold values were defined and astandard approach was executed by members of the corelaboratory group, no formal or strict criteria were adopted bythe group or applied during individual analysis of 80L ECGs.Therefore, a degree of subjectivity in physician interpreta-tions likely existed in the reading of individual 80L BSMs.
Another limitation of this analysis is that the correlationbetween BSM interpretations and clinical outcomes is notreported. Without an investigation of sensitivity and speci-ficity for ischemia or infarction, the overall clinical accuracyof automated and core laboratory interpretations is unclear.
Owing to time constraints imposed by the realities ofclinical care, many subjects with evidence of STEMI on initial12L ECG were not evaluated with BSM. More informationregarding the performance of automated algorithm interpreta-tion in cases of STEMI would be helpful in determining itsutility in clinical practice. Another limitation of this analysis isthe exclusion of BSMs with evidence of conduction defects(i.e., BBB). In order to isolate BSMs with conduction defects(with intent to perform an analysis on device sensitivity formyocardial injury in the setting of BBB), the core laboratorywas obligated to exclude these maps by categorizing them as“technical failures.” Of the BSMs identified by the corelaboratory to be “technical failures,” 19 of these had evidenceof BBB patterns. Therefore, the true rate of “technical failure”due strictly to poor quality tracings was 7.3%.
One member of the core laboratory is a board-certifiedcardiologist and other members of the group are board-certifiedemergency medicine physicians. Additional heterogeneity inphysician interpretation may have occurred as a result of thiscore laboratory configuration. Although this combination ofmedical professions may have contributed to more variation inECG interpretation, one could argue that this more closelyresembles real-world conditions and helps characterize physi-cian interpretation of 80L maps across medical specialties.
Conclusion
A moderate degree of concordance was noted betweenphysician and automated algorithm interpretation of 80L
BSMs in the OCCULT MI trial. Good signal quality of 80LECG recordings was associated with higher concordancebetween physician and computer interpretation.
References
1. Lux RL. Electrocardiographic mapping; noninvasive electrophysiolog-ical cardiac imaging. Circulation 1993;87:1040.
2. McMechan S, MacKenzie G, Allen J, et al. Body surface ECG poten-tial maps in acute myocardial infarction. J Electrocardiol 1995;28(Suppl):184.
3. McClelland A, Owens C, Menown I, et al. Comparison of the 80-leadbody surface map to physician and to 12-lead electrocardiogram indetection of acute myocardial infarction. Am J Cardiol 2003;92:252.
4. Menown I, Allen J, Anderson J, et al. ST depression only on the initial12-lead ECG: early diagnosis of acute myocardial infarction. Eur HeartJ 2001;22:218.
5. Ornato JP, Menown IB, Riddell JW, et al. 80-lead body map detectsacute ST elevation myocardial infarction missed by standard 12-leadelectrocardiography. J Am Coll Cardiol 2002;39:332A.
6. Menown I, Allen J, Anderson J, Adgey A. Early diagnosis of rightventricular or posterior infarction associated with inferior wall leftventricular acute myocardial infarction. Am J Cardiol 2000;85:934.
7. Kornreich F, Montague T, Rautaharju P. Body surface potentialmapping of ST segment changes in acute myocardial infarction.Implications for ECG enrollment criteria for thrombolytic therapy.Circulation 1993;87:773.
8. Maynard S, Menown I, Manoharan G, et al. Body surface mappingimproves early diagnosis of acute myocardial infarction in patients withchest pain and left bundle branch block. Heart 2003;89:998.
9. Hoekstra J, O'Neill B, Pride Y, et al. Acute detection of ST-elevationmyocardial infarction missed on standard 12-lead ECG with a novel 80-lead real-time digital body surface map: primary results from themulticenter OCCULT MI trial. Ann Emerg Med 2009;54:779.
10. Lefebvre C, Hoekstra J. Early detection and diagnosis of acute myo-cardial infarction: the potential for improved care with next-generation,user-friendly electrocardiographic body surface mapping. Am J EmergMed 2007;25:1063.
11. Ripa R, Persson E, Heden B, et al. Comparison between human andautomated electrocardiographic waveform measurements for calculat-ing the Anderson-Wilkins acuteness score in patients with acutemyocardial infarction. J Electocardiol 2005;38:96.
12. Eskola M, Nikus K, Voipio-Pulkki L, et al. Comparative accuracy ofmanual versus computerized electrocardiographic measurement of J-,ST- and T-wave deviations in patients with acute coronary syndrome.Am J Cardiol 2005;96:1584.
13. Haisty W, Pahlm O, Wagner N, et al. Performance of the automatedcomplete Selvester QRS scoring system in normal subjects and patientswith single and multiple myocardial infarctions. J Am Coll Cardiol1992;19:341.
14. Pelter M, Adams M, Drew B, et al. Computer versus manual mea-surement of ST-segment deviation. J Electrocardiol 1996;30:151.
15. Ariet M, Zhou S, DeLuca D, et al. Computerized serial comparisonof electrocardiograms: program performance in myocardial infarction.J Electrocardiol 2007;40:147.
16. Willems J, Abreu-Lima C, Arnaud P, et al. The diagnostic performanceof computer programs for the interpretation of electrocardiograms.NEJM 1991;325:1767.
17. Kudenchuk P, Ho M, Weaver W, et al. Accuracy of computer-interpreted electrocardiography in selecting patients for thrombolytictherapy. J Am Coll Cardiol 1991;17:1486.
18. Clark E, Sejersten M, Clemmensen P, et al. Automated electrocardio-gram interpretation programs versus cardiologists’ triage decisionmaking based on teletransmitted data in patients with suspected acutecoronary syndrome. Am J Cardiol 2010;106:1696.
19. O'Neil B, Hoekstra J, Pride Y, et al. Incremental benefit of 80 lead ECGbody surface mapping over the 12 lead ECG in the detection of acutecoronary syndromes in patients without ST-elevation myocardialinfarction: results from the OCCULT MI Trial. Acad Emerg Med2010;17:932.


![ΠΤΡΟ Ν. ΠΑΠΑΪΩΑΝΝΟΤ MD. PHD. FESC · safety end point (Thrombolysis in Myocardial Infarction [TIMI] major bleeding not related to coronary-artery bypass grafting)](https://static.fdocument.org/doc/165x107/5f765ace2664f83f9d7549d0/-md-phd-fesc-safety-end-point-thrombolysis.jpg)