Diagnostic Potential of Differentially Expressed Homer1 ... · with CAD can present with stable...
12
Int. J. Mol. Sci. 2015, 16, 535-546; doi:10.3390/ijms16010535 International Journal of Molecular Sciences ISSN 1422-0067 www.mdpi.com/journal/ijms Article Diagnostic Potential of Differentially Expressed Homer1, IL-1β, and TNF-α in Coronary Artery Disease Xuan Jing, Shan-Shan Chen, Wei Jing, Qian Tan, Ming-Xia Yu and Jian-Cheng Tu * Department of Clinical Laboratory Medicine and Center for Gene Diagnosis, Zhongnan Hospital of Wuhan University, Wuhan 430071, China; E-Mails: [email protected] (X.J.); [email protected] (S.-S.C.); [email protected] (W.J.); [email protected] (Q.T.); [email protected] (M.-X.Y.) * Author to whom correspondence should be addressed; E-Mail: [email protected]; Tel.: +86-27-6781-2989; Fax: +86-27-6781-3497. Academic Editor: William Chi-shing Cho Received: 31 October 2014 / Accepted: 22 December 2014 / Published: 29 December 2014 Abstract: Increasing evidences suggest that inflammation plays an important role in the pathogenesis of coronary artery disease (CAD). Numerous inflammatory cytokines and related genes mediate adverse cardiovascular events in patients with CAD, such as interleukin-1β (IL-1β), tumor necrosis factor-α (TNF-α), and Homer in the present study. The study was carried out on 163 CAD patients at different stages and 68 controls. The gene expression of Homer1, Homer2, Homer3, IL-1β, and TNF-α in the peripheral blood leukocytes were measured by real-time polymerase chain reaction. The mRNA levels of Homer1, IL-1β, and TNF-α in CAD patients were significantly higher than those in the control group, but not Homer2 and Homer3. However, there was no considerable difference in the mRNA levels of Homer1, IL-1β, and TNF-α among AMI, UAP, and SAP three subgroups of CAD. The receiver operating characteristic (ROC) curves showed that Homer1 had a better diagnostic value for UAP patients compared with IL-1β and TNF-α. Like IL-1β and TNF-α, Homer1 may also be an important participant of atherosclerotic plaque development and eventually rupture. The results of the present study may provide an important basis for diagnosing CAD patients, and provide new therapeutic targets for CAD. Keywords: coronary artery disease; gene expression; inflammation; Homer; IL-1β; TNF-α OPEN ACCESS
Transcript of Diagnostic Potential of Differentially Expressed Homer1 ... · with CAD can present with stable...
Int. J. Mol. Sci. 2015, 16, 535-546; doi:10.3390/ijms16010535
International Journal of
Molecular Sciences ISSN 1422-0067
www.mdpi.com/journal/ijms
Article
Diagnostic Potential of Differentially Expressed Homer1, IL-1β, and TNF-α in Coronary Artery Disease
Xuan Jing, Shan-Shan Chen, Wei Jing, Qian Tan, Ming-Xia Yu and Jian-Cheng Tu *
Department of Clinical Laboratory Medicine and Center for Gene Diagnosis,
Zhongnan Hospital of Wuhan University, Wuhan 430071, China;
E-Mails: [email protected] (X.J.); [email protected] (S.-S.C.); [email protected] (W.J.);
[email protected] (Q.T.); [email protected] (M.-X.Y.)
* Author to whom correspondence should be addressed; E-Mail: [email protected];
Tel.: +86-27-6781-2989; Fax: +86-27-6781-3497.
Academic Editor: William Chi-shing Cho
Received: 31 October 2014 / Accepted: 22 December 2014 / Published: 29 December 2014
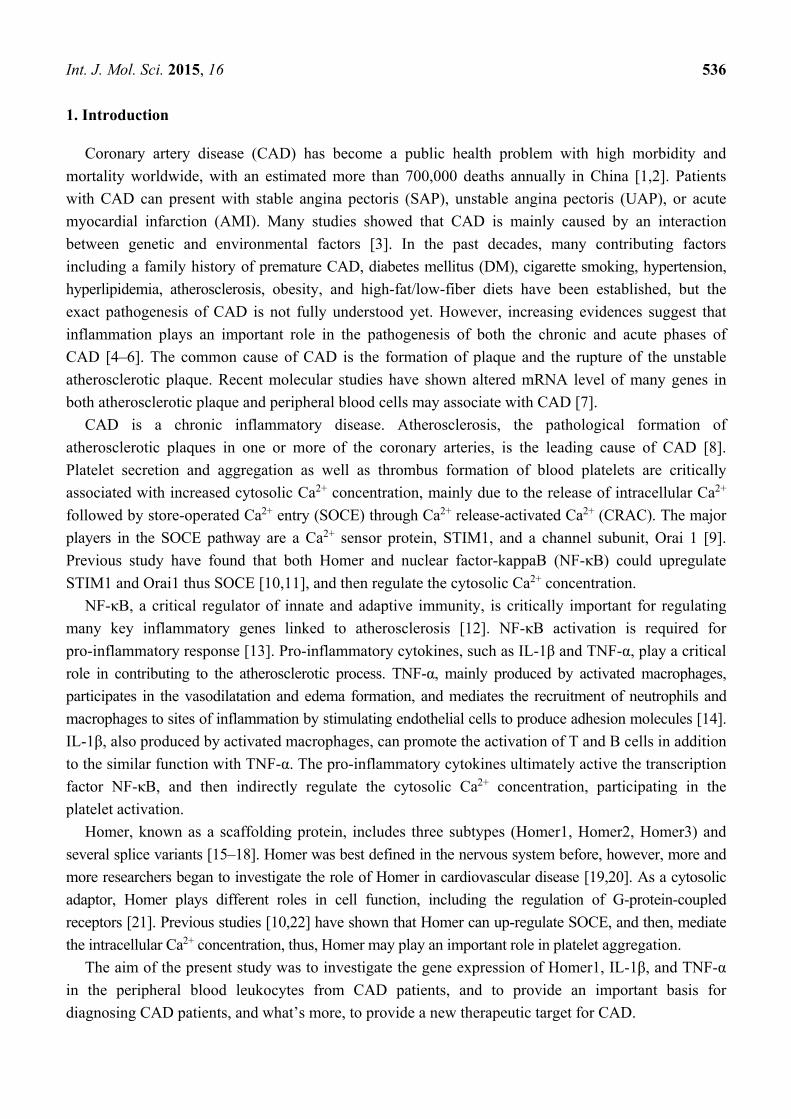
Abstract: Increasing evidences suggest that inflammation plays an important role in the
pathogenesis of coronary artery disease (CAD). Numerous inflammatory cytokines and
related genes mediate adverse cardiovascular events in patients with CAD, such as
interleukin-1β (IL-1β), tumor necrosis factor-α (TNF-α), and Homer in the present study.
The study was carried out on 163 CAD patients at different stages and 68 controls. The
gene expression of Homer1, Homer2, Homer3, IL-1β, and TNF-α in the peripheral blood
leukocytes were measured by real-time polymerase chain reaction. The mRNA levels of
Homer1, IL-1β, and TNF-α in CAD patients were significantly higher than those in the
control group, but not Homer2 and Homer3. However, there was no considerable
difference in the mRNA levels of Homer1, IL-1β, and TNF-α among AMI, UAP, and SAP
three subgroups of CAD. The receiver operating characteristic (ROC) curves showed that
Homer1 had a better diagnostic value for UAP patients compared with IL-1β and TNF-α.
Like IL-1β and TNF-α, Homer1 may also be an important participant of atherosclerotic
plaque development and eventually rupture. The results of the present study may provide
an important basis for diagnosing CAD patients, and provide new therapeutic targets
for CAD.
Keywords: coronary artery disease; gene expression; inflammation; Homer; IL-1β; TNF-α
OPEN ACCESS
Int. J. Mol. Sci. 2015, 16 536
1. Introduction
Coronary artery disease (CAD) has become a public health problem with high morbidity and
mortality worldwide, with an estimated more than 700,000 deaths annually in China [1,2]. Patients
with CAD can present with stable angina pectoris (SAP), unstable angina pectoris (UAP), or acute
myocardial infarction (AMI). Many studies showed that CAD is mainly caused by an interaction
between genetic and environmental factors [3]. In the past decades, many contributing factors
including a family history of premature CAD, diabetes mellitus (DM), cigarette smoking, hypertension,
hyperlipidemia, atherosclerosis, obesity, and high-fat/low-fiber diets have been established, but the
exact pathogenesis of CAD is not fully understood yet. However, increasing evidences suggest that
inflammation plays an important role in the pathogenesis of both the chronic and acute phases of
CAD [4–6]. The common cause of CAD is the formation of plaque and the rupture of the unstable
atherosclerotic plaque. Recent molecular studies have shown altered mRNA level of many genes in
both atherosclerotic plaque and peripheral blood cells may associate with CAD [7].
CAD is a chronic inflammatory disease. Atherosclerosis, the pathological formation of
atherosclerotic plaques in one or more of the coronary arteries, is the leading cause of CAD [8].
Platelet secretion and aggregation as well as thrombus formation of blood platelets are critically
associated with increased cytosolic Ca2+ concentration, mainly due to the release of intracellular Ca2+
followed by store-operated Ca2+ entry (SOCE) through Ca2+ release-activated Ca2+ (CRAC). The major
players in the SOCE pathway are a Ca2+ sensor protein, STIM1, and a channel subunit, Orai 1 [9].
Previous study have found that both Homer and nuclear factor-kappaB (NF-κB) could upregulate
STIM1 and Orai1 thus SOCE [10,11], and then regulate the cytosolic Ca2+ concentration.
NF-κB, a critical regulator of innate and adaptive immunity, is critically important for regulating
many key inflammatory genes linked to atherosclerosis [12]. NF-κB activation is required for
pro-inflammatory response [13]. Pro-inflammatory cytokines, such as IL-1β and TNF-α, play a critical
role in contributing to the atherosclerotic process. TNF-α, mainly produced by activated macrophages,
participates in the vasodilatation and edema formation, and mediates the recruitment of neutrophils and
macrophages to sites of inflammation by stimulating endothelial cells to produce adhesion molecules [14].
IL-1β, also produced by activated macrophages, can promote the activation of T and B cells in addition
to the similar function with TNF-α. The pro-inflammatory cytokines ultimately active the transcription
factor NF-κB, and then indirectly regulate the cytosolic Ca2+ concentration, participating in the
platelet activation.
Homer, known as a scaffolding protein, includes three subtypes (Homer1, Homer2, Homer3) and
several splice variants [15–18]. Homer was best defined in the nervous system before, however, more and
more researchers began to investigate the role of Homer in cardiovascular disease [19,20]. As a cytosolic
adaptor, Homer plays different roles in cell function, including the regulation of G-protein-coupled
receptors [21]. Previous studies [10,22] have shown that Homer can up-regulate SOCE, and then, mediate
the intracellular Ca2+ concentration, thus, Homer may play an important role in platelet aggregation.
The aim of the present study was to investigate the gene expression of Homer1, IL-1β, and TNF-α
in the peripheral blood leukocytes from CAD patients, and to provide an important basis for
diagnosing CAD patients, and what’s more, to provide a new therapeutic target for CAD.
Int. J. Mol. Sci. 2015, 16 537
2. Results
2.1. Patient Characteristics
The main demographic and clinical characteristics of all the studied subjects were summarized in
Table 1. There was no significant difference in important risk factors including age, gender, BMI,
smoking, hypertension, diabetes, hypercholesterolemia, CHOL, TG, and LDL-C in the four groups.
HDL-C and GLU showed significant differences between AMI and the control group (AMI vs.
Control: p < 0.05). Lp (a) of CAD group (AMI, UAP, and SAP) was much higher than the control
group (AMI vs. Control: p < 0.01; UAP vs. Control: p < 0.01; SAP vs. Control: p < 0.05).
Table 1. Characteristics of coronary artery disease (CAD) cases and the control group.
Characteristics Control AMI UAP SAP
(n = 68) (n = 65) (n = 53) (n = 45)
Sex (M/F) 40/28 47/18 38/15 33/12 Age (years) 62.44 ± 0.70 62.80 ± 1.39 63.29 ± 1.12 63.01 ± 0.93 BMI (kg/m2) 24.51 ± 3.31 25.90 ± 4.03 26.12 ± 4.17 25.77 ± 3.39
Somking, n (%) 12 (17.6%) 10 (15.4%) 7 (13.2%) 7 (15.6%) Hypertension, n (%) 31 (45.6%) 35 (53.8%) 28 (52.8%) 23 (51.1%)
Diabetes, n (%) 18 (26.4%) 25 (38.5%) 21 (39.6%) 17 (37.8%) Hypercholesterolemia 3 (4.4%) 7 (11.5%) 6 (11.3%) 3 (6.7%)
CHOL (mg/dL) 155.45 ± 15.85 171.69 ± 8.89 168.98 ± 8.12 159.70 ± 14.69 TG (mg/dL) 128.39 ± 38.95 166.46 ± 24.79 147.87 ± 30.10 143.44 ± 23.90
HDL-C (mg/dL) 49.49 ± 25.90 37.13 ± 15.46 * 41.77 ± 30.16 43.70 ± 13.14 LDL-C (mg/dL) 103.24 ± 35.18 105.57 ± 33.64 95.13 ± 25.52 101.32 ± 32.09 GLU (mg/dL) 98.75 ± 21.98 112.63 ± 37.84 107.76 ± 24.68 101.99 ± 27.75 Lp (a) (mg/L) 211.20 ± 11.17 278.21 ± 23.01 ** 283.70 ± 33.32 ** 244.63 ± 13.60 *
Data are mean ± SD or percentage. * p < 0.05, ** p < 0.01 vs. Control. Abbrebiations: CAD: coronary artery
disease; BMI: body mass index; CHOL: total cholesterol; TG: triglycerides; HDL-C: High-density
lipoprotein cholesterol; LDL-C: Low-density lipoprotein cholesterol; GLU: Fasting glucose; Lp (a):
lipoprotein (a).
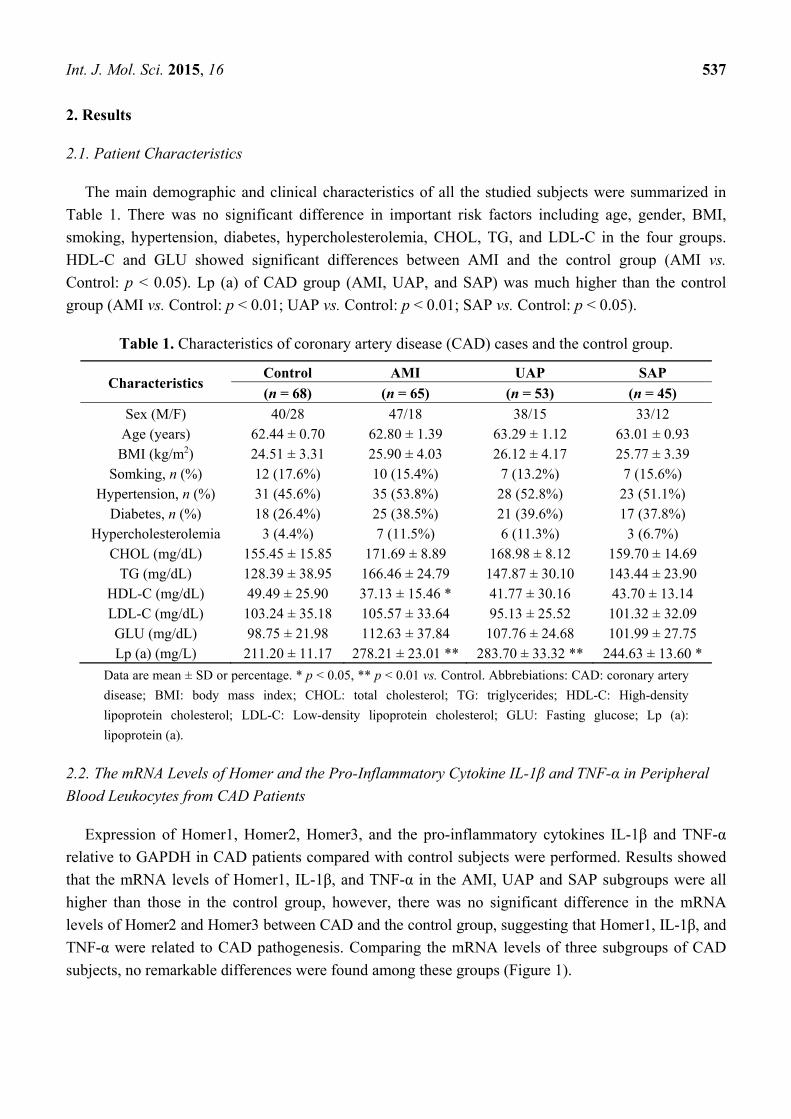
2.2. The mRNA Levels of Homer and the Pro-Inflammatory Cytokine IL-1β and TNF-α in Peripheral
Blood Leukocytes from CAD Patients
Expression of Homer1, Homer2, Homer3, and the pro-inflammatory cytokines IL-1β and TNF-α
relative to GAPDH in CAD patients compared with control subjects were performed. Results showed
that the mRNA levels of Homer1, IL-1β, and TNF-α in the AMI, UAP and SAP subgroups were all
higher than those in the control group, however, there was no significant difference in the mRNA
levels of Homer2 and Homer3 between CAD and the control group, suggesting that Homer1, IL-1β, and
TNF-α were related to CAD pathogenesis. Comparing the mRNA levels of three subgroups of CAD
subjects, no remarkable differences were found among these groups (Figure 1).
Int. J. Mol. Sci. 2015, 16 538
Figure 1. The expression of Homer1 (A); Homer2 (B); Homer3 (C) and the pro-inflammatory
cytokine interleukin-1β (IL-1β) (D); and tumor necrosis factor-α (TNF-α) (E) in peripheral
blood leukocytes from CAD patients. Results are shown as median box and whisker plots.
Statistical differences in relative expression between CAD patients and controls are
indicated as asterisks: * (p value, Mann-Whitney test). * p < 0.05, ** p < 0.01 vs. Control.
“•” represents outliers; “*” represents extreme values.
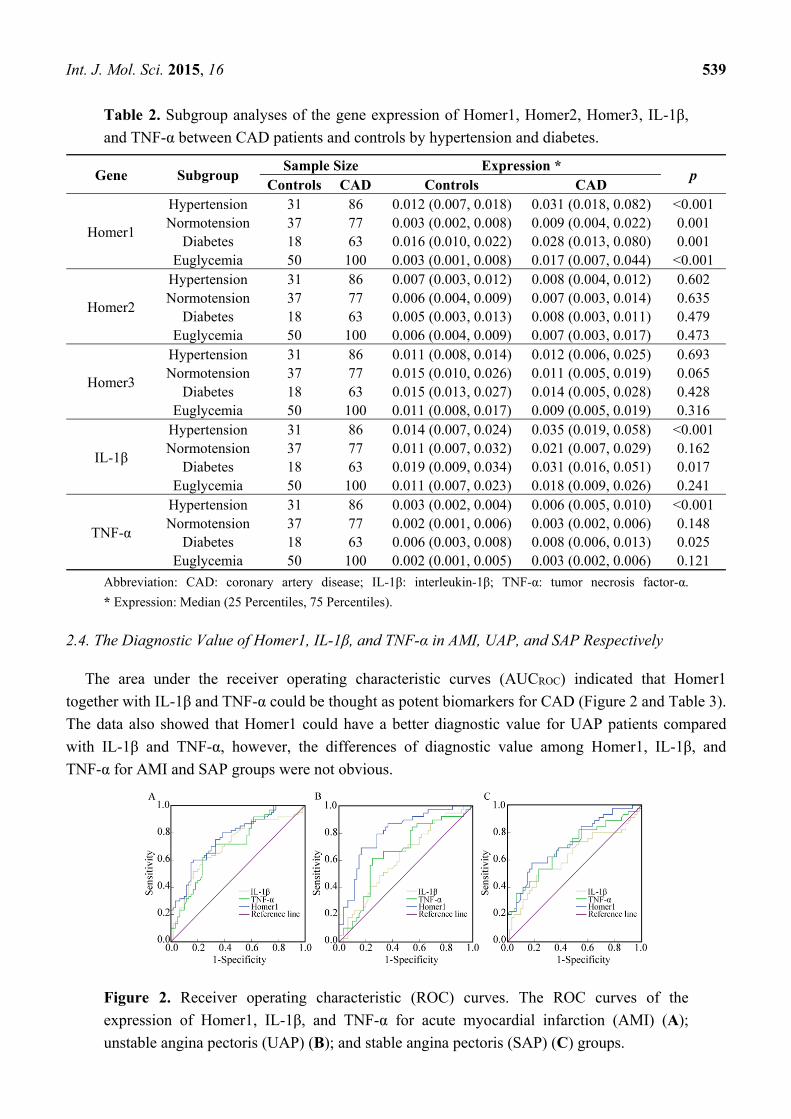
2.3. Subgroup Analyses
The gene expression of Homer1, Homer2, Homer3, IL-1β, and TNF-α were analyzed by hypertension
and diabetes between CAD patients and controls (Table 2). For Homer1, the gene expression differed
significantly between CAD patients and controls in participants of hypertension (p < 0.001), normal
blood pressure (p = 0.001), diabetes (p = 0.01), and normal glucose (p < 0.001). For IL-1β and TNF-α,
there were significant differences between CAD patients and controls in participants of hypertension
(p < 0.001 and p < 0.001), diabetes (p = 0.017 and p = 0.025), respectively.
Int. J. Mol. Sci. 2015, 16 539
Table 2. Subgroup analyses of the gene expression of Homer1, Homer2, Homer3, IL-1β,
and TNF-α between CAD patients and controls by hypertension and diabetes.
Gene Subgroup Sample Size Expression * p
Controls CAD Controls CAD
Homer1
Hypertension 31 86 0.012 (0.007, 0.018) 0.031 (0.018, 0.082) <0.001 Normotension 37 77 0.003 (0.002, 0.008) 0.009 (0.004, 0.022) 0.001
Diabetes 18 63 0.016 (0.010, 0.022) 0.028 (0.013, 0.080) 0.001 Euglycemia 50 100 0.003 (0.001, 0.008) 0.017 (0.007, 0.044) <0.001
Homer2
Hypertension 31 86 0.007 (0.003, 0.012) 0.008 (0.004, 0.012) 0.602 Normotension 37 77 0.006 (0.004, 0.009) 0.007 (0.003, 0.014) 0.635
Diabetes 18 63 0.005 (0.003, 0.013) 0.008 (0.003, 0.011) 0.479 Euglycemia 50 100 0.006 (0.004, 0.009) 0.007 (0.003, 0.017) 0.473
Homer3
Hypertension 31 86 0.011 (0.008, 0.014) 0.012 (0.006, 0.025) 0.693 Normotension 37 77 0.015 (0.010, 0.026) 0.011 (0.005, 0.019) 0.065
Diabetes 18 63 0.015 (0.013, 0.027) 0.014 (0.005, 0.028) 0.428 Euglycemia 50 100 0.011 (0.008, 0.017) 0.009 (0.005, 0.019) 0.316
IL-1β
Hypertension 31 86 0.014 (0.007, 0.024) 0.035 (0.019, 0.058) <0.001 Normotension 37 77 0.011 (0.007, 0.032) 0.021 (0.007, 0.029) 0.162
Diabetes 18 63 0.019 (0.009, 0.034) 0.031 (0.016, 0.051) 0.017 Euglycemia 50 100 0.011 (0.007, 0.023) 0.018 (0.009, 0.026) 0.241
TNF-α
Hypertension 31 86 0.003 (0.002, 0.004) 0.006 (0.005, 0.010) <0.001 Normotension 37 77 0.002 (0.001, 0.006) 0.003 (0.002, 0.006) 0.148
Diabetes 18 63 0.006 (0.003, 0.008) 0.008 (0.006, 0.013) 0.025 Euglycemia 50 100 0.002 (0.001, 0.005) 0.003 (0.002, 0.006) 0.121
Abbreviation: CAD: coronary artery disease; IL-1β: interleukin-1β; TNF-α: tumor necrosis factor-α.
* Expression: Median (25 Percentiles, 75 Percentiles).
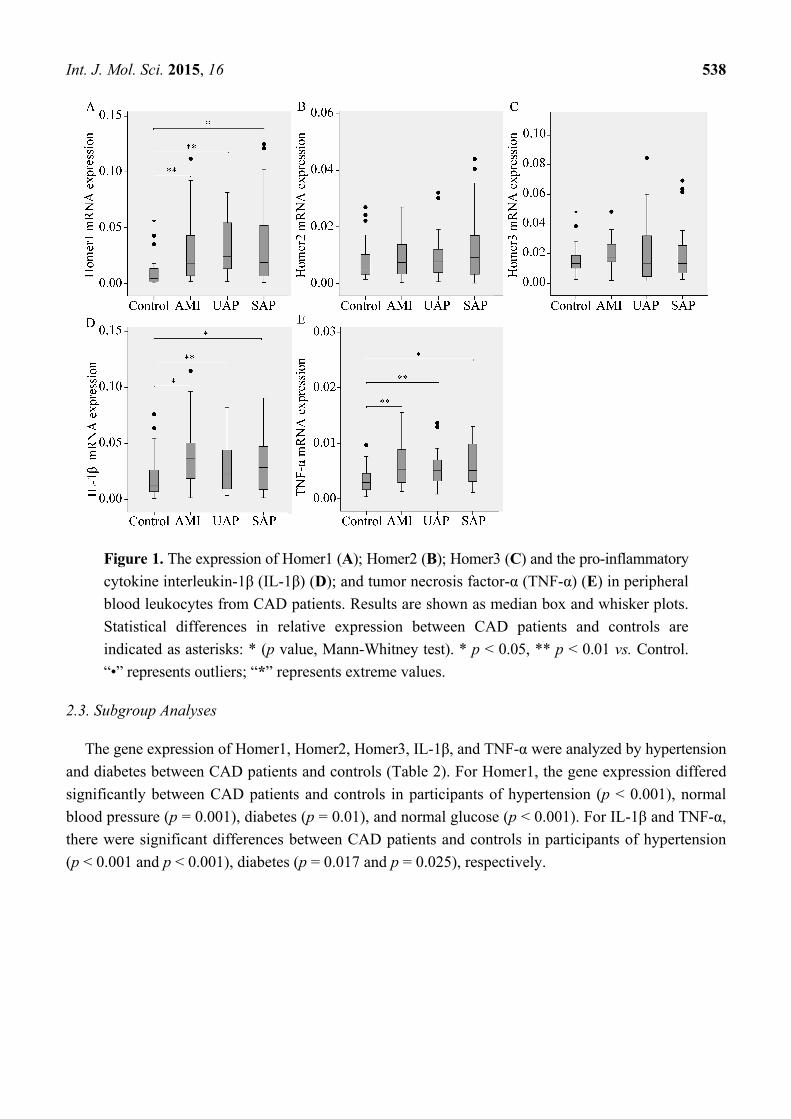
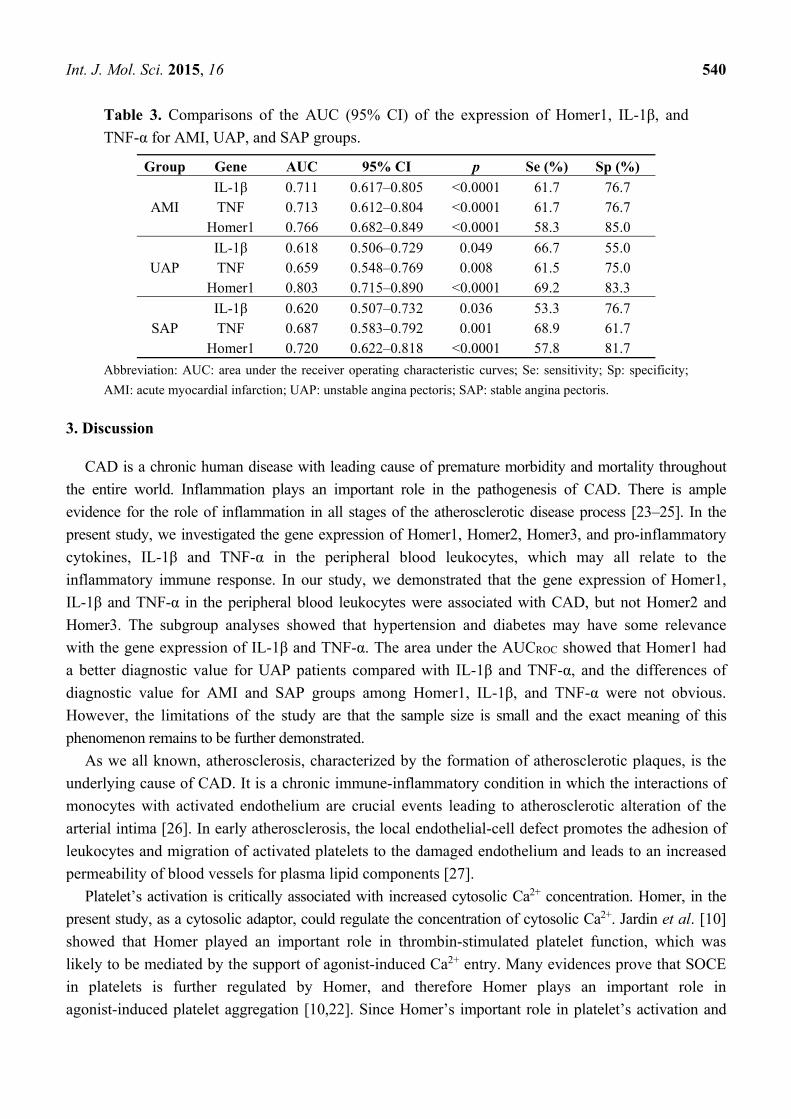
2.4. The Diagnostic Value of Homer1, IL-1β, and TNF-α in AMI, UAP, and SAP Respectively
The area under the receiver operating characteristic curves (AUCROC) indicated that Homer1
together with IL-1β and TNF-α could be thought as potent biomarkers for CAD (Figure 2 and Table 3).
The data also showed that Homer1 could have a better diagnostic value for UAP patients compared
with IL-1β and TNF-α, however, the differences of diagnostic value among Homer1, IL-1β, and
TNF-α for AMI and SAP groups were not obvious.
Figure 2. Receiver operating characteristic (ROC) curves. The ROC curves of the
expression of Homer1, IL-1β, and TNF-α for acute myocardial infarction (AMI) (A);
unstable angina pectoris (UAP) (B); and stable angina pectoris (SAP) (C) groups.
Int. J. Mol. Sci. 2015, 16 540
Table 3. Comparisons of the AUC (95% CI) of the expression of Homer1, IL-1β, and
TNF-α for AMI, UAP, and SAP groups.
Group Gene AUC 95% CI p Se (%) Sp (%)
AMI IL-1β 0.711 0.617–0.805 <0.0001 61.7 76.7 TNF 0.713 0.612–0.804 <0.0001 61.7 76.7
Homer1 0.766 0.682–0.849 <0.0001 58.3 85.0
UAP IL-1β 0.618 0.506–0.729 0.049 66.7 55.0 TNF 0.659 0.548–0.769 0.008 61.5 75.0
Homer1 0.803 0.715–0.890 <0.0001 69.2 83.3
SAP IL-1β 0.620 0.507–0.732 0.036 53.3 76.7 TNF 0.687 0.583–0.792 0.001 68.9 61.7
Homer1 0.720 0.622–0.818 <0.0001 57.8 81.7
Abbreviation: AUC: area under the receiver operating characteristic curves; Se: sensitivity; Sp: specificity;
AMI: acute myocardial infarction; UAP: unstable angina pectoris; SAP: stable angina pectoris.
3. Discussion
CAD is a chronic human disease with leading cause of premature morbidity and mortality throughout
the entire world. Inflammation plays an important role in the pathogenesis of CAD. There is ample
evidence for the role of inflammation in all stages of the atherosclerotic disease process [23–25]. In the
present study, we investigated the gene expression of Homer1, Homer2, Homer3, and pro-inflammatory
cytokines, IL-1β and TNF-α in the peripheral blood leukocytes, which may all relate to the
inflammatory immune response. In our study, we demonstrated that the gene expression of Homer1,
IL-1β and TNF-α in the peripheral blood leukocytes were associated with CAD, but not Homer2 and
Homer3. The subgroup analyses showed that hypertension and diabetes may have some relevance
with the gene expression of IL-1β and TNF-α. The area under the AUCROC showed that Homer1 had
a better diagnostic value for UAP patients compared with IL-1β and TNF-α, and the differences of
diagnostic value for AMI and SAP groups among Homer1, IL-1β, and TNF-α were not obvious.
However, the limitations of the study are that the sample size is small and the exact meaning of this
phenomenon remains to be further demonstrated.
As we all known, atherosclerosis, characterized by the formation of atherosclerotic plaques, is the
underlying cause of CAD. It is a chronic immune-inflammatory condition in which the interactions of
monocytes with activated endothelium are crucial events leading to atherosclerotic alteration of the
arterial intima [26]. In early atherosclerosis, the local endothelial-cell defect promotes the adhesion of
leukocytes and migration of activated platelets to the damaged endothelium and leads to an increased
permeability of blood vessels for plasma lipid components [27].
Platelet’s activation is critically associated with increased cytosolic Ca2+ concentration. Homer, in the
present study, as a cytosolic adaptor, could regulate the concentration of cytosolic Ca2+. Jardin et al. [10]
showed that Homer played an important role in thrombin-stimulated platelet function, which was
likely to be mediated by the support of agonist-induced Ca2+ entry. Many evidences prove that SOCE
in platelets is further regulated by Homer, and therefore Homer plays an important role in
agonist-induced platelet aggregation [10,22]. Since Homer’s important role in platelet’s activation and
Int. J. Mol. Sci. 2015, 16 541
the gene expression of Homer1 has some relevance with CAD in the present study, we may suppose
that Homer1 is an important participant in early atherosclerosis, consequently, CAD.
Leukocyte recruitment and expression of pro-inflammatory cytokines characterize early
atherogenesis. Monocyte-macrophages constitute the majority of immune cells in the atherosclerotic
lesion [28]. Monocyte-macrophage lineage cells are key factors in lesion development, participating in
the processes that mediate the progression of the atherosclerotic plaque [29]. Activated macrophages
can secrete pro-inflammatory cytokines, including IL-1β and TNF-α, which may influence the
mechanisms involved in vessel occlusion and repair [30]. Clinical studies have shown increased
expression of IL-1β and TNF-α in the atherosclerotic plaques [31–33]. Similarly to these reports, in the
current study, we observed increased mRNA levels of IL-1β and TNF-α in the leukocytes of the CAD
patients than in the controls. These results have indicated the important role of IL-1β and TNF-α in the
progression of CAD.
Recent studies have found that serum concentrations of eotaxin have a distinct relationship with
TNF-α, IL-1β, and IL-6 [34,35]. Eotaxin, an eosinophil chemoattractant cytokine, plays an important
role in the development of atherosclerosis [36]. In the serum of patients with CAD, increased
circulating levels of eotaxin are detected [37]. What’s more interesting is that circulating eotaxin levels
combine hepatic steatosis could well predict carotid intima-media thickness (cIMT) in obese patients
with nonalcoholic fatty liver disease, a distinct CAD risk factor [34]. IMT, defined as the distance
between the lumen-intima and the media-adventitia ultrasound interfaces, is a completely non-invasive
and sensitive method to detect early atherosclerosis [38]. A clinical study from Ciccone et al. [39] have
found levels of inflammatory markers, such as TNF-α and IL-6, are correlated to cIMT in Obstructive
Sleep Apnea (OSA), which is a sleep-related breathing disorder associated with the development of
cardiovascular diseases and atherosclerosis. In our study, Homer1, like TNF-α and IL-1β, could be
a potential and important participant in diagnosing early atherosclerosis, consequently, CAD. While
whether there is a correlation between cIMT and Homer1, or whether the combination of cIMT and
Homer1 could be a more useful diagnostic method for early atherosclerosis still need further studies.
In the present study, we found that the mRNA levels of Homer1 and pro-inflammatory cytokines,
IL-1β and TNF-α in the peripheral blood leukocytes from CAD patients were all increased in various
degrees. Maybe they have a synergistic effect on the pathogenesis of CAD through the SOCE
mechanism regulating platelet secretion and aggregation as well as the formation of atherosclerotic
plaques, and play important roles in the CAD process.
4. Experimental Section
4.1. Patients
We recruited 163 patients who were diagnosed as CAD by coronary angiography between June
2013 and June 2014 in the Zhongnan Hospital of Wuhan University, Wuhan, China. The CAD
diagnosis was based upon stenosis affecting ≥50% of the luminal diameter. Patients were classified
into three groups: SAP (33 men and 12 women, mean age 63.01 ± 0.93), UAP (38 men and 15 women,
mean age 63.29 ± 1.12), and AMI (47 men and 18 women, mean age 62.8 ± 1.39). Patients with
valvular heart disease, thromboembolism, collagen disease, disseminated intravascular coagulation,
Int. J. Mol. Sci. 2015, 16 542
advanced liver disease, renal failure, malignant disease, or septicemia or that were on steroid therapy
were excluded from the study. We also selected 68 subjects as controls, who were undergoing routine
medical examinations at the Physical Examination Center. The exclusion criteria included acute or
chronic infections or inflammatory diseases; severe pulmonary, hepatic or hematological diseases;
acute or chronic renal dialysis; malignant tumors. Those who had a family history of CAD, any clinical
manifestations or a medical history of heart disorders, previous percutaneous or surgical myocardial
revascularization or abnormal ECG were also excluded.
Written informed consent was obtained from the population involved in this study and the study
protocol was approved by the Ethics Committee of Zhongnan Hospital of Wuhan University (Ethic
approval 2013059, April 2013).
4.2. RNA Isolation
Blood samples were obtained from patients within 24 h after the onset of chest pain. Total mRNA
was extracted from peripheral blood leukocytes using the Trizol reagent (Invitrogen, Carlsbad, CA,
USA). All the RNA extracts were treated with Dnase I to avoid contamination by genomic DNA. The
concentration of the RNA measured by Nanodrop 2000 spectrophotometer (Thermo Scientific Inc.,
Waltham, MA, USA). cDNA was synthesized using the Maxima First Strand cDNA Synthesis Kit
(Thermo Scientific Inc., Waltham, MA, USA). Reverse transcription conditions were as follows: 65 °C
for 5 min, and then 42 °C for 60 min, and 70 °C for 5 min.
4.3. Real-Time Polymerase Chain Reation
To determine the expression of Homer1, Homer2, Homer3, IL-1β, and TNF-α, relative quantitative
real-time polymerase chain reaction (RT-PCR) was performed using SYBR-green I Premix EXTaq on
the Bio-Rad CFX96 (Bio-Rad Laboratories, Inc., Hercules, CA, USA) following manufacturer’s
instructions. Primers sequences for amplification of Homer1, Homer2, Homer3, IL-1β, and TNF-α were
determined using primer 3.0 (Primer Biosoft, Palo Alto, CA, USA) or previously designed [40,41]. The
synthesized primers were as follows: Homer1 sense: 5'-GATCCTGCCTAGCCTTCT-3' and antisense:
5'-GGAGCGAGCAACCAAACG-3'; Homer2 sense: 5'-TCACCGTTTCCTACTTCTATG-3' and
antisense: 5'-CCTGCGTCTTGTCTT-TGG-3'; Homer3 sense: 5'-CGCACTCACTGTCTCCTATT-3' and
antisense: 5'-GGAACTTCTCGG-CAAACT-3'; IL-1β sense: 5'-CCTGTCCTGCGTGTTGAAAGA-3' and
antisense: 5'-GGGAACTGGGCAGACTCAAA-3'; TNF-α sense: 5'-AGCCCATGTTGTAGCAAACC-3'
and antisense: 5'-TGAGGTACAGGCCCTCTGAT-3'. The Glyceraldehyde-3-phosphate dehydrogenase
(GAPDH) was used as the endogenous control and amplified simultaneously with assessed genes.
Primers used for GAPDH amplification were as follows: sense: 5'-GAAGGTGAAGGTCGGAGTC-3'
and antisense: 5'-GAAGATGGTGATGGGATTTC-3'.
Real-time PCR was carried out in 20 μL of reaction solution (10 μL of SYBR green mix, 0.8 μL
10 μmol sense, 0.8 μL 10 μmol antisense, and 7.4 μL water and 1 μL cDNA). The reactions started at
95 °C for 5 min, followed by 40 cycles of 95 °C for 30 s, 58 °C for 30 s and 72 °C for 30 s. All
experiments were carried out in duplicate for each data point. Relative gene expression level (the
amount of target, normalized to endogenous control gene) was calculated using the comparative Ct
method formula 2−ΔΔCt.
Int. J. Mol. Sci. 2015, 16 543
4.4. Statistical Analysis
All data were analyzed by SPSS 17.0 (SPSS, Inc. Chicago, IL, USA). Normally distributed data
were expressed as mean ± standard deviation. Skewed data were described by the median and
interquartile range. Differences were considered to be significant at p < 0.05. To check the normality
of the distribution, the Shapiro-Wilk test was carried out. The differences between normally distributed
numeric variables were evaluated by Student’s t-test. Oneway ANOVA was used for the comparison
among multi-groups if the variance was homogeneous, while non-normally distributed variables were
analyzed by Mann-Whitney U test or Kruskal-Wallis variance analysis, as appropriate. Chi-square test
was employed for the comparison of categorical variables. The subgroup analyses of the gene
expression of Homer1, Homer2, Homer3, IL-1β, and TNF-α were performed by hypertension and
diabetes between CAD patients and controls. The diagnostic performance of the mRNA levels of
Homer1, IL-1β, and TNF-α in peripheral blood leukocytes for diagnosis of different stages of CAD
patients were examined by the area under the corresponding ROC curve analysis.
5. Conclusions
In summary, we have demonstrated that the mRNA levels of Homer1, IL-1β, and TNF-α in
peripheral blood leukocytes are closely associated with CAD in the present study. The underlying
mechanism may be their regulatory effects on the formation of atherosclerotic plaque, consequently,
CAD. This method will provide us a useful auxiliary diagnostic method to screen for a large number of
candidate patients and increase our understanding of the processes underlying the pathology of CAD,
and then provide new targets for the treatment of inflammatory disease.
Acknowledgments
This work was supported by the National Basic Research Program of China (973 Program,
2012CB720605), National Natural Science Funds (NO.81472033), and Wuhan Science and
Technology Key Project (201260523173-2).
Author Contributions
Xuan Jing and Jian-Cheng Tu conceived and designed the experiments. Shan-Shan Chen, Wei Jing
and Qian Tan contributed to sample collection. Xuan Jing performed the research, conducted the data
analysis and wrote the manuscript. Ming-Xia Yu contributed technical assistance. Jian-Cheng Tu
corrected English of this article and coordinated the research team. All authors have read and approved
the final manuscript.
Conflicts of Interest
The authors declare no conflict of interest.
Int. J. Mol. Sci. 2015, 16 544
References
1. Wang, F.; Xu, C.Q.; He, Q.; Cai, J.P.; Li, X.C.; Wang, D.; Xiong, X.; Liao, Y.H.; Zeng, Q.T.;
Yang, Y.Z.; et al. Genome-wide association identifies a susceptibility locus for coronary artery
disease in the Chinese Han population. Nat. Genet. 2011, 43, 345–349.
2. Treeprasertsuk, S.; Lopez-Jimenez, F.; Lindor, K.D. Nonalcoholic fatty liver disease and the
coronary artery disease. Dig. Dis. Sci. 2011, 56, 35–45.
3. Wang, Q. Molecular genetics of coronary artery disease. Curr. Opin. Cardiol. 2005, 20, 182–188.
4. Ross, R. Atherosclerosis—An inflammatory disease. N. Engl. J. Med. 1999, 340, 115–126.
5. Libby, P. Inflammation in atherosclerosis. Arterioscler. Thromb. Vasc. Biol. 2012, 32, 2045–2051.
6. Blanchet, X.; Cesarek, K.; Brandt, J.; Herwald, H.; Teupser, D.; Kuchenhoff, H.; Karshovska, E.;
Mause, S.F.; Siess, W.; Wasmuth, H.; et al. Inflammatory role and prognostic value of platelet
chemokines in acute coronary syndrome. Thromb. Haemost. 2014, 112, 1277–1287.
7. Dabek, J.; Kulach, A.; Smolka, G.; Wilczok, T.; Scieszka, J.; Gasior, Z. Expression of genes
encoding kinin receptors in peripheral blood mononuclear cells from patients with acute coronary
syndromes. Intern. Med. J. 2008, 38, 892–896.
8. Fuster, V.; Fayad, Z.A.; Moreno, P.R.; Poon, M.; Corti, R.; Badimon, J.J. Atherothrombosis and
high-risk plaque: Part II: Approaches by noninvasive computed tomographic/magnetic resonance
imaging. J. Am. Coll. Cardiol. 2005, 46, 1209–1218.
9. Collins, H.E.; Zhu-Mauldin, X.; Marchase, R.B.; Chatham, J.C. Stim1/orai1-mediated soce:
Current perspectives and potential roles in cardiac function and pathology. Am. J. Physiol. Heart
Circ. Physiol. 2013, 305, H446–H458.
10. Jardin, I.; Albarran, L.; Bermejo, N.; Salido, G.M.; Rosado, J.A. Homers regulate calcium entry
and aggregation in human platelets: A role for Homers in the association between STIM1 and
Orai1. Biochem. J. 2012, 445, 29–38.
11. Borst, O.; Schmidt, E.M.; Munzer, P.; Schonberger, T.; Towhid, S.T.; Elvers, M.; Leibrock, C.;
Schmid, E.; Eylenstein, A.; Kuhl, D.; et al. The serum- and glucocorticoid-inducible kinase 1
(SGK1) influences platelet calcium signaling and function by regulation of Orai1 expression in
megakaryocytes. Blood 2012, 119, 251–261.
12. Schmidt, R.; Bultmann, A.; Fischel, S.; Gillitzer, A.; Cullen, P.; Walch, A.; Jost, P.; Ungerer, M.;
Tolley, N.D.; Lindemann, S.; et al. Extracellular matrix metalloproteinase inducer (CD147) is a
novel receptor on platelets, activates platelets, and augments nuclear factor κB-dependent
inflammation in monocytes. Circ. Res. 2008, 102, 302–309.
13. Huang, W.C.; Chan, S.T.; Yang, T.L.; Tzeng, C.C.; Chen, C.C. Inhibition of Icam-1 gene
expression, monocyte adhesion and cancer cell invasion by targeting ikk complex: Molecular and
functional study of novel α-methylene-γ-butyrolactone derivatives. Carcinogenesis 2004, 25,
1925–1934.
14. Zelova, H.; Hosek, J. TNF-α signalling and inflammation: Interactions between old acquaintances.
Inflamm. Res. 2013, 62, 641–651.
15. Brakeman, P.R.; Lanahan, A.A.; O’Brien, R.; Roche, K.; Barnes, C.A.; Huganir, R.L.; Worley, P.F.
Homer: A protein that selectively binds metabotropic glutamate receptors. Nature 1997, 386,
284–288.
Int. J. Mol. Sci. 2015, 16 545
16. Tu, J.C.; Xiao, B.; Yuan, J.P.; Lanahan, A.A.; Leoffert, K.; Li, M.; Linden, D.J.; Worley, P.F.
Homer binds a novel proline-rich motif and links group 1 metabotropic glutamate receptors with
IP3 receptors. Neuron 1998, 21, 717–726.
17. Tu, J.C.; Xiao, B.; Naisbitt, S.; Yuan, J.P.; Petralia, R.S.; Brakeman, P.; Doan, A.; Aakalu, V.K.;
Lanahan, A.A.; Sheng, M.; et al. Coupling of mGluR/homer and PSD-95 complexes by the shank
family of postsynaptic density proteins. Neuron 1999, 23, 583–592.
18. Shiraishi-Yamaguchi, Y.; Furuichi, T. The homer family proteins. Genome Biol. 2007, 8,
doi:10.1186/gb-2007-8-2-206.
19. Guo, W.G.; Su, F.F.; Yuan, L.J.; Yang, G.D.; Shi, X.Q.; Li, R.Y.; Shu, Q.; Liu, X.T.; Lu, Z.F.;
Zheng, Q.S. Simvastatin inhibits angiotensin II-induced cardiac cell hypertrophy: Role of Homer 1a.
Clin. Exp. Pharmacol. Physiol. 2010, 37, 40–45.
20. Chiarello, C.; Bortoloso, E.; Carpi, A.; Furlan, S.; Volpe, P. Negative feedback regulation of
Homer 1a on norepinephrine-dependent cardiac hypertrophy. Exp. Cell Res. 2013, 319, 1804–1814.
21. Zhou, L.; Huang, Y.; Zhang, Y.; Zhao, Q.; Zheng, B.; Lou, Y.; Zhu, D. MGluR5 stimulating
Homer-PIKE formation initiates icariin induced cardiomyogenesis of mouse embryonic stem cells
by activating reactive oxygen species. Exp. Cell Res. 2013, 319, 1505–1514.
22. Lang, F.; Munzer, P.; Gawaz, M.; Borst, O. Regulation of STIM1/Orai1-dependent Ca2+
signalling in platelets. Thromb. Haemost. 2013, 110, 925–930.
23. Fuster, V.; Moreno, P.R.; Fayad, Z.A.; Corti, R.; Badimon, J.J. Atherothrombosis and high-risk
plaque: Part I: Evolving concepts. J. Am. Coll. Cardiol. 2005, 46, 937–954.
24. Hansson, G.K.; Libby, P. The immune response in atherosclerosis: A double-edged sword.
Nat. Rev. Immunol. 2006, 6, 508–519.
25. Libby, P.; Ridker, P.M.; Hansson, G.K.; Leducq Transatlantic Network on, A. Inflammation in
atherosclerosis: From pathophysiology to practice. J. Am. Coll. Cardiol. 2009, 54, 2129–2138.
26. Bobryshev, Y.V. Monocyte recruitment and foam cell formation in atherosclerosis. Micron 2006,
37, 208–222.
27. Weber, C.; Zernecke, A.; Libby, P. The multifaceted contributions of leukocyte subsets to
atherosclerosis: Lessons from mouse models. Nat. Rev. Immunol. 2008, 8, 802–815.
28. Mendel, I.; Yacov, N.; Harats, D.; Breitbart, E. Therapies targeting innate immunity for fighting
inflammation in atherosclerosis. Curr. Pharm. Des. 2014, in press.
29. Fenyo, I.M.; Gafencu, A.V. The involvement of the monocytes/macrophages in chronic
inflammation associated with atherosclerosis. Immunobiology 2013, 218, 1376–1384.
30. Bhagat, K.; Vallance, P. Effects of cytokines on nitric oxide pathways in human vasculature.
Curr. Opin. Nephrol. Hypertens. 1999, 8, 89–96.
31. Barath, P.; Fishbein, M.C.; Cao, J.; Berenson, J.; Helfant, R.H.; Forrester, J.S. Detection and
localization of tumor necrosis factor in human atheroma. Am. J. Cardiol. 1990, 65, 297–302.
32. Galea, J.; Armstrong, J.; Gadsdon, P.; Holden, H.; Francis, S.E.; Holt, C.M. Interleukin-1β in
coronary arteries of patients with ischemic heart disease. Arterioscler. Thromb. Vasc. Biol. 1996,
16, 1000–1006.
33. Qamar, A.; Rader, D.J. Effect of interleukin 1β inhibition in cardiovascular disease.
Curr. Opin. Lipidol. 2012, 23, 548–553.
Int. J. Mol. Sci. 2015, 16 546
34. Tarantino, G.; Costantini, S.; Finelli, C.; Capone, F.; Guerriero, E.; La Sala, N.; Gioia, S.; Castello, G.
Carotid intima-media thickness is predicted by combined eotaxin levels and severity of hepatic
steatosis at ultrasonography in obese patients with nonalcoholic fatty liver disease. PLoS One
2014, 9, e105610.
35. Tarantino, G.; Costantini, S.; Finelli, C.; Capone, F.; Guerriero, E.; La Sala, N.; Gioia, S.; Castello, G.
Is serum interleukin-17 associated with early atherosclerosis in obese patients? J. Transl. Med.
2014, 12, doi:10.1186/s12967-014-0214-1.
36. Wang, L.; Shah, P.K.; Wang, W.; Song, L.; Yang, M.; Sharifi, B.G. Tenascin-C deficiency in apo
E−/− mouse increases eotaxin levels: Implications for atherosclerosis. Atherosclerosis 2013, 227,
267–274.
37. Emanuele, E.; Falcone, C.; D’Angelo, A.; Minoretti, P.; Buzzi, M.P.; Bertona, M.; Geroldi, D.
Association of plasma eotaxin levels with the presence and extent of angiographic coronary artery
disease. Atherosclerosis 2006, 186, 140–145.
38. Fathi, R.; Marwick, T.H. Noninvasive tests of vascular function and structure: Why and how to
perform them. Am. Heart J. 2001, 141, 694–703.
39. Ciccone, M.M.; Scicchitano, P.; Zito, A.; Cortese, F.; Boninfante, B.; Falcone, V.A.; Quaranta, V.N.;
Ventura, V.A.; Zucano, A.; di Serio, F.; et al. Correlation between inflammatory markers of
atherosclerosis and carotid intima-media thickness in obstructive sleep apnea. Molecules 2014, 19,
1651–1662.
40. Boeuf, P.; Vigan-Womas, I.; Jublot, D.; Loizon, S.; Barale, J.C.; Akanmori, B.D.; Mercereau-Puijalon, O.;
Behr, C. Cyproquant-PCR: A real time RT-PCR technique for profiling human cytokines, based
on external rna standards, readily automatable for clinical use. BMC Immunol. 2005, 6,
doi:10.1186/1471-2172-6-5.
41. Sun, H.; Zhong, Y.J.; Zheng, X.L.; Wang, Q.; Yang, L.; Shi, F.; Yan, J.Q.; He, F.; Liao, L.C.;
Lin, Y.; et al. Critical role of CD40-mediated autocrine tumor necrosis factor-α in potentiation of
cisplatin-induced cytotoxicity in cancer cells. Cancer Sci. 2012, 103, 197–202.
© 2014 by the authors; licensee MDPI, Basel, Switzerland. This article is an open access article
distributed under the terms and conditions of the Creative Commons Attribution license
(http://creativecommons.org/licenses/by/4.0/).