Climate Science Communication and the Measurement...
49
Advances Pol. Psych. (forthcoming) PRELIMINARY DRAFT SUBJECT TO REVISION Climate Science Communication and the Measurement Problem Dan M. Kahan φ This paper examines the science-of-science-communication measurement problem. In its simplest form, the problem reflects the use of externally invalid measures of the dynamics that generate cultural conflict over risk and other policy-relevant facts. But at a more fundamental level, the sci- ence-of-science-communication measurement problem inheres in the phenomena being measured themselves. The “beliefs” individuals form about a societal risk such as climate change are not of a piece; rather they reflect the distinct clusters of inferences that individuals draw as they engage information for two distinct ends: to gain access to the collective knowledge furnished by science, and to enjoy the sense of identity enabled by membership in a community defined by particular cultural commitments. The paper shows how appropriately designed “science comprehension” tests—one general, and one specific to climate change—can be used to measure individuals’ rea- soning proficiency as collective-knowledge acquirers independently of their reasoning proficiency as cultural-identity protectors. Doing so reveals that there is in fact little disagreement among cul- turally diverse citizens on what science knows about climate change. The source of the climate- change controversy and like disputes is the contamination of education and politics with forms of cultural status competition that make it impossible for diverse citizens to express their reason as both collective-knowledge acquirers and cultural-identity protectors at the same time. 1. What is the science-of-science-communication measurement problem? The “double slit” experiment is the most bewitching illustration of the challenge that quantum physics poses to its classical predecessor. When a light beam is trained on a barrier with two parallel slits, the “wave like” character of light is shown to originate not in the interference of colliding streams of pho- tons, but rather in the probabilistic interference of each individual photon with itself as it simultaneously passes through “both slits at once.” More eerily still, the mere attempt to observe this phenomenon as it occurs—by placing sensors, say, at the entry to the slits— “forces” each photon to pass through just one of the slits and to travel an unmolested, “particle like” path to a screen, forming two parallel strips of light instead of the wave’s signature interference pattern (Feynman 1963, III: 1-4 to 1-6). Why collecting in- formation on the “dualistic” wave-particle quality of photons (or electrons or any other elementary parti- cle) eviscerates every trace of this process is known in the study of physics as the “measurement prob- lem,” and it emerges as the central feature of every distinctive element of quantum mechanics. φ Elizabeth K. Dollard Professor of Law and Professor of Psychology, Yale Law School. This paper is a highly con- densed version of the 17.5 hour “keynote” talk given at the annual USDA-EPA Forestry and Agriculture Green- house Gas Modeling Forum on June 2-3, 2014. I am grateful to participants in the forum for their stamina and their encouraging feedback. Funding for research described in this paper was supplied by the Annenberg Public Policy Center in connection with the Annenberg/Cultural Cognition Project “Cognitive Adaptation Research Initiative,” and by the Skoll Global Threats Fund, in connection with the “Southeast Florida Evidence-based Science Commu- nication Imitative.” The idea that people use their reason to apprehend science both as knowledge-seekers and iden- tity-protectors grows out of conversations with my CARI Initiative collaborator Kathleen Hall Jamieson. For inter- preting Southeast Florida for me in a manner that only a native could, I am indebted to my SFESCI collaborator Katie Carpenter. I am grateful to David Friedman for reflective comments.
Transcript of Climate Science Communication and the Measurement...
Advances Pol. Psych. (forthcoming) PRELIMINARY DRAFT SUBJECT TO REVISION
Climate Science Communication and the Measurement Problem
Dan M. Kahan φ
This paper examines the science-of-science-communication measurement problem. In its simplest form, the problem reflects the use of externally invalid measures of the dynamics that generate cultural conflict over risk and other policy-relevant facts. But at a more fundamental level, the sci-ence-of-science-communication measurement problem inheres in the phenomena being measured themselves. The “beliefs” individuals form about a societal risk such as climate change are not of a piece; rather they reflect the distinct clusters of inferences that individuals draw as they engage information for two distinct ends: to gain access to the collective knowledge furnished by science, and to enjoy the sense of identity enabled by membership in a community defined by particular cultural commitments. The paper shows how appropriately designed “science comprehension” tests—one general, and one specific to climate change—can be used to measure individuals’ rea-soning proficiency as collective-knowledge acquirers independently of their reasoning proficiency as cultural-identity protectors. Doing so reveals that there is in fact little disagreement among cul-turally diverse citizens on what science knows about climate change. The source of the climate-change controversy and like disputes is the contamination of education and politics with forms of cultural status competition that make it impossible for diverse citizens to express their reason as both collective-knowledge acquirers and cultural-identity protectors at the same time.
1. What is the science-of-science-communication measurement problem? The “double slit” experiment is the most bewitching illustration of the challenge that quantum
physics poses to its classical predecessor. When a light beam is trained on a barrier with two parallel slits, the “wave like” character of light is shown to originate not in the interference of colliding streams of pho-tons, but rather in the probabilistic interference of each individual photon with itself as it simultaneously passes through “both slits at once.” More eerily still, the mere attempt to observe this phenomenon as it occurs—by placing sensors, say, at the entry to the slits— “forces” each photon to pass through just one of the slits and to travel an unmolested, “particle like” path to a screen, forming two parallel strips of light instead of the wave’s signature interference pattern (Feynman 1963, III: 1-4 to 1-6). Why collecting in-formation on the “dualistic” wave-particle quality of photons (or electrons or any other elementary parti-cle) eviscerates every trace of this process is known in the study of physics as the “measurement prob-lem,” and it emerges as the central feature of every distinctive element of quantum mechanics.
φ Elizabeth K. Dollard Professor of Law and Professor of Psychology, Yale Law School. This paper is a highly con-densed version of the 17.5 hour “keynote” talk given at the annual USDA-EPA Forestry and Agriculture Green-house Gas Modeling Forum on June 2-3, 2014. I am grateful to participants in the forum for their stamina and their encouraging feedback. Funding for research described in this paper was supplied by the Annenberg Public Policy Center in connection with the Annenberg/Cultural Cognition Project “Cognitive Adaptation Research Initiative,” and by the Skoll Global Threats Fund, in connection with the “Southeast Florida Evidence-based Science Commu-nication Imitative.” The idea that people use their reason to apprehend science both as knowledge-seekers and iden-tity-protectors grows out of conversations with my CARI Initiative collaborator Kathleen Hall Jamieson. For inter-preting Southeast Florida for me in a manner that only a native could, I am indebted to my SFESCI collaborator Katie Carpenter. I am grateful to David Friedman for reflective comments.
My focus in in this lecture is on another “measurement problem”: one distinctive of the science of science communication. The occasion for this bewitching difficulty is not the “dualistic” qualities of par-ticles; it is the divided nature of people as reasoners. Every individual, I want to suggest, employs her reasoning powers to apprehend what is known to science from two, parallel perspectives simultaneously: a collective-knowledge-acquisition one, and a cultural-identity-protective one. Misapprehension of how these two forms of engaging information interact—variously reinforcing one another and canceling each other out—is indeed the source of myriad difficulties in both the study and practice of science communi-cation. But much like the measurement problem of quantum physics, the measurement problem of the science of science communication involves how observation perturbs this dualism: the intrusion of cultur-al status competition into the educational, political, and other domains in which we take stock of what we know forces individual reasoners to engage information from one of these perspectives only. For the “measurement problem” distinctive of science communication, this is the source of interference—one that disrupts the usual convergence of diverse citizens on empirical evidence essential to their individual and collective decisionmaking.
The idea that the science of science communication has this sort of “measurement problem” is, of course, just a particular schematic representation of a much more complicated set of processes. As is so for concepts like “collapsing wave functions,” “superposition,” “entanglement” and the other elements of the Copenhagen Interpretation of what happens in the double slit experiment, the way to assess the value of the science-of-science-communication “measurement problem” as a theoretical construct is to show what can be done with it to explain, predict, and manage a set of consequential but ultimately unobserva-ble phenomena.
In this lecture, I will take a step toward demonstrating the utility of the science-of-science-communication measurement problem by using it to address the communication of climate science. The failure of widely accessible, compelling science to quiet persistent cultural controversy over the basic facts of climate change is the most spectacular science communication failure of our day. We will neither understand nor remedy this failure, I want to suggest, unless we take account of its source in the conflict that our own knowledge-assessment practices create between the use of reason to know what is known and the use of reason to be who we are.
2. What does “belief in evolution” measure? But forget climate change for a moment and consider instead another controversial part of sci-
ence: the theory of evolution. Around once a year, Gallup or another major commercial survey firm re-leases a poll showing that approximately 45% of the U.S. public rejects the proposition that human beings evolved from another species of animal. The news is inevitably greeted by widespread expressions of dismay from media commentators, who lament what this finding says about the state of science education in our country.
Actually, it doesn’t say anything. There are many ways to assess the quality of instruction that U.S. students receive in science. But what fraction of them say they “believe” in evolution is not one of them.
Numerous studies have found that profession of “belief” in evolution has no correlation with un-derstanding of basic evolutionary science. Individuals who say they “believe” are no more likely than those who say they “don’t” to give the correct responses to questions pertaining to natural selection, ran-dom mutation, and genetic variance—the core elements of the modern synthesis (Shtulman 2006; De-mastes, Settlage & Good 1995; Bishop & Anderson 1990).
Nor can any valid inference be drawn about a U.S. survey respondents’ profession of “belief” in human evolution and his or her comprehension of science generally. The former is not a measure of the latter.
- 2-
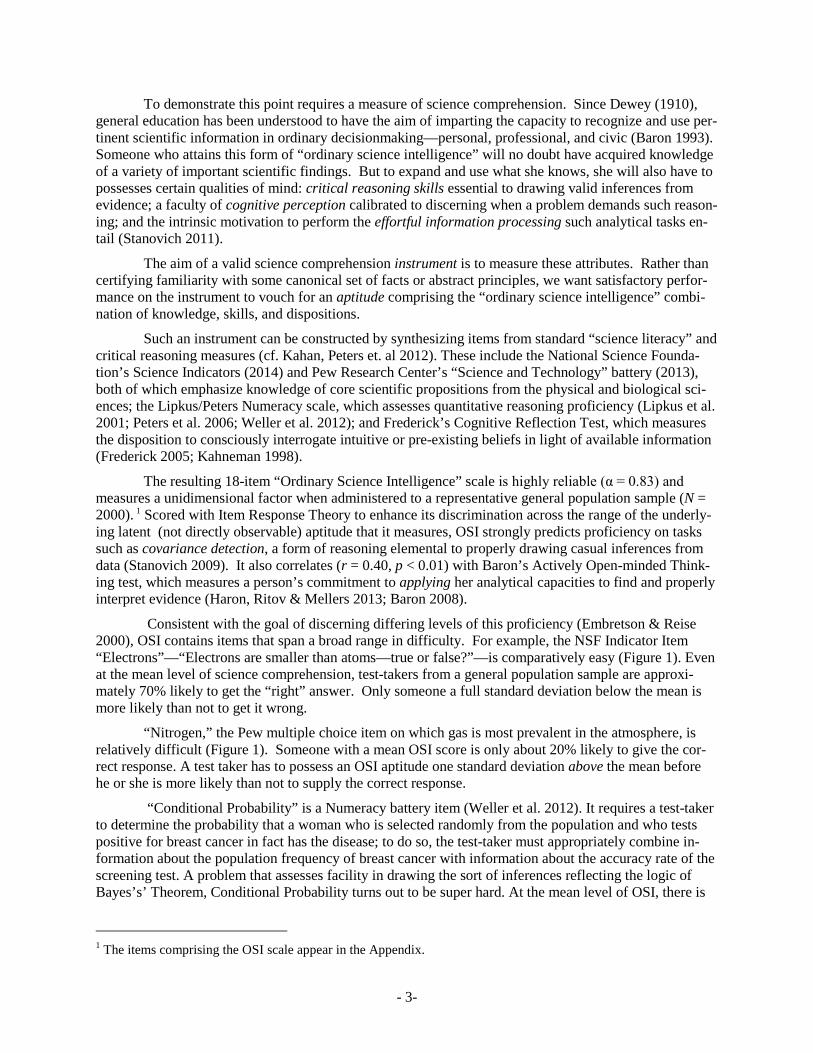
To demonstrate this point requires a measure of science comprehension. Since Dewey (1910), general education has been understood to have the aim of imparting the capacity to recognize and use per-tinent scientific information in ordinary decisionmaking—personal, professional, and civic (Baron 1993). Someone who attains this form of “ordinary science intelligence” will no doubt have acquired knowledge of a variety of important scientific findings. But to expand and use what she knows, she will also have to possesses certain qualities of mind: critical reasoning skills essential to drawing valid inferences from evidence; a faculty of cognitive perception calibrated to discerning when a problem demands such reason-ing; and the intrinsic motivation to perform the effortful information processing such analytical tasks en-tail (Stanovich 2011).
The aim of a valid science comprehension instrument is to measure these attributes. Rather than certifying familiarity with some canonical set of facts or abstract principles, we want satisfactory perfor-mance on the instrument to vouch for an aptitude comprising the “ordinary science intelligence” combi-nation of knowledge, skills, and dispositions.
Such an instrument can be constructed by synthesizing items from standard “science literacy” and critical reasoning measures (cf. Kahan, Peters et. al 2012). These include the National Science Founda-tion’s Science Indicators (2014) and Pew Research Center’s “Science and Technology” battery (2013), both of which emphasize knowledge of core scientific propositions from the physical and biological sci-ences; the Lipkus/Peters Numeracy scale, which assesses quantitative reasoning proficiency (Lipkus et al. 2001; Peters et al. 2006; Weller et al. 2012); and Frederick’s Cognitive Reflection Test, which measures the disposition to consciously interrogate intuitive or pre-existing beliefs in light of available information (Frederick 2005; Kahneman 1998).
The resulting 18-item “Ordinary Science Intelligence” scale is highly reliable (α = 0.83) and measures a unidimensional factor when administered to a representative general population sample (N = 2000). 1 Scored with Item Response Theory to enhance its discrimination across the range of the underly-ing latent (not directly observable) aptitude that it measures, OSI strongly predicts proficiency on tasks such as covariance detection, a form of reasoning elemental to properly drawing casual inferences from data (Stanovich 2009). It also correlates (r = 0.40, p < 0.01) with Baron’s Actively Open-minded Think-ing test, which measures a person’s commitment to applying her analytical capacities to find and properly interpret evidence (Haron, Ritov & Mellers 2013; Baron 2008).
Consistent with the goal of discerning differing levels of this proficiency (Embretson & Reise 2000), OSI contains items that span a broad range in difficulty. For example, the NSF Indicator Item “Electrons”—“Electrons are smaller than atoms—true or false?”—is comparatively easy (Figure 1). Even at the mean level of science comprehension, test-takers from a general population sample are approxi-mately 70% likely to get the “right” answer. Only someone a full standard deviation below the mean is more likely than not to get it wrong.
“Nitrogen,” the Pew multiple choice item on which gas is most prevalent in the atmosphere, is relatively difficult (Figure 1). Someone with a mean OSI score is only about 20% likely to give the cor-rect response. A test taker has to possess an OSI aptitude one standard deviation above the mean before he or she is more likely than not to supply the correct response.
“Conditional Probability” is a Numeracy battery item (Weller et al. 2012). It requires a test-taker to determine the probability that a woman who is selected randomly from the population and who tests positive for breast cancer in fact has the disease; to do so, the test-taker must appropriately combine in-formation about the population frequency of breast cancer with information about the accuracy rate of the screening test. A problem that assesses facility in drawing the sort of inferences reflecting the logic of Bayes’s’ Theorem, Conditional Probability turns out to be super hard. At the mean level of OSI, there is
1 The items comprising the OSI scale appear in the Appendix.
- 3-
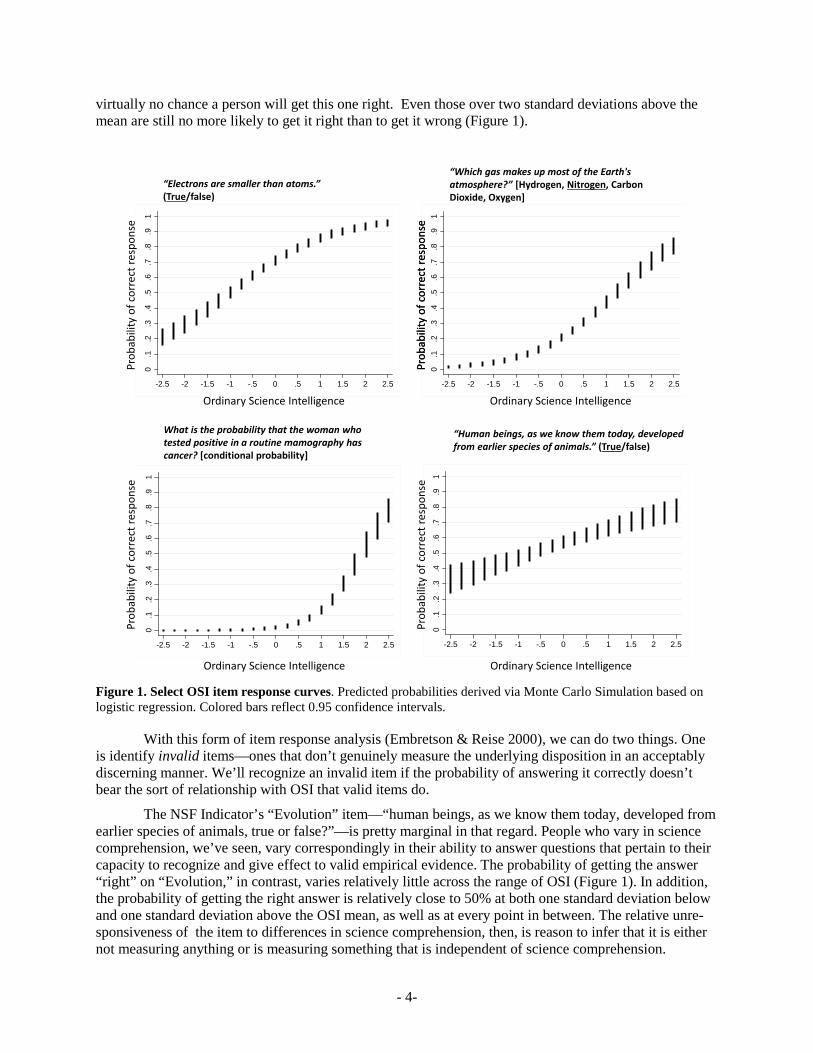
virtually no chance a person will get this one right. Even those over two standard deviations above the mean are still no more likely to get it right than to get it wrong (Figure 1).
Figure 1. Select OSI item response curves. Predicted probabilities derived via Monte Carlo Simulation based on logistic regression. Colored bars reflect 0.95 confidence intervals.
With this form of item response analysis (Embretson & Reise 2000), we can do two things. One is identify invalid items—ones that don’t genuinely measure the underlying disposition in an acceptably discerning manner. We’ll recognize an invalid item if the probability of answering it correctly doesn’t bear the sort of relationship with OSI that valid items do.
The NSF Indicator’s “Evolution” item—“human beings, as we know them today, developed from earlier species of animals, true or false?”—is pretty marginal in that regard. People who vary in science comprehension, we’ve seen, vary correspondingly in their ability to answer questions that pertain to their capacity to recognize and give effect to valid empirical evidence. The probability of getting the answer “right” on “Evolution,” in contrast, varies relatively little across the range of OSI (Figure 1). In addition, the probability of getting the right answer is relatively close to 50% at both one standard deviation below and one standard deviation above the OSI mean, as well as at every point in between. The relative unre-sponsiveness of the item to differences in science comprehension, then, is reason to infer that it is either not measuring anything or is measuring something that is independent of science comprehension.
0.1
.2.3
.4.5
.6.7
.8.9
1
-2.5 -2 -1.5 -1 -.5 0 .5 1 1.5 2 2.5
0.1
.2.3
.4.5
.6.7
.8.9
1
-2.5 -2 -1.5 -1 -.5 0 .5 1 1.5 2 2.5
0.1
.2.3
.4.5
.6.7
.8.9
1
-2.5 -2 -1.5 -1 -.5 0 .5 1 1.5 2 2.5
0.1
.2.3
.4.5
.6.7
.8.9
1
-2.5 -2 -1.5 -1 -.5 0 .5 1 1.5 2 2.5
Ordinary Science Intelligence Ordinary Science Intelligence
Ordinary Science Intelligence Ordinary Science Intelligence
Prob
abili
ty o
f cor
rect
resp
onse
Prob
abili
ty o
f cor
rect
resp
onse
Prob
abili
ty o
f cor
rect
resp
onse
Prob
abili
ty o
f cor
rect
resp
onse
“Which gas makes up most of the Earth's atmosphere?” [Hydrogen, Nitrogen, Carbon Dioxide, Oxygen]
“Human beings, as we know them today, developed from earlier species of animals.” (True/false)
What is the probability that the woman who tested positive in a routine mamography has cancer? [conditional probability]
“Electrons are smaller than atoms.” (True/false)
Prob
abili
ty o
f cor
rect
resp
onse
- 4-
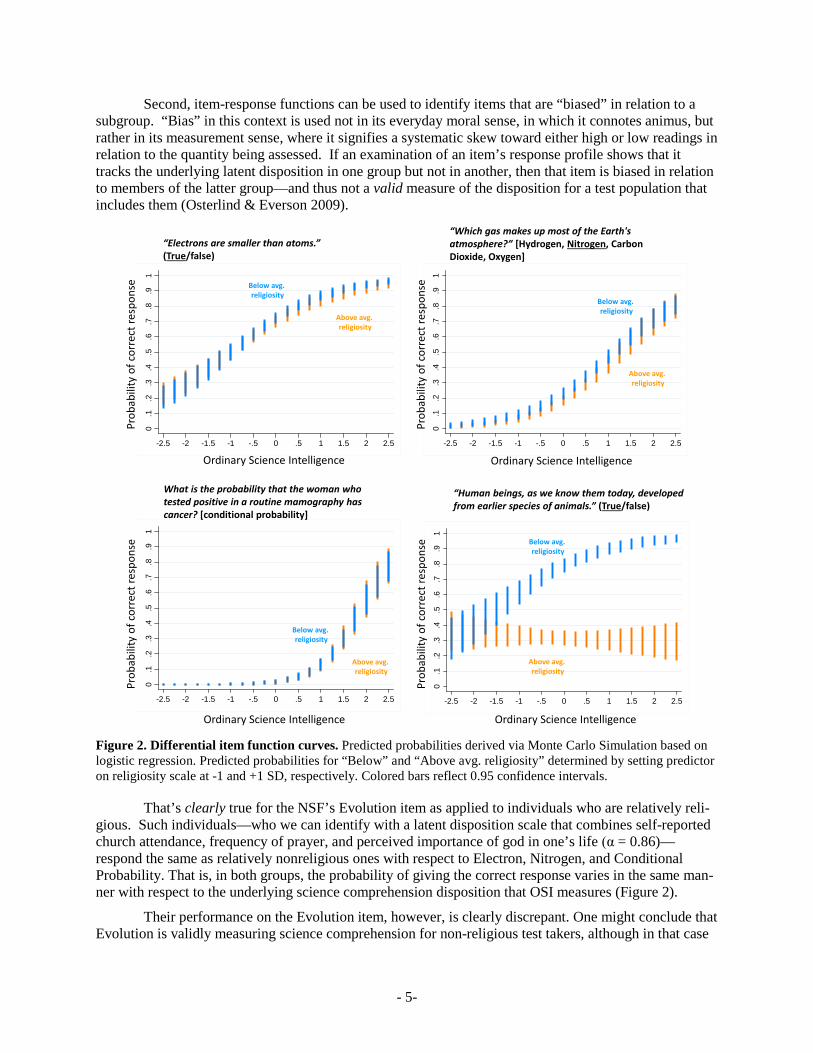
Second, item-response functions can be used to identify items that are “biased” in relation to a subgroup. “Bias” in this context is used not in its everyday moral sense, in which it connotes animus, but rather in its measurement sense, where it signifies a systematic skew toward either high or low readings in relation to the quantity being assessed. If an examination of an item’s response profile shows that it tracks the underlying latent disposition in one group but not in another, then that item is biased in relation to members of the latter group—and thus not a valid measure of the disposition for a test population that includes them (Osterlind & Everson 2009).
Figure 2. Differential item function curves. Predicted probabilities derived via Monte Carlo Simulation based on logistic regression. Predicted probabilities for “Below” and “Above avg. religiosity” determined by setting predictor on religiosity scale at -1 and +1 SD, respectively. Colored bars reflect 0.95 confidence intervals.
That’s clearly true for the NSF’s Evolution item as applied to individuals who are relatively reli-gious. Such individuals—who we can identify with a latent disposition scale that combines self-reported church attendance, frequency of prayer, and perceived importance of god in one’s life (α = 0.86)—respond the same as relatively nonreligious ones with respect to Electron, Nitrogen, and Conditional Probability. That is, in both groups, the probability of giving the correct response varies in the same man-ner with respect to the underlying science comprehension disposition that OSI measures (Figure 2).
Their performance on the Evolution item, however, is clearly discrepant. One might conclude that Evolution is validly measuring science comprehension for non-religious test takers, although in that case
0.1
.2.3
.4.5
.6.7
.8.9
1
-2.5 -2 -1.5 -1 -.5 0 .5 1 1.5 2 2.5
0.1
.2.3
.4.5
.6.7
.8.9
1
-2.5 -2 -1.5 -1 -.5 0 .5 1 1.5 2 2.5
0.1
.2.3
.4.5
.6.7
.8.9
1
-2.5 -2 -1.5 -1 -.5 0 .5 1 1.5 2 2.5
0.1
.2.3
.4.5
.6.7
.8.9
1-2.5 -2 -1.5 -1 -.5 0 .5 1 1.5 2 2.5
Ordinary Science Intelligence Ordinary Science Intelligence
Ordinary Science Intelligence Ordinary Science Intelligence
Prob
abili
ty o
f cor
rect
resp
onse
Prob
abili
ty o
f cor
rect
resp
onse
Prob
abili
ty o
f cor
rect
resp
onse
“Which gas makes up most of the Earth's atmosphere?” [Hydrogen, Nitrogen, Carbon Dioxide, Oxygen]
“Human beings, as we know them today, developed from earlier species of animals.” (True/false)
What is the probability that the woman who tested positive in a routine mamography has cancer? [conditional probability]
“Electrons are smaller than atoms.” (True/false)
Prob
abili
ty o
f cor
rect
resp
onse
Above avg.religiosity
Below avg.religiosity
Above avg.religiosity
Below avg.religiosity
Above avg.religiosity
Below avg.religiosity
Above avg.religiosity
Below avg.religiosity
- 5-
it is a very easy question: the likelihood a nonreligious individual with a mean OSI score will get the “right” answer is 80%—even higher than the likelihood that this person would respond correctly to the relatively simple Electron item.
In contrast, for a relatively religious individual with a mean OSI score, the probability of giving the correct response is around 30%. This 50 percentage-point differential tells us that Evolution does not have the same relationship to the latent OSI disposition in these two groups.
Indeed, it is obvious that Evolution has no relation to OSI whatsoever in relatively religious re-spondents. For such individuals, the predicted probability of giving the correct answer does not increase as individuals display a higher degree of science comprehension. On the contrary, it trends slightly downward, suggesting that religious individuals highest in OSI are even more likely to get the question “wrong.”
It should be obvious but just to be clear: these patterns have nothing to do with any correlation between OSI and religiosity. There is in fact a modest negative correlation between the two (r = -0.17, p < 0.01). But the “differential item function” test (Osterlind & Everson 2009) I’m applying identifies dif-ferences among religious and nonreligious individuals of the same OSI level. The difference in perfor-mance on the item speaks to the adequacy of Evolution as a measure of knowledge and reasoning capaci-ty and not to the relative quality of those characteristics among members of the two groups.
The bias with respect to religious individuals—and hence the invalidity of the item as a measure of OSI for a general population sample—is most striking in relation to respondents’ performance on Con-ditional Probability. There is about a 70% (± 10 percentage points, at the 0.95 level of confidence) proba-bility that someone two and a quarter standard deviations above the mean on OSI will answer this ex-tremely difficult question correctly. Of course, there aren’t many people two and a quarter standard devia-tions above the mean (the 98th percentile), but certainly they do exist, and they are not dramatically less likely to be above average in religiosity. Yet if one of these exceptionally science-comprehending indi-viduals is relatively religious, the probability that he or she will give the right answer to the NSF Evolu-tion item is about 25% (± 10 percentage points, at the 0.95 level of confidence)—compared to 80% for the moderately nonreligious person who is merely average in OSI and whose probability of answering Conditional Probability correctly is epsilon.
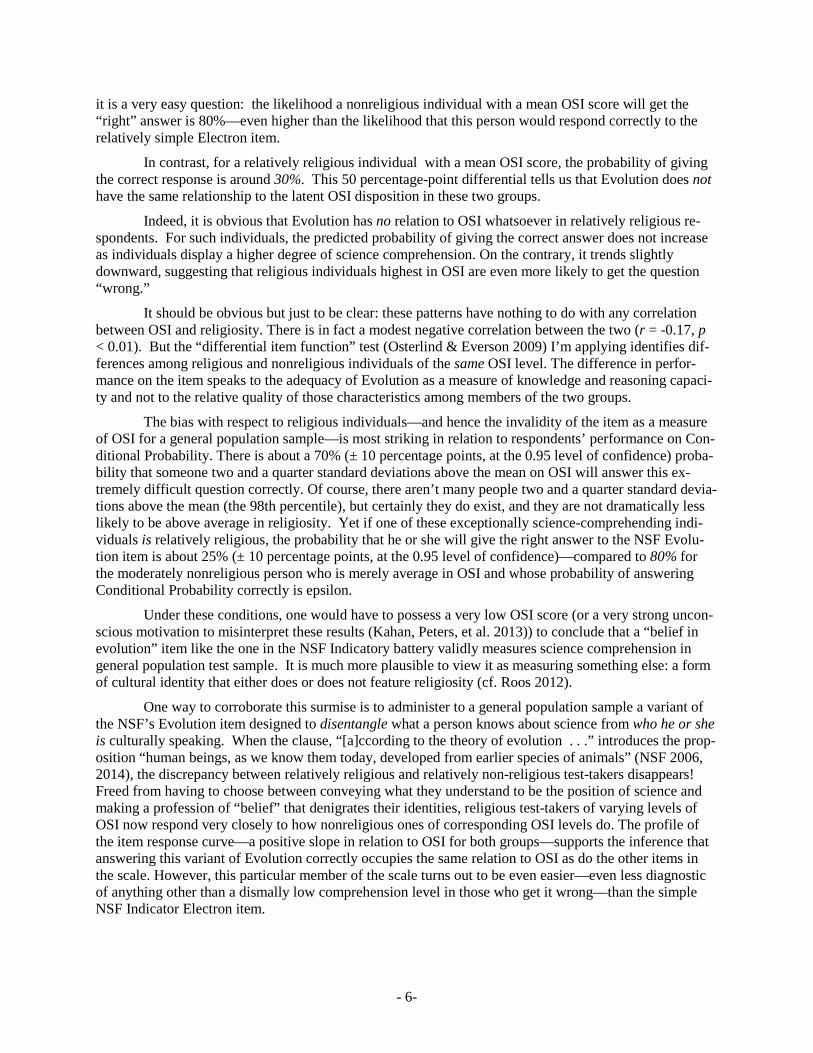
Under these conditions, one would have to possess a very low OSI score (or a very strong uncon-scious motivation to misinterpret these results (Kahan, Peters, et al. 2013)) to conclude that a “belief in evolution” item like the one in the NSF Indicatory battery validly measures science comprehension in general population test sample. It is much more plausible to view it as measuring something else: a form of cultural identity that either does or does not feature religiosity (cf. Roos 2012).
One way to corroborate this surmise is to administer to a general population sample a variant of the NSF’s Evolution item designed to disentangle what a person knows about science from who he or she is culturally speaking. When the clause, “[a]ccording to the theory of evolution . . .” introduces the prop-osition “human beings, as we know them today, developed from earlier species of animals” (NSF 2006, 2014), the discrepancy between relatively religious and relatively non-religious test-takers disappears! Freed from having to choose between conveying what they understand to be the position of science and making a profession of “belief” that denigrates their identities, religious test-takers of varying levels of OSI now respond very closely to how nonreligious ones of corresponding OSI levels do. The profile of the item response curve—a positive slope in relation to OSI for both groups—supports the inference that answering this variant of Evolution correctly occupies the same relation to OSI as do the other items in the scale. However, this particular member of the scale turns out to be even easier—even less diagnostic of anything other than a dismally low comprehension level in those who get it wrong—than the simple NSF Indicator Electron item.
- 6-
Figure 3. Impact of disentangling identity from knowledge on Evolution item. Predicted probabilities derived via Monte Carlo Simulation based on logistic regression. Predicted probabilities for “Below” and “Above avg. relig-iosity” determined by setting predictor on religiosity scale at -1 and +1 SD, respectively. Colored bars reflect 0.95 confidence intervals.
As I mentioned, there is no correlation between saying one “believes” in evolution and meaning-ful comprehension of natural selection and the other elements of the modern synthesis. Sadly, the propor-tion who can give a cogent and accurate account of these mechanisms is low among both “believers” and “nonbelievers,” even in highly educated samples, including college biology students (Bishop & Anderson 1990). Increasing the share of the population that comprehends these important—indeed, astonishing and awe-inspiring—scientific insights is very much a proper goal for those who want to improve the science education that Americans receive.
The incidence of “disbelief” in evolution in the U.S. population, moreover, poses no barrier to at-taining it. This conclusion, too, has been demonstrated by outstanding empirical research in the field of education science (Lawson & Worsnop 2006). The most effective way to teach the modern synthesis to high school and college students who “do not believe” in evolution, this research suggests, is to focus on exactly the same thing one should focus on to teach evolutionary science to those who say they do “be-lieve” but very likely don’t understand it: the correction of various naive misconceptions that concern the tendency of people to attribute evolution not to supernatural forces but to functionalist mechanisms and to the hereditability of acquired traits (Demastes, Settlage & Good 1995; Bishop & Anderson 1990)..
0.1
.2.3
.4.5
.6.7
.8.9
1
-2.5 -2 -1.5 -1 -.5 0 .5 1 1.5 2 2.5
0.1
.2.3
.4.5
.6.7
.8.9
1
-2.5 -2 -1.5 -1 -.5 0 .5 1 1.5 2 2.5
“According to the theory of evolution, human beings, as we know them today, developed from earlier species of animals.” (True/false)
Ordinary Science Intelligence Ordinary Science Intelligence
Prob
abili
ty o
f cor
rect
resp
onse
Prob
abili
ty o
f cor
rect
resp
onse
0.1
.2.3
.4.5
.6.7
.8.9
1
-2.5 -2 -1.5 -1 -.5 0 .5 1 1.5 2 2.5
Ordinary Science Intelligence
Prob
abili
ty o
f cor
rect
resp
onse
0.1
.2.3
.4.5
.6.7
.8.9
1
-2.5 -2 -1.5 -1 -.5 0 .5 1 1.5 2 2.5
Ordinary Science Intelligence
Prob
abili
ty o
f cor
rect
resp
onse
“Human beings, as we know them today, developed from earlier species of animals.” (True/false)
Above avg.religiosity
Below avg.religiosity
Above avg.religiosity
Below avg.religiosity
- 7-
Not surprisingly, the students most able to master the basic elements of evolutionary science are those who demonstrate the highest proficiency in the sort of critical reasoning dispositions on which sci-ence comprehension depends. Yet even among these students, learning the modern synthesis does not make a student who started out professing “not to believe in” evolution any more likely to say she now does “believe in” it (Lawson & Worsnop 2006).
Indeed, treating profession of “belief” as one of the objectives of instruction is thought to make it less likely that students will learn the modern synthesis. “[E]very teacher who has addressed the issue of special creation and evolution in the classroom,” the authors of one study (Lawson & Worsnop 2006, p. 165) conclude,
already knows that highly religious students are not likely to change their belief in special crea-tion as a consequence of relative brief lessons on evolution. Our suggestion is that it is best not to try to [change students’ beliefs], not directly at least. Rather, our experience and results suggest to us that a more prudent plan would be to utilize instruction time, much as we did, to explore the al-ternatives, their predicted consequences, and the evidence in a hypothetico-deductive way in an effort to provoke argumentation and the use of reflective thought. Thus, the primary aims of the lesson should not be to convince students of one belief or another, but, instead, to help students (a) gain a better understanding of how scientists compare alternative hypotheses, their predicat-ed consequences, and the evidence to arrive at belief and (b) acquire skill in the use of this im-portant reasoning pattern—a pattern that appears to be necessary for independent learning and critical thought.
This research is to the science of science communication’s “measurement problem” what the double slit experiment is to quantum mechanics’. All students, including the ones most readily disposed to learn science, can be expected to protect their cultural identities from the threat that denigrating cultural meanings pose to it. But all such students—all of them—can also be expected to use their reasoning apti-tudes to acquire understanding of what is known to science. They can and will do both—at the very same time. But only when the dualistic quality of their reason as collective-knowledge acquirers and identity-protectors is not interfered with by forms of assessment that stray from science comprehension and in-trude into the domain of cultural identity and expression. A simple (and simple-minded) test can be ex-pected to force disclosure of only one side of their reason. And what enables the most exquisitely de-signed course to succeed in engaging the student’s reason as an acquirer of collective knowledge is exact-ly the care and skill with which the educator avoids provoking the identity-protective properties of her reason.
3. What does “belief in” global warming measure? Just as we can use empirical methods to determine that “belief in evolution” measures “who one
is” rather than “what one knows,” so we can use these methods to assess what “belief in global warming” measures. An illuminating way to start is by seeing what a valid measure of “belief in global warming” looks like.
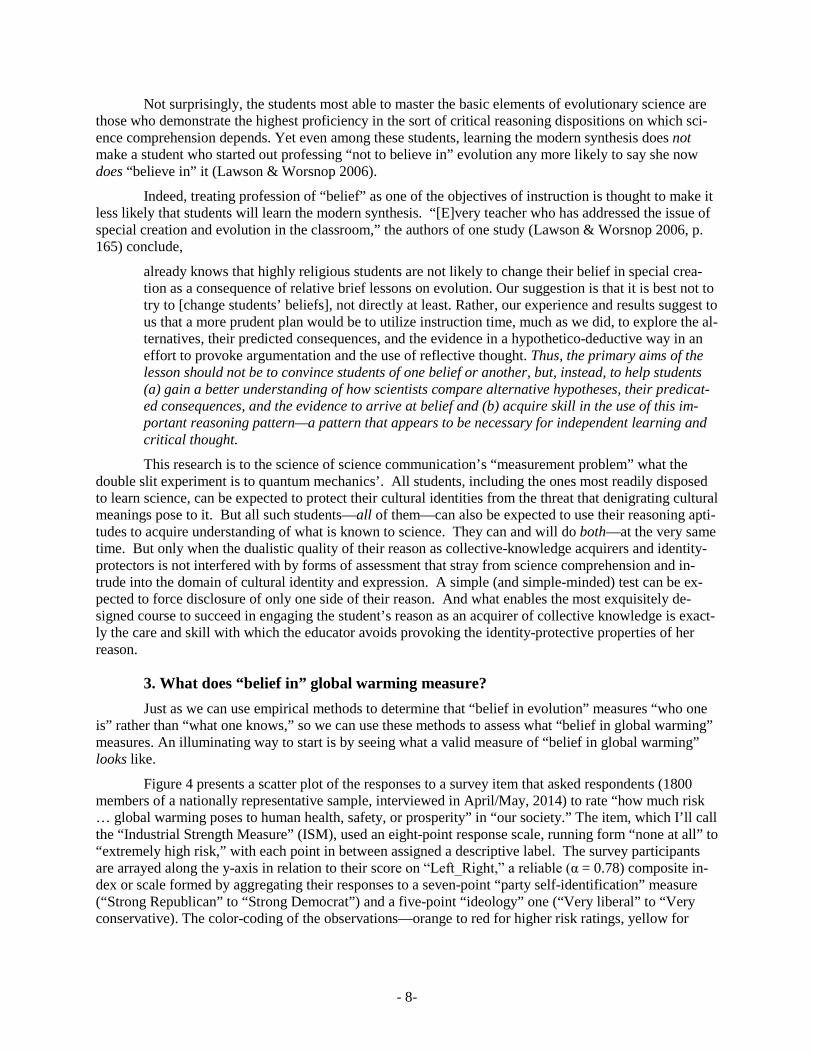
Figure 4 presents a scatter plot of the responses to a survey item that asked respondents (1800 members of a nationally representative sample, interviewed in April/May, 2014) to rate “how much risk … global warming poses to human health, safety, or prosperity” in “our society.” The item, which I’ll call the “Industrial Strength Measure” (ISM), used an eight-point response scale, running form “none at all” to “extremely high risk,” with each point in between assigned a descriptive label. The survey participants are arrayed along the y-axis in relation to their score on “Left_Right,” a reliable (α = 0.78) composite in-dex or scale formed by aggregating their responses to a seven-point “party self-identification” measure (“Strong Republican” to “Strong Democrat”) and a five-point “ideology” one (“Very liberal” to “Very conservative). The color-coding of the observations—orange to red for higher risk ratings, yellow for
- 8-
middling ones, and green to blue for lower ones—helps to reveal the strength of the correlation between the global-warming risk ISM and left-right political outlooks.
Figure 4. Climate change risk perceptions. N = 1,751. X-axis is continuous political outlook scale formed by ag-gregating responses to 7-point party identification item and 5-point “liberal-conservative” ideology item (α=0.78).
Exactly how “strong,” though, is that correlation? An “r” of “- 0.65” might intuitively seem pretty big, but determining its practical significance requires a meaningful benchmark.
As it turns out, subjects’ responses to the party self-identification and liberal-conservative ideolo-gy items are correlated to almost exactly the same degree (r = 0.64, p < 0.01). So in this nationally repre-sentative sample, perceptions of the risk of global warming are as strongly associated with respondents’ right-left political outlooks as the indicators of their political outlooks are with one another.
We could thus combine the global-warming ISM with the party-identification and liberal-conservative ideology items to create an even more reliable political outlook scale (α = 0.81), one with which we could predict with even greater accuracy their positions on issues like Obamacare and Roe v. Wade.
The global-warming ISM has another interesting property, one it shares with ISMs for other puta-tive hazards: it coheres very strongly with professed beliefs about the facts relevant to assessing the speci-fied risk source (Dohmen eta al. 2011; Ganzach et al. 2008; Weber et al. 2002). “Cronbach’s α” is a con-ventional measure of scale reliability that ranges from 0.0 to 1.0; a score of 0.70 is generally regarded as signifying that a set of indicators display the requisite degree of intercorrelation necessary to measure of some underlying latent variable. When global-warming ISM is combined with items measuring whether people believe that “average global temperatures are increasing,” that “[h]human activity is causing glob-al temperatures to rise,” and that global warming will result in various “bad consequences for human be-ings” if not “counteracted,” the resulting scale has a Cronbach’s α of 0.95 (Kahan 2011). These “belief” items, then, can also be viewed as measuring the same thing as the “risk seriousness” item—viz., a latent disposition to form coherent sets of beliefs about the facts and consequences of the climate change.
01
23
45
67
-1.6 -1 0 1 1.6
None at all
Extremely highrisk
Very low
Low
Between low and moderate
Moderate
Between moderate and high
High
Very liberalStrong Democrat
Very ConservativeStrong Republican
LiberalDemocrat
ConservativeRepublican
ModerateIndependent
“How much risk do you believe global warming poses to human health, safety, or prosperity?”
r = - 0.65, p < 0.01
Left_right
- 9-
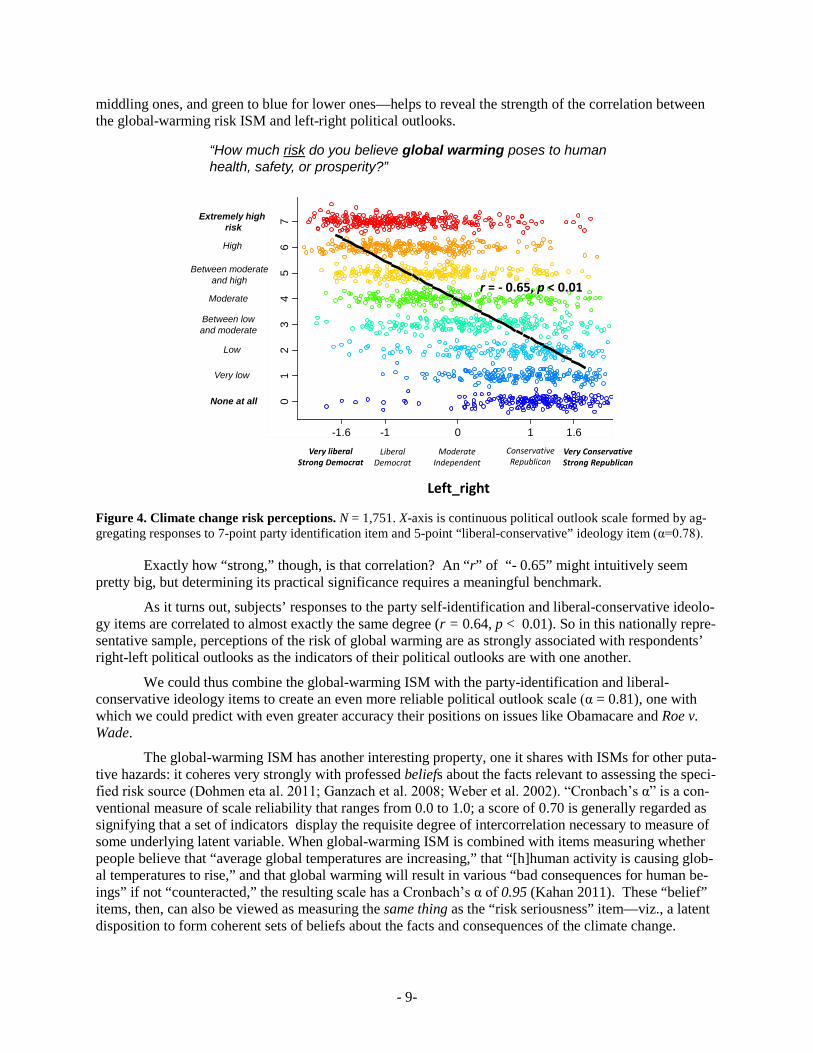
Figure 5. Polarization on facts of global warming. N = 1,769. Subjects classified in relation to “left_right,” a con-tinuous political outlook scale formed by aggregating responses to 7-point party identification item and 5-point “lib-eral-conservative” ideology item (α = 0.78). CIs reflect 0.95 level of confidence for estimated population mean.
Not surprisingly—indeed, as a matter of simple logic—there is a comparably high degree of co-herence between “belief in climate change” and political outlooks. In this sample, some 75% of the indi-viduals whose scores placed them to the “left” of the mean on the political outlook scale indicated that they believe human activity is the primary source of global warming. Only 22% of those who scores placed them to the “right” of the mean indicated that they believed that, and 58% of them indicated that they did not believe there was “solid evidence that the average temperature on earth has been getting warmer over the past few decades.” These figures are in accord with ones consistently reported by schol-ars and public opinion research centers for over a decade (e.g., Silver 2013).
So we could form an even better scale (α = 0.86) —an even more discerning measure of the dis-position that orients individuals with respect to disputed political issues—by simply combining responses to the global warming ISM, the “belief in” global warming measure, and the two political outlook items (liberal-conservative ideology and partisan self-identification). From a psychometric perspective, all four of these items can be viewed as measuring the same thing: a latent (unobserved) disposition that causes different groups of people to adopt coherent sets of opposing stances on political matters (DeVellis 2012). 2
Nevertheless, advocacy groups regularly report polls that paint a very different picture. “A new study,” their press releases announce, show that “an overwhelming majority of Americans”—“Blue State and Red ones alike,” enough “to swing” an upcoming presidential election etc.— “support taking action” immediately to combat global warming. The producers of such polls do not always release information about the survey’s wording or the (mysteriously characterized) methods used to analyze them. But when they do, researchers note that the questions posed were likely to confuse, mislead, or herd the survey re-spondents toward desired answers (Kohut 2010).
2 Factor analysis confirms that the latent variable measured by such a scale is unidimensional.
> avg Left_Right< avg Left_Right
Positions on global warming in “past few decades”
0%
25%
50%
75%
100%
Human caused Naturally caused No warming
- 10-
Given the source of these surveys, one could infer that they reflect an advocacy strategy aimed at fostering “overwhelming majority support” for “action on climate change” by insisting that such support already exists. If so, the continued generation of these surveys itself displays determined inattention to over a decade’s worth of real-world evidence showing that advocacy polls of this sort have failed to dissi-pate the deep partisan conflict that various straightforward items relating to global warming measure.
Indeed, that is the key point: items that show “an overwhelming majority of Americans” believe or support one thing or another relating to climate change are necessarily not measuring the same thing as items that cohere with ISM. The question, then, is simply which items—ones that cohere with one another and ISM and that attest to polarization over climate change, or ones that do not cohere with anything in particular and that report a deep bipartisan consensus in favor of “taking action”—are more meaningfully tracking the real-world phenomena of interest. Unless one is prepared to conclude that the latent or unob-served disposition that causes coherent responses to political outlook and various global warming “belief” and risk perception items are irrelevant for making sense of the public opinion over climate change in the United States, it follows that survey questions that do not cohere with those ones are.
Serious opinion scholars know that when public-policy survey items are administered to a general population sample, it is a mistake to treat the responses as valid and reliable measures of the particular positions or arguments those items express. One can never be sure that an item is being understood as one intended. In addition, if, as is so for most concrete policy issues, the items relate to an issue that members of the general population have not heard of or formed opinions on, then the responses are not modeling anything that people in the general population are thinking in their everyday world; rather they are modeling what such people would say only in the strange, artificial environment they are transported into when a pollster asks them to express positions not meaningfully connected to their lives ((Bishop 2005; Schuman 1998).
Of course many public policy issues are ones on which people have reflected and adopted stances of meaning and consequence to them. But even in that case, responses to survey items relating to those issues are not equivalent to statements or arguments being asserted by a participant in political debate. The items were drafted by someone else and thrust in front of the survey participants; their responses consist of manifestations of pro- or con- attitudes, registered on a coarse, contrived metric. Because the response to any particular item is at best only a noisy indicator of that attitude, the principal way to con-firm that an item is genuinely measuring anything, and to draw inferences about what that is is to show that responses to it cohere with other things (responses to other items, behavior, performance on objective tests, and so forth) the meaning of which is already reasonably understood (Bishop 2005; Zaller 1992; Berinsky & Druckman 2007; Gliem & Gliem 2003).
The striking convergence of items measuring perceptions of global warming risk and like facts, on the one hand, and ones measuring political outlooks, on the other, suggests they are all indicators of a single latent variable. The established status of political outlooks as indicators of cultural identity (Ka-han, Peters, et al. 2012) supports the inference that that is exactly what that latent variable is. Indeed, the inference can be made even stronger by substituting for, or fortifying political outlooks with, even more discerning cultural identity indicators, such as cultural worldviews and their interaction with demographic characteristics such as race and gender (McCright & Dunlap 2012; Kahan et al. 2007). In sum, whether people “believe in” climate change, like whether they “believe in” evolution, expresses who they are.
As do surveys on the proportion of Americans who “disbelieve in” evolution, surveys on the pro-portion who “disbelieve in” human-caused global warming (also about 50%) predictably generate fretting in the media about the quality of U.S. science education. Here too the commentators betray their own inattention to what has been shown by the scientific study of how belief in global warming relates to sci-ence comprehension: the former is not a measure of the latter. Studies have shown that at the general population level, there is no meaningful correlation between belief in human-caused climate change and various measures of science knowledge and reasoning dispositions (Kahan, Peters et al. 2012).
- 11-
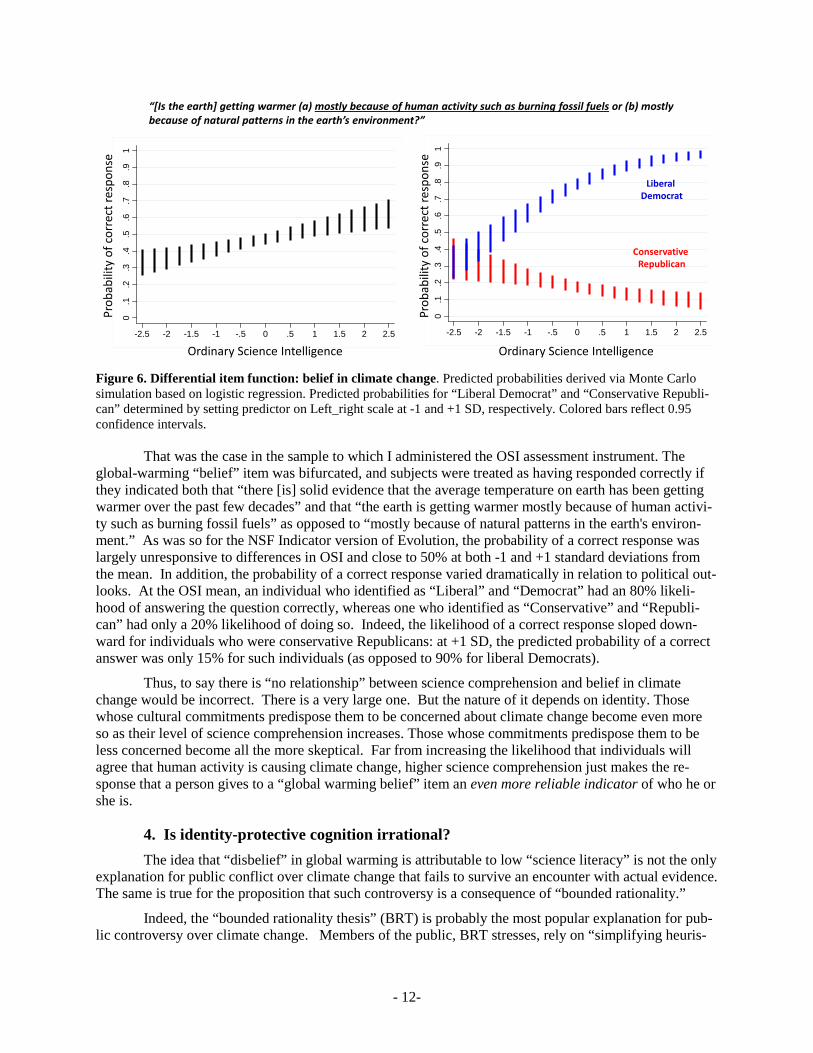
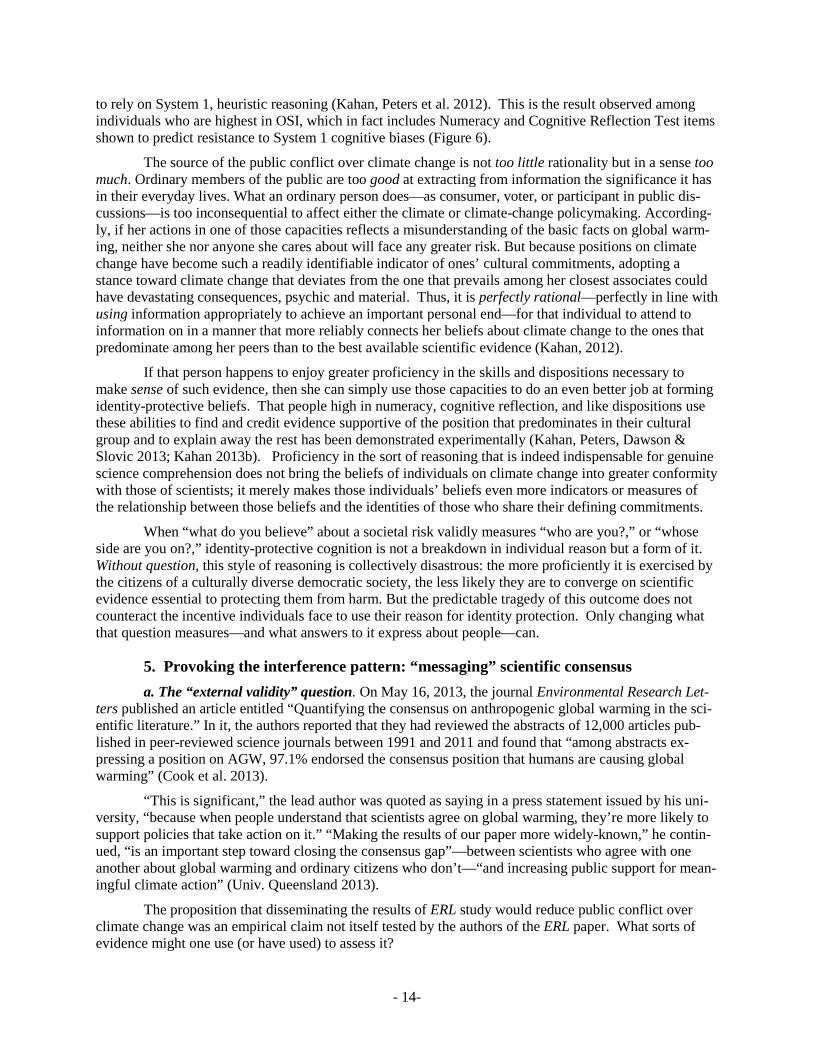
Figure 6. Differential item function: belief in climate change. Predicted probabilities derived via Monte Carlo simulation based on logistic regression. Predicted probabilities for “Liberal Democrat” and “Conservative Republi-can” determined by setting predictor on Left_right scale at -1 and +1 SD, respectively. Colored bars reflect 0.95 confidence intervals.
That was the case in the sample to which I administered the OSI assessment instrument. The global-warming “belief” item was bifurcated, and subjects were treated as having responded correctly if they indicated both that “there [is] solid evidence that the average temperature on earth has been getting warmer over the past few decades” and that “the earth is getting warmer mostly because of human activi-ty such as burning fossil fuels” as opposed to “mostly because of natural patterns in the earth's environ-ment.” As was so for the NSF Indicator version of Evolution, the probability of a correct response was largely unresponsive to differences in OSI and close to 50% at both -1 and +1 standard deviations from the mean. In addition, the probability of a correct response varied dramatically in relation to political out-looks. At the OSI mean, an individual who identified as “Liberal” and “Democrat” had an 80% likeli-hood of answering the question correctly, whereas one who identified as “Conservative” and “Republi-can” had only a 20% likelihood of doing so. Indeed, the likelihood of a correct response sloped down-ward for individuals who were conservative Republicans: at +1 SD, the predicted probability of a correct answer was only 15% for such individuals (as opposed to 90% for liberal Democrats).
Thus, to say there is “no relationship” between science comprehension and belief in climate change would be incorrect. There is a very large one. But the nature of it depends on identity. Those whose cultural commitments predispose them to be concerned about climate change become even more so as their level of science comprehension increases. Those whose commitments predispose them to be less concerned become all the more skeptical. Far from increasing the likelihood that individuals will agree that human activity is causing climate change, higher science comprehension just makes the re-sponse that a person gives to a “global warming belief” item an even more reliable indicator of who he or she is.
4. Is identity-protective cognition irrational? The idea that “disbelief” in global warming is attributable to low “science literacy” is not the only
explanation for public conflict over climate change that fails to survive an encounter with actual evidence. The same is true for the proposition that such controversy is a consequence of “bounded rationality.”
Indeed, the “bounded rationality thesis” (BRT) is probably the most popular explanation for pub-lic controversy over climate change. Members of the public, BRT stresses, rely on “simplifying heuris-
0.1
.2.3
.4.5
.6.7
.8.9
1
-2.5 -2 -1.5 -1 -.5 0 .5 1 1.5 2 2.5
0.1
.2.3
.4.5
.6.7
.8.9
1
-2.5 -2 -1.5 -1 -.5 0 .5 1 1.5 2 2.5
Ordinary Science Intelligence Ordinary Science Intelligence
Prob
abili
ty o
f cor
rect
resp
onse
Prob
abili
ty o
f cor
rect
resp
onse
“[Is the earth] getting warmer (a) mostly because of human activity such as burning fossil fuels or (b) mostly because of natural patterns in the earth’s environment?”
LiberalDemocrat
ConservativeRepublican
- 12-
tics” that reflect the emotional vividness or intensity of their reactions to putative risk sources (Marx, Weber, Orlove, Leiserowitz, Krantz, Roncoli & Phillips 2007) but that often have “little correspondence to more objective measures of risk” (Weber 2006). Those more objective measures, which “quantify either the statistical unpredictability of outcomes or the magnitude or likelihood of adverse consequences” (id.), are the ones that scientists employ. Using them demands an alternative “analytical processing” style that is acquired through scientific training and that “counteract[s] the emotionally comforting desire for confirmation of one’s beliefs” (Weber & Stern 2011).
BRT is very plausible, because it reflects a genuine and genuinely important body of work on the role that overreliance on heuristic (or “System 1”) reasoning as opposed to conscious, analytic (“System 2”) reasoning plays in all manner of cognitive bias (Frederick 2005; Kahneman 2003). But many more surmises about how the world works are plausible than are true (Watts 2011). That is why it makes sense to clearly identify accounts like BRT as “conjectures” in need of empirical testing rather than as “explanations” (Weber & Stern 2011).
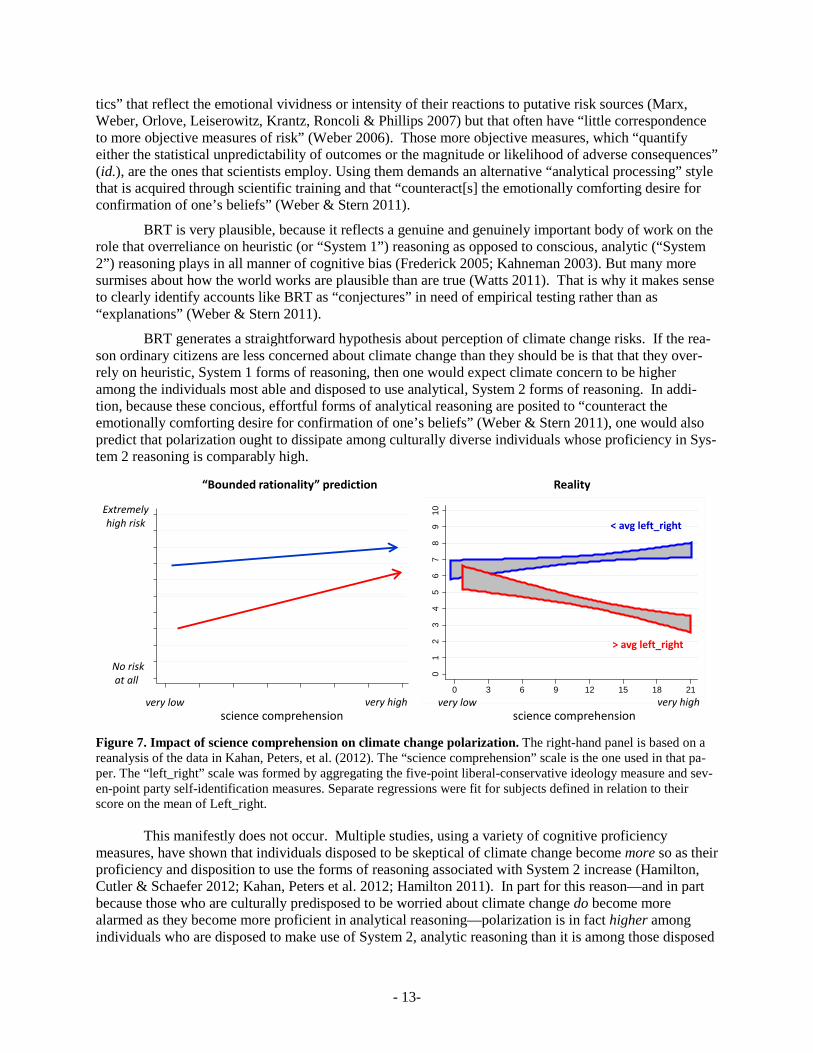
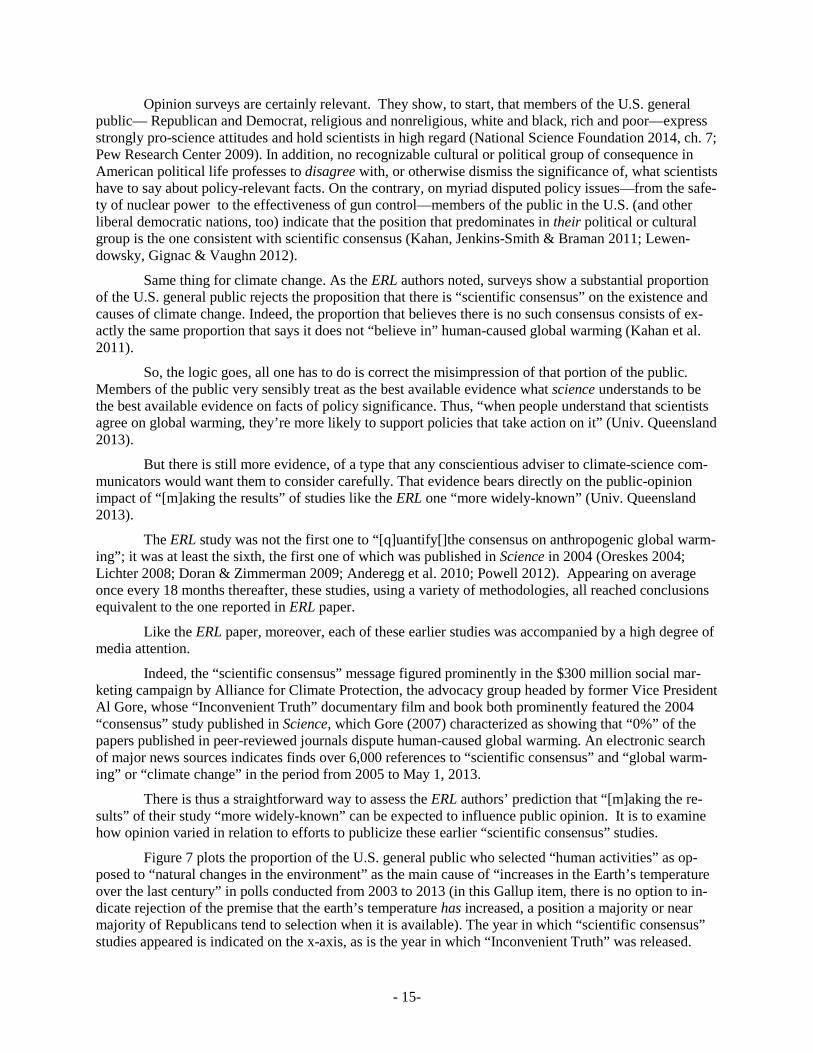
BRT generates a straightforward hypothesis about perception of climate change risks. If the rea-son ordinary citizens are less concerned about climate change than they should be is that that they over-rely on heuristic, System 1 forms of reasoning, then one would expect climate concern to be higher among the individuals most able and disposed to use analytical, System 2 forms of reasoning. In addi-tion, because these concious, effortful forms of analytical reasoning are posited to “counteract the emotionally comforting desire for confirmation of one’s beliefs” (Weber & Stern 2011), one would also predict that polarization ought to dissipate among culturally diverse individuals whose proficiency in Sys-tem 2 reasoning is comparably high.
Figure 7. Impact of science comprehension on climate change polarization. The right-hand panel is based on a reanalysis of the data in Kahan, Peters, et al. (2012). The “science comprehension” scale is the one used in that pa-per. The “left_right” scale was formed by aggregating the five-point liberal-conservative ideology measure and sev-en-point party self-identification measures. Separate regressions were fit for subjects defined in relation to their score on the mean of Left_right.
This manifestly does not occur. Multiple studies, using a variety of cognitive proficiency measures, have shown that individuals disposed to be skeptical of climate change become more so as their proficiency and disposition to use the forms of reasoning associated with System 2 increase (Hamilton, Cutler & Schaefer 2012; Kahan, Peters et al. 2012; Hamilton 2011). In part for this reason—and in part because those who are culturally predisposed to be worried about climate change do become more alarmed as they become more proficient in analytical reasoning—polarization is in fact higher among individuals who are disposed to make use of System 2, analytic reasoning than it is among those disposed
“Bounded rationality” prediction
01
23
45
67
89
10
0 3 6 9 12 15 18 21
< avg left_rightExtremelyhigh risk
No riskat all
very low very highscience comprehension
Reality
very low very highscience comprehension
> avg left_right
- 13-
to rely on System 1, heuristic reasoning (Kahan, Peters et al. 2012). This is the result observed among individuals who are highest in OSI, which in fact includes Numeracy and Cognitive Reflection Test items shown to predict resistance to System 1 cognitive biases (Figure 6).
The source of the public conflict over climate change is not too little rationality but in a sense too much. Ordinary members of the public are too good at extracting from information the significance it has in their everyday lives. What an ordinary person does—as consumer, voter, or participant in public dis-cussions—is too inconsequential to affect either the climate or climate-change policymaking. According-ly, if her actions in one of those capacities reflects a misunderstanding of the basic facts on global warm-ing, neither she nor anyone she cares about will face any greater risk. But because positions on climate change have become such a readily identifiable indicator of ones’ cultural commitments, adopting a stance toward climate change that deviates from the one that prevails among her closest associates could have devastating consequences, psychic and material. Thus, it is perfectly rational—perfectly in line with using information appropriately to achieve an important personal end—for that individual to attend to information on in a manner that more reliably connects her beliefs about climate change to the ones that predominate among her peers than to the best available scientific evidence (Kahan, 2012).
If that person happens to enjoy greater proficiency in the skills and dispositions necessary to make sense of such evidence, then she can simply use those capacities to do an even better job at forming identity-protective beliefs. That people high in numeracy, cognitive reflection, and like dispositions use these abilities to find and credit evidence supportive of the position that predominates in their cultural group and to explain away the rest has been demonstrated experimentally (Kahan, Peters, Dawson & Slovic 2013; Kahan 2013b). Proficiency in the sort of reasoning that is indeed indispensable for genuine science comprehension does not bring the beliefs of individuals on climate change into greater conformity with those of scientists; it merely makes those individuals’ beliefs even more indicators or measures of the relationship between those beliefs and the identities of those who share their defining commitments.
When “what do you believe” about a societal risk validly measures “who are you?,” or “whose side are you on?,” identity-protective cognition is not a breakdown in individual reason but a form of it. Without question, this style of reasoning is collectively disastrous: the more proficiently it is exercised by the citizens of a culturally diverse democratic society, the less likely they are to converge on scientific evidence essential to protecting them from harm. But the predictable tragedy of this outcome does not counteract the incentive individuals face to use their reason for identity protection. Only changing what that question measures—and what answers to it express about people—can.
5. Provoking the interference pattern: “messaging” scientific consensus a. The “external validity” question. On May 16, 2013, the journal Environmental Research Let-
ters published an article entitled “Quantifying the consensus on anthropogenic global warming in the sci-entific literature.” In it, the authors reported that they had reviewed the abstracts of 12,000 articles pub-lished in peer-reviewed science journals between 1991 and 2011 and found that “among abstracts ex-pressing a position on AGW, 97.1% endorsed the consensus position that humans are causing global warming” (Cook et al. 2013).
“This is significant,” the lead author was quoted as saying in a press statement issued by his uni-versity, “because when people understand that scientists agree on global warming, they’re more likely to support policies that take action on it.” “Making the results of our paper more widely-known,” he contin-ued, “is an important step toward closing the consensus gap”—between scientists who agree with one another about global warming and ordinary citizens who don’t—“and increasing public support for mean-ingful climate action” (Univ. Queensland 2013).
The proposition that disseminating the results of ERL study would reduce public conflict over climate change was an empirical claim not itself tested by the authors of the ERL paper. What sorts of evidence might one use (or have used) to assess it?
- 14-
Opinion surveys are certainly relevant. They show, to start, that members of the U.S. general public— Republican and Democrat, religious and nonreligious, white and black, rich and poor—express strongly pro-science attitudes and hold scientists in high regard (National Science Foundation 2014, ch. 7; Pew Research Center 2009). In addition, no recognizable cultural or political group of consequence in American political life professes to disagree with, or otherwise dismiss the significance of, what scientists have to say about policy-relevant facts. On the contrary, on myriad disputed policy issues—from the safe-ty of nuclear power to the effectiveness of gun control—members of the public in the U.S. (and other liberal democratic nations, too) indicate that the position that predominates in their political or cultural group is the one consistent with scientific consensus (Kahan, Jenkins-Smith & Braman 2011; Lewen-dowsky, Gignac & Vaughn 2012).
Same thing for climate change. As the ERL authors noted, surveys show a substantial proportion of the U.S. general public rejects the proposition that there is “scientific consensus” on the existence and causes of climate change. Indeed, the proportion that believes there is no such consensus consists of ex-actly the same proportion that says it does not “believe in” human-caused global warming (Kahan et al. 2011).
So, the logic goes, all one has to do is correct the misimpression of that portion of the public. Members of the public very sensibly treat as the best available evidence what science understands to be the best available evidence on facts of policy significance. Thus, “when people understand that scientists agree on global warming, they’re more likely to support policies that take action on it” (Univ. Queensland 2013).
But there is still more evidence, of a type that any conscientious adviser to climate-science com-municators would want them to consider carefully. That evidence bears directly on the public-opinion impact of “[m]aking the results” of studies like the ERL one “more widely-known” (Univ. Queensland 2013).
The ERL study was not the first one to “[q]uantify[]the consensus on anthropogenic global warm-ing”; it was at least the sixth, the first one of which was published in Science in 2004 (Oreskes 2004; Lichter 2008; Doran & Zimmerman 2009; Anderegg et al. 2010; Powell 2012). Appearing on average once every 18 months thereafter, these studies, using a variety of methodologies, all reached conclusions equivalent to the one reported in ERL paper.
Like the ERL paper, moreover, each of these earlier studies was accompanied by a high degree of media attention.
Indeed, the “scientific consensus” message figured prominently in the $300 million social mar-keting campaign by Alliance for Climate Protection, the advocacy group headed by former Vice President Al Gore, whose “Inconvenient Truth” documentary film and book both prominently featured the 2004 “consensus” study published in Science, which Gore (2007) characterized as showing that “0%” of the papers published in peer-reviewed journals dispute human-caused global warming. An electronic search of major news sources indicates finds over 6,000 references to “scientific consensus” and “global warm-ing” or “climate change” in the period from 2005 to May 1, 2013.
There is thus a straightforward way to assess the ERL authors’ prediction that “[m]aking the re-sults” of their study “more widely-known” can be expected to influence public opinion. It is to examine how opinion varied in relation to efforts to publicize these earlier “scientific consensus” studies.
Figure 7 plots the proportion of the U.S. general public who selected “human activities” as op-posed to “natural changes in the environment” as the main cause of “increases in the Earth’s temperature over the last century” in polls conducted from 2003 to 2013 (in this Gallup item, there is no option to in-dicate rejection of the premise that the earth’s temperature has increased, a position a majority or near majority of Republicans tend to selection when it is available). The year in which “scientific consensus” studies appeared is indicated on the x-axis, as is the year in which “Inconvenient Truth” was released.
- 15-
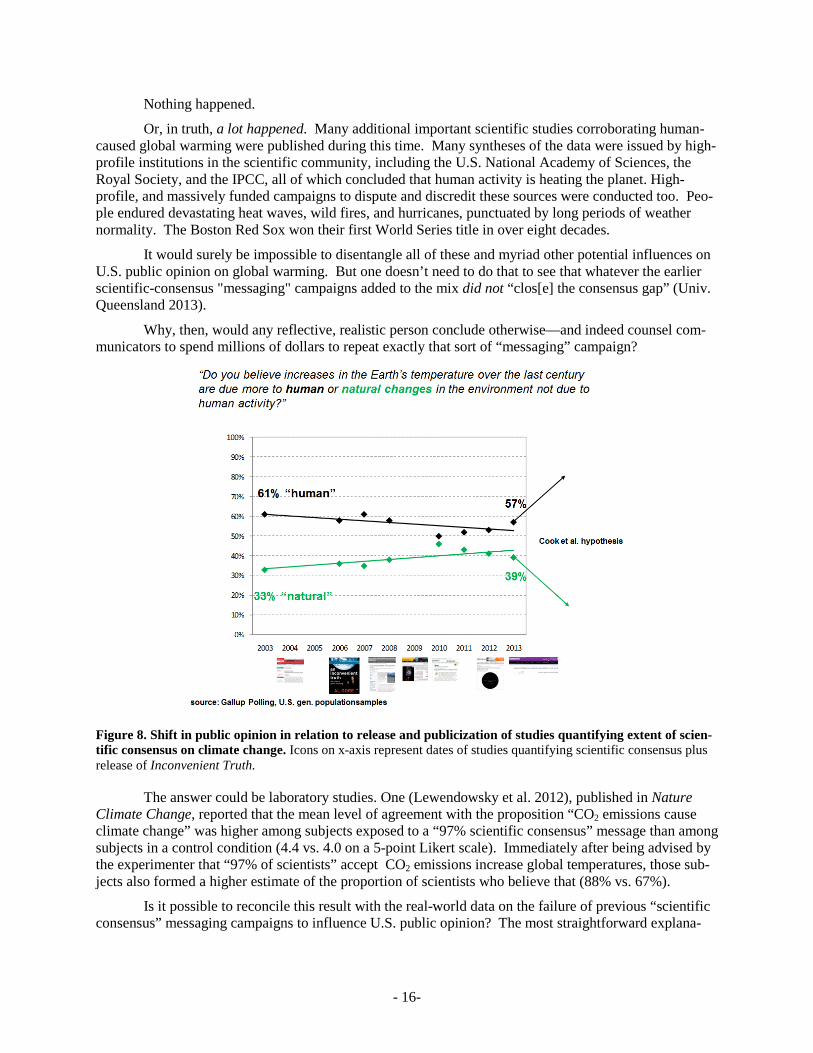
Nothing happened.
Or, in truth, a lot happened. Many additional important scientific studies corroborating human-caused global warming were published during this time. Many syntheses of the data were issued by high-profile institutions in the scientific community, including the U.S. National Academy of Sciences, the Royal Society, and the IPCC, all of which concluded that human activity is heating the planet. High-profile, and massively funded campaigns to dispute and discredit these sources were conducted too. Peo-ple endured devastating heat waves, wild fires, and hurricanes, punctuated by long periods of weather normality. The Boston Red Sox won their first World Series title in over eight decades.
It would surely be impossible to disentangle all of these and myriad other potential influences on U.S. public opinion on global warming. But one doesn’t need to do that to see that whatever the earlier scientific-consensus "messaging" campaigns added to the mix did not “clos[e] the consensus gap” (Univ. Queensland 2013).
Why, then, would any reflective, realistic person conclude otherwise—and indeed counsel com-municators to spend millions of dollars to repeat exactly that sort of “messaging” campaign?
Figure 8. Shift in public opinion in relation to release and publicization of studies quantifying extent of scien-tific consensus on climate change. Icons on x-axis represent dates of studies quantifying scientific consensus plus release of Inconvenient Truth.
The answer could be laboratory studies. One (Lewendowsky et al. 2012), published in Nature Climate Change, reported that the mean level of agreement with the proposition “CO2 emissions cause climate change” was higher among subjects exposed to a “97% scientific consensus” message than among subjects in a control condition (4.4 vs. 4.0 on a 5-point Likert scale). Immediately after being advised by the experimenter that “97% of scientists” accept CO2 emissions increase global temperatures, those sub-jects also formed a higher estimate of the proportion of scientists who believe that (88% vs. 67%).
Is it possible to reconcile this result with the real-world data on the failure of previous “scientific consensus” messaging campaigns to influence U.S. public opinion? The most straightforward explana-
- 16-
tion would be that the NCC experiment was not externally valid—i.e., it didn’t realistically model the re-al-world dynamics of opinion-formation relevant to the climate change dispute.
The problem is not the sample (90 individuals interviewed face-to-face in Perth, Australia). If re-searchers were to replicate this result using a U.S. general population sample, the inference of external invalidity would be exactly the same.
For “97% consensus” messaging experiments to justify a social marketing campaign featuring studies like the ERL one, it has to be reasonable to believe that what investigators are observing in labora-tory conditions—ones created specifically for the purpose of measuring opinion—tell us what is likely to happen when communicators emphasize the “97% consensus” message in the real world.
Such a strategy has already been tried in the real world. It didn’t work.
There are, to be sure, many more things going on in the world, including counter-messaging, than are going on in a “97% consensus” messaging experiment. But if those additional things account for the difference in the results, then that is exactly why that form experiment must be regarded as externally invalid: it is omitting real-world dynamics that we have reason to believe, based on real-world evidence, actually matter in the real world.
On this account, the question to be investigated is not whether a “97% consensus” messaging campaign will influence public opinion but why it hasn’t over a 10-year trial. The answer, presumably, is not that members of the public are divided on whether they should give weight to the conclusions scien-tists have reached in studying risks and other policy relevant facts. Those on both sides of the climate change believe that the other side’s position is the one inconsistent with scientific consensus.
The ERL authors’ own recommendation to publicize their study results presupposes public con-sensus in the U.S. in support of using the best available scientific evidence in policymaking. The advice of those who continue to champion “97% consensus” social marketing campaigns does, too.
So why have all the previous highly funded efforts to make “people understand that scientists agree on global warming” so manifestly failed to “close the consensus gap” (Univ. Queensland 2013)? There are studies that seek to answer exactly that question as well. They find that culturally biased assim-ilation—the tendency of people to fit their perceptions of disputed facts to ones that predominate in their cultural group—applies to their assessment of evidence of scientific consensus just as it does to their as-sessment of all other manner of evidence relating to climate change (Corner, Whitmarsh & Dimitrios 2012; Kahan, Jenkins-Smith & Braman 2011).
When people are shown evidence relating to what scientists believe about a culturally disputed policy-relevant fact (e.g., is the earth heating up? is it safe to store nuclear wastes deep underground? does allowing people to carry hand guns in public increase the risk of crime—or decrease it?), they selectively credit or dismiss that evidence depending on whether it is consistent with or inconsistent with their cul-tural group’s position. As a result, they form polarized perceptions of scientific consensus even when they rely on the same sources of evidence.
These studies imply misinformation is not a decisive source of public controversy over climate change. People in these studies are misinforming themselves by opportunistically adjusting the weight they give to evidence based on what they are already committed to believing. This form of identity-protective motivated reasoning (Sherman 2003; Sherman & Cohen 2006) occurs, this work suggests, not just in the climate change debate but in numerous others in which these same cultural groups trade places being out of line with the National Academy of Sciences’ assessments of what “expert consensus” is (Ka-han, Jenkins-Smith & Braman 2011).
To accept that this dynamic explains persistent public disagreement over scientific consensus on climate change, one has to be confident that these experimental studies are externally valid. Real world communicators should definitely think carefully about that. But because these experiments are testing
- 17-
alternative explanations for something we clearly observe in the real world (deep public division on cli-mate change), they don’t suffer from the obvious defects of studies that predict we should already live in world we don’t see.
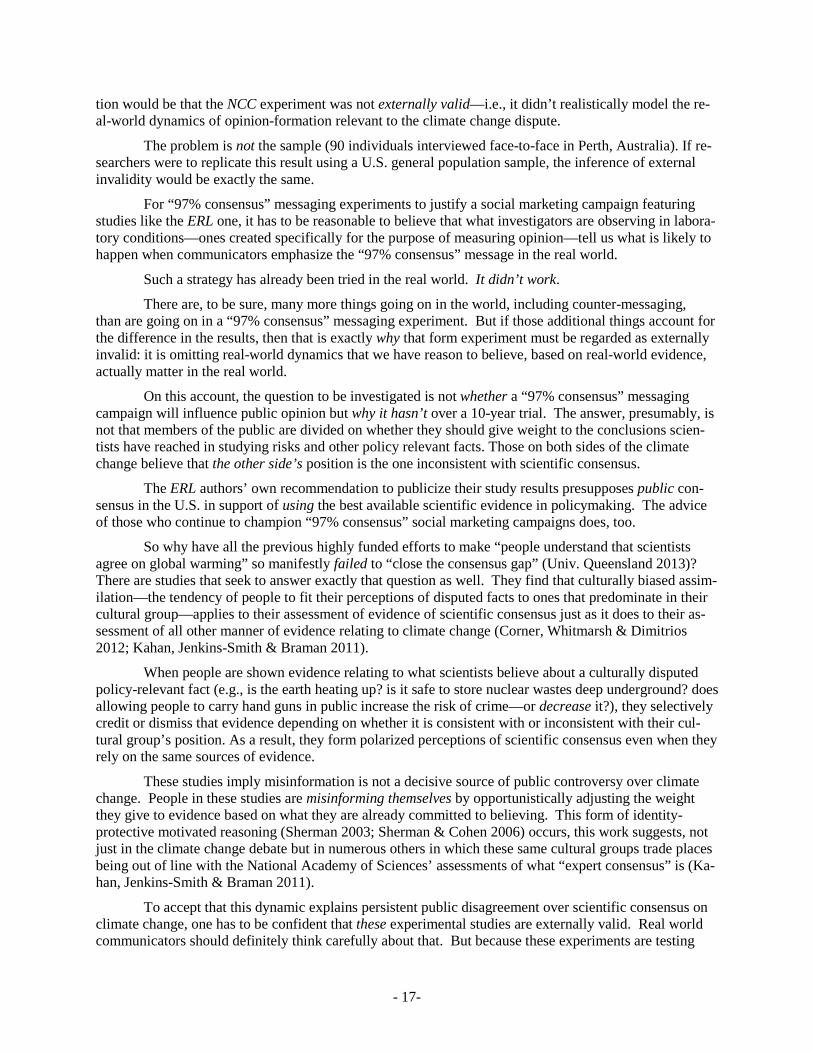
b. What is the “message” of “97%”? “External invalidity” is not an incorrect explanation of why “scientific consensus” lab experiments produce results divorced from the observable impact of real-world scientific-consensus “messaging” campaigns. But it is incomplete.
Figure 9. “97% consensus” message in OFA “X is a climate denier video.”
We can learn more by treating the lab experiments and the real-world campaigns as studies of how people react to entirely different types of messages. If we do, there is no conflict in their results. They both show individuals rationally extracting from “messages” the information that is being commu-nicated.
Consider what the “97% scientific consensus” message looks like outside the lab. There people are likely to “receive” it in the form it takes in videos produced by the advocacy group Organizing for Action. Entitled “X is a climate change denier,” the videos consist of a common template with a variable montage of images and quotes from “X,” one of two dozen Republican members of Congress (“Speaker Boehner,” “Senator Marco Rubio,” “Senator Ted Cruz”). Communicators are expected to select “X” based on the location in which they plan to disseminate the video.
The video begins with an angry, perspiring, shirt-sleeved President Obama delivering a speech: “Ninety-seven percent of scientists,” he intones, shaking his fist. After he completes his sentence, a narra-tor continues, “There’s not a lot of debate left in this debate: NASA and 97% of the nation’s scientists agree . . .,” a message reinforced by a cartoon image of a laboratory beaker and the printed message “97% OF SCIENTISTS AGREE.”
After additional cartoon footage (e.g., a snowman climbing into a refrigerator) and a bar graph (“Events with Damages Totaling $1 billion or More,” the tallest column of which is labeled “Torna-does . . .”) , the video reveals that X is a “CLIMATE CHANGE DENIER.” X is then labeled “RADICAL & DANGEROUS” because he or she disputes what “NASA” and the “NATIONAL ACADEMY OF SCIENCES” and “ 97% of SCIENTISTS” (bloc letters against a background of cartoon beakers) all “AGREE” is true.
- 18-
What’s the lesson? Unless the viewer is a genuine idiot, the one thing she already knows is what “belief” or “disbelief in” global warming means. The position someone adopts on that question conveys who he is—whose side he’s on, in a hate-filled, anxiety-stoked competition for status between opposing cultural groups (Kahan 2007).
If the viewer had not yet been informed that the message “97% of scientists agree” is one of the stock phrases used to signal one cultural group’s contempt for the other, she has now been put on notice. It is really pretty intuitive: who wouldn’t be insulted by someone screaming in her face that she and eve-ryone she identifies with “rejects science” (Gore 2007)?
The viewer can now incorporate the “97% consensus” trope into her own “arguments” if she finds it useful or enjoyable to demonstrate convincingly that she belongs to the tribe that “believes in” global warming. Or if she is part of the other one, she can now more readily discern who isn’t by their use of this tagline to heap ridicule on the people she respects.
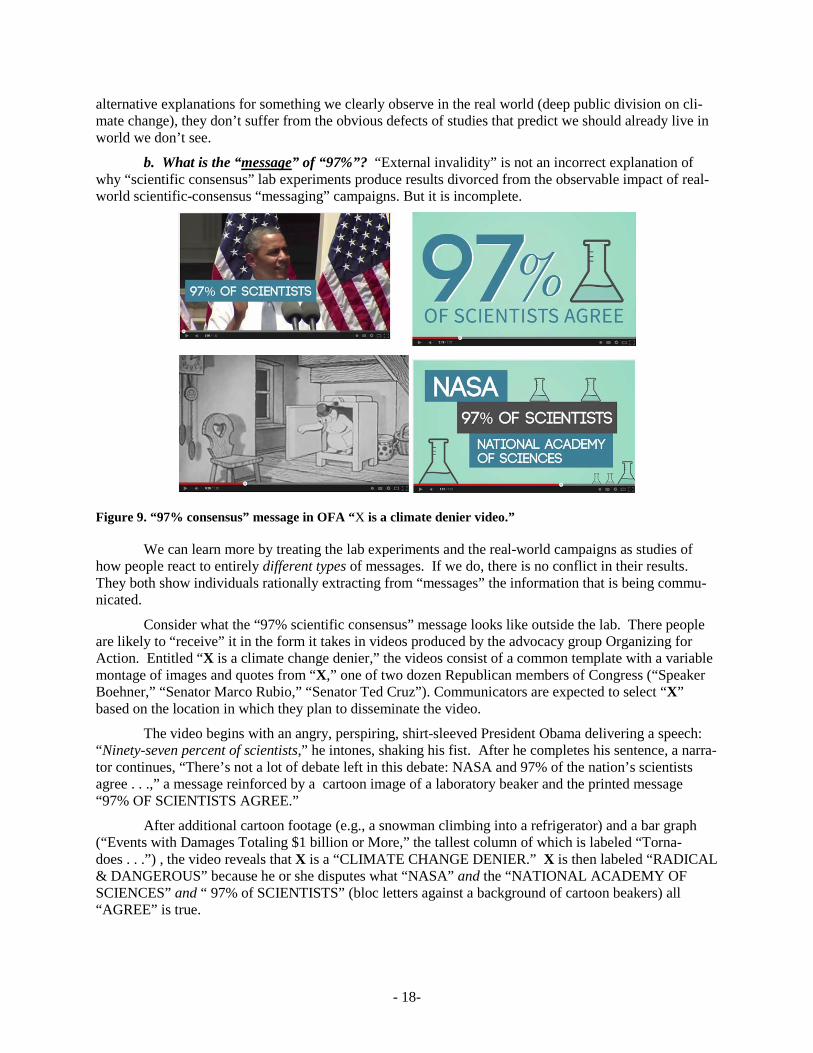
The video’s relentless use of cartoons and out-of-proportion, all-cap messages invests it with a “do you get it yet, moron?!” motif. That theme reaches its climax near the end of the video when a multi-ple choice “Pop Quiz!” is superimposed on the (cartoon) background of a piece of student-notebook pa-per. “CLIMATE CHANGE IS,” the item reads, “A) REAL,” “B) MANMADE,” “C) DANGEROUS,” or as indicated instantly by a red check mark, “D) ALL OF THE ABOVE.”
Figure 10. The “97% consensus” video climate-change literacy quiz.
The viewer of “X is a climate denier" is almost certainly an expert—not in any particular form of science but in recognizing what is known by science. As parent, health-care consumer, workplace deci-sionmaker, and usually as citizen, too, she adroitly discerns and uses to her advantage all manner of scien-tific insight, the validity and significance of which she can comprehend fully without the need to under-stand it in the way a scientist would (Keil 2003).
If one administers a “what do scientists believe?” test after exposing her to the signs and cues that ordinary members of the public use to recognize what science knows, she will get an “A.” Similarly, if one performs an experiment that models that sort of reasoning, the hypothesis that this recognition faculty is pervasive, and that it reliably steers culturally diverse groups into convergence on the best available evidence, will be confirmed.
But the viewer’s response to the “97% consensus” video is measuring something else. The video, by cementing the cultural meaning of belief in climate change to a partisan identity, has in fact forced her to be become another version of herself. After watching it, she will now deploy her formidable reason and associated powers of recognition to correctly identify the stance to adopt toward the “97% consensus” message that accurately expresses who she is in a world in which the answer to “whose side you are on?” has a much bigger impact on her life than her answer to the question “what do you know?”
- 19-
6. Measuring what people know about climate science What do members of the public know about scientific evidence on climate science? Asking
whether they “believe in” human-caused climate change does not measure that. But that does not mean what they know cannot be measured.
a. A disentanglement experiment: the “Ordinary Climate Science Comprehension” instrument. Just as general science comprehension can be measured with a valid instrument, so can comprehension of the science on climate change in particular. Doing so requires items the responses to which validly and reliably indicate test-takers’ climate science comprehension level.
The idea of “climate science comprehension” is hardly straightforward. If one means by it the un-derstanding of and facility with relevant bodies of knowledge essential to doing climate science research, then any valid instrument is certain to show that the level of climate science comprehension is effectively zero in all but a very tiny fraction of the population.
But there are many settings in which the quality of non-experts’ comprehension of much more basic elements of climate science will be of practical concern. A high school science teacher, for example, might aim to impart an admittedly non-expert level of comprehension in students for the sake of equip-ping and motivating them to build on it in advanced studies. Likewise, without being experts themselves, ordinary members of the public can be expected to benefit from a level of comprehension that enables them reliably to recognize and give proper effect to valid climate science that bears on their decisionmak-ing, whether as homeowners, businesspeople, or democratic citizens.
Assume, then, that our goal is to form an “ordinary climate science intelligence” (OCSI) instru-ment. Its aim would certainly not be to certify possession of the knowledge and reasoning dispositions that a climate scientist’s professional judgment comprises. It will come closer to the sort of instrument a high school teacher might use, but even here no doubt fall short of delivering a sufficiently complete and discerning measure of the elements of comprehension he or she is properly concerned to instill in stu-dents. What the OCSI should adequately measure—at least this would be the aspiration of it—is a form of competence in grasping and making use of climate science that an ordinary person would benefit from in the course of participating in ordinary decisionmaking, individual and collective.
There are two challenges in constructing such an instrument. The first and most obvious is the relationship between climate change risk perceptions and individuals’ cultural identities. To be valid, the items that the assessment comprises must be constructed to measure what people know about climate sci-ence and not who they are.
A second, related problem is the potential for confounding climate science comprehension with an affective orientation toward global warming risk. Perceptions of societal risk generally are indicators of a general affective orientation. The feelings that a putative risk source evokes are more likely to shape than be shaped by individuals’ assessments of all manner of factual information pertaining to it (Loewen-stein et al. 2001; Slovic et al. 2004). There is an ambiguity, then, as to whether items that elicit affirma-tion or rejection of factual propositions relating to climate change are measuring genuine comprehension or instead only the correspondence between the propositions in question and the valence of respondents’ affective orientations toward global warming. Existing studies have found, for example, that individuals disposed to affirm accurate propositions relating to climate change—that burning fossil fuels contributes to global warming, for example—are highly likely to affirm many inaccurate ones—e.g., that atmospheric emissions of sulfur do as well—if those statements evince concern over environmental risks generally (Tobler, Visschers & Siegrist 2012; Reynolds et al. 2010).
Two steps were taken to address these challenges in constructing an OCSI instrument, which was then administered to the same survey participants whose general science comprehension was measured
- 20-
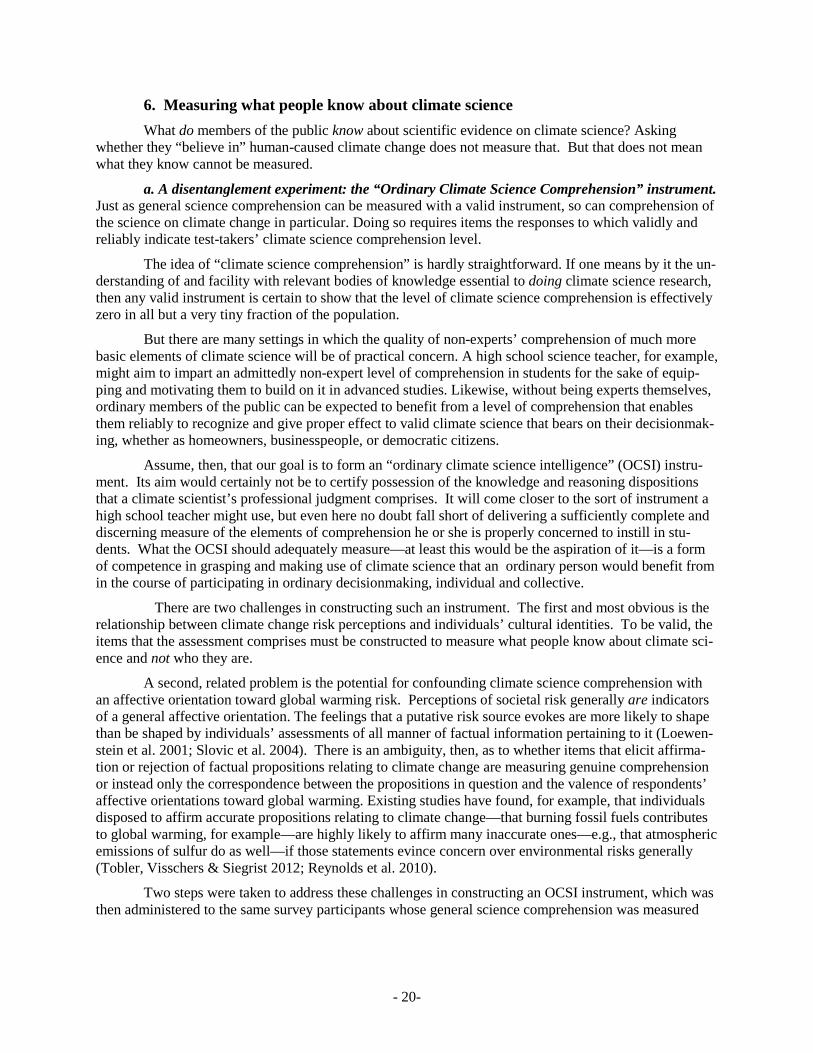
with the OSI scale. 3 The first was to rely on an array of items the correct responses to which were rea-sonably balanced between opposing affective orientations toward the risk of global warming. The multi-ple-choice item “[w]hat gas do most scientists believe causes temperatures in the atmosphere to rise” (“Carbon”) and the true-false one “human-caused global warming will result in flooding of many coastal regions” (“Floods”) evince concern over global warming and thus could be expected to be answered cor-rectly by respondents affectively predisposed to perceive climate change risks as high. The same affective orientation, however, could be expected to incline respondents to give the incorrect answer to items such as “human-caused global warming will increase the risk of skin cancer in human beings” (“Cancer”) and “the increase of atmospheric carbon dioxide associated with the burning of fossil fuels will reduce with photosynthesis by plants” (“Photosynthesis”). By the same token, those respondents affectively disposed to be skeptical of climate change risks could be expected to supply the correct answer to Cancer and Pho-tosynthesis but the wrong ones , Carbon and Floods. The only respondents one would expect to be likely to answer all four correctly are ones who know and are disposed to give the correct response independent of their affective orientations.
The aim of disentangling (unconfounding) affective orientation and knowledge was compliment-ed by a more general assessment-construction tenet, which counsels use of items that feature incorrect responses that are likely to seem correct to those who do not genuinely possess the knowledge or aptitude being assessed (Osterlind 1998). Because the recent hurricanes Sandy and Irene both provoked considera-ble media discussion of the impact of climate change, the true-false item “[h]uman-caused global warm-ing has increased the number and severity of hurricanes around the world in recent decades” was expected to elicit an incorrect response from many climate-concerned respondents of low or modest comprehension (who presumably would be unaware of the information the IPCC 5th Assessment (2013, I: TS p. 73) re-lied upon in expressing “low confidence” in “attributions of changes in tropical cyclone activity to human influence” to date, based on “low level of agreement between studies”). Similarly, the attention furnished in the media to the genuine decrease in the rate at which global temperatures increased in the last 15 years was expected to tempt respondents, particularly ones affectively disposed toward climate-change skepti-cism, to give the incorrect response to the true-false item “globally averaged surface air temperatures were higher for the first decade of the twenty-first century (2000-2009) than for the last decade of the twentieth century (1990-1999).”
The second step taken to address the distinctive challenge of constructing a valid OCSI assess-ment was to introduce the majority of items with the clause “Climate scientists believe that . . . .” The goal was to reproduce the effect of the clause “According to the theory of evolution . . .” in eliminating the response differential among religious and nonreligious individuals to the NSF Indicators’ Evolution item. It is plausible to attribute this result to the clause’s removal of the conflict relatively religious re-spondents experience between offering a response that expresses their identity and one that signifies their familiarity with a prevailing or consensus position in science. It was anticipated that using the “Climate scientists believe” clause (and similar formulations in other items) would enable respondents whose iden-tity is expressed by disbelief in human-caused global warming to answer OCSI items based instead on their understanding of the state of the best currently available scientific evidence.
To be sure, this device created the possibility that respondents who disagree with climate scien-tists’ assessment of the best available evidence could nevertheless affirm propositions that presuppose human-caused climate change. One reason not to expect such a result is that public opinion studies con-sistently find that members of the public on both sides of the climate debate don’t think their side’s posi-tion is contrary to scientific consensus (Kahan et al. 2011).
It might well be the case, however, that what such studies are measuring is not ordinary citizens knowledge of the state of scientific opinion but their commitment to expressing who they are when ad-
3 The OCSI instrument appears in the Appendix.
- 21-
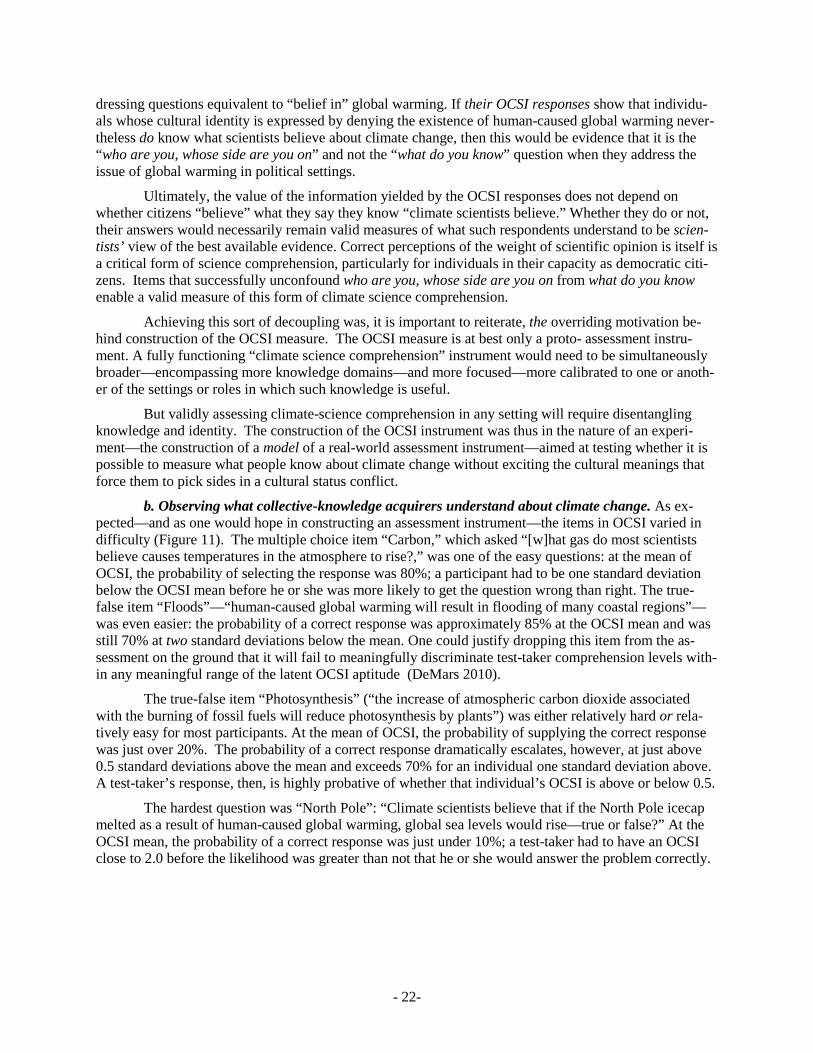
dressing questions equivalent to “belief in” global warming. If their OCSI responses show that individu-als whose cultural identity is expressed by denying the existence of human-caused global warming never-theless do know what scientists believe about climate change, then this would be evidence that it is the “who are you, whose side are you on” and not the “what do you know” question when they address the issue of global warming in political settings.
Ultimately, the value of the information yielded by the OCSI responses does not depend on whether citizens “believe” what they say they know “climate scientists believe.” Whether they do or not, their answers would necessarily remain valid measures of what such respondents understand to be scien-tists’ view of the best available evidence. Correct perceptions of the weight of scientific opinion is itself is a critical form of science comprehension, particularly for individuals in their capacity as democratic citi-zens. Items that successfully unconfound who are you, whose side are you on from what do you know enable a valid measure of this form of climate science comprehension.
Achieving this sort of decoupling was, it is important to reiterate, the overriding motivation be-hind construction of the OCSI measure. The OCSI measure is at best only a proto- assessment instru-ment. A fully functioning “climate science comprehension” instrument would need to be simultaneously broader—encompassing more knowledge domains—and more focused—more calibrated to one or anoth-er of the settings or roles in which such knowledge is useful.
But validly assessing climate-science comprehension in any setting will require disentangling knowledge and identity. The construction of the OCSI instrument was thus in the nature of an experi-ment—the construction of a model of a real-world assessment instrument—aimed at testing whether it is possible to measure what people know about climate change without exciting the cultural meanings that force them to pick sides in a cultural status conflict.
b. Observing what collective-knowledge acquirers understand about climate change. As ex-pected—and as one would hope in constructing an assessment instrument—the items in OCSI varied in difficulty (Figure 11). The multiple choice item “Carbon,” which asked “[w]hat gas do most scientists believe causes temperatures in the atmosphere to rise?,” was one of the easy questions: at the mean of OCSI, the probability of selecting the response was 80%; a participant had to be one standard deviation below the OCSI mean before he or she was more likely to get the question wrong than right. The true-false item “Floods”—“human-caused global warming will result in flooding of many coastal regions”—was even easier: the probability of a correct response was approximately 85% at the OCSI mean and was still 70% at two standard deviations below the mean. One could justify dropping this item from the as-sessment on the ground that it will fail to meaningfully discriminate test-taker comprehension levels with-in any meaningful range of the latent OCSI aptitude (DeMars 2010).
The true-false item “Photosynthesis” (“the increase of atmospheric carbon dioxide associated with the burning of fossil fuels will reduce photosynthesis by plants”) was either relatively hard or rela-tively easy for most participants. At the mean of OCSI, the probability of supplying the correct response was just over 20%. The probability of a correct response dramatically escalates, however, at just above 0.5 standard deviations above the mean and exceeds 70% for an individual one standard deviation above. A test-taker’s response, then, is highly probative of whether that individual’s OCSI is above or below 0.5.
The hardest question was “North Pole”: “Climate scientists believe that if the North Pole icecap melted as a result of human-caused global warming, global sea levels would rise—true or false?” At the OCSI mean, the probability of a correct response was just under 10%; a test-taker had to have an OCSI close to 2.0 before the likelihood was greater than not that he or she would answer the problem correctly.
- 22-
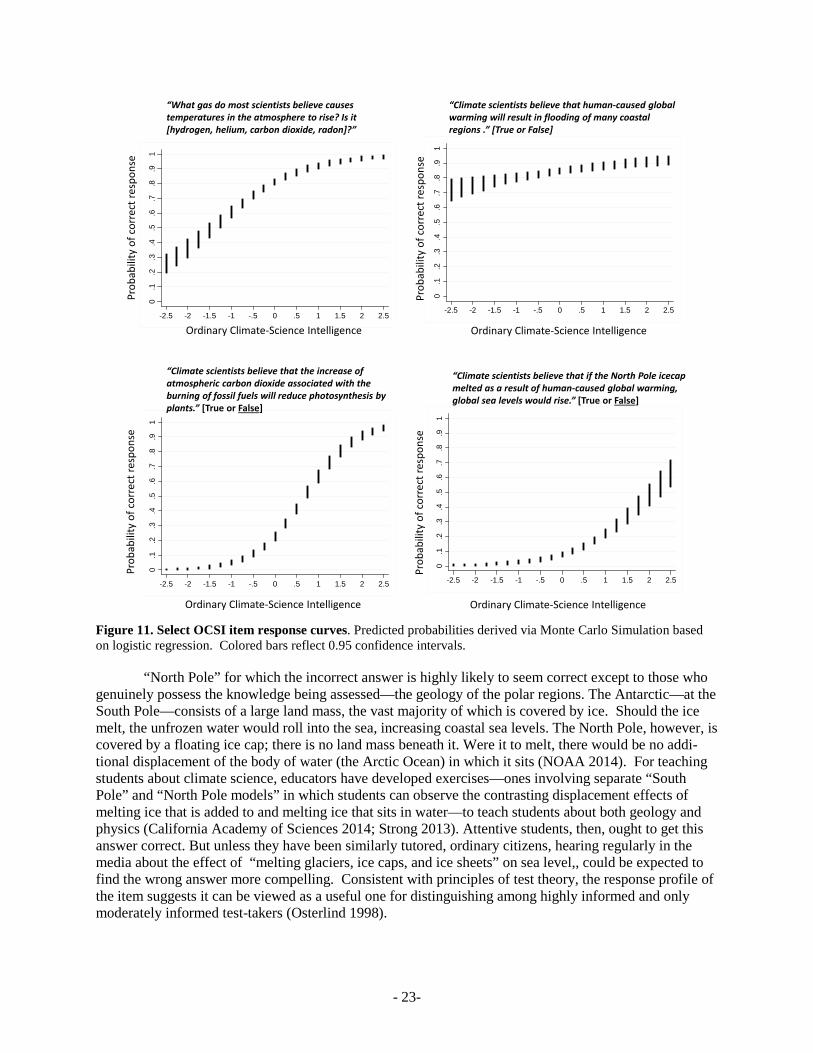
Figure 11. Select OCSI item response curves. Predicted probabilities derived via Monte Carlo Simulation based on logistic regression. Colored bars reflect 0.95 confidence intervals.
“North Pole” for which the incorrect answer is highly likely to seem correct except to those who genuinely possess the knowledge being assessed—the geology of the polar regions. The Antarctic—at the South Pole—consists of a large land mass, the vast majority of which is covered by ice. Should the ice melt, the unfrozen water would roll into the sea, increasing coastal sea levels. The North Pole, however, is covered by a floating ice cap; there is no land mass beneath it. Were it to melt, there would be no addi-tional displacement of the body of water (the Arctic Ocean) in which it sits (NOAA 2014). For teaching students about climate science, educators have developed exercises—ones involving separate “South Pole” and “North Pole models” in which students can observe the contrasting displacement effects of melting ice that is added to and melting ice that sits in water—to teach students about both geology and physics (California Academy of Sciences 2014; Strong 2013). Attentive students, then, ought to get this answer correct. But unless they have been similarly tutored, ordinary citizens, hearing regularly in the media about the effect of “melting glaciers, ice caps, and ice sheets” on sea level,, could be expected to find the wrong answer more compelling. Consistent with principles of test theory, the response profile of the item suggests it can be viewed as a useful one for distinguishing among highly informed and only moderately informed test-takers (Osterlind 1998).
0.1
.2.3
.4.5
.6.7
.8.9
1
-2.5 -2 -1.5 -1 -.5 0 .5 1 1.5 2 2.5
0.1
.2.3
.4.5
.6.7
.8.9
1
-2.5 -2 -1.5 -1 -.5 0 .5 1 1.5 2 2.5
0.1
.2.3
.4.5
.6.7
.8.9
1
-2.5 -2 -1.5 -1 -.5 0 .5 1 1.5 2 2.5
0.1
.2.3
.4.5
.6.7
.8.9
1
-2.5 -2 -1.5 -1 -.5 0 .5 1 1.5 2 2.5
“Climate scientists believe that the increase of atmospheric carbon dioxide associated with the burning of fossil fuels will reduce photosynthesis by plants.” [True or False]
“What gas do most scientists believe causes temperatures in the atmosphere to rise? Is it [hydrogen, helium, carbon dioxide, radon]?”
“Climate scientists believe that if the North Pole icecap melted as a result of human-caused global warming, global sea levels would rise.” [True or False]
Ordinary Climate-Science Intelligence
Prob
abili
ty o
f cor
rect
resp
onse
Ordinary Climate-Science Intelligence
Prob
abili
ty o
f cor
rect
resp
onse
Ordinary Climate-Science Intelligence
Prob
abili
ty o
f cor
rect
resp
onse
Ordinary Climate-Science Intelligence
Prob
abili
ty o
f cor
rect
resp
onse
“Climate scientists believe that human-caused global warming will result in flooding of many coastal regions .” [True or False]
- 23-
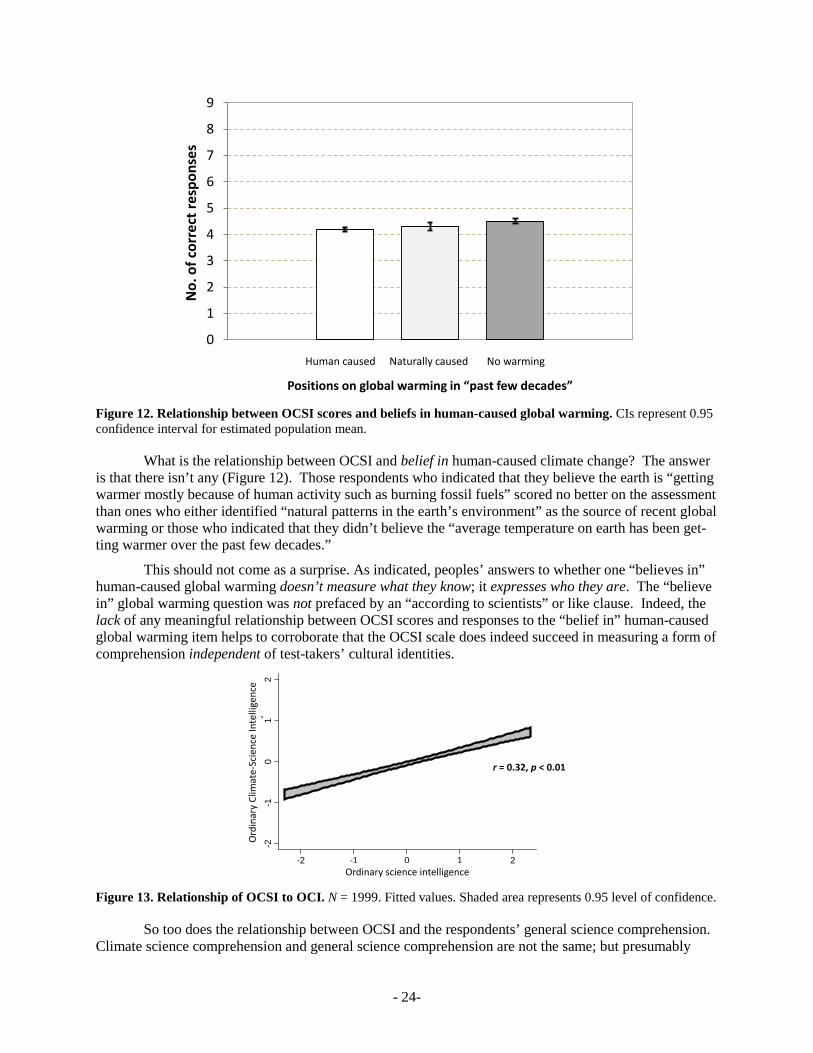
Figure 12. Relationship between OCSI scores and beliefs in human-caused global warming. CIs represent 0.95 confidence interval for estimated population mean.
What is the relationship between OCSI and belief in human-caused climate change? The answer is that there isn’t any (Figure 12). Those respondents who indicated that they believe the earth is “getting warmer mostly because of human activity such as burning fossil fuels” scored no better on the assessment than ones who either identified “natural patterns in the earth’s environment” as the source of recent global warming or those who indicated that they didn’t believe the “average temperature on earth has been get-ting warmer over the past few decades.”
This should not come as a surprise. As indicated, peoples’ answers to whether one “believes in” human-caused global warming doesn’t measure what they know; it expresses who they are. The “believe in” global warming question was not prefaced by an “according to scientists” or like clause. Indeed, the lack of any meaningful relationship between OCSI scores and responses to the “belief in” human-caused global warming item helps to corroborate that the OCSI scale does indeed succeed in measuring a form of comprehension independent of test-takers’ cultural identities.
Figure 13. Relationship of OCSI to OCI. N = 1999. Fitted values. Shaded area represents 0.95 level of confidence.
So too does the relationship between OCSI and the respondents’ general science comprehension. Climate science comprehension and general science comprehension are not the same; but presumably
0
1
2
3
4
5
6
7
8
9
No.
of c
orre
ct re
spon
ses
Human caused Naturally caused No warming
Positions on global warming in “past few decades”
-2-1
01
2C
limat
e sc
ienc
e lit
erac
y
-2 -1 0 1 2i h i
r = 0.32, p < 0.01
Ord
inar
y Cl
imat
e-Sc
ienc
e In
telli
genc
e
Ordinary science intelligence
- 24-
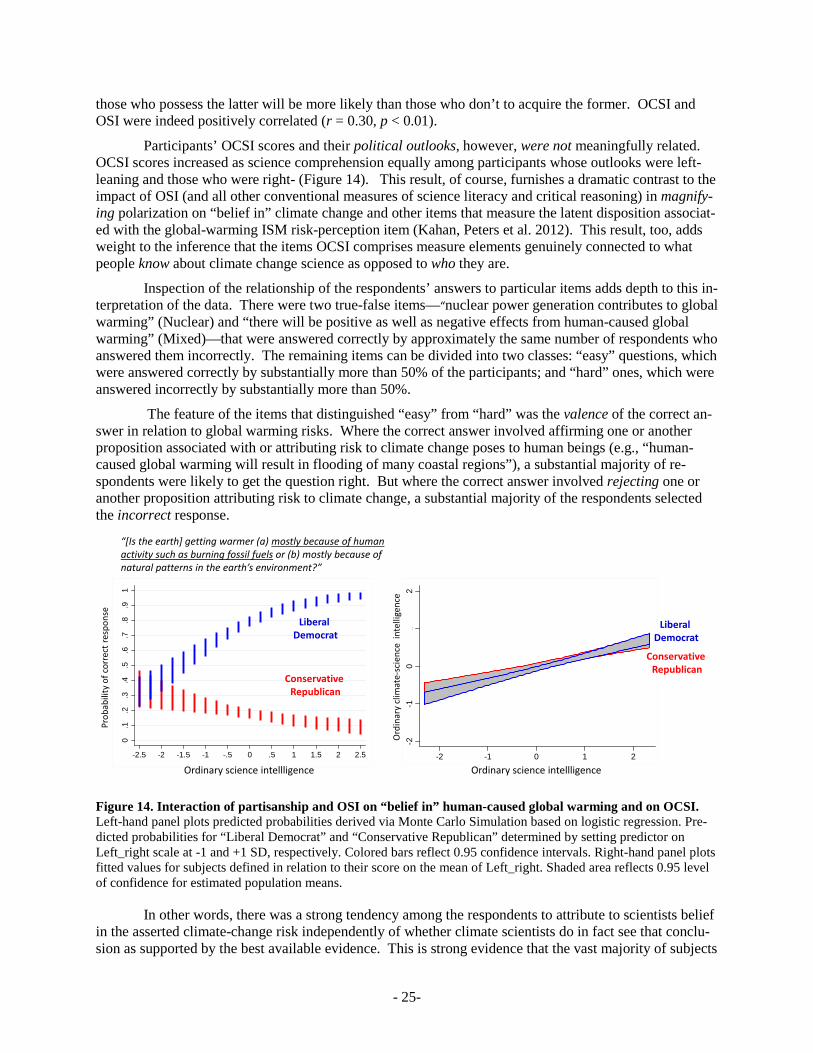
those who possess the latter will be more likely than those who don’t to acquire the former. OCSI and OSI were indeed positively correlated (r = 0.30, p < 0.01).
Participants’ OCSI scores and their political outlooks, however, were not meaningfully related. OCSI scores increased as science comprehension equally among participants whose outlooks were left-leaning and those who were right- (Figure 14). This result, of course, furnishes a dramatic contrast to the impact of OSI (and all other conventional measures of science literacy and critical reasoning) in magnify-ing polarization on “belief in” climate change and other items that measure the latent disposition associat-ed with the global-warming ISM risk-perception item (Kahan, Peters et al. 2012). This result, too, adds weight to the inference that the items OCSI comprises measure elements genuinely connected to what people know about climate change science as opposed to who they are.
Inspection of the relationship of the respondents’ answers to particular items adds depth to this in-terpretation of the data. There were two true-false items—“nuclear power generation contributes to global warming” (Nuclear) and “there will be positive as well as negative effects from human-caused global warming” (Mixed)—that were answered correctly by approximately the same number of respondents who answered them incorrectly. The remaining items can be divided into two classes: “easy” questions, which were answered correctly by substantially more than 50% of the participants; and “hard” ones, which were answered incorrectly by substantially more than 50%.
The feature of the items that distinguished “easy” from “hard” was the valence of the correct an-swer in relation to global warming risks. Where the correct answer involved affirming one or another proposition associated with or attributing risk to climate change poses to human beings (e.g., “human-caused global warming will result in flooding of many coastal regions”), a substantial majority of re-spondents were likely to get the question right. But where the correct answer involved rejecting one or another proposition attributing risk to climate change, a substantial majority of the respondents selected the incorrect response.
Figure 14. Interaction of partisanship and OSI on “belief in” human-caused global warming and on OCSI. Left-hand panel plots predicted probabilities derived via Monte Carlo Simulation based on logistic regression. Pre-dicted probabilities for “Liberal Democrat” and “Conservative Republican” determined by setting predictor on Left_right scale at -1 and +1 SD, respectively. Colored bars reflect 0.95 confidence intervals. Right-hand panel plots fitted values for subjects defined in relation to their score on the mean of Left_right. Shaded area reflects 0.95 level of confidence for estimated population means.
In other words, there was a strong tendency among the respondents to attribute to scientists belief in the asserted climate-change risk independently of whether climate scientists do in fact see that conclu-sion as supported by the best available evidence. This is strong evidence that the vast majority of subjects
-2-1
01
2C
limat
e sc
ienc
e lit
erac
y
-2 -1 0 1 2science comprehension
0.1
.2.3
.4.5
.6.7
.8.9
1
-2.5 -2 -1.5 -1 -.5 0 .5 1 1.5 2 2.5
Ordinary science intellligence
Prob
abili
ty o
f cor
rect
resp
onse
“[Is the earth] getting warmer (a) mostly because of human activity such as burning fossil fuels or (b) mostly because of natural patterns in the earth’s environment?”
LiberalDemocrat
ConservativeRepublican
LiberalDemocrat
ConservativeRepublican
Ord
inar
y cl
imat
e-sc
ienc
e in
telli
genc
e
Ordinary science intellligence
- 25-
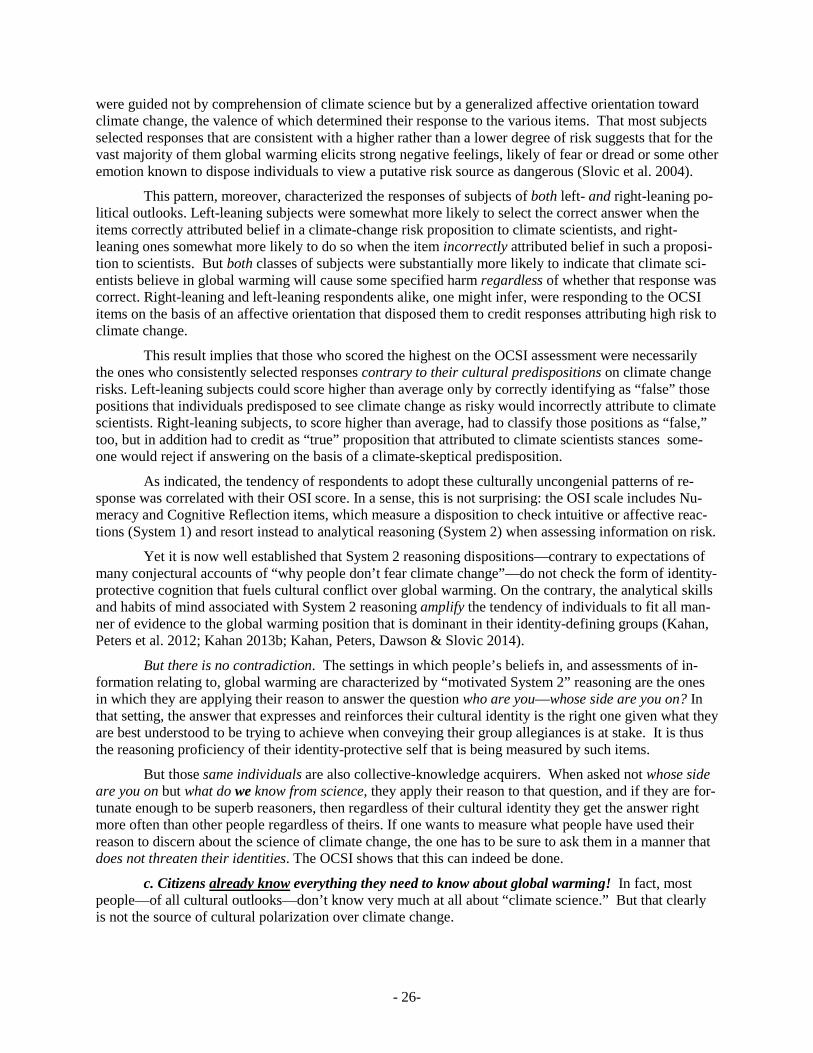
were guided not by comprehension of climate science but by a generalized affective orientation toward climate change, the valence of which determined their response to the various items. That most subjects selected responses that are consistent with a higher rather than a lower degree of risk suggests that for the vast majority of them global warming elicits strong negative feelings, likely of fear or dread or some other emotion known to dispose individuals to view a putative risk source as dangerous (Slovic et al. 2004).
This pattern, moreover, characterized the responses of subjects of both left- and right-leaning po-litical outlooks. Left-leaning subjects were somewhat more likely to select the correct answer when the items correctly attributed belief in a climate-change risk proposition to climate scientists, and right-leaning ones somewhat more likely to do so when the item incorrectly attributed belief in such a proposi-tion to scientists. But both classes of subjects were substantially more likely to indicate that climate sci-entists believe in global warming will cause some specified harm regardless of whether that response was correct. Right-leaning and left-leaning respondents alike, one might infer, were responding to the OCSI items on the basis of an affective orientation that disposed them to credit responses attributing high risk to climate change.
This result implies that those who scored the highest on the OCSI assessment were necessarily the ones who consistently selected responses contrary to their cultural predispositions on climate change risks. Left-leaning subjects could score higher than average only by correctly identifying as “false” those positions that individuals predisposed to see climate change as risky would incorrectly attribute to climate scientists. Right-leaning subjects, to score higher than average, had to classify those positions as “false,” too, but in addition had to credit as “true” proposition that attributed to climate scientists stances some-one would reject if answering on the basis of a climate-skeptical predisposition.
As indicated, the tendency of respondents to adopt these culturally uncongenial patterns of re-sponse was correlated with their OSI score. In a sense, this is not surprising: the OSI scale includes Nu-meracy and Cognitive Reflection items, which measure a disposition to check intuitive or affective reac-tions (System 1) and resort instead to analytical reasoning (System 2) when assessing information on risk.
Yet it is now well established that System 2 reasoning dispositions—contrary to expectations of many conjectural accounts of “why people don’t fear climate change”—do not check the form of identity-protective cognition that fuels cultural conflict over global warming. On the contrary, the analytical skills and habits of mind associated with System 2 reasoning amplify the tendency of individuals to fit all man-ner of evidence to the global warming position that is dominant in their identity-defining groups (Kahan, Peters et al. 2012; Kahan 2013b; Kahan, Peters, Dawson & Slovic 2014).
But there is no contradiction. The settings in which people’s beliefs in, and assessments of in-formation relating to, global warming are characterized by “motivated System 2” reasoning are the ones in which they are applying their reason to answer the question who are you—whose side are you on? In that setting, the answer that expresses and reinforces their cultural identity is the right one given what they are best understood to be trying to achieve when conveying their group allegiances is at stake. It is thus the reasoning proficiency of their identity-protective self that is being measured by such items.
But those same individuals are also collective-knowledge acquirers. When asked not whose side are you on but what do we know from science, they apply their reason to that question, and if they are for-tunate enough to be superb reasoners, then regardless of their cultural identity they get the answer right more often than other people regardless of theirs. If one wants to measure what people have used their reason to discern about the science of climate change, the one has to be sure to ask them in a manner that does not threaten their identities. The OCSI shows that this can indeed be done.
c. Citizens already know everything they need to know about global warming! In fact, most people—of all cultural outlooks—don’t know very much at all about “climate science.” But that clearly is not the source of cultural polarization over climate change.
- 26-
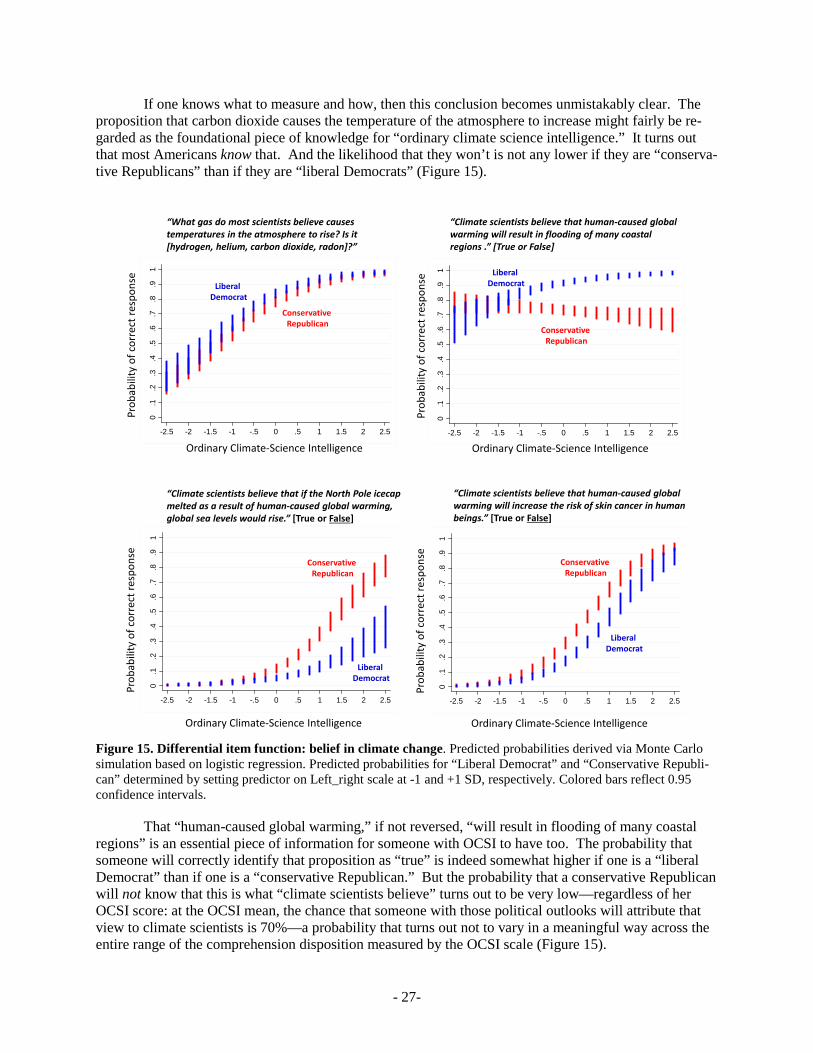
If one knows what to measure and how, then this conclusion becomes unmistakably clear. The proposition that carbon dioxide causes the temperature of the atmosphere to increase might fairly be re-garded as the foundational piece of knowledge for “ordinary climate science intelligence.” It turns out that most Americans know that. And the likelihood that they won’t is not any lower if they are “conserva-tive Republicans” than if they are “liberal Democrats” (Figure 15).
Figure 15. Differential item function: belief in climate change. Predicted probabilities derived via Monte Carlo simulation based on logistic regression. Predicted probabilities for “Liberal Democrat” and “Conservative Republi-can” determined by setting predictor on Left_right scale at -1 and +1 SD, respectively. Colored bars reflect 0.95 confidence intervals.
That “human-caused global warming,” if not reversed, “will result in flooding of many coastal regions” is an essential piece of information for someone with OCSI to have too. The probability that someone will correctly identify that proposition as “true” is indeed somewhat higher if one is a “liberal Democrat” than if one is a “conservative Republican.” But the probability that a conservative Republican will not know that this is what “climate scientists believe” turns out to be very low—regardless of her OCSI score: at the OCSI mean, the chance that someone with those political outlooks will attribute that view to climate scientists is 70%—a probability that turns out not to vary in a meaningful way across the entire range of the comprehension disposition measured by the OCSI scale (Figure 15).
0.1
.2.3
.4.5
.6.7
.8.9
1
-2.5 -2 -1.5 -1 -.5 0 .5 1 1.5 2 2.5
0.1
.2.3
.4.5
.6.7
.8.9
1
-2.5 -2 -1.5 -1 -.5 0 .5 1 1.5 2 2.5
0.1
.2.3
.4.5
.6.7
.8.9
1
-2.5 -2 -1.5 -1 -.5 0 .5 1 1.5 2 2.50
.1.2
.3.4
.5.6
.7.8
.91
-2.5 -2 -1.5 -1 -.5 0 .5 1 1.5 2 2.5
“What gas do most scientists believe causes temperatures in the atmosphere to rise? Is it [hydrogen, helium, carbon dioxide, radon]?”
“Climate scientists believe that if the North Pole icecap melted as a result of human-caused global warming, global sea levels would rise.” [True or False]
Ordinary Climate-Science Intelligence
Prob
abili
ty o
f cor
rect
resp
onse
Ordinary Climate-Science Intelligence
Prob
abili
ty o
f cor
rect
resp
onse
Ordinary Climate-Science Intelligence
Prob
abili
ty o
f cor
rect
resp
onse
Ordinary Climate-Science Intelligence
Prob
abili
ty o
f cor
rect
resp
onse
“Climate scientists believe that human-caused global warming will result in flooding of many coastal regions .” [True or False]
“Climate scientists believe that human-caused global warming will increase the risk of skin cancer in human beings.” [True or False]
LiberalDemocrat
ConservativeRepublican
LiberalDemocrat
ConservativeRepublican
LiberalDemocrat
ConservativeRepublican
LiberalDemocrat
ConservativeRepublican
- 27-
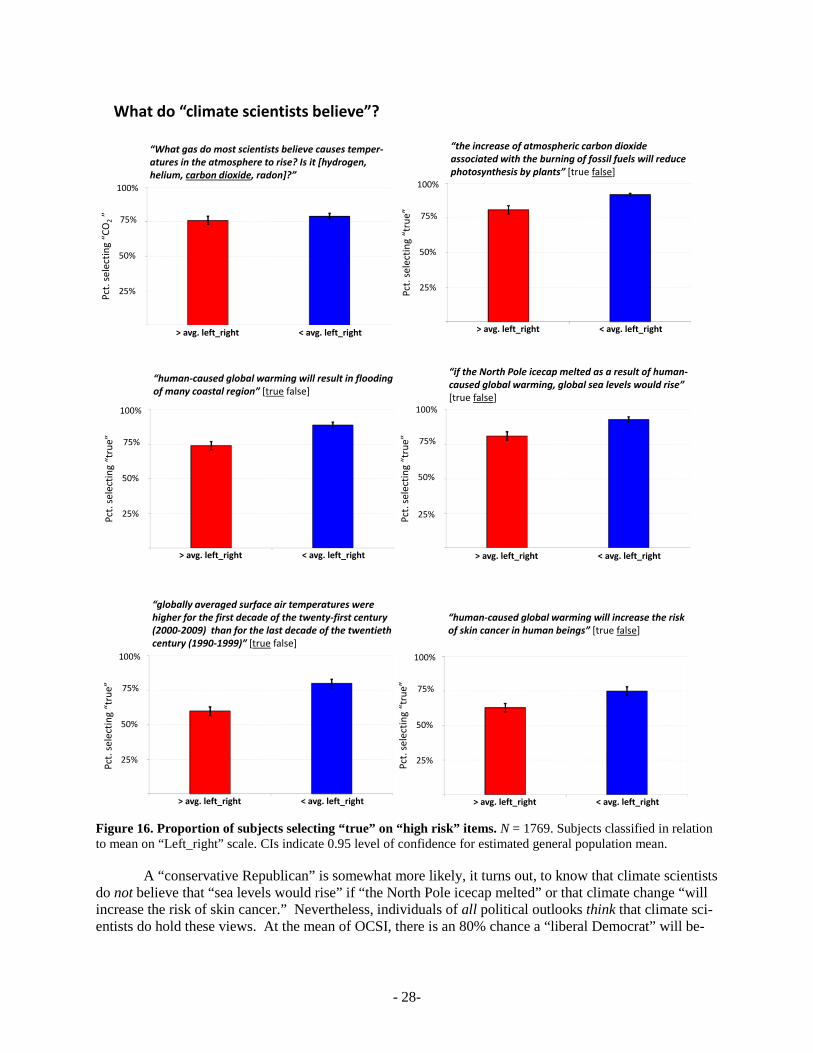
Figure 16. Proportion of subjects selecting “true” on “high risk” items. N = 1769. Subjects classified in relation to mean on “Left_right” scale. CIs indicate 0.95 level of confidence for estimated general population mean.
A “conservative Republican” is somewhat more likely, it turns out, to know that climate scientists do not believe that “sea levels would rise” if “the North Pole icecap melted” or that climate change “will increase the risk of skin cancer.” Nevertheless, individuals of all political outlooks think that climate sci-entists do hold these views. At the mean of OCSI, there is an 80% chance a “liberal Democrat” will be-
“What gas do most scientists believe causes temper-atures in the atmosphere to rise? Is it [hydrogen, helium, carbon dioxide, radon]?”
Pct.
sele
ctin
g “C
O2
”
100%
75%
50%
25%
> avg. left_right < avg. left_right
“human-caused global warming will result in flooding of many coastal region” [true false]
Pct.
sele
ctin
g “t
rue”
100%
75%
50%
25%
> avg. left_right < avg. left_right
“if the North Pole icecap melted as a result of human-caused global warming, global sea levels would rise” [true false]
Pct.
sele
ctin
g “t
rue”
100%
75%
50%
< avg. left_right
25%
> avg. left_right
“globally averaged surface air temperatures were higher for the first decade of the twenty-first century (2000-2009) than for the last decade of the twentieth century (1990-1999)” [true false]
100%
75%
50%
25%
> avg. left_right < avg. left_right
“human-caused global warming will increase the risk of skin cancer in human beings” [true false]
Pct.
sele
ctin
g “t
rue”
100%
75%
50%
25%
> avg. left_right < avg. left_right
What do “climate scientists believe”?
“the increase of atmospheric carbon dioxide associated with the burning of fossil fuels will reduce photosynthesis by plants” [true false]
Pct.
sele
ctin
g “t
rue”
100%
75%
50%
25%
> avg. left_right < avg. left_right
Pct.
sele
ctin
g “t
rue”
- 28-
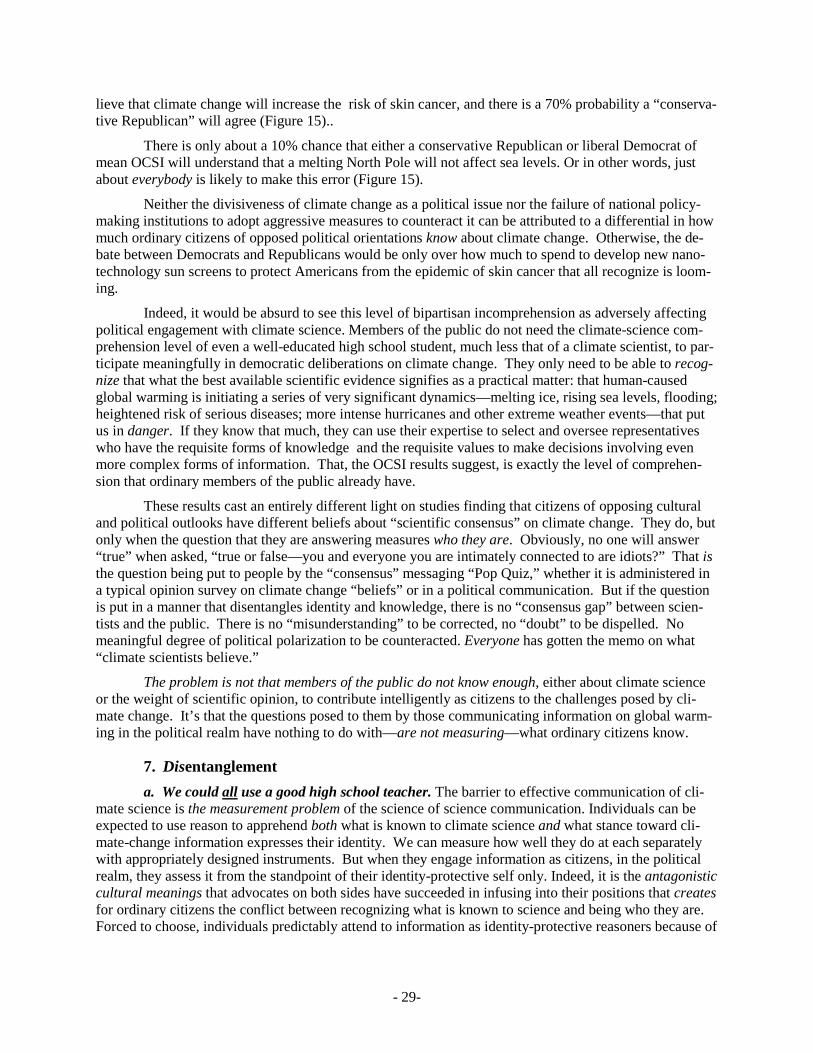
lieve that climate change will increase the risk of skin cancer, and there is a 70% probability a “conserva-tive Republican” will agree (Figure 15)..
There is only about a 10% chance that either a conservative Republican or liberal Democrat of mean OCSI will understand that a melting North Pole will not affect sea levels. Or in other words, just about everybody is likely to make this error (Figure 15).
Neither the divisiveness of climate change as a political issue nor the failure of national policy-making institutions to adopt aggressive measures to counteract it can be attributed to a differential in how much ordinary citizens of opposed political orientations know about climate change. Otherwise, the de-bate between Democrats and Republicans would be only over how much to spend to develop new nano-technology sun screens to protect Americans from the epidemic of skin cancer that all recognize is loom-ing.
Indeed, it would be absurd to see this level of bipartisan incomprehension as adversely affecting political engagement with climate science. Members of the public do not need the climate-science com-prehension level of even a well-educated high school student, much less that of a climate scientist, to par-ticipate meaningfully in democratic deliberations on climate change. They only need to be able to recog-nize that what the best available scientific evidence signifies as a practical matter: that human-caused global warming is initiating a series of very significant dynamics—melting ice, rising sea levels, flooding; heightened risk of serious diseases; more intense hurricanes and other extreme weather events—that put us in danger. If they know that much, they can use their expertise to select and oversee representatives who have the requisite forms of knowledge and the requisite values to make decisions involving even more complex forms of information. That, the OCSI results suggest, is exactly the level of comprehen-sion that ordinary members of the public already have.
These results cast an entirely different light on studies finding that citizens of opposing cultural and political outlooks have different beliefs about “scientific consensus” on climate change. They do, but only when the question that they are answering measures who they are. Obviously, no one will answer “true” when asked, “true or false—you and everyone you are intimately connected to are idiots?” That is the question being put to people by the “consensus” messaging “Pop Quiz,” whether it is administered in a typical opinion survey on climate change “beliefs” or in a political communication. But if the question is put in a manner that disentangles identity and knowledge, there is no “consensus gap” between scien-tists and the public. There is no “misunderstanding” to be corrected, no “doubt” to be dispelled. No meaningful degree of political polarization to be counteracted. Everyone has gotten the memo on what “climate scientists believe.”
The problem is not that members of the public do not know enough, either about climate science or the weight of scientific opinion, to contribute intelligently as citizens to the challenges posed by cli-mate change. It’s that the questions posed to them by those communicating information on global warm-ing in the political realm have nothing to do with—are not measuring—what ordinary citizens know.
7. Disentanglement a. We could all use a good high school teacher. The barrier to effective communication of cli-
mate science is the measurement problem of the science of science communication. Individuals can be expected to use reason to apprehend both what is known to climate science and what stance toward cli-mate-change information expresses their identity. We can measure how well they do at each separately with appropriately designed instruments. But when they engage information as citizens, in the political realm, they assess it from the standpoint of their identity-protective self only. Indeed, it is the antagonistic cultural meanings that advocates on both sides have succeeded in infusing into their positions that creates for ordinary citizens the conflict between recognizing what is known to science and being who they are. Forced to choose, individuals predictably attend to information as identity-protective reasoners because of
- 29-
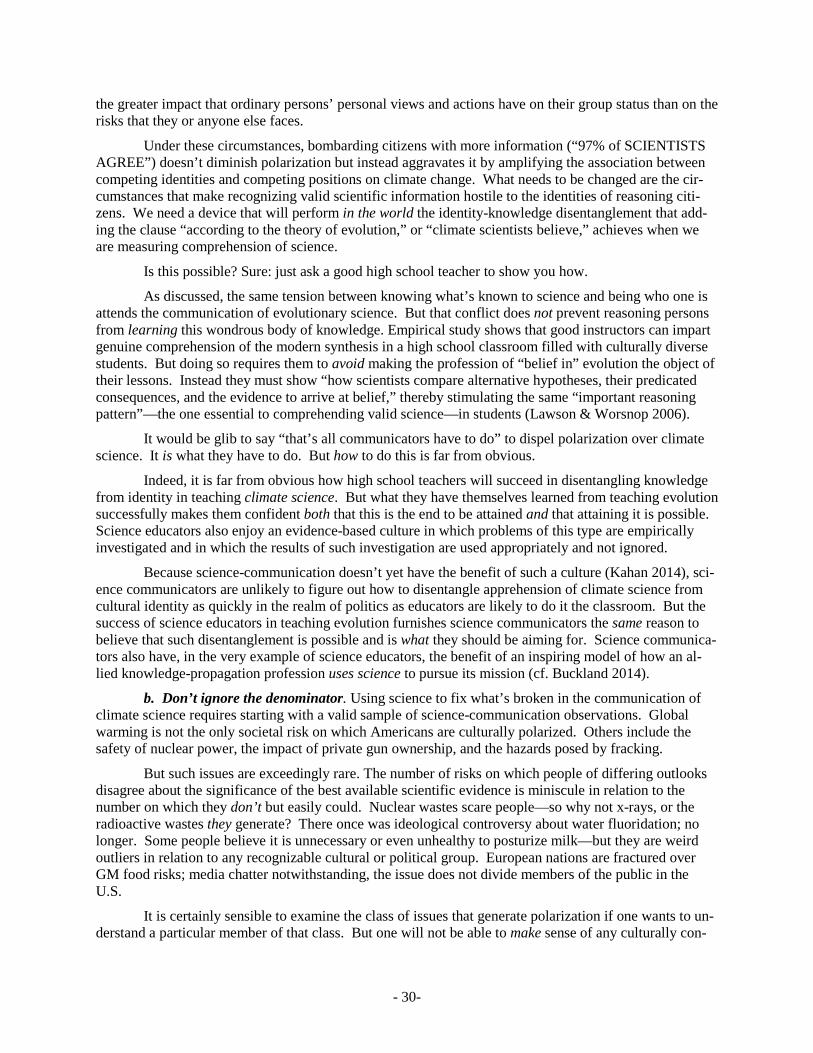
the greater impact that ordinary persons’ personal views and actions have on their group status than on the risks that they or anyone else faces.
Under these circumstances, bombarding citizens with more information (“97% of SCIENTISTS AGREE”) doesn’t diminish polarization but instead aggravates it by amplifying the association between competing identities and competing positions on climate change. What needs to be changed are the cir-cumstances that make recognizing valid scientific information hostile to the identities of reasoning citi-zens. We need a device that will perform in the world the identity-knowledge disentanglement that add-ing the clause “according to the theory of evolution,” or “climate scientists believe,” achieves when we are measuring comprehension of science.
Is this possible? Sure: just ask a good high school teacher to show you how.
As discussed, the same tension between knowing what’s known to science and being who one is attends the communication of evolutionary science. But that conflict does not prevent reasoning persons from learning this wondrous body of knowledge. Empirical study shows that good instructors can impart genuine comprehension of the modern synthesis in a high school classroom filled with culturally diverse students. But doing so requires them to avoid making the profession of “belief in” evolution the object of their lessons. Instead they must show “how scientists compare alternative hypotheses, their predicated consequences, and the evidence to arrive at belief,” thereby stimulating the same “important reasoning pattern”—the one essential to comprehending valid science—in students (Lawson & Worsnop 2006).
It would be glib to say “that’s all communicators have to do” to dispel polarization over climate science. It is what they have to do. But how to do this is far from obvious.
Indeed, it is far from obvious how high school teachers will succeed in disentangling knowledge from identity in teaching climate science. But what they have themselves learned from teaching evolution successfully makes them confident both that this is the end to be attained and that attaining it is possible. Science educators also enjoy an evidence-based culture in which problems of this type are empirically investigated and in which the results of such investigation are used appropriately and not ignored.
Because science-communication doesn’t yet have the benefit of such a culture (Kahan 2014), sci-ence communicators are unlikely to figure out how to disentangle apprehension of climate science from cultural identity as quickly in the realm of politics as educators are likely to do it the classroom. But the success of science educators in teaching evolution furnishes science communicators the same reason to believe that such disentanglement is possible and is what they should be aiming for. Science communica-tors also have, in the very example of science educators, the benefit of an inspiring model of how an al-lied knowledge-propagation profession uses science to pursue its mission (cf. Buckland 2014).
b. Don’t ignore the denominator. Using science to fix what’s broken in the communication of climate science requires starting with a valid sample of science-communication observations. Global warming is not the only societal risk on which Americans are culturally polarized. Others include the safety of nuclear power, the impact of private gun ownership, and the hazards posed by fracking.
But such issues are exceedingly rare. The number of risks on which people of differing outlooks disagree about the significance of the best available scientific evidence is miniscule in relation to the number on which they don’t but easily could. Nuclear wastes scare people—so why not x-rays, or the radioactive wastes they generate? There once was ideological controversy about water fluoridation; no longer. Some people believe it is unnecessary or even unhealthy to posturize milk—but they are weird outliers in relation to any recognizable cultural or political group. European nations are fractured over GM food risks; media chatter notwithstanding, the issue does not divide members of the public in the U.S.
It is certainly sensible to examine the class of issues that generate polarization if one wants to un-derstand a particular member of that class. But one will not be able to make sense of any culturally con-
- 30-
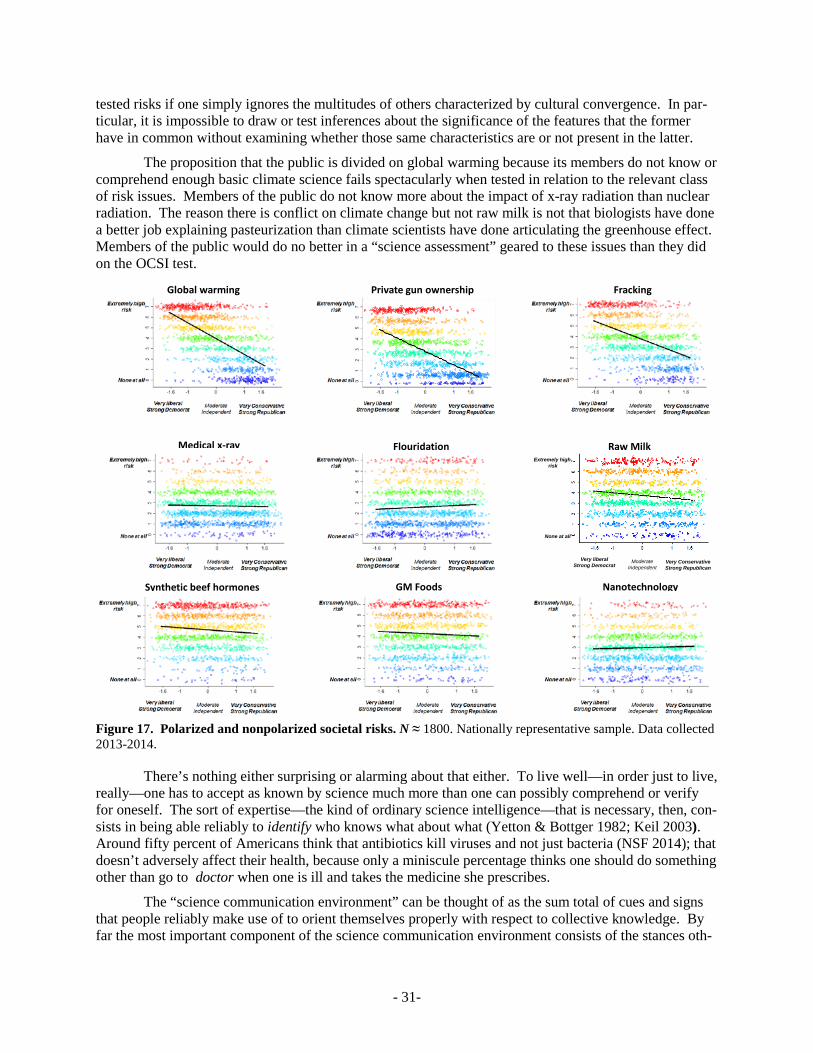
tested risks if one simply ignores the multitudes of others characterized by cultural convergence. In par-ticular, it is impossible to draw or test inferences about the significance of the features that the former have in common without examining whether those same characteristics are or not present in the latter.
The proposition that the public is divided on global warming because its members do not know or comprehend enough basic climate science fails spectacularly when tested in relation to the relevant class of risk issues. Members of the public do not know more about the impact of x-ray radiation than nuclear radiation. The reason there is conflict on climate change but not raw milk is not that biologists have done a better job explaining pasteurization than climate scientists have done articulating the greenhouse effect. Members of the public would do no better in a “science assessment” geared to these issues than they did on the OCSI test.
Figure 17. Polarized and nonpolarized societal risks. N ≈ 1800. Nationally representative sample. Data collected 2013-2014.
There’s nothing either surprising or alarming about that either. To live well—in order just to live, really—one has to accept as known by science much more than one can possibly comprehend or verify for oneself. The sort of expertise—the kind of ordinary science intelligence—that is necessary, then, con-sists in being able reliably to identify who knows what about what (Yetton & Bottger 1982; Keil 2003). Around fifty percent of Americans think that antibiotics kill viruses and not just bacteria (NSF 2014); that doesn’t adversely affect their health, because only a miniscule percentage thinks one should do something other than go to doctor when one is ill and takes the medicine she prescribes.
The “science communication environment” can be thought of as the sum total of cues and signs that people reliably make use of to orient themselves properly with respect to collective knowledge. By far the most important component of the science communication environment consists of the stances oth-
Global warming Fracking
GM FoodsSynthetic beef hormones
Medical x-ray
Nanotechnology
Private gun ownership
None at all
Extremely highrisk
Very liberalStrong Democrat
Very ConservativeStrong Republican
ModerateIndependent
Raw MilkFlouridation
- 31-
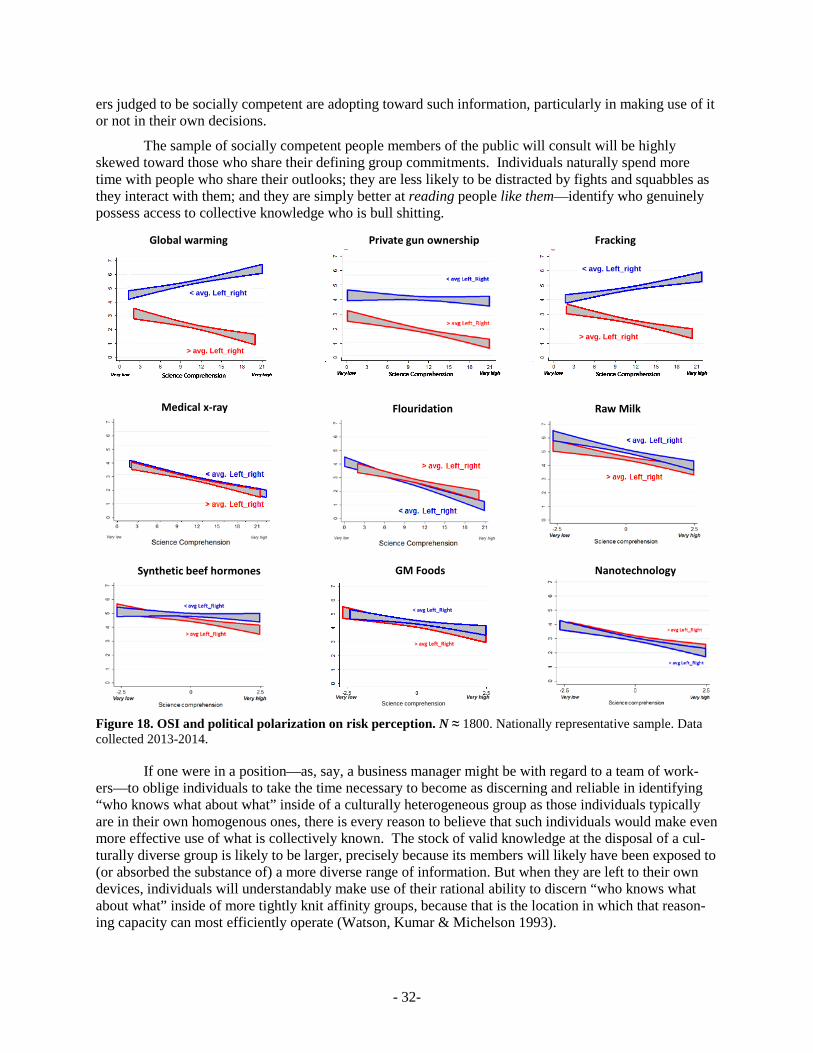
ers judged to be socially competent are adopting toward such information, particularly in making use of it or not in their own decisions.
The sample of socially competent people members of the public will consult will be highly skewed toward those who share their defining group commitments. Individuals naturally spend more time with people who share their outlooks; they are less likely to be distracted by fights and squabbles as they interact with them; and they are simply better at reading people like them—identify who genuinely possess access to collective knowledge who is bull shitting.
Figure 18. OSI and political polarization on risk perception. N ≈ 1800. Nationally representative sample. Data collected 2013-2014.
If one were in a position—as, say, a business manager might be with regard to a team of work-ers—to oblige individuals to take the time necessary to become as discerning and reliable in identifying “who knows what about what” inside of a culturally heterogeneous group as those individuals typically are in their own homogenous ones, there is every reason to believe that such individuals would make even more effective use of what is collectively known. The stock of valid knowledge at the disposal of a cul-turally diverse group is likely to be larger, precisely because its members will likely have been exposed to (or absorbed the substance of) a more diverse range of information. But when they are left to their own devices, individuals will understandably make use of their rational ability to discern “who knows what about what” inside of more tightly knit affinity groups, because that is the location in which that reason-ing capacity can most efficiently operate (Watson, Kumar & Michelson 1993).
Very low Very highScience comprehension
> avg Left_Right
< avg Left_Right
> avg. Left_right
< avg. Left_right
> avg. Left_right
< avg. Left_right
> avg. Left_right
< avg. Left_right
Global warming Fracking
GM FoodsSynthetic beef hormones
Raw MilkMedical x-ray Flouridation
Nanotechnology
Private gun ownership
- 32-
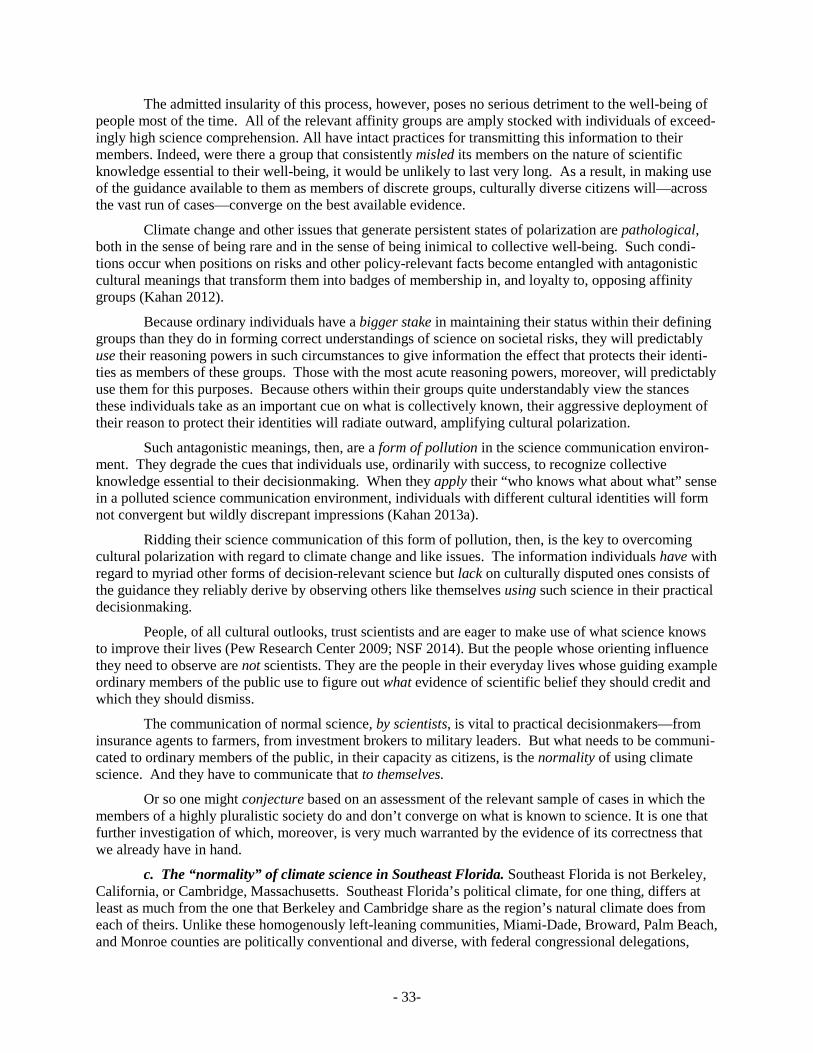
The admitted insularity of this process, however, poses no serious detriment to the well-being of people most of the time. All of the relevant affinity groups are amply stocked with individuals of exceed-ingly high science comprehension. All have intact practices for transmitting this information to their members. Indeed, were there a group that consistently misled its members on the nature of scientific knowledge essential to their well-being, it would be unlikely to last very long. As a result, in making use of the guidance available to them as members of discrete groups, culturally diverse citizens will—across the vast run of cases—converge on the best available evidence.
Climate change and other issues that generate persistent states of polarization are pathological, both in the sense of being rare and in the sense of being inimical to collective well-being. Such condi-tions occur when positions on risks and other policy-relevant facts become entangled with antagonistic cultural meanings that transform them into badges of membership in, and loyalty to, opposing affinity groups (Kahan 2012).
Because ordinary individuals have a bigger stake in maintaining their status within their defining groups than they do in forming correct understandings of science on societal risks, they will predictably use their reasoning powers in such circumstances to give information the effect that protects their identi-ties as members of these groups. Those with the most acute reasoning powers, moreover, will predictably use them for this purposes. Because others within their groups quite understandably view the stances these individuals take as an important cue on what is collectively known, their aggressive deployment of their reason to protect their identities will radiate outward, amplifying cultural polarization.
Such antagonistic meanings, then, are a form of pollution in the science communication environ-ment. They degrade the cues that individuals use, ordinarily with success, to recognize collective knowledge essential to their decisionmaking. When they apply their “who knows what about what” sense in a polluted science communication environment, individuals with different cultural identities will form not convergent but wildly discrepant impressions (Kahan 2013a).
Ridding their science communication of this form of pollution, then, is the key to overcoming cultural polarization with regard to climate change and like issues. The information individuals have with regard to myriad other forms of decision-relevant science but lack on culturally disputed ones consists of the guidance they reliably derive by observing others like themselves using such science in their practical decisionmaking.
People, of all cultural outlooks, trust scientists and are eager to make use of what science knows to improve their lives (Pew Research Center 2009; NSF 2014). But the people whose orienting influence they need to observe are not scientists. They are the people in their everyday lives whose guiding example ordinary members of the public use to figure out what evidence of scientific belief they should credit and which they should dismiss.
The communication of normal science, by scientists, is vital to practical decisionmakers—from insurance agents to farmers, from investment brokers to military leaders. But what needs to be communi-cated to ordinary members of the public, in their capacity as citizens, is the normality of using climate science. And they have to communicate that to themselves.
Or so one might conjecture based on an assessment of the relevant sample of cases in which the members of a highly pluralistic society do and don’t converge on what is known to science. It is one that further investigation of which, moreover, is very much warranted by the evidence of its correctness that we already have in hand.
c. The “normality” of climate science in Southeast Florida. Southeast Florida is not Berkeley, California, or Cambridge, Massachusetts. Southeast Florida’s political climate, for one thing, differs at least as much from the one that Berkeley and Cambridge share as the region’s natural climate does from each of theirs. Unlike these homogenously left-leaning communities, Miami-Dade, Broward, Palm Beach, and Monroe counties are politically conventional and diverse, with federal congressional delegations,
- 33-
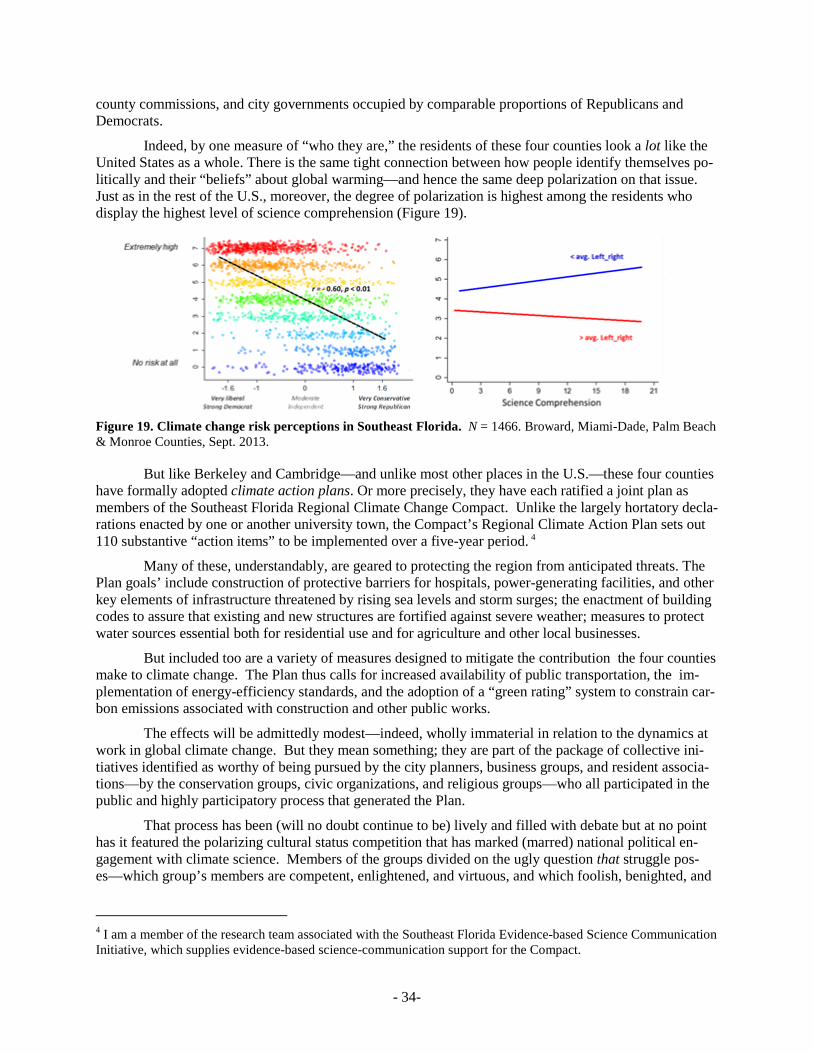
county commissions, and city governments occupied by comparable proportions of Republicans and Democrats.
Indeed, by one measure of “who they are,” the residents of these four counties look a lot like the United States as a whole. There is the same tight connection between how people identify themselves po-litically and their “beliefs” about global warming—and hence the same deep polarization on that issue. Just as in the rest of the U.S., moreover, the degree of polarization is highest among the residents who display the highest level of science comprehension (Figure 19).
Figure 19. Climate change risk perceptions in Southeast Florida. N = 1466. Broward, Miami-Dade, Palm Beach & Monroe Counties, Sept. 2013.
But like Berkeley and Cambridge—and unlike most other places in the U.S.—these four counties have formally adopted climate action plans. Or more precisely, they have each ratified a joint plan as members of the Southeast Florida Regional Climate Change Compact. Unlike the largely hortatory decla-rations enacted by one or another university town, the Compact’s Regional Climate Action Plan sets out 110 substantive “action items” to be implemented over a five-year period. 4
Many of these, understandably, are geared to protecting the region from anticipated threats. The Plan goals’ include construction of protective barriers for hospitals, power-generating facilities, and other key elements of infrastructure threatened by rising sea levels and storm surges; the enactment of building codes to assure that existing and new structures are fortified against severe weather; measures to protect water sources essential both for residential use and for agriculture and other local businesses.
But included too are a variety of measures designed to mitigate the contribution the four counties make to climate change. The Plan thus calls for increased availability of public transportation, the im-plementation of energy-efficiency standards, and the adoption of a “green rating” system to constrain car-bon emissions associated with construction and other public works.
The effects will be admittedly modest—indeed, wholly immaterial in relation to the dynamics at work in global climate change. But they mean something; they are part of the package of collective ini-tiatives identified as worthy of being pursued by the city planners, business groups, and resident associa-tions—by the conservation groups, civic organizations, and religious groups—who all participated in the public and highly participatory process that generated the Plan.
That process has been (will no doubt continue to be) lively and filled with debate but at no point has it featured the polarizing cultural status competition that has marked (marred) national political en-gagement with climate science. Members of the groups divided on the ugly question that struggle pos-es—which group’s members are competent, enlightened, and virtuous, and which foolish, benighted, and
4 I am a member of the research team associated with the Southeast Florida Evidence-based Science Communication Initiative, which supplies evidence-based science-communication support for the Compact.
- 34-
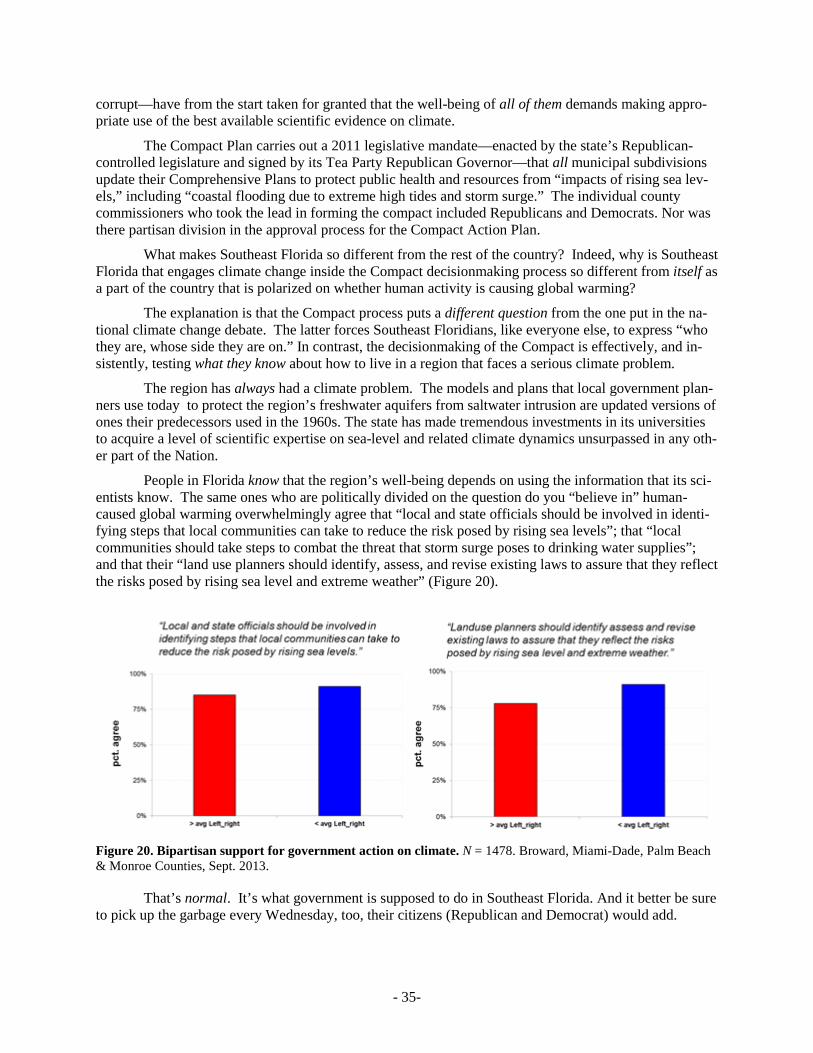
corrupt—have from the start taken for granted that the well-being of all of them demands making appro-priate use of the best available scientific evidence on climate.
The Compact Plan carries out a 2011 legislative mandate—enacted by the state’s Republican-controlled legislature and signed by its Tea Party Republican Governor—that all municipal subdivisions update their Comprehensive Plans to protect public health and resources from “impacts of rising sea lev-els,” including “coastal flooding due to extreme high tides and storm surge.” The individual county commissioners who took the lead in forming the compact included Republicans and Democrats. Nor was there partisan division in the approval process for the Compact Action Plan.
What makes Southeast Florida so different from the rest of the country? Indeed, why is Southeast Florida that engages climate change inside the Compact decisionmaking process so different from itself as a part of the country that is polarized on whether human activity is causing global warming?
The explanation is that the Compact process puts a different question from the one put in the na-tional climate change debate. The latter forces Southeast Floridians, like everyone else, to express “who they are, whose side they are on.” In contrast, the decisionmaking of the Compact is effectively, and in-sistently, testing what they know about how to live in a region that faces a serious climate problem.
The region has always had a climate problem. The models and plans that local government plan-ners use today to protect the region’s freshwater aquifers from saltwater intrusion are updated versions of ones their predecessors used in the 1960s. The state has made tremendous investments in its universities to acquire a level of scientific expertise on sea-level and related climate dynamics unsurpassed in any oth-er part of the Nation.
People in Florida know that the region’s well-being depends on using the information that its sci-entists know. The same ones who are politically divided on the question do you “believe in” human-caused global warming overwhelmingly agree that “local and state officials should be involved in identi-fying steps that local communities can take to reduce the risk posed by rising sea levels”; that “local communities should take steps to combat the threat that storm surge poses to drinking water supplies”; and that their “land use planners should identify, assess, and revise existing laws to assure that they reflect the risks posed by rising sea level and extreme weather” (Figure 20).
Figure 20. Bipartisan support for government action on climate. N = 1478. Broward, Miami-Dade, Palm Beach & Monroe Counties, Sept. 2013.
That’s normal. It’s what government is supposed to do in Southeast Florida. And it better be sure to pick up the garbage every Wednesday, too, their citizens (Republican and Democrat) would add.
- 35-
The Compact effectively informed its citizens of the appropriateness of using the best available science for these ends but not through a “messaging” campaign focused on “scientific consensus” or any-thing else. The Compact’s “communication strategy” was its process. The dozens of open meetings and forums, convened not just by the Compact governments but by business, residential, and other groups in civil society filled the region’s science communication environment with exactly the information that or-dinary people rationally rely on to discern what’s known to science: the conspicuous example of people they trust and recognize as socially competent supporting the use of science in decisionmaking directly bearing on their lives.
Indeed, far from evoking the toxic aura of tribal contempt that pervades “messaging” campaigns (“what? are you stupid? What part of ‘97% AGREE!’ don’t you understand?!”), Compact officials ag-gressively, instinctively repel it whenever it threatens to contaminate the region’s deliberations. One of those occasions occurred during a heavily attended “town meeting,” conducted in connection with the Compact’s 2013 “Regional Climate Leadership Summit,” a two-day series of presentations and work-shops involving both government officials and representatives of key public stakeholder groups.
The moderator for the town meeting (a public radio personality who had just moved to Southeast Florida from Chicago) persistently tried to inject the stock themes of the national climate change debate into the discussion as the public officials on stage took turns answering questions from the audience. What do Republicans in Washington have against science? And what “about the level of evidence that’s being accepted by private industry”—how come its doing so little to address climate change?
After an awkward pause, Broward County’s Democratic Mayor Kristin Jacobs replied. “I think it’s important to note,” she said, gesturing to a banner adorned by a variety of corporate logos, “that one of the sponsors of this Summit today is the Broward Workshop. The Broward Workshop represents 100 of the largest businesses in Broward County.” The owners of these businesses, she continued, were “not only sponsoring this Summit,” but actively participating in it, and had organized their own working groups “addressing the impacts of water and climate change.” “They know what’s happening here,” she said to the moderator, who at this point was averting her gaze and fumbling with his notes.
“I would also point out,” Jacobs persisted, “when you look across this region at the Summit part-ners, the Summit Counties, there are three Mayors that are Republican and one that’s Democrat, and we’re working on these issues across party lines.” Pause, silence. “So I don’t think it is about party,” she concluded. “I think it is about understanding what the problems are and fixing them and addressing them.”
Five of the lead chapter authors of the National Climate Assessment were affiliated with Florida universities or government institutions. As more regions of the country start to confront climate threats comparable to ones Florida has long dealt with, Florida will share the knowledge it has invested to ac-quire about how to do so and thrive while doing it.
But there is more Florida can teach. If we study how the Compact Counties created a political process that enables its diverse citizens to respond to the question “so what should we do about climate change?” with an answer that reflects what they all know, we are likely to learn important lessons about how to protect enlightened self-government from the threat posed by the science of science communica-tion’s measurement problem.
8. Solving the science of science communication’s measurement problem—by anni-hilating it
My goal in this lecture has been to identify the science of science communication’s “measure-ment problem.” I’ve tried to demonstrate the value of understanding this problem by showing how it con-tributes to the failure of the communication of climate science in the U.S.
- 36-
At the most prosaic level, the “measurement problem” in that setting is that many data collectors do not fully grasp what they are measuring when they investigate the sources of public polarization on climate change. As a result, many of their conclusions are wrong. Those who rely on those conclusions in formulating real-world communication strategies fail to make progress—and sometimes end up acting in a self-defeating manner.
But more fundamentally, the science of science communication’s measurement problem de-scribes a set of social and psychological dynamics. Like the “measurement problem” of quantum mechan-ics, it describes a vexing feature of the phenomena that are being observed and not merely a limitation in the precision of the methods available for studying them.
There is, in the science of science communication, an analog to the dual “wave-like” and “parti-cle-like” nature of light (or of elementary particles generally). It is the dual nature of human reasoners as collective-knowledge acquirers and cultural-identity protectors. Just as individual photons in the double-slit experiment pass through “both slits at once” when unobserved, so each individual person uses her rea-son simultaneously to apprehend what is collectively known and to be a member of a particular cultural community defined by a set of highly distinctive set of commitments.
Moreover, in the science of science communication as in quantum physics, assessment perturbs this dualism. The antagonistic cultural meanings that pervade the social interactions in which we engage individuals on contested science issues forces them to be only one of their reasoning selves. We can through these interactions measure what they know, or measure who they are, but we cannot do both at once.
This is the difficulty that has persistently defeated effective communication of climate science. By reinforcing the association of opposing positions with membership in competing cultural groups, the antagonistic meanings relentlessly conveyed by high-profile “communicators” on both sides effectively force individuals to use their reason to selectively construe all manner of evidence—from what “most sci-entists believe” (Corner, Whitmarsh & Dimitrios 2012; Kahan, Jenkins-Smith & Braman 2011) to what the weather has been like in their community in recent years (Goebbert, Jenkins-Smith, Klockow, Nowlin & Silva 2012)—in patterns that reflect the positions that prevail in their communities. We thus observe citizens only as identity-protective reasoners. We consistently fail to engage their formidable capacity as collective-knowledge acquirers to recognize and give effect to the best available scientific evidence on climate change.
There is nothing inevitable or necessary about this outcome. In other domains, most noticeably the teaching of evolutionary theory, the use of valid empirical methods has identified means of disentan-gling the question of what do you know? from the question who are you; whose side are you on?, thereby making it possible for individuals of diverse cultural identities to use their reason to participate in the in-sights of science. Climate-science communicators need to learn how to do this too, not only in the class-room but in the public spaces in which we engage climate science as citizens.
Indeed, the results of the “climate science comprehension” study I’ve described supports the conclusion that ordinary citizens of all political outlooks already know the core insights of climate sci-ence. If they can be freed of the ugly, illiberal dynamics that force them to choose between exploiting what they know and expressing who they are, there is every reason to believe that they will demand that democratically accountable representatives use the best available evidence to promote their collective well-being. Indeed, this is happening, although on a regrettably tiny scale, in regions like Southeast Flor-ida.
Though I’ve used the “measurement problem” framework to extract insight from empirical evi-dence—of both real-world and laboratory varieties—nothing in fact depends on accepting the framework. Like “collapsing wave functions,” “superposition,” and similar devices in one particular rendering of quantum physics, the various elements of the science of science communication measurement problem
- 37-
(“dualistic reasoners,” “communicative interference,” “disentanglement,” etc.) are not being held forth as “real things,” that are “happening” somewhere.
They are a set of pictures intended to help us visualize processes that cannot be observed and likely do not even admit of being truly seen. The value of the pictures lies in whether they are useful to us, at least for a time, in forming a reliable mental apprehension of how those dynamics affect our world, in predicting what is likely to happen to us as we interact with them, and in empowering us to do things that make our world better.
I think the science of “science communication measurement problem” can serve that function, and do so much better than myriad other theories (“bounded rationality,” “terror management,” “system justification,” etc.) that also can be appraised only for their explanatory, predictive, and prescriptive utili-ty. But it is the imperative to make sense of —and stop ignoring—observable, consequential features of our experience. If there are better frameworks, or simply equivalent but different ones, that help to achieve this goal, then they should be embraced.
But there is one final important element of the theoretical framework I have proposed that would need to be represented by an appropriate counterpart in any alternative. It is a part of the framework that emphasizes not a parallel in the “measurement problems” of the science of science communication and quantum physics but a critical difference between them.
The insolubility of quantum mechanics’ “measurement problem” is fundamental to the work that this construct and all the ones related to it (“the uncertainty principle,” “quantum entanglement,” and the like) do in that theory. To dispel quantum mechanic’s measurement problem (by, say, identifying the “hidden variables” that determine which of the two slits through which the photon must pass, whether we are watching or not) would demonstrate the inadequacy (or “incompleteness”) of quantum mechanics.
But the measurement problem that confronts the science of science communication, while con-nected to real-world dynamics of consequence and not merely the imperfect methods used to study them, can be overcome. The dynamics that this measurement problem comprises are ones generated by the be-havior of conscious, reasoning, acting human beings. They can choose to act differently, if they can fig-ure out how.
The utility of recognizing the “science of science communication measurement problem” thus depends on the contribution that using that theory can ultimately make to its own destruction.
- 38-
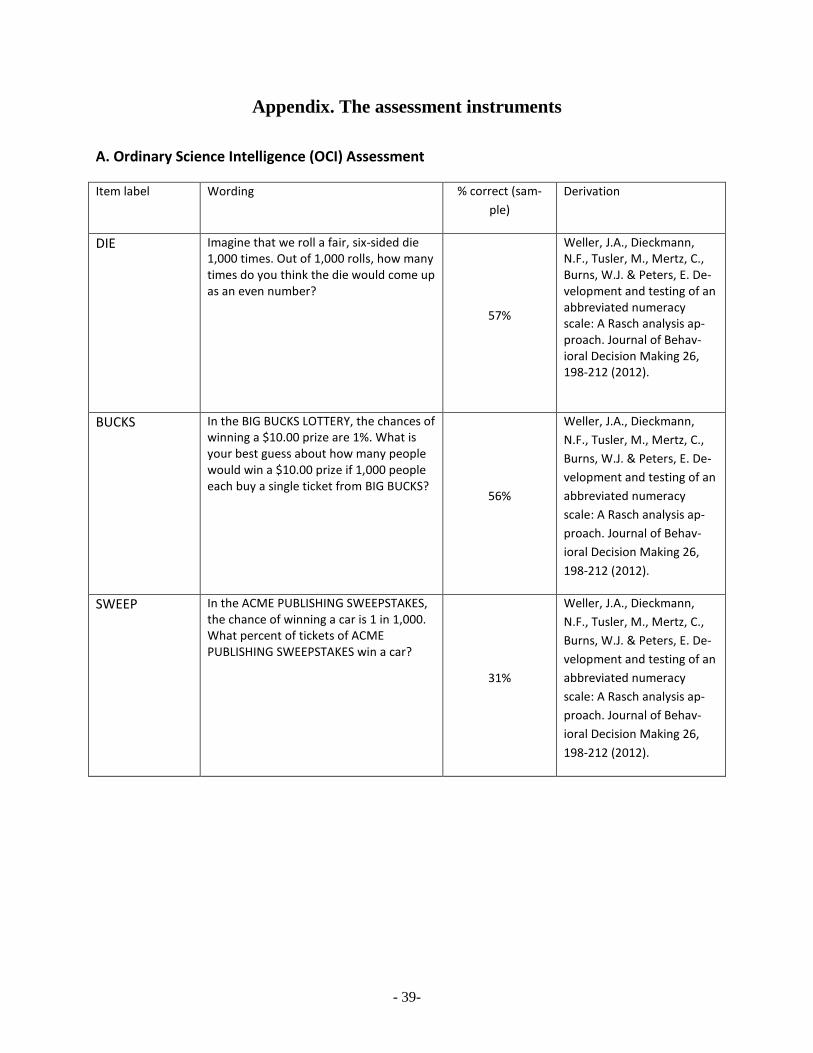
Appendix. The assessment instruments
A. Ordinary Science Intelligence (OCI) Assessment
Item label Wording % correct (sam-ple)
Derivation
DIE Imagine that we roll a fair, six-sided die 1,000 times. Out of 1,000 rolls, how many times do you think the die would come up as an even number?
57%
Weller, J.A., Dieckmann, N.F., Tusler, M., Mertz, C., Burns, W.J. & Peters, E. De-velopment and testing of an abbreviated numeracy scale: A Rasch analysis ap-proach. Journal of Behav-ioral Decision Making 26, 198-212 (2012).
BUCKS In the BIG BUCKS LOTTERY, the chances of winning a $10.00 prize are 1%. What is your best guess about how many people would win a $10.00 prize if 1,000 people each buy a single ticket from BIG BUCKS?
56%
Weller, J.A., Dieckmann, N.F., Tusler, M., Mertz, C., Burns, W.J. & Peters, E. De-velopment and testing of an abbreviated numeracy scale: A Rasch analysis ap-proach. Journal of Behav-ioral Decision Making 26, 198-212 (2012).
SWEEP In the ACME PUBLISHING SWEEPSTAKES, the chance of winning a car is 1 in 1,000. What percent of tickets of ACME PUBLISHING SWEEPSTAKES win a car?
31%
Weller, J.A., Dieckmann, N.F., Tusler, M., Mertz, C., Burns, W.J. & Peters, E. De-velopment and testing of an abbreviated numeracy scale: A Rasch analysis ap-proach. Journal of Behav-ioral Decision Making 26, 198-212 (2012).
- 39-
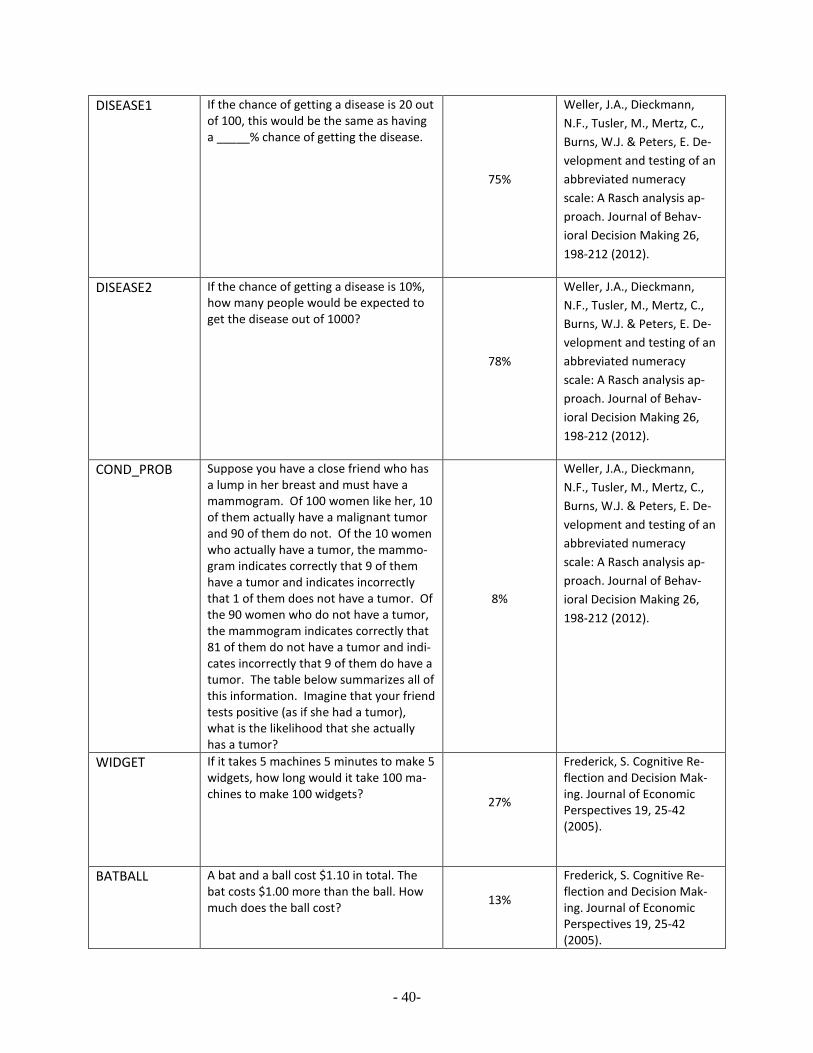
DISEASE1 If the chance of getting a disease is 20 out of 100, this would be the same as having a _____% chance of getting the disease.
75%
Weller, J.A., Dieckmann, N.F., Tusler, M., Mertz, C., Burns, W.J. & Peters, E. De-velopment and testing of an abbreviated numeracy scale: A Rasch analysis ap-proach. Journal of Behav-ioral Decision Making 26, 198-212 (2012).
DISEASE2 If the chance of getting a disease is 10%, how many people would be expected to get the disease out of 1000?
78%
Weller, J.A., Dieckmann, N.F., Tusler, M., Mertz, C., Burns, W.J. & Peters, E. De-velopment and testing of an abbreviated numeracy scale: A Rasch analysis ap-proach. Journal of Behav-ioral Decision Making 26, 198-212 (2012).
COND_PROB Suppose you have a close friend who has a lump in her breast and must have a mammogram. Of 100 women like her, 10 of them actually have a malignant tumor and 90 of them do not. Of the 10 women who actually have a tumor, the mammo-gram indicates correctly that 9 of them have a tumor and indicates incorrectly that 1 of them does not have a tumor. Of the 90 women who do not have a tumor, the mammogram indicates correctly that 81 of them do not have a tumor and indi-cates incorrectly that 9 of them do have a tumor. The table below summarizes all of this information. Imagine that your friend tests positive (as if she had a tumor), what is the likelihood that she actually has a tumor?
8%
Weller, J.A., Dieckmann, N.F., Tusler, M., Mertz, C., Burns, W.J. & Peters, E. De-velopment and testing of an abbreviated numeracy scale: A Rasch analysis ap-proach. Journal of Behav-ioral Decision Making 26, 198-212 (2012).
WIDGET If it takes 5 machines 5 minutes to make 5 widgets, how long would it take 100 ma-chines to make 100 widgets? 27%
Frederick, S. Cognitive Re-flection and Decision Mak-ing. Journal of Economic Perspectives 19, 25-42 (2005).
BATBALL A bat and a ball cost $1.10 in total. The bat costs $1.00 more than the ball. How much does the ball cost? 13%
Frederick, S. Cognitive Re-flection and Decision Mak-ing. Journal of Economic Perspectives 19, 25-42 (2005).
- 40-
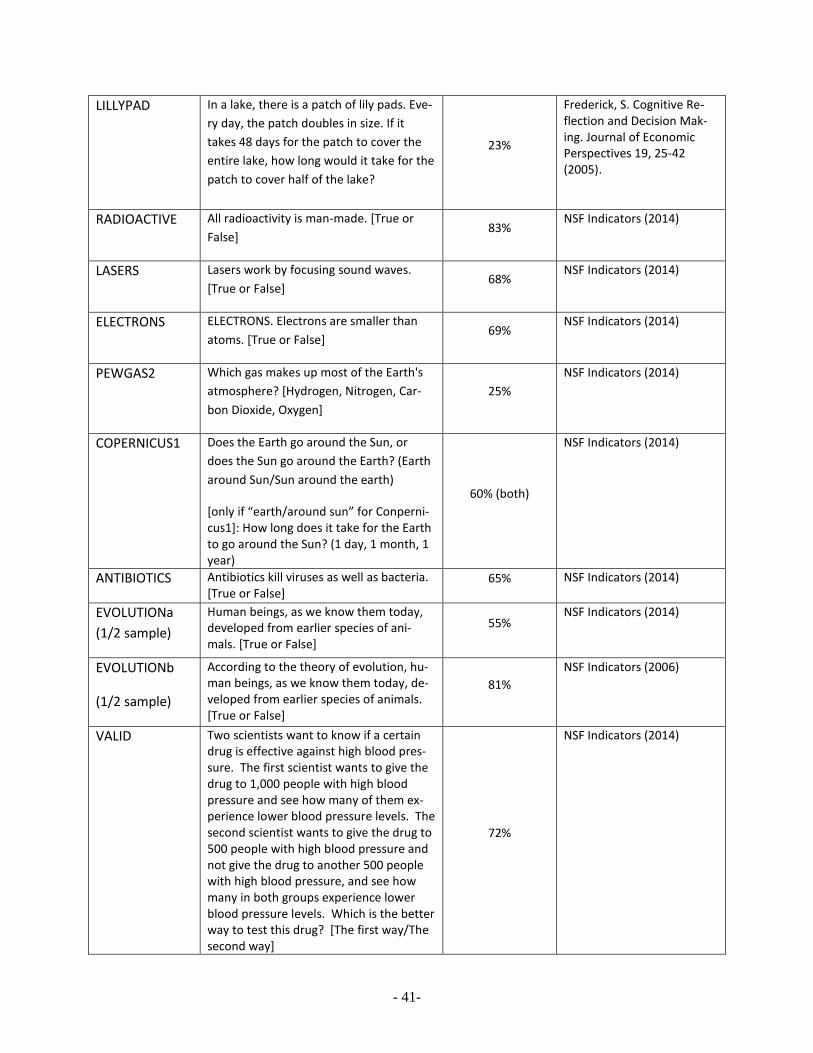
LILLYPAD In a lake, there is a patch of lily pads. Eve-ry day, the patch doubles in size. If it takes 48 days for the patch to cover the entire lake, how long would it take for the patch to cover half of the lake?
23%
Frederick, S. Cognitive Re-flection and Decision Mak-ing. Journal of Economic Perspectives 19, 25-42 (2005).
RADIOACTIVE All radioactivity is man-made. [True or False]
83% NSF Indicators (2014)
LASERS Lasers work by focusing sound waves. [True or False]
68% NSF Indicators (2014)
ELECTRONS ELECTRONS. Electrons are smaller than atoms. [True or False]
69% NSF Indicators (2014)
PEWGAS2 Which gas makes up most of the Earth's atmosphere? [Hydrogen, Nitrogen, Car-bon Dioxide, Oxygen]
25% NSF Indicators (2014)
COPERNICUS1 Does the Earth go around the Sun, or does the Sun go around the Earth? (Earth around Sun/Sun around the earth)
[only if “earth/around sun” for Conperni-cus1]: How long does it take for the Earth to go around the Sun? (1 day, 1 month, 1 year)
60% (both)
NSF Indicators (2014)
ANTIBIOTICS Antibiotics kill viruses as well as bacteria. [True or False]
65% NSF Indicators (2014)
EVOLUTIONa (1/2 sample)
Human beings, as we know them today, developed from earlier species of ani-mals. [True or False]
55% NSF Indicators (2014)
EVOLUTIONb
(1/2 sample)
According to the theory of evolution, hu-man beings, as we know them today, de-veloped from earlier species of animals. [True or False]
81% NSF Indicators (2006)
VALID Two scientists want to know if a certain drug is effective against high blood pres-sure. The first scientist wants to give the drug to 1,000 people with high blood pressure and see how many of them ex-perience lower blood pressure levels. The second scientist wants to give the drug to 500 people with high blood pressure and not give the drug to another 500 people with high blood pressure, and see how many in both groups experience lower blood pressure levels. Which is the better way to test this drug? [The first way/The second way]
72%
NSF Indicators (2014)
- 41-
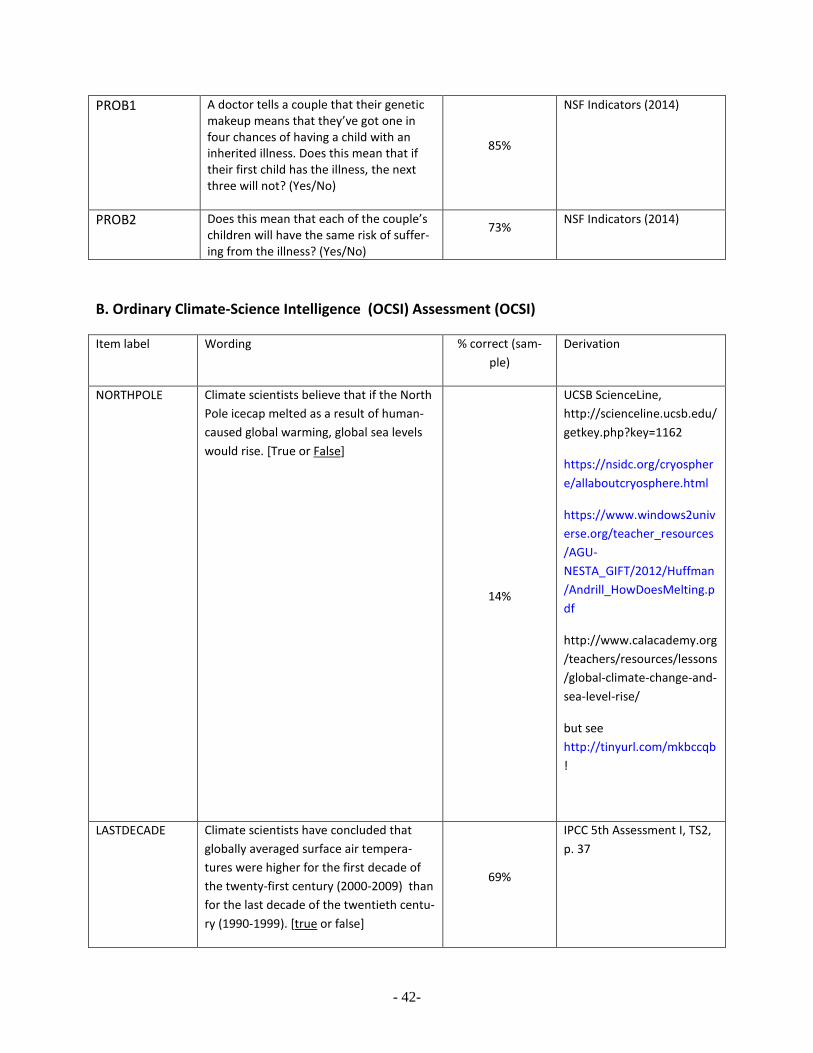
PROB1 A doctor tells a couple that their genetic makeup means that they’ve got one in four chances of having a child with an inherited illness. Does this mean that if their first child has the illness, the next three will not? (Yes/No)
85%
NSF Indicators (2014)
PROB2 Does this mean that each of the couple’s children will have the same risk of suffer-ing from the illness? (Yes/No)
73% NSF Indicators (2014)
B. Ordinary Climate-Science Intelligence (OCSI) Assessment (OCSI)
Item label Wording % correct (sam-ple)
Derivation
NORTHPOLE Climate scientists believe that if the North Pole icecap melted as a result of human-caused global warming, global sea levels would rise. [True or False]
14%
UCSB ScienceLine, http://scienceline.ucsb.edu/getkey.php?key=1162
https://nsidc.org/cryosphere/allaboutcryosphere.html
https://www.windows2universe.org/teacher_resources/AGU-NESTA_GIFT/2012/Huffman/Andrill_HowDoesMelting.pdf
http://www.calacademy.org/teachers/resources/lessons/global-climate-change-and-sea-level-rise/
but see http://tinyurl.com/mkbccqb !
LASTDECADE Climate scientists have concluded that globally averaged surface air tempera-tures were higher for the first decade of the twenty-first century (2000-2009) than for the last decade of the twentieth centu-ry (1990-1999). [true or false]
69%
IPCC 5th Assessment I, TS2, p. 37
- 42-
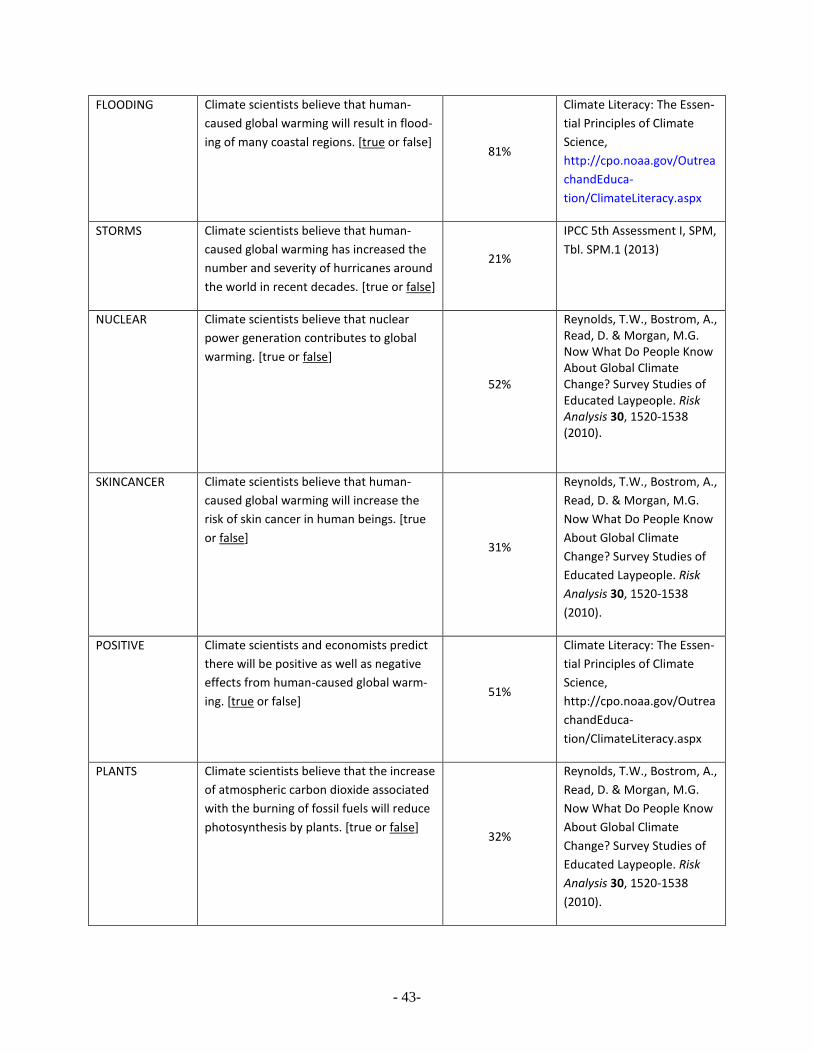
FLOODING Climate scientists believe that human-caused global warming will result in flood-ing of many coastal regions. [true or false]
81%
Climate Literacy: The Essen-tial Principles of Climate Science, http://cpo.noaa.gov/OutreachandEduca-tion/ClimateLiteracy.aspx
STORMS Climate scientists believe that human-caused global warming has increased the number and severity of hurricanes around the world in recent decades. [true or false]
21%
IPCC 5th Assessment I, SPM, Tbl. SPM.1 (2013)
NUCLEAR Climate scientists believe that nuclear power generation contributes to global warming. [true or false]
52%
Reynolds, T.W., Bostrom, A., Read, D. & Morgan, M.G. Now What Do People Know About Global Climate Change? Survey Studies of Educated Laypeople. Risk Analysis 30, 1520-1538 (2010).
SKINCANCER Climate scientists believe that human-caused global warming will increase the risk of skin cancer in human beings. [true or false]
31%
Reynolds, T.W., Bostrom, A., Read, D. & Morgan, M.G. Now What Do People Know About Global Climate Change? Survey Studies of Educated Laypeople. Risk Analysis 30, 1520-1538 (2010).
POSITIVE Climate scientists and economists predict there will be positive as well as negative effects from human-caused global warm-ing. [true or false]
51%
Climate Literacy: The Essen-tial Principles of Climate Science, http://cpo.noaa.gov/OutreachandEduca-tion/ClimateLiteracy.aspx
PLANTS Climate scientists believe that the increase of atmospheric carbon dioxide associated with the burning of fossil fuels will reduce photosynthesis by plants. [true or false]
32%
Reynolds, T.W., Bostrom, A., Read, D. & Morgan, M.G. Now What Do People Know About Global Climate Change? Survey Studies of Educated Laypeople. Risk Analysis 30, 1520-1538 (2010).
- 43-

CARBON What gas do most scientists believe caus-es temperatures in the atmosphere to rise? Is it [carbon dioxide, hydrogen, heli-um, radon] 75%
Pew, Public Knowledge of Science & Technology, http://www.people-press.org/files/legacy-questionnaires/04-22-13%20Science%20topline%20for%20release.pdf
- 44-
References
Anderegg, W.R., Prall, J.W., Harold, J. & Schneider, S.H. Expert credibility in climate change.Proceedings of the National Academy of Sciences 107, 12107-12109 (2010).
Baron, J. Thinking and deciding (Cambridge University Press, New York, 2008).
Baron, J. Why Teach Thinking? An Essay. Applied Psychology 42, 191-214 (1993).
Berinsky, A.J. & Druckman, J.N. The Polls—Review: Public Opinion Research and Support for the Iraq War. Public Opin Quart 71, 126-141 (2007).
Bishop, B.A. & Anderson, C.W. Student conceptions of natural selection and its role in evolution. Jour-nal of Research in Science Teaching 27, 415-427 (1990).
Bishop, G.F. The Illusion of Public Opinion : Fact and Artifact in American Public Opinion Polls(Rowman & Littlefield, Lanham, MD, 2005).
Buckland, P. "Resolved: Climate change is not a 'crisis'": Using cultural cognition research in high school ecology class. CCP Blog, available at http://www.culturalcognition.net/blog/2014/6/11/resolved-climate-change-is-not-a-crisis-using-cultural-cogni.html.
California Academy of Sciences. Anytime Lesson Plan: Global Climate Change and Sea Level Rise. (2014), available at http://www.calacademy.org/teachers/resources/lessons/global-climate-change-and-sea-level-rise/
Cook, J., Nuccitelli, D., Green, S.A., Richardson, M., Winkler, B., Painting, R., Way, R., Jacobs, P. & Skuce, A. Quantifying the consensus on anthropogenic global warming in the scientific litera-ture.Environmental Research Letters 8, 024024 (2013).
Corner, A., Whitmarsh, L. & Xenias, D. Uncertainty, scepticism and attitudes towards climate change: biased assimilation and attitude polarisation. Climatic Change 114, 463-478 (2012).
DeMars, C. Item response theory (Oxford University Press, Oxford ; New York, 2010).
Demastes, S.S., Settlage, J. & Good, R. Students' conceptions of natural selection and its role in evolu-tion: Cases of replication and comparison. Journal of Research in Science Teaching 32, 535-550 (1995).
DeVellis, R.F. Scale development : theory and applications (SAGE, Thousand Oaks, Calif., 2012).
Dewey, J. Science as Subject-matter and as Method. Science 31, 121-127 (1910).
Dohmen, T., et al. Individual risk attitudes: Measurement, determinants, and behavioral consequences. Journal of the European Economic Association 9, 522-550 (2011).
Doran, P.T. & Zimmerman, M.K. Examining the Scientific Consensus on Climate Change. Eos, Transac-tions American Geophysical Union 90, 22-23 (2009).
- 45-
Embretson, S.E. Measuring psychological constructs : advances in model-based approaches (American Psychological Association, Washington, DC, 2010).
Farnsworth, S.J. & Lichter, S.R. Scientific assessments of climate change information in news and enter-tainment media. Science Communication 34, 435-459 (2012).
Feynman, R.P. & Weinberg, S. Elementary particles and the laws of physics : the 1986 Dirac memorial lectures (Cambridge University Press, Cambridge ; New York, 1987).
Frederick, S. Cognitive Reflection and Decision Making. Journal of Economic Perspectives 19, 25-42 (2005).
Ganzach, Y., Ellis, S., Pazy, A. & Ricci-Siag, T. On the perception and operationalization of risk percep-tion. Judgment and Decision Making 3, 317-324 (2008).
Gliem, J.A. & Gliem, R.R. Calculating, interpreting, and reporting Cronbach’s alpha reliability coefficient for Likert-type scales. (Midwest Research-to-Practice Conference in Adult, Continuing, and Community Education, The Ohio State University, Columbus, OH, 2003). Available at https://scholarworks.iupui.edu/bitstream/handle/1805/344/Gliem+&+Gliem.pdf?sequence=1.
Hamilton, L.C. Education, politics and opinions about climate change evidence for interaction effects. Climatic Change 104, 231-242 (2011).
Hamilton, L.C., Cutler, M.J. & Schaefer, A. Public knowledge and concern about polar-region warming. Polar Geography 35, 155-168 (2012).
Haran, U., I., R. & Mellers, B.A. The role of actively open-minded thinking in information acquisition, accuracy and calibration. Judgment and Decision Making 8, 188-201 (2013).
IPCC. Climate Change 2013: The Physical Science Basis, Working Group I Contribution to the Fifth As-sessment Report of the Intergovernmental Panel on Climate Change (Cambridge University Press, Cambridge, England, 2013).
Kahan, D. Industrial Strength Risk Perception Measure. CCP Blog (Dec. 31, 2011). Available at http://www.culturalcognition.net/blog/2011/12/31/industrial-strength-risk-perception-measure.html
Kahan, D. Why we are poles apart on climate change. Nature 488, 255 (2012).
Kahan, D.M. A Risky Science Communication Environment for Vaccines. Science 342, 53-54 (2013a).
Kahan, D.M. Ideology, Motivated Reasoning, and Cognitive Reflection. Judgment and Decision Making 8, 407-424 (2013b).
Kahan, D.M., Braman, D., Gastil, J., Slovic, P. & Mertz, C.K. Culture and Identity-Protective Cognition: Explaining the White-Male Effect in Risk Perception. Journal of Empirical Legal Studies 4, 465-505 (2007).http://papers.ssrn.com/sol3/papers.cfm?abstract_id=995634
Kahan, D.M., Jenkins-Smith, H. & Braman, D. Cultural Cognition of Scientific Consensus. J. Risk Res. 14, 147-174 (2011).
- 46-
Kahan, D.M., Peters, E., Dawson, E. & Slovic, P. Motivated Numeracy and Englightened Self Govern-ment. Cultural Cognition Project Working Paper No. 116 (2013).
Kahan, D.M., Peters, E., Wittlin, M., Slovic, P., Ouellette, L.L., Braman, D. & Mandel, G. The polarizing impact of science literacy and numeracy on perceived climate change risks. Nature Climate Change 2, 732-735 (2012).
Kahneman, D. Maps of Bounded Rationality: Psychology for Behavioral Economics. Am Econ Rev 93, 1449-1475 (2003).
Kohut, A. Views on climate change: What the polls show. N.Y. Times A22 (June 13, 2010), available at http://www.nytimes.com/2010/06/14/opinion/l14climate.html?_r=0.
Lawson, A.E. & Worsnop, W.A. Learning about evolution and rejecting a belief in special creation: Ef-fects of reflective reasoning skill, prior knowledge, prior belief and religious commitment. Jour-nal of Research in Science Teaching 29, 143-166 (2006).
Lewandowsky, S., Gignac, G.E. & Vaughan, S. The pivotal role of perceived scientific consensus in ac-ceptance of science. Nature Climate Change 3, 399-404 (2012).
Lichter, S. Robert. Climate Scientists Agree on Warming, Disagree on Dangers, and Don't Trust the Me-dia's Coverage of Climate Change. Statistical Assessment Service, George Mason Universi-ty(2008).
Lipkus, I.M., Samsa, G. & Rimer, B.K. General Performance on a Numeracy Scale among Highly Edu-cated Samples. Medical Decision Making 21, 37-44 (2001).
Loewenstein, G.F., Weber, E.U., Hsee, C.K. & Welch, N. Risk as Feelings. Psychological Bulletin 127, 267-287 (2001).
Marx, S.M., Weber, E.U., Orlove, B.S., Leiserowitz, A., Krantz, D.H., Roncoli, C. & Phillips, J. Commu-nication and mental processes: Experiential and analytic processing of uncertain climate infor-mation. Global Environ Chang 17, 47-58 (2007).
Marx, S.M., Weber, E.U., Orlove, B.S., Leiserowitz, A., Krantz, D.H., Roncoli, C. & Phillips, J. Commu-nication and mental processes: Experiential and analytic processing of uncertain climate infor-mation. Global Environ Chang 17, 47-58 (2007).
McCright, A.M. & Dunlap, R.E. Bringing ideology in: the conservative white male effect on worry about environmental problems in the USA. J Risk Res, 1-16 (2012).
National Science Foundation. Science and Engineering Indicators (Wash. D.C. 2014).
National Science Foundation. Science and Engineering Inbdicators 2006 (Wash. D.C., 2006).
NOAA, Frequently Asked Questions about the Arctic (2014), http://www.arctic.noaa.gov/faq.html#15.
Oreskes, N. The scientific consensus on climate change. Science 306, 1686-1686 (2004).
- 47-
Osterlind, S.J. Constructing test items : multiple-choice, constructed-response, performance, and other formats (Kluwer Academic Publishers, Boston, 1998).
Osterlind, S.J., Everson, H.T. & Osterlind, S.J. Differential item functioning (SAGE, Thousand Oaks, Ca-lif., 2009).
Peters, E., Västfjäll, D., Slovic, P., Mertz, C.K., Mazzocco, K. & Dickert, S. Numeracy and Decision Making. Psychol Sci 17, 407-413 (2006).
Pew Research Center for the People & the Press. Public praises science; scientists fault public, media (Pew Research Center, Washington D.C., 2009).
Pew Research Center for the People & the Press. Public's Knowledge of Science and Technology (Pew Research Center, Washington D.C., 2013).
Powell, J. Why Climate Deniers Have No Scientific Credibility - In One Pie Chart. DESMOGBLOG.com (2012).
Roos, J.M. Measuring science or religion? A measurement analysis of the National Science Foundation sponsored science literacy scale 2006–2010. Public Understanding of Science (2012).
Shuman, H. Interpreting the Poll Results Better. Public Perspective 1, 87-88 (1998).
Silver, D. Most Americans say global warming is real, but opinions split on why. Pew Research Center (June 6, 2013), available at http://www.pewresearch.org/fact-tank/2013/06/06/most-americans-say-global-warming-is-real-but-opinions-split-on-why/.
Slovic, P., Finucane, M.L., Peters, E. & MacGregor, D.G. Risk as Analysis and Risk as Feelings: Some Thoughts About Affect, Reason, Risk, and Rationality. Risk Analysis 24, 311-322 (2004)..
Stanovich, K.E. Rationality and the reflective mind (Oxford University Press, New York, 2011).
Stanovich, K.E. What intelligence tests miss : the psychology of rational thought (Yale University Press, New Haven, 2009).
Strong, K. Polar Puzzle: Will Ice Melting at the North or South Poles Cause Sea Levels to Rise? Science Buddies, available at http://www.sciencebuddies.org/science-fair-projects/project_ideas/OceanSci_p015.shtml.
Survey Studies of Educated Laypeople. Risk Analysis 30, 1520-1538 (2010).
Tobler, C., Visschers, V.H.M. & Siegrist, M. Addressing climate change: Determinants of consumers' willingness to act and to support policy measures. Journal of Environmental Psychology 32, 197-207 (2012).
Univ. Queensland. Study shows scientists agree humans cause global-warming (2013). Available at http://www.uq.edu.au/news/article/2013/05/study-shows-scientists-agree-humans-cause-global-warming.
- 48-
Watson, W.E., Kumar, K. & Michaelsen, L.K. Cultural Diversity's Impact on Interaction Process and Per-formance: Comparing Homogeneous and Diverse Task Groups. The Academy of Management Journal 36, 590-602 (1993).
Watts, D.J. Everything is Obvious: Once You Know the Answer: How Common Sense Fails (Atlantic Books, 2011).
Weber, E. Experience-Based and Description-Based Perceptions of Long-Term Risk: Why Global Warm-ing does not Scare us (Yet). Climatic Change 77, 103-120 (2006).
Weber, E.U., Blais, A.-R. & Betz, N.E. A Domain-specific Risk-attitude Scale: Measuring Risk Percep-tions and Risk Behaviors. Journal of Behavioral Decision Making 15, 263-290 (2002)
Weller, J., Dieckmann, N.F., Tusler, M., Mertz, C.K., Burns, W., & Peters, E. Development and testing of an abbreviated numeracy scale: A Rasch Analysis approach Journal of Behavioral Decision Mak-ing (in press).
Zaller, J.R. The Nature and Origins of Mass Opinion (Cambridge Univ. Press, Cambridge, England, 1992).
- 49-