Chapter 5 Elasticity of Demand and Supply © 2009 South-Western/Cengage Learning.
24
Chapter 5 Elasticity of Demand and Supply © 2009 South-Western/Cengage Learning
-
date post
21-Dec-2015 -
Category
Documents
-
view
218 -
download
2
Transcript of Chapter 5 Elasticity of Demand and Supply © 2009 South-Western/Cengage Learning.

Chapter 5
Elasticity of
Demand and Supply
© 2009 South-Western/Cengage Learning
22
Price Elasticity of Demand
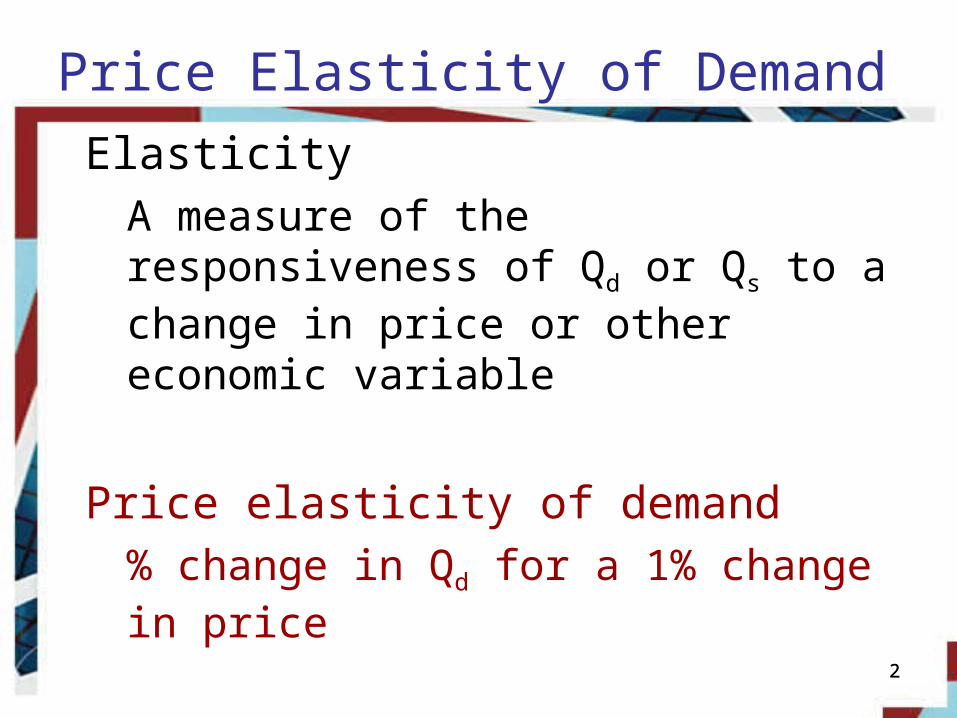
ElasticityA measure of the responsiveness of Qd or Qs to a change in price or other economic variable
Price elasticity of demand% change in Qd for a 1% change in price
Price Elasticity of Demand
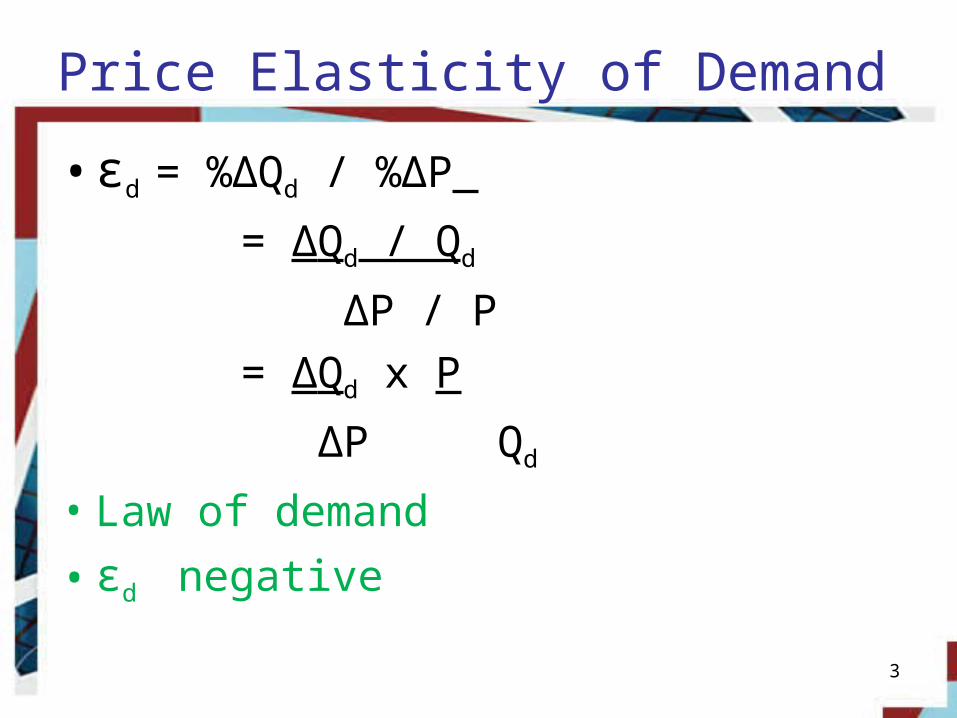
• εd = %ΔQd / %ΔP
= ΔQd / Qd
ΔP / P
= ΔQd x P
ΔP Qd
• Law of demand
• εd negative
3

Categories of Elasticities
|ε| between 0 and 1• Inelastic
|ε| greater than 1• Elastic
|ε| = 1• Unit elastic
|ε| = infinite• Perfectly elastic
|ε| = 0• Perfectly inelastic 4
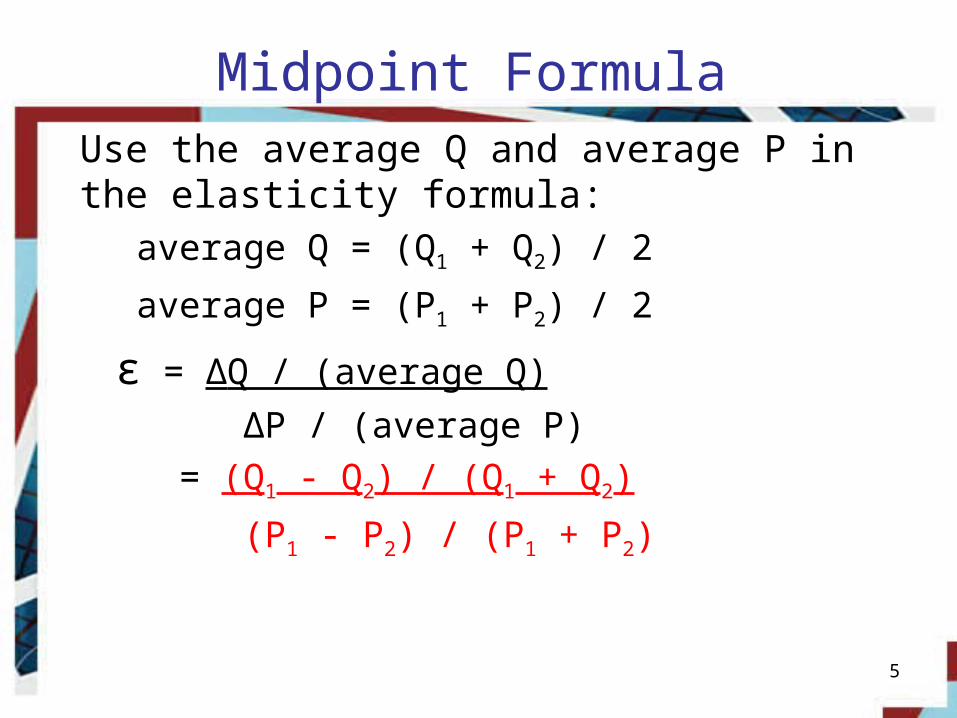
Midpoint FormulaUse the average Q and average P in the elasticity formula:
average Q = (Q1 + Q2) / 2
average P = (P1 + P2) / 2
ε = ΔQ / (average Q)
ΔP / (average P)
= (Q1 - Q2) / (Q1 + Q2)
(P1 - P2) / (P1 + P2)
5
Elasticity and Total Revenue
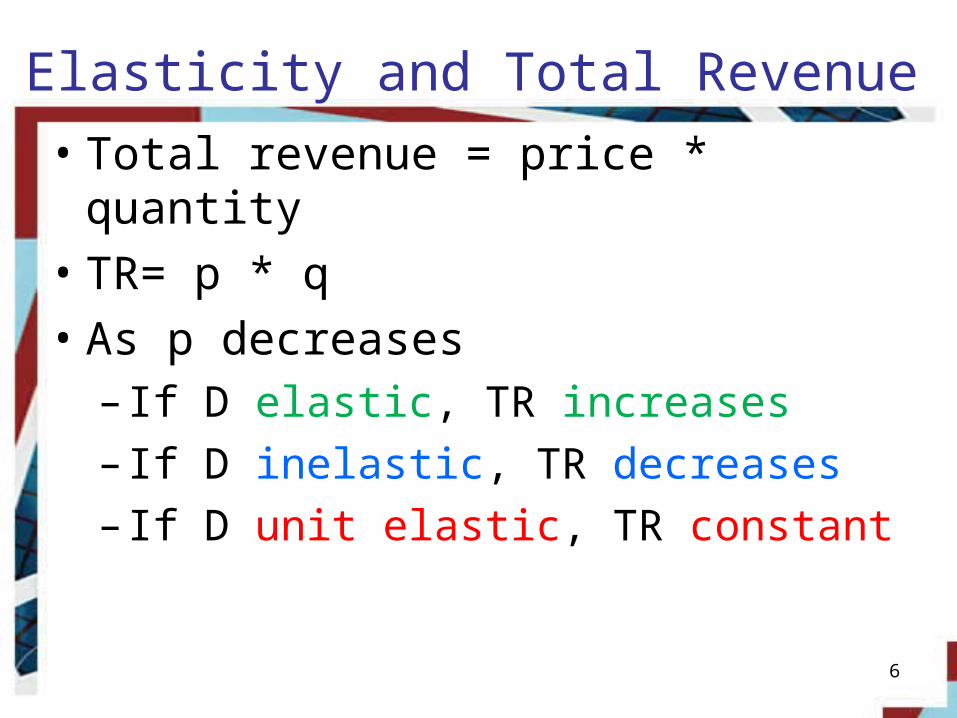
• Total revenue = price * quantity• TR= p * q• As p decreases
– If D elastic, TR increases
– If D inelastic, TR decreases
– If D unit elastic, TR constant
6
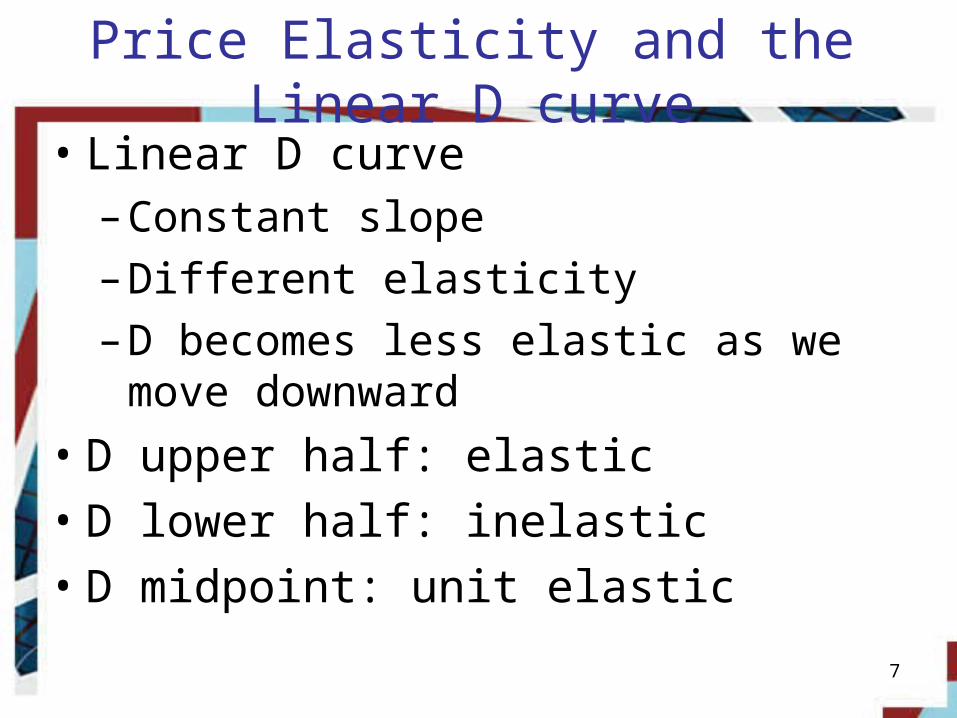
Price Elasticity and the Linear D curve
• Linear D curve– Constant slope
– Different elasticity
– D becomes less elastic as we move downward
• D upper half: elastic• D lower half: inelastic• D midpoint: unit elastic
7
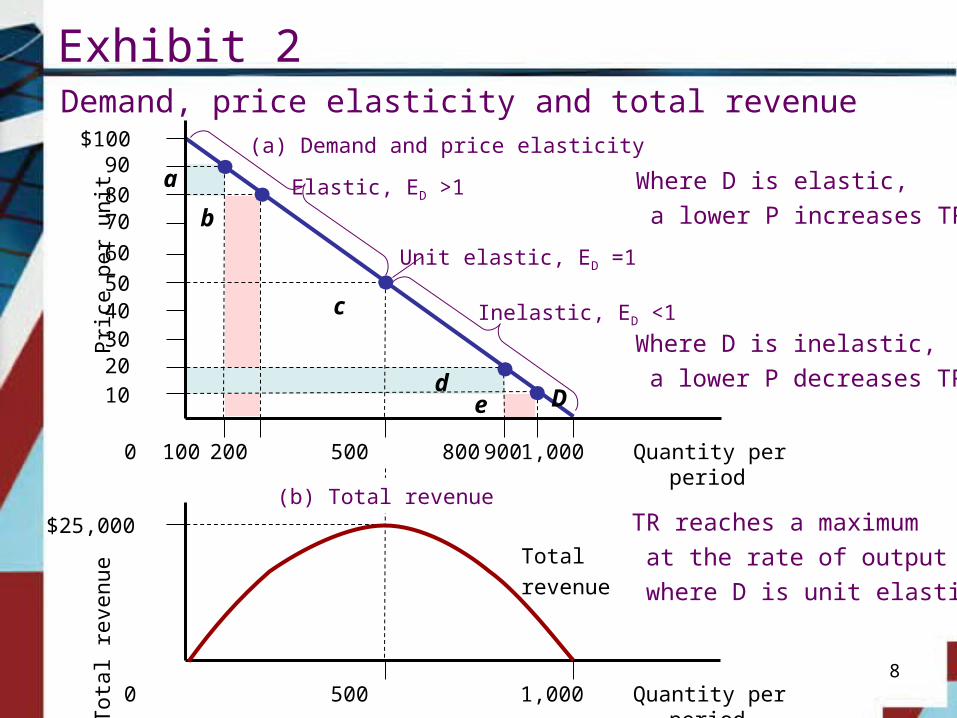
Exhibit 2Demand, price elasticity and total revenue
8
D
90
60
10
70
Pric
e pe
r un
it
$100
80
50403020
b
a
de
800500200100 Quantity per period1,000 0 900
Tot
al r
even
ue
$25,000
500 Quantity per period1,000 0
(a) Demand and price elasticity
(b) Total revenue
Total
revenue
Unit elastic, ED =1
Elastic, ED >1
Inelastic, ED <1
Where D is elastic,
a lower P increases TR
Where D is inelastic,
a lower P decreases TR
TR reaches a maximum
at the rate of output
where D is unit elastic
c
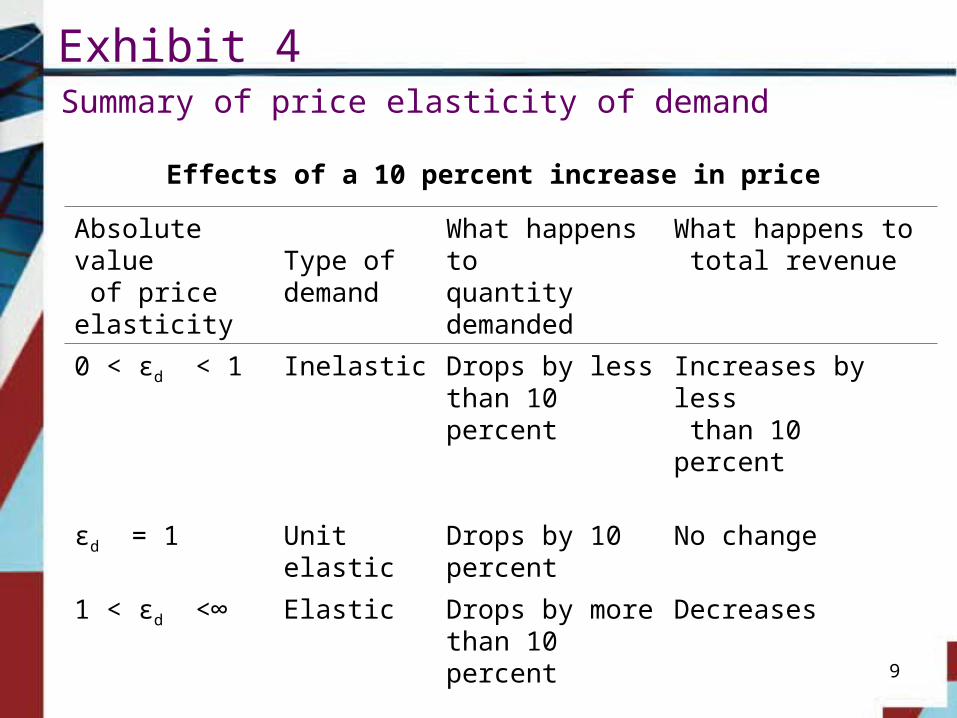
Exhibit 4Summary of price elasticity of demand
9
Effects of a 10 percent increase in price
Absolute value of price elasticity
Type of demand
What happens toquantity demanded
What happens to total revenue
0 < εd < 1 Inelastic Drops by less than 10 percent
Increases by less than 10 percent
εd = 1 Unit elastic Drops by 10 percent
No change
1 < εd <∞ Elastic Drops by more than 10 percent
Decreases

Determinants of Price Elasticity of D
• εd is greater:
– The greater the availability of substitutes, and the more similar the substitutes
– The more important the good as a share of the consumer’s budget
– The longer the period of adjustment (time)
10
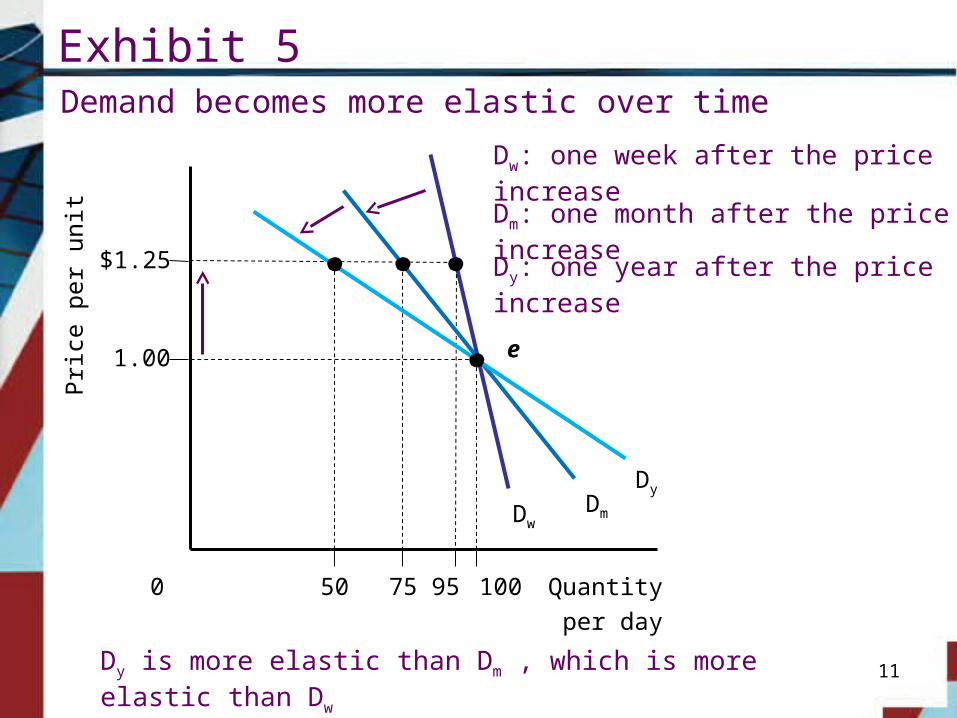
Exhibit 5Demand becomes more elastic over time
11
Dw
Pric
e pe
r un
it
$1.25
1.00
Dm
Quantity
per day
95 10075500
Dy
e
Dw: one week after the price increase
Dm: one month after the price increase
Dy: one year after the price increase
Dy is more elastic than Dm , which is more elastic than Dw
Elasticity Estimates
• Short run– Consumers have little time to adjust
• Long run– Consumers can fully adjust to a price
change
• Demand is more elastic in the long run
12
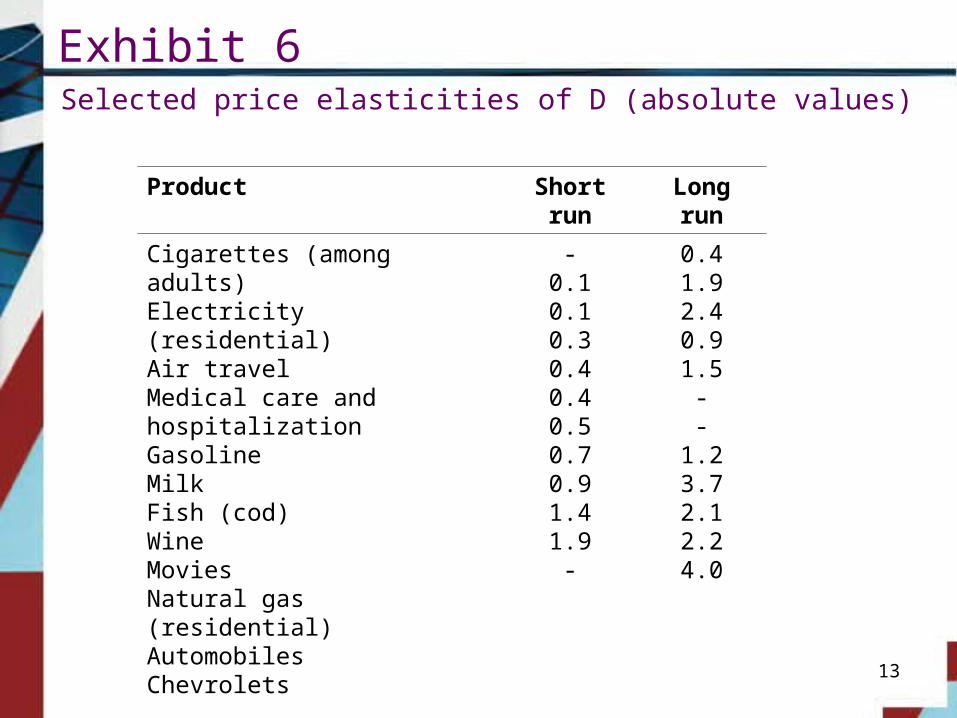
Exhibit 6Selected price elasticities of D (absolute values)
13
Product Short run Long run
Cigarettes (among adults)Electricity (residential)Air travelMedical care and hospitalizationGasolineMilkFish (cod)WineMoviesNatural gas (residential) AutomobilesChevrolets
-0.10.10.30.40.40.50.70.91.41.9-
0.41.92.40.91.5--
1.23.72.12.24.0
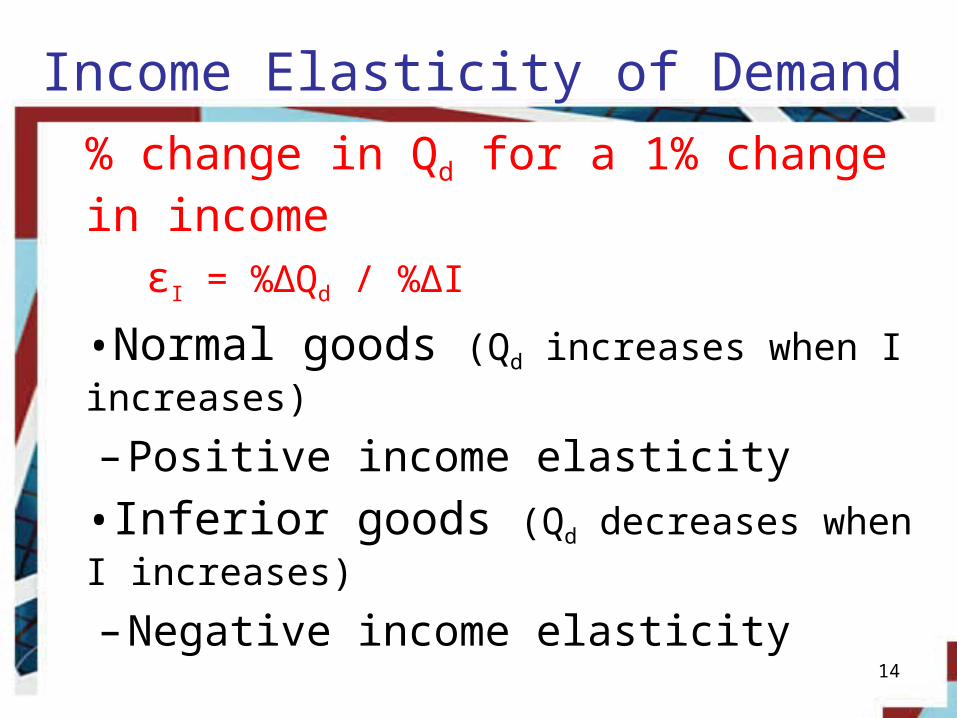
Income Elasticity of Demand
% change in Qd for a 1% change in income
εI = %ΔQd / %ΔI
•Normal goods (Qd increases when I increases)
– Positive income elasticity
•Inferior goods (Qd decreases when I increases)
– Negative income elasticity
14
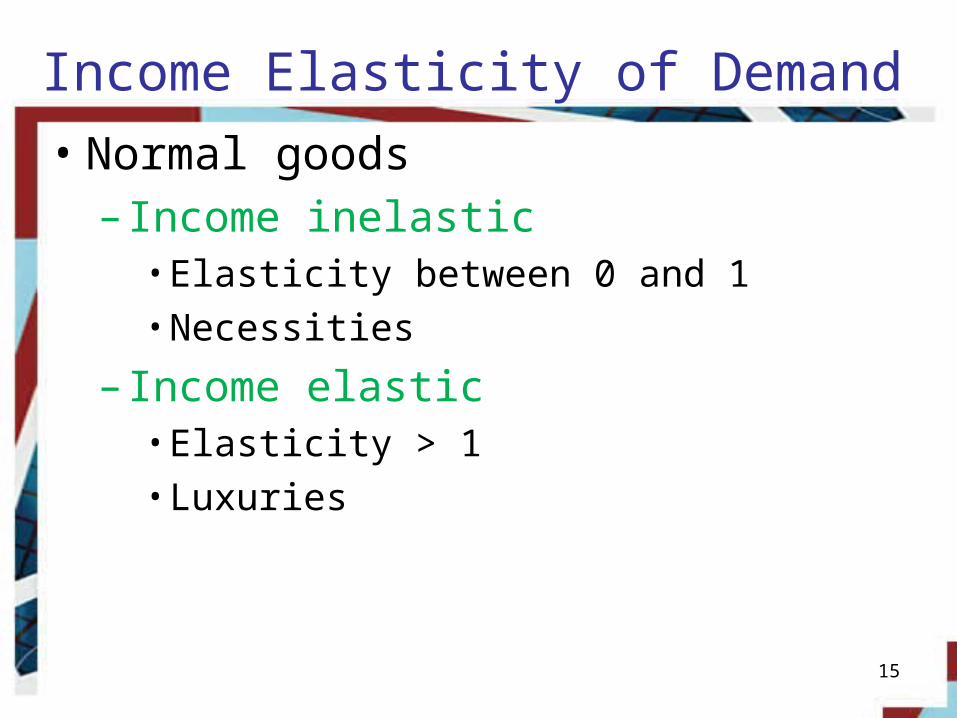
Income Elasticity of Demand
• Normal goods– Income inelastic
• Elasticity between 0 and 1• Necessities
– Income elastic• Elasticity > 1• Luxuries
15
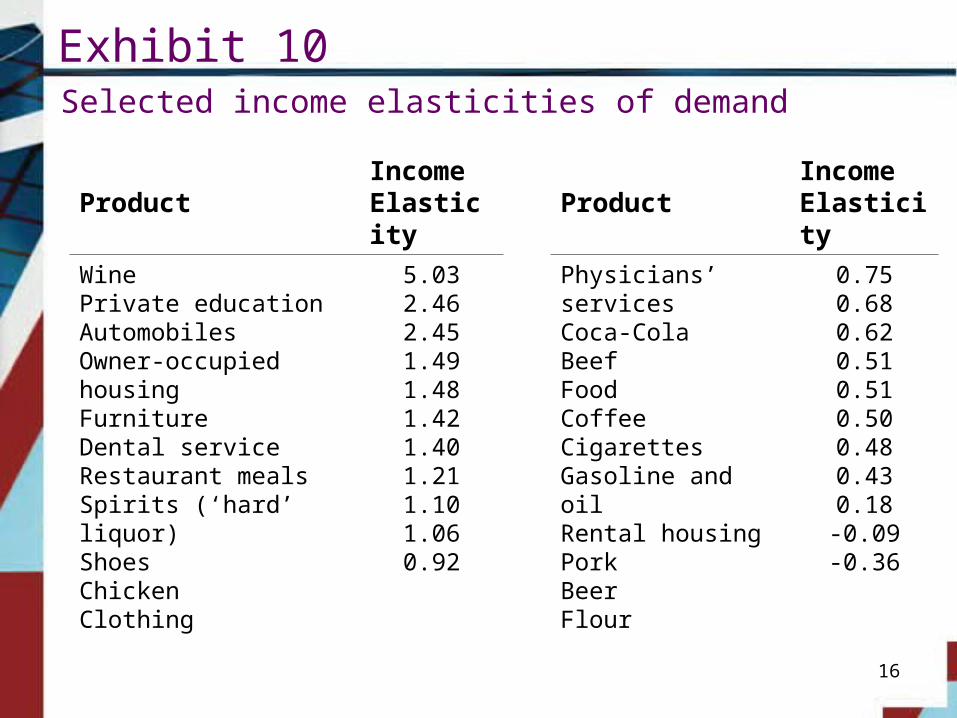
Exhibit 10Selected income elasticities of demand
16
ProductIncomeElasticity Product
IncomeElasticity
WinePrivate educationAutomobilesOwner-occupied housingFurnitureDental serviceRestaurant mealsSpirits (‘hard’ liquor)ShoesChickenClothing
5.032.462.451.491.481.421.401.211.101.060.92
Physicians’ servicesCoca-ColaBeefFoodCoffeeCigarettesGasoline and oilRental housingPorkBeerFlour
0.750.680.620.510.510.500.480.430.18-0.09-0.36
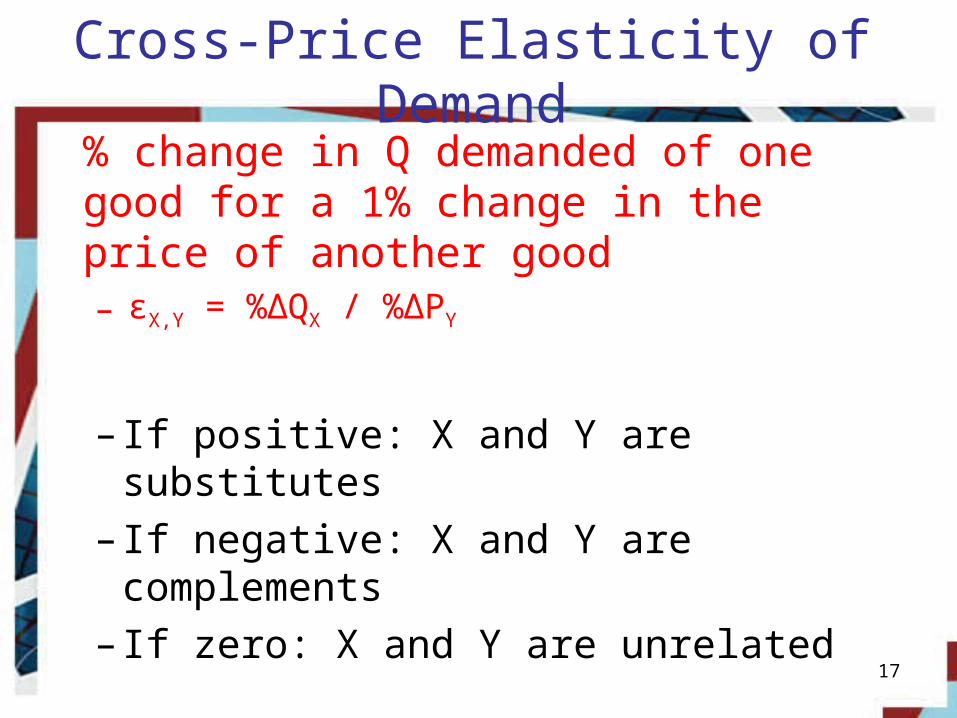
Cross-Price Elasticity of Demand
% change in Q demanded of one good for a 1% change in the price of another good– εX,Y = %ΔQX / %ΔPY
– If positive: X and Y are substitutes
– If negative: X and Y are complements
– If zero: X and Y are unrelated
17
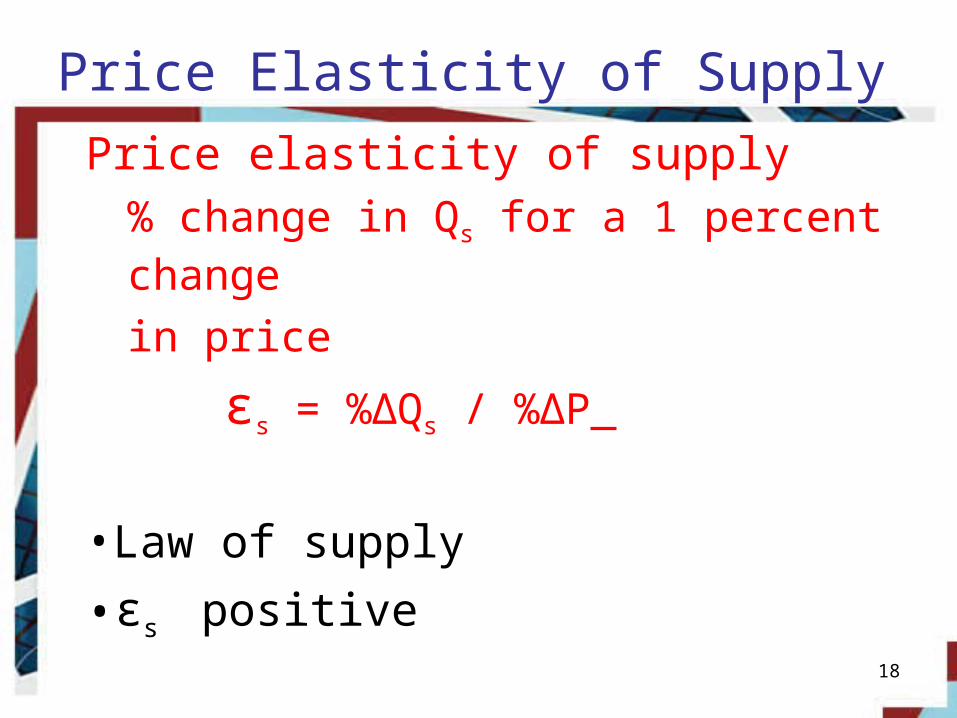
Price Elasticity of Supply
Price elasticity of supply% change in Qs for a 1 percent change
in price
εs = %ΔQs / %ΔP
•Law of supply
•εs positive
18
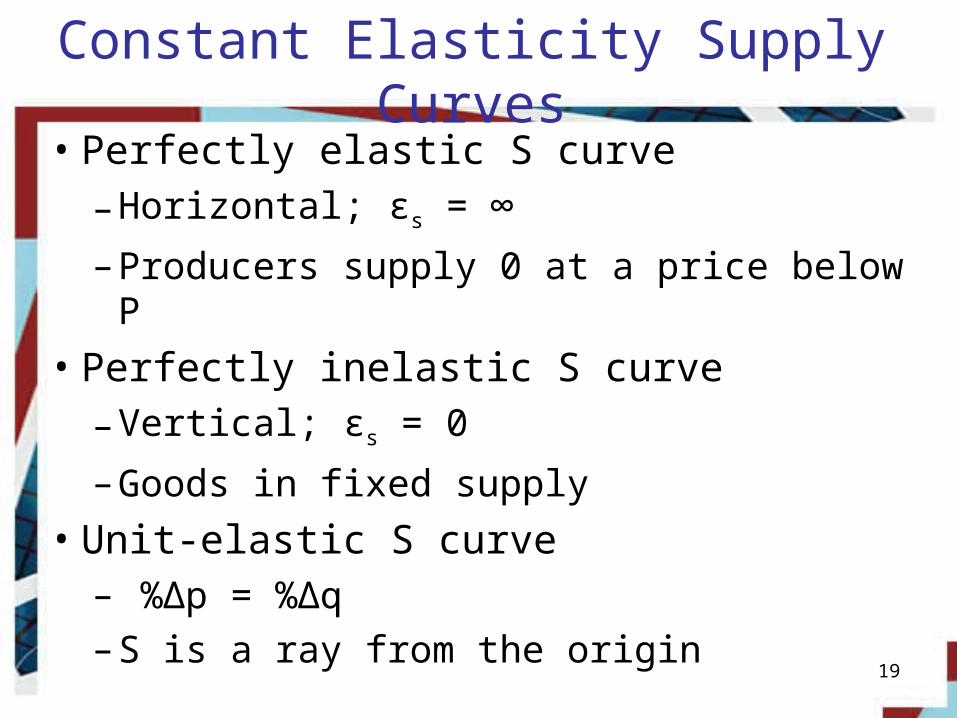
Constant Elasticity Supply Curves
• Perfectly elastic S curve
– Horizontal; εs = ∞
– Producers supply 0 at a price below P
• Perfectly inelastic S curve
– Vertical; εs = 0
– Goods in fixed supply
• Unit-elastic S curve– %∆p = %∆q – S is a ray from the origin 19

Determinants of Supply Elasticity
• εs is greater:
– cost and feasibility of storage
– production process
– the longer the period of adjustment (time)
20
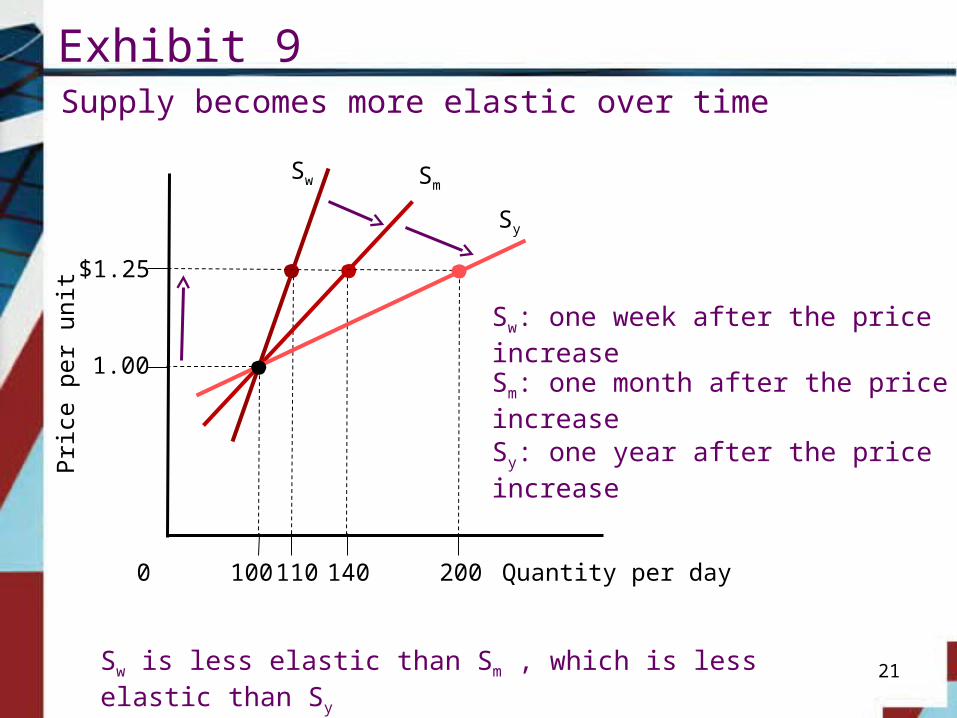
Exhibit 9Supply becomes more elastic over time
21
Sw
Pric
e pe
r un
it
1.00
$1.25
Quantity per day110 2000 100 140
Sm
Sy
Sw: one week after the price increase
Sm: one month after the price increase
Sy: one year after the price increase
Sw is less elastic than Sm , which is less elastic than Sy
Price Elasticity and Tax Incidence
• Tax– Decrease in S by the amount of tax
• S shifts upward by the tax
• Tax incidence– distribution of the tax burden
22
Price Elasticity and Tax Incidence
• The more price elastic the D:– The more tax producers pay
– The less tax consumers pay
• The more elastic the S:– The less tax producers pay
– The more tax consumers pay
23
Price Elasticity and Tax Incidence
• The issue of tax incidence depends on the relationship between εd and εs
If |εd| > εs
producers bear more of the burden of the tax
If |εd| < εs
consumers bear more of the burden of the tax
24