
CAVITATION ANALYSIS ON PROPELLER TURBINE …iaetsdjaras.org/gallery/36-358-jaras-december.pdf ·...
13
CAVITATION ANALYSIS ON PROPELLER TURBINE THROUGH CFD Vishal Shukla 1 , Md. Sarfaraz 2 , Deepak Sharma 3 1, 2, 3 Department of Mechanical Engineering, ITM GOI, Gwalior 1 [email protected], 2 [email protected], 3 [email protected] Abstract: In present study, the propeller turbine of rated capacity of 5 kW is simulated for the CFD analysis to investigate effect of the cavitation on the hydro turbine. Flow analysis of the Propeller turbine is carried out by using ‘Fluent’ module available in ‘ANSYS - 14’. The flow simulation was carried out in two different flow conditions namely under pure water flow condition and cavitation flow condition. The efficiency of the propeller turbine has been calculated in order to validate the CFD results and an attempt has been made to compare these results with the experimental results obtained in earlier study. It has been observed that efficiency has been reduced with the suction head. The affected zones of the runner blade were identified based on the present study. Keywords: ANSYS, Cavitation, CFD, Propeller turbine, Fluent. I. INTRODUCTION A. CAVITATION IN HYDRO TURBINES Reaction turbines basically Francis turbines and propeller/Kaplan turbines are suitable for medium and low head sites. The turbine shows declined performance after few years of operation, as they get damaged with the time. One of the important reasons is the erosive wear of the turbines due to cavitation phenomena. Reaction turbines, however are more prone to cavitation because of high specific speed especially Kaplan/Propeller turbines where a zone in the operating range is seriously affected by cavitation, considered as forbidden zone. Cavitation is a phenomenon which produces pitting on the surfaces of turbine parts because of the cavities formation. B. Mechanism of Cavitation’s Phenomena: if the pressure of the flow will become less than the vapour pressure of water then bubble formation will start at that point and when they will reach to high pressure region, then collapse and produce pitting action on the surface. Phases of cavitation erosion: (I) Onset of cavitation’s (incubation period). (II) Nucleation of bubbles in flowing liquid. (III) Growth and collapse of bubbles in some high pressure region. Fig.1: Erosion of material IAETSD JOURNAL FOR ADVANCED RESEARCH IN APPLIED SCIENCES VOLUME 4, ISSUE 7, DEC/2017 ISSN NO: 2394-8442 http://iaetsdjaras.org/ 248
Transcript of CAVITATION ANALYSIS ON PROPELLER TURBINE …iaetsdjaras.org/gallery/36-358-jaras-december.pdf ·...
CAVITATION ANALYSIS ON PROPELLER TURBINE
THROUGH CFD
Vishal Shukla1, Md. Sarfaraz2, Deepak Sharma3 1, 2, 3 Department of Mechanical Engineering, ITM GOI, Gwalior
1 [email protected], [email protected], [email protected]
Abstract: In present study, the propeller turbine of rated capacity of 5 kW is simulated for the CFD analysis to
investigate effect of the cavitation on the hydro turbine. Flow analysis of the Propeller turbine is carried out by using
‘Fluent’ module available in ‘ANSYS - 14’. The flow simulation was carried out in two different flow conditions namely
under pure water flow condition and cavitation flow condition. The efficiency of the propeller turbine has been calculated
in order to validate the CFD results and an attempt has been made to compare these results with the experimental results
obtained in earlier study. It has been observed that efficiency has been reduced with the suction head. The affected zones
of the runner blade were identified based on the present study.
Keywords: ANSYS, Cavitation, CFD, Propeller turbine, Fluent.
I. INTRODUCTION
A. CAVITATION IN HYDRO TURBINES
Reaction turbines basically Francis turbines and propeller/Kaplan turbines are suitable for medium and low head sites.
The turbine shows declined performance after few years of operation, as they get damaged with the time. One of the
important reasons is the erosive wear of the turbines due to cavitation phenomena. Reaction turbines, however are more
prone to cavitation because of high specific speed especially Kaplan/Propeller turbines where a zone in the operating
range is seriously affected by cavitation, considered as forbidden zone. Cavitation is a phenomenon which produces pitting
on the surfaces of turbine parts because of the cavities formation.
B. Mechanism of Cavitation’s
Phenomena: if the pressure of the flow will become less than the vapour pressure of water then bubble formation will
start at that point and when they will reach to high pressure region, then collapse and produce pitting action on the
surface.
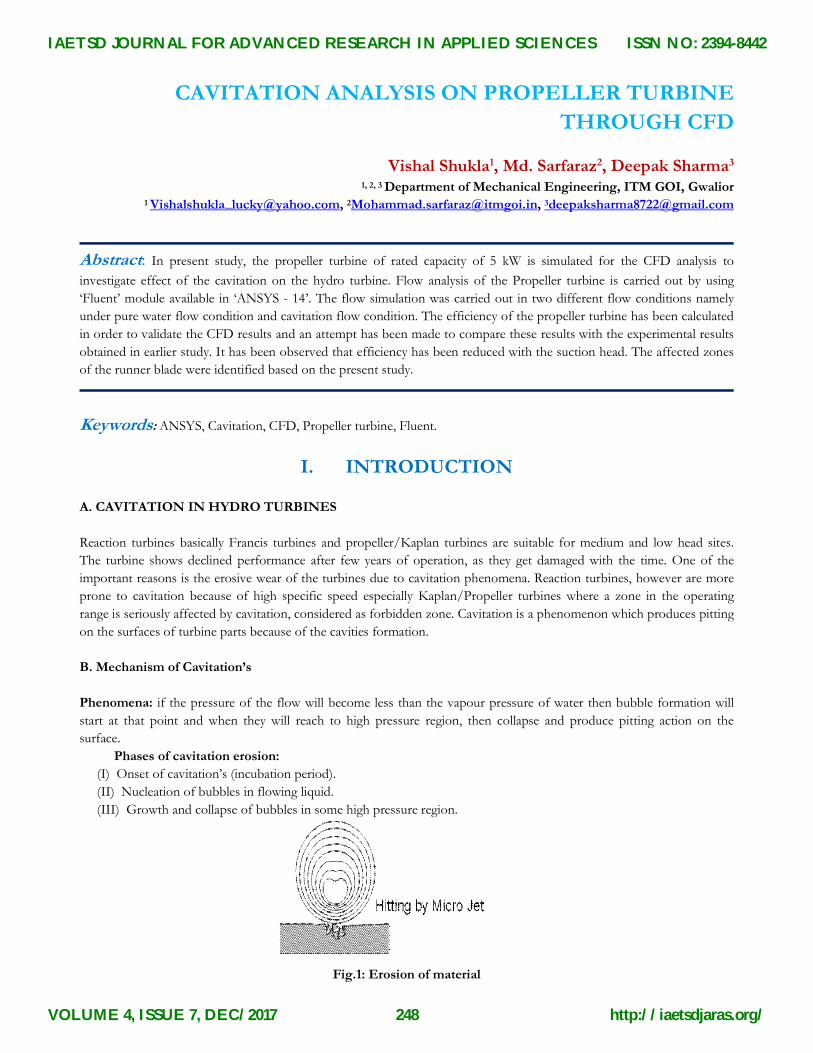
Phases of cavitation erosion:
(I) Onset of cavitation’s (incubation period).
(II) Nucleation of bubbles in flowing liquid.
(III) Growth and collapse of bubbles in some high pressure region.
Fig.1: Erosion of material
IAETSD JOURNAL FOR ADVANCED RESEARCH IN APPLIED SCIENCES
VOLUME 4, ISSUE 7, DEC/2017
ISSN NO: 2394-8442
http://iaetsdjaras.org/248
C. Cavitations Damage
Cavitations denote appearance and collapsing of bubbles in the region due to the pressure fluctuations. It occurs
mostly at the exit of runner in the vicinity of the moving blades and at the entry point of draft tube. It is considered as one
of the problem in hydro turbines as it change the flow pattern, drop in turbine efficiency, noise, and the most important
the erosion of solid surfaces.
During the flow when pressure drops below the vapour pressure, liquid fails to counter the tension forces and forms
the bubbles. When these bubbles reach to high pressure zone, the surrounding liquid wants to fill-up the cavity with very
high jet of velocity so result as the collapsing of the bubbles. Because of this, a high pressure shock wave has been
generated which deforms the material. Since, innumerable bubbles are collapsing, so deep pits are formed and surface
becomes spongy.
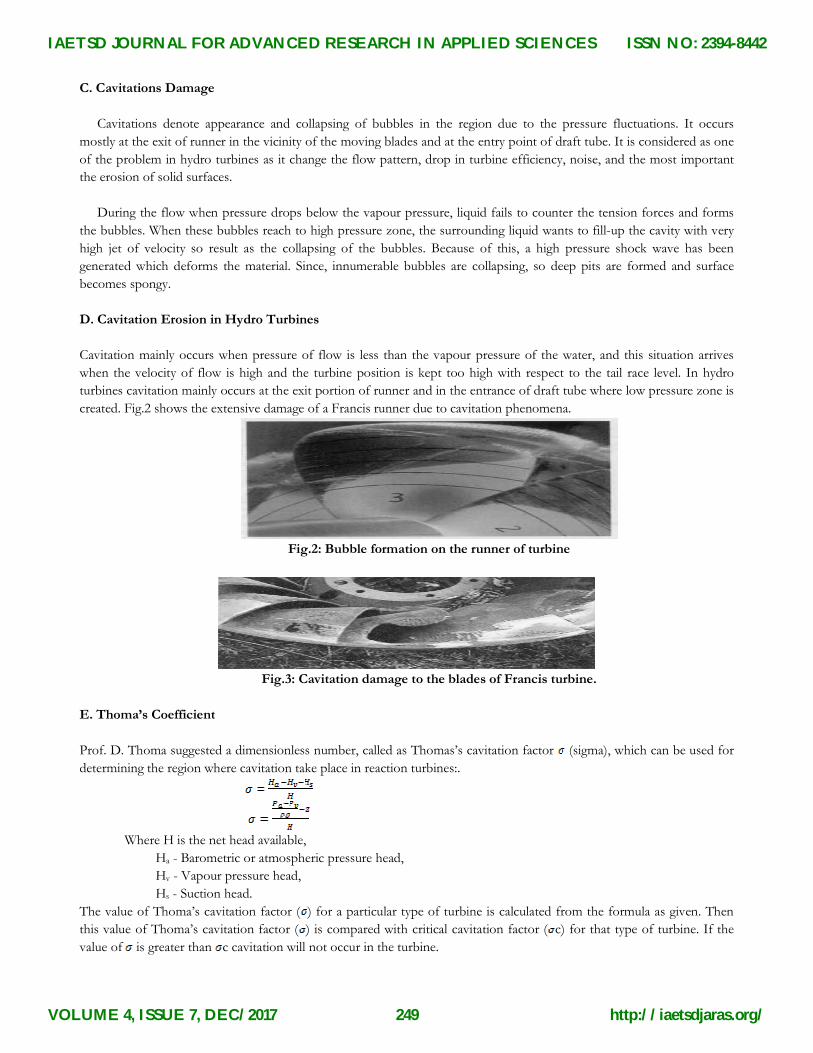
D. Cavitation Erosion in Hydro Turbines
Cavitation mainly occurs when pressure of flow is less than the vapour pressure of the water, and this situation arrives
when the velocity of flow is high and the turbine position is kept too high with respect to the tail race level. In hydro
turbines cavitation mainly occurs at the exit portion of runner and in the entrance of draft tube where low pressure zone is
created. Fig.2 shows the extensive damage of a Francis runner due to cavitation phenomena.
Fig.2: Bubble formation on the runner of turbine
Fig.3: Cavitation damage to the blades of Francis turbine.
E. Thoma’s Coefficient
Prof. D. Thoma suggested a dimensionless number, called as Thomas’s cavitation factor (sigma), which can be used for
determining the region where cavitation take place in reaction turbines:.
Where H is the net head available,
Ha - Barometric or atmospheric pressure head,
Hv - Vapour pressure head,
Hs - Suction head.
The value of Thoma’s cavitation factor ( ) for a particular type of turbine is calculated from the formula as given. Then
this value of Thoma’s cavitation factor ( ) is compared with critical cavitation factor ( c) for that type of turbine. If the
value of is greater than c cavitation will not occur in the turbine.
IAETSD JOURNAL FOR ADVANCED RESEARCH IN APPLIED SCIENCES
VOLUME 4, ISSUE 7, DEC/2017
ISSN NO: 2394-8442
http://iaetsdjaras.org/249
For safe operation (cavitation-free) of turbine, it is evident that.
> c
The value of c for different turbines can be calculated by the following relations which are given below.
For Francis turbines,
For propeller turbines,
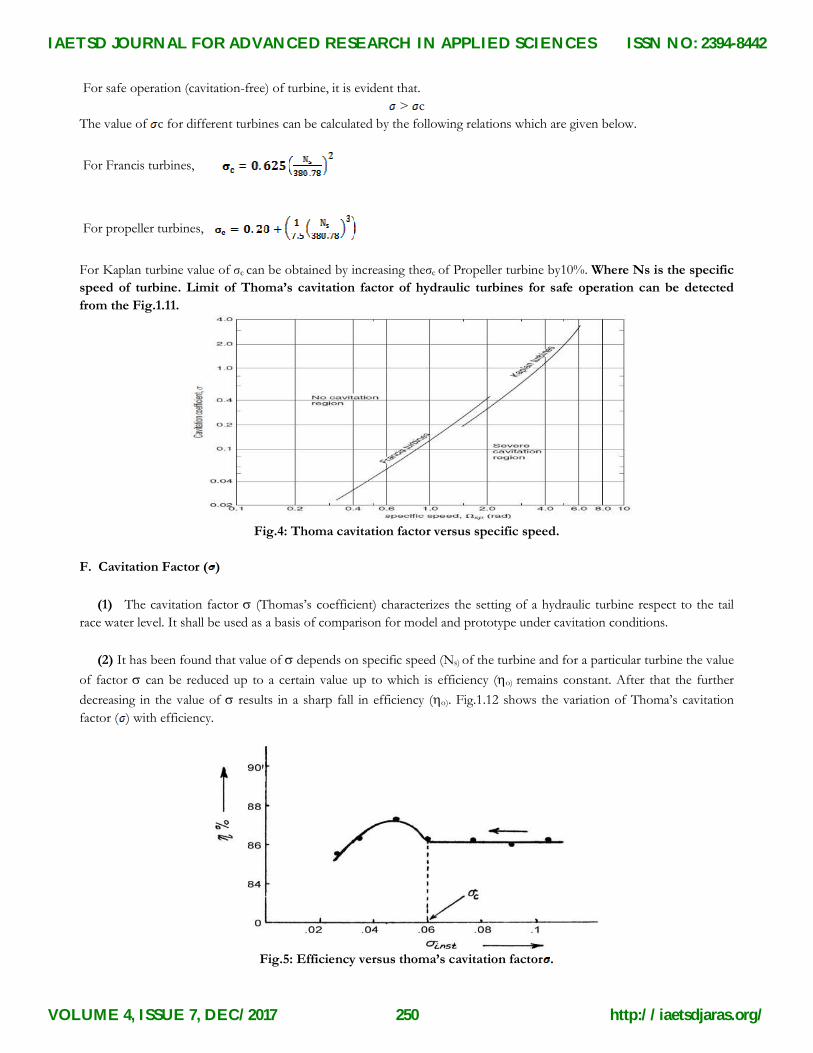
For Kaplan turbine value of σc can be obtained by increasing theσc of Propeller turbine by10%. Where Ns is the specific
speed of turbine. Limit of Thoma’s cavitation factor of hydraulic turbines for safe operation can be detected
from the Fig.1.11.
Fig.4: Thoma cavitation factor versus specific speed.
F. Cavitation Factor ( )
(1) The cavitation factor (Thomas’s coefficient) characterizes the setting of a hydraulic turbine respect to the tail
race water level. It shall be used as a basis of comparison for model and prototype under cavitation conditions.
(2) It has been found that value of depends on specific speed (Ns) of the turbine and for a particular turbine the value
of factor can be reduced up to a certain value up to which is efficiency (o) remains constant. After that the further
decreasing in the value of results in a sharp fall in efficiency (o). Fig.1.12 shows the variation of Thoma’s cavitation
factor ( ) with efficiency.
Fig.5: Efficiency versus thoma’s cavitation factor .
IAETSD JOURNAL FOR ADVANCED RESEARCH IN APPLIED SCIENCES
VOLUME 4, ISSUE 7, DEC/2017
ISSN NO: 2394-8442
http://iaetsdjaras.org/250
G. Factors Influencing the Cavitation
Factors that affect the cavitation in hydro turbine are as follows:
i. Specific speed of the turbine, Ns.
ii. Height of runner exit from the tailrace level.
iii. Absolute velocity of water at runner exit.
iv. Vapor pressure varies with change in temperature.
v. Absolute pressure of flow.
vi. Geometry and flow regime of liquid.
II. LITERATURE REVIEW
Kumar and Saini reviewed this field by studying the research of several investigators and discussed them extensively.
Based on literature survey various aspects related to cavitation in hydro turbines, various reasons for the declined
performance and efficiency of the hydro turbines and suitable remedial measures were discussed. Some of the investigators
reported that in spite of design changes in the turbine components and providing different materials and coatings to the
turbine blades, however the improvement in most cases is not quite significant. It is therefore; further experimental and
theoretical studies are required for studying the impact of cavitation in hydro turbine to determine impact of cavitation at
different values of parameters which was relate to the cavitation in hydro turbine. CFD based analysis of cavitation in
reaction turbines could be cost effective solution for an extensive analysis.
Vasile Cojocaru et al performed a study to investigate the cavitation in the coated surface. The thermal spraying of
wolfram carbide powder had been checked into martensitic stainless steel substrates in two laboratory samples. The
phenomena of cavitation had been investigated by the ultrasonic method. The coatings obtained by thermal spraying, used
with success for resistance against erosion, didn’t lead to acceptable results in case of cavitation. Aspects such as
insufficient adhesion of the deposited layer to the substrate and porosity determined unacceptable cavitation behaviour.
Peng Yu-cheng and Chen Xi-yang at first, an operating point had chosen for numerical analysis using the
Reynolds-Averaged Navier-Stokes (RANS) equations and results were in agreement with the characteristics curves.
Secondly, a tiny protrusion on the guide vane surface is considered and the problem is simplified to a 2-D problem to
study the local detailed flow near the guide vane surface. It is shown that there exists a region in which the static pressure
reaches a level below the vapour pressure of the water. With the results it can be said that the cavitation will occur only if
the guide vane surface is scraggly, such as with deciduous coat or tiny pits caused by silt cutting.
Marek Szkodo et al described the influence of chemical composition of the padding welds on the chromium steel
samples on their performance under cavitation phenomena. The composition of the padding welds assured their
austenidic or martensitic structure. The apparently processed on work pieces were subjected to cavitation impingement at
the rotating disc. Results indicated that creation of metastable austenitic structure reinforced with marten site exerts
positive effect on cavitation resistance of the material. From this point of view, the new experimental electrodes can be
efficiently used for repair of cavitation damages in hydraulic turbines.
B Zhu and H. Wang proposed an analytical method including a macroscopic cavitation model based on the
homogeneous flow theory and a microscopic cavitation model based on the bubble dynamic for the prediction of the
impact force caused by cavitation bubbles collapse in cavitation flows. They performed the cavitation flow simulation
using LES with a macroscopic cavitation model in normal pressure variation. It was deduced that the impact force on the
solid surface can be estimated by using the size distribution of the bubble and the pressure induced by collapsing of the
single bubble. The accumulative impact force caused by cavitation bubble collapse based on single bubble collapse was
predicted accurately comparing with the experimentally.
IAETSD JOURNAL FOR ADVANCED RESEARCH IN APPLIED SCIENCES
VOLUME 4, ISSUE 7, DEC/2017
ISSN NO: 2394-8442
http://iaetsdjaras.org/251
Carolyn M. Preece and John H. Brunton made a comparison between the response of several metals and alloys to
multiple liquid jet impact and their response to ultrasonically induced cavitation. For the single-phase metals and alloys,
namely aluminium, iron, AI-l%Cu, AI-l%Mg and Cu-30%Zn, the failure mechanism is the same for the two techniques.
However, there are significant differences For Al-4%Cu and Al-9%Mg. The former alloy fails in cavitation by the growth
of macroscopic fatigue-like striated pits, whereas under liquid impact the fracture appears more like Trans crystalline
cleavage. The differences in the Al-9%Mg alloy are even more dramatic: under cavitation the surface becomes covered
with macroscopic striated pits, whereas under liquid impact failure is inter crystalline.
Prasad et al emphasis that the conventional methods for turbine performance evaluation is its model testing which
becomes costly and time consuming for several design alternative in design optimization. Computational fluid dynamics
(CFD) has become a cost effective tool for predicting detailed flow information in space to enable the section of the best
design. In this paper, they compare the efficiency comes though experiment and CFD analysis with three different the
guide vane angles obtain the efficiency come approximately same.
Drtina and Sallberger investigate the use of CFD for predicting the flow in hydraulic turbine has brought further
substantial improvements in their design, and result is a more complete understanding of flow processes and their
influences on turbine performance. Detail of flow separation, loss source and distributions in components both design and
off-design as well as detecting low pressure level associated with the risk of cavitation are now amenable to analysis with
aid of CFD.
Wu et al studied the runner and guide vanes are optimized to the maximum extent and the stay vanes has been
modified with a possible minimum cost under the geometrical constraints of the machine. The performance of the design
has been verified by model tests, and exceeds required improvements. The highly successful combination of the CFD-
based design optimization with model testing has finally resulted in a new model which can provide about 23% increase in
power and over 3% upgrade in max.efficiency. The model provides the improved cavitation characteristic with extremely
smooth performance over a much wider range of operations compared to the existing design.
Thakker et al compared Computation Fluid Dynamics (CFD) analysis with Experimental analysis of 0.6 m
diameter of turbine used for wave energy power conversion. The 2D CFD result for 0.6m Impulse turbine with fixed
guide vanes were extrapolated to predict 3D performance and are giving similar trends as what we get from experimental
analysis, which is good sign.
Lipej investigates optimization methods for the design of axial flow turbine by using the CFD. This paper
describes the complete optimization procedure for the design of axial runners. The procedure consists of a design
program, numerical flow analysis and a multi objective genetic algorithm. The benefits of this approach in terms of
reduced design time are very important. Without the optimization method such a design procedure can take a few weeks,
but using the proposed method the time can be reduced to a few days. The results of the optimization procedure help
show how each design parameter influences the energetic and cavitation characteristics of axial runners. Using the genetic
algorithm in combination with three dimensional numerical flow analyses was found to be useful for the design of
hydraulic machines, because the initial geometry from the design program has a relatively high level of efficiency.
Viscanti et al studied Fluid dynamics optimization of new blade profiles and meridional channel is achieved using
CFD. A trial and error approach is used to modify geometric shapes in order to increase blade efficiency and to reduce
cavitation phenomena in the new runner. The most regular trend and the higher values for relative efficiency remark how
CFD is a powerful tool to improve fluid dynamics in Francis runners. Optimization required a lot of CFD runs but it
helps to understand the very complicated 3D flow field inside the Francis turbine and to detect improvement areas in
future runner designs.
IAETSD JOURNAL FOR ADVANCED RESEARCH IN APPLIED SCIENCES
VOLUME 4, ISSUE 7, DEC/2017
ISSN NO: 2394-8442
http://iaetsdjaras.org/252
Liu et al evaluated hydraulic performances of a prototype Kaplan turbine having a runner dia of 8 m, which has
been predicted by using the steady turbulent flow analysis with standard k-s turbulence model for the entire flow passage.
They find Prediction of the performances is robustly conducted by the computational method, where the working head is
used as the given condition.
Kim et al investigated the influenced of pressure, tangential, axial velocity distributions on turbine performance by
using commercial CFD codes. In order to acquire basic design data of tubular type hydro turbine, output power, head, and
efficiency characteristics due to the guide vane opening angle are examined in detail. After CFD analysis they found the
influence of passageway on the velocity distributions is negligible and the tangential velocity component has its maximum
value at runner vane inlet region, on the contrary, axial velocity component has its maximum value at runner vane exit.
Prasad et al studied 3D simulation for flow in mixed flow (Francis) turbine passage using CFD software ANSYS
CFX 10 software for study of flow pattern within turbine space and computation of various losses and efficiency at
different operating regimes. They found computed efficiency values at maximum efficiency regimes for three guide vane
openings are close to that of experimental values and hence validate CFD analysis in turbine flow passage. The efficiency
characteristics from CFD simulations are very similar to that obtained in experimental testing of Francis turbine models.
Carija and Mrsa simulated the steady fluid flow with moving reference frame in the entire Francis turbine
consisting of the stay vanes, 24 guide vanes and 16 runner blades. Calculation was performed using commercial fluid flow
solver FLUENT on a Linux cluster.
III. OBJECTIVE OF PRESENT STUDY
High specific speed turbines are more prone to cavitation, it is therefore there is a need to investigate the cavitation
on axial flow turbine. It is proposed to carryout CFD based analysis for cavitation on Propeller turbine.
The following objectives are proposed;
i. To design a propeller runner for the given data.
ii. To make 3-model of turbine in the Pro-E software.
iii. To investigate the effect of cavitation under different conditions.
iv. To investigate the efficiency under cavitation.
In the present study, the propeller turbine with casing for micro hydro range has been designed. A propeller turbine
having rated head and discharge of 4.2 m and 0.121m3/s respectively is considered for the present study.
IV. METHODOLOGY
The present work has been followed the certain methodology which provided the optimum approach to finish the work.
For CFD analysis of hydro turbine first step to generate CAD model which has been done be PRO-E software, this stage is
pre-processor stage for the simulation. Second step to assemble the parts and generate the meshing of different turbine
components with the help of ANSYS software, which is also a pre processer stage for simulation. Third step is solving the
equation with help of boundary condition and initial condition with the help of FLUENT software, this stage is called
solver stage. Final step is the analysis of result. The methodology shown in Fig.6.
IAETSD JOURNAL FOR ADVANCED RESEARCH IN APPLIED SCIENCES
VOLUME 4, ISSUE 7, DEC/2017
ISSN NO: 2394-8442
http://iaetsdjaras.org/253
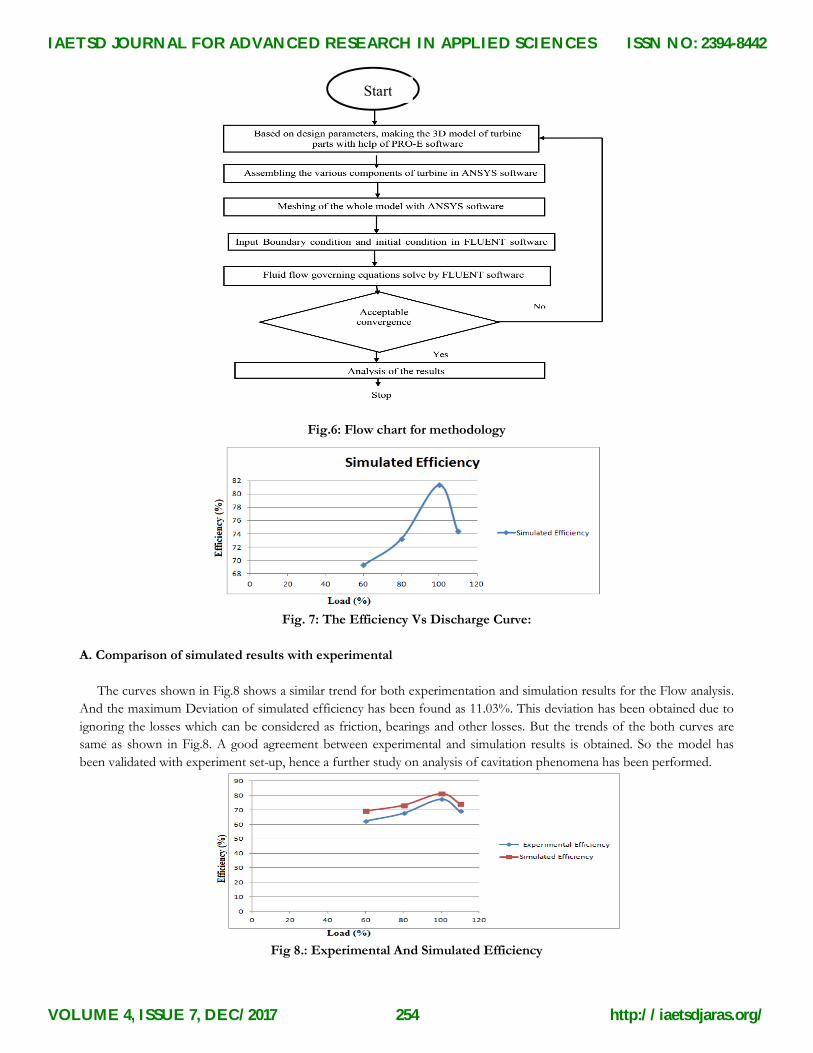
Fig.6: Flow chart for methodology
Fig. 7: The Efficiency Vs Discharge Curve:
A. Comparison of simulated results with experimental
The curves shown in Fig.8 shows a similar trend for both experimentation and simulation results for the Flow analysis.
And the maximum Deviation of simulated efficiency has been found as 11.03%. This deviation has been obtained due to
ignoring the losses which can be considered as friction, bearings and other losses. But the trends of the both curves are
same as shown in Fig.8. A good agreement between experimental and simulation results is obtained. So the model has
been validated with experiment set-up, hence a further study on analysis of cavitation phenomena has been performed.
Fig 8.: Experimental And Simulated Efficiency
Start
IAETSD JOURNAL FOR ADVANCED RESEARCH IN APPLIED SCIENCES
VOLUME 4, ISSUE 7, DEC/2017
ISSN NO: 2394-8442
http://iaetsdjaras.org/254
B. CAVITATION FLOW CONDITIONS-
It consists of the simulation of propeller turbine for cavitation flow. Cavitation flow condition was generated using
Schnerr-Sauer cavitation model present in FLUENT. Input and output parameters are as mentioned in Table 1.
when suction head 0.46 meter-
=
= 2.26
For propeller turbines,
= 1.95
As here value of is greater than c ( > c) so cavitation will not occur at this suction head in the turbine. So check
further whether cavitation will occur or not, by increasing the suction head.
when suction head 0.61meter-
=
= 1.94
For propeller turbines,
As here value of c is greater than ( c > ) so cavitation phenomena will initiate when suction head reached up to the
height of 0.61m of draft tube.
C. Efficiency under Cavitation with Suction Head-0.61 m:
Table 1: Input and output parameters in cavitation flow condition.
S. No. Parameter Value
Input parameters
1 Mass Flow Rate 121 Kg/s
2 Rotational Speed 1500 rpm
3 Pressure – Outlet 490 Pa
Output Parameters
1 Pressure – Inlet Pa
2 Torque, T N-m
Torque Components
2.1 Tx 64.27 N-m
2.2 Ty 215.21 N-m
2.3 Tz 76.92N-m
IAETSD JOURNAL FOR ADVANCED RESEARCH IN APPLIED SCIENCES
VOLUME 4, ISSUE 7, DEC/2017
ISSN NO: 2394-8442
http://iaetsdjaras.org/255
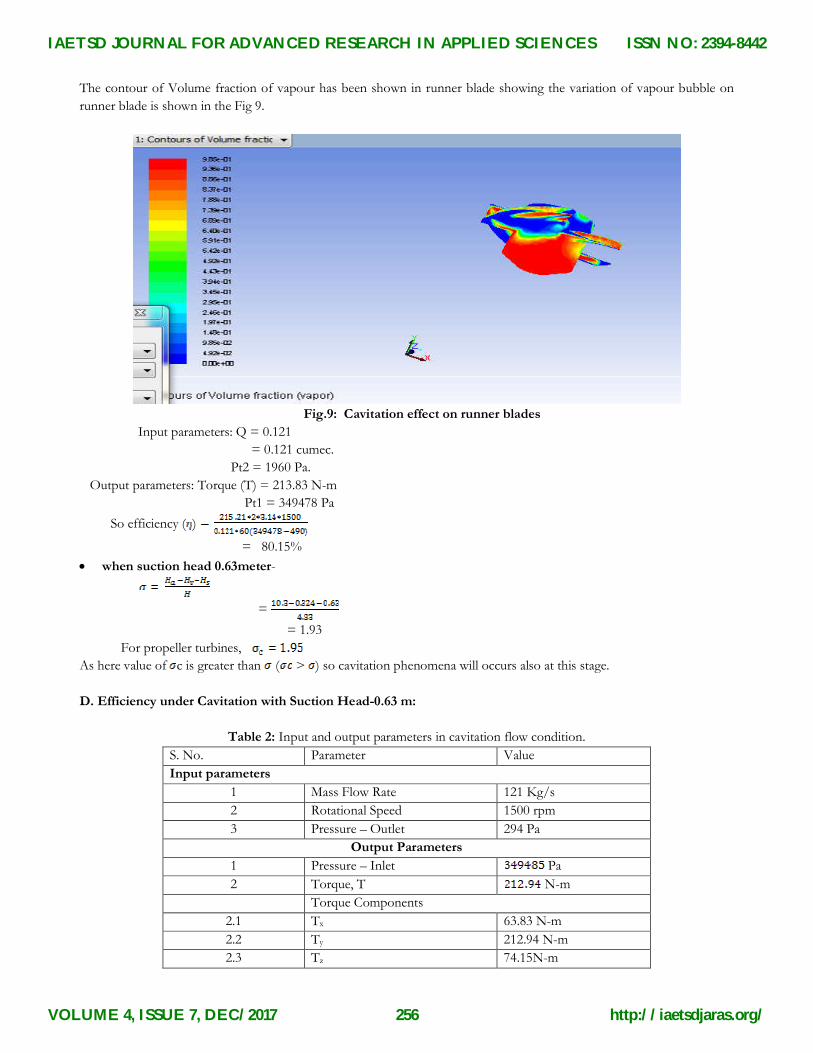
The contour of Volume fraction of vapour has been shown in runner blade showing the variation of vapour bubble on
runner blade is shown in the Fig 9.
Fig.9: Cavitation effect on runner blades
Input parameters: Q = 0.121
= 0.121 cumec.
Pt2 = 1960 Pa.
Output parameters: Torque (T) = 213.83 N-m
Pt1 = 349478 Pa
So efficiency ( )
= 80.15%
when suction head 0.63meter-
=
= 1.93
For propeller turbines,
As here value of c is greater than ( > ) so cavitation phenomena will occurs also at this stage.
D. Efficiency under Cavitation with Suction Head-0.63 m:
Table 2: Input and output parameters in cavitation flow condition.
S. No. Parameter Value
Input parameters
1 Mass Flow Rate 121 Kg/s
2 Rotational Speed 1500 rpm
3 Pressure – Outlet 294 Pa
Output Parameters
1 Pressure – Inlet Pa
2 Torque, T N-m
Torque Components
2.1 Tx 63.83 N-m
2.2 Ty 212.94 N-m
2.3 Tz 74.15N-m
IAETSD JOURNAL FOR ADVANCED RESEARCH IN APPLIED SCIENCES
VOLUME 4, ISSUE 7, DEC/2017
ISSN NO: 2394-8442
http://iaetsdjaras.org/256
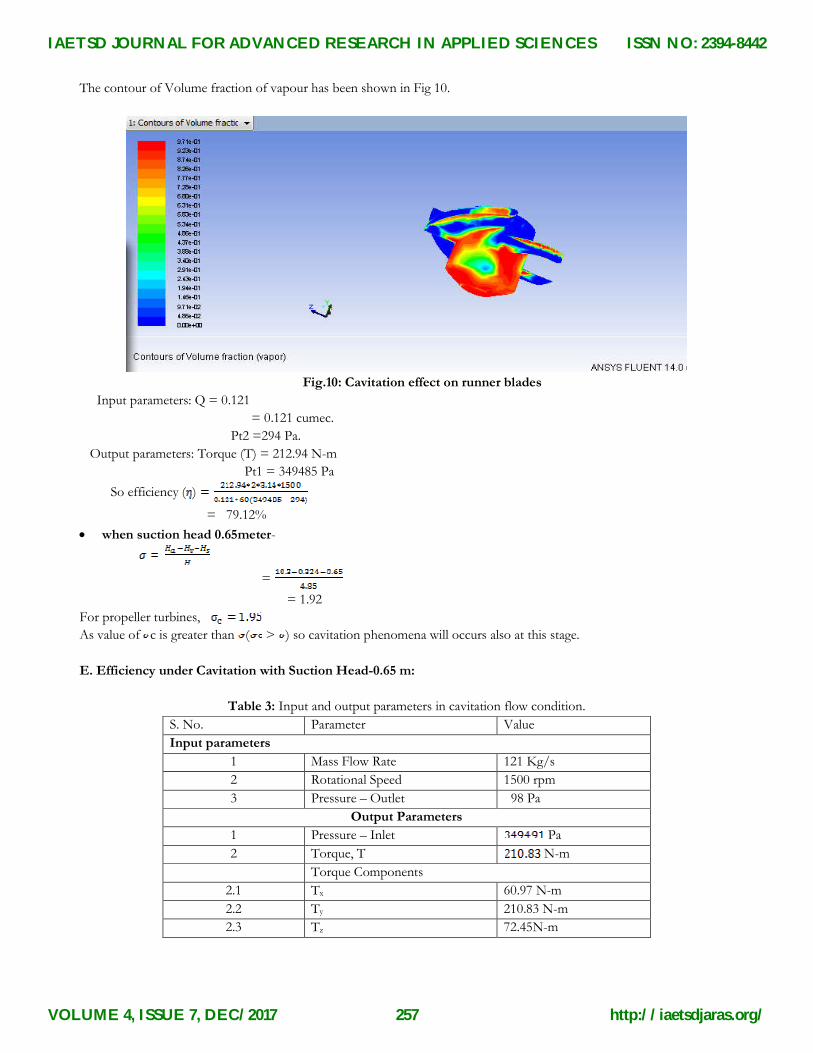
The contour of Volume fraction of vapour has been shown in Fig 10.
Fig.10: Cavitation effect on runner blades
Input parameters: Q = 0.121
= 0.121 cumec.
Pt2 =294 Pa.
Output parameters: Torque (T) = 212.94 N-m
Pt1 = 349485 Pa
So efficiency ( )
= 79.12%
when suction head 0.65meter-
=
= 1.92
For propeller turbines,
As value of c is greater than ( > ) so cavitation phenomena will occurs also at this stage.
E. Efficiency under Cavitation with Suction Head-0.65 m:
Table 3: Input and output parameters in cavitation flow condition.
S. No. Parameter Value
Input parameters
1 Mass Flow Rate 121 Kg/s
2 Rotational Speed 1500 rpm
3 Pressure – Outlet 98 Pa
Output Parameters
1 Pressure – Inlet Pa
2 Torque, T N-m
Torque Components
2.1 Tx 60.97 N-m
2.2 Ty 210.83 N-m
2.3 Tz 72.45N-m
IAETSD JOURNAL FOR ADVANCED RESEARCH IN APPLIED SCIENCES
VOLUME 4, ISSUE 7, DEC/2017
ISSN NO: 2394-8442
http://iaetsdjaras.org/257
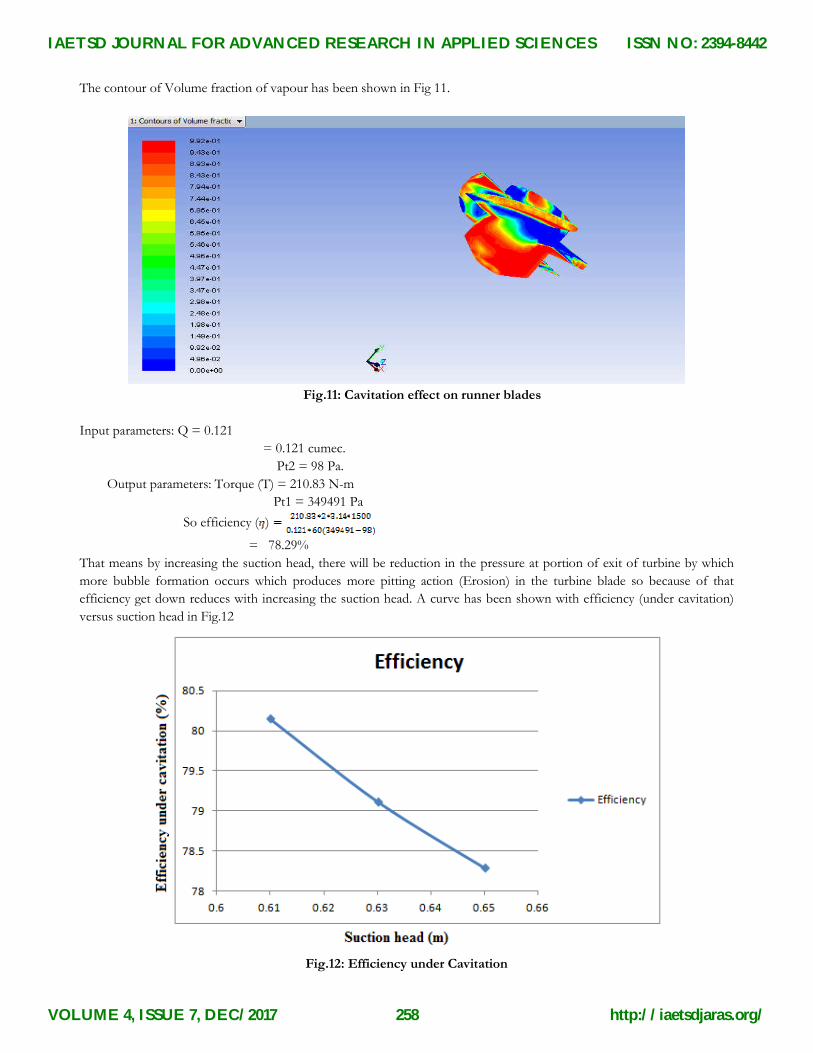
The contour of Volume fraction of vapour has been shown in Fig 11.
Fig.11: Cavitation effect on runner blades
Input parameters: Q = 0.121
= 0.121 cumec.
Pt2 = 98 Pa.
Output parameters: Torque (T) = 210.83 N-m
Pt1 = 349491 Pa
So efficiency ( )
= 78.29%
That means by increasing the suction head, there will be reduction in the pressure at portion of exit of turbine by which
more bubble formation occurs which produces more pitting action (Erosion) in the turbine blade so because of that
efficiency get down reduces with increasing the suction head. A curve has been shown with efficiency (under cavitation)
versus suction head in Fig.12
Fig.12: Efficiency under Cavitation
IAETSD JOURNAL FOR ADVANCED RESEARCH IN APPLIED SCIENCES
VOLUME 4, ISSUE 7, DEC/2017
ISSN NO: 2394-8442
http://iaetsdjaras.org/258
V.CONCLUSIONS
In the present study, analysis of flow through propeller turbine has been carried out to investigate the effect of cavitation,
using ‘ANSYS’ CFD package. The rated capacity of the turbine is 5 KW at 4.2m head and 0.121 cumecs discharge has
been considered. The 3-D model of turbine has been generated in Pro-E Software with proper sizing and then meshed
model was created using ‘ANSYS’ Software. Simulation has been carried out for different flow conditions, in order to
determine the turbine efficiency without cavitation. Based on the studies following conclusions are drawn.
Pure water flow was carried and k-epsilon turbulence model was employed. The maximum efficiency of the turbine
was found out as 81.33% with 100% discharge. High pressure zone has been observed at the inlet of the runner blade
For the different flow condition, the different values of efficiency have been obtained as 74.36%, 81.33%, 73.22% and
69.28% at different discharge of 110%, 100%, 80% and 60% respectively. .
It has been observed that by increasing the suction head, the value of thoma’s coefficient factor is going to decrease
but after certain limit, there will be sharp reduction of efficiency due to effect of cavitation.
The maximum efficiency under effect of cavitation has been found as 78.29% with the 0.65 metre of suction head
which are within the range of 2-3%.
REFERENCES
1. Kumar P., Saini R P, “Study of cavitation in hydro turbines-A review”, Renewable and Sustainable Energy Reviews, Vol. 14, pp.
374-383, 2009
2. Matevz D., Aljaz O., “Pit clustering in cavitation erosion”, Wear 265 (2008),pp. 811-820.
3. Dixon S. L. and Hall C. A., “Fluid Mechanics and Thermodynamics of Turbomachinery”, Sixth Edition, 2010, pp. 330-333
4. Bansal R.K. “Fluid Mechanics and Hydraulic Machines”; 1998. p. 839–41.
5. Jain AK. “Fluid Mechanics and Hydraulic Machines”; 2002. p. 835–6.
6. Avellan F, “Introduction to Cavitation in Hydraulic Machinery”, The 6th International Conference on Hydraulic Machinery and
Hydrodynamics Timisoara, Romania (2004), pp. 11-22.
7. Pande V K, “Effect of hydraulic design of Pelton turbines on damage due to silt erosion and its reduction”. Powerpoint presentation,
BHEL.
8. Kumar Pardeep, Saini R P, “Study of cavitation in hydro turbines-A review”, Renewable and Sustainable Energy Reviews, Vol. 14,
pp. 374-383, 2009
9. Cojocaru Vasile, Verde Doina Frunza, Campian Constantin Viorel, Marginean Gabriela, Ciubotariu, Pittner Ana-Maria,
“Cavitation erosion investigations on thermal spray coatings”, Latest Trends on Engineering Mechanics, Structures, Engineering
Geology.
10. Yu-cheng Peng, Xi-yang Chen, “Numerical study of the cavitation on the surface of the guide vane in three Gorges hydropower unit”,
Journal of hydrodynamics, 2010, 22(5), 703-705
11. Szkodo Marek, Giren Boleslaw G, Steller Janusz, “Cavitation resistance of new chromium–manganese and chromium–cobalt
electrodes and their metallographic structures”, Wear 233–235 _1999. 111–119
12. Zhu B, Wang H, “Numerical prediction of impact force in cavitating flows”, 25th IAHR Symposium on Hydraulic Machinery and
Systems.
13. Preece Carolyn M, Brunton John H, “ A comparison of liquid impact erosion and the cavitation erosion”. Wear, 60 (1980) 269 –
284.
14. Prasad, V., Gahlot, V. K. & Krinnamachar, P., “CFD approach for design optimization and validation for axial flow hydraulic
turbine” Indian Journal of Engineering & Material secince Vol. 16, August 2009,pp 229-236
15. Drtina, P. and Sallaberger, M., “Hydraulic turbines—basic principles and state-of-theart computational fluid dynamics applications”
Proc Instn Mech Engrs Vol 213 Part C 1999
16. Wu, J., Shimmei, K., Tani, K., Niikura, K. & Sato, J., “CFD-Based design optimization for hydro turbines” Journal of Fluid
Enginnering, Feb 2007 Vol. 129,pp159-168
IAETSD JOURNAL FOR ADVANCED RESEARCH IN APPLIED SCIENCES
VOLUME 4, ISSUE 7, DEC/2017
ISSN NO: 2394-8442
http://iaetsdjaras.org/259
17. Thakker, A., Frawley, P., & Abugihalia,Y., “Experimental and CFD analysis of 0.6m Impulse turbine with fixed guide vanes”
The International Society of Offshore and polar Engineers ISBN 1-1880653-52-4(Vol.1)
18. Lipej, A., “Optimization method for the design of axial hydraulic turbines” Journal of Power and Energy 2004 218: 43
19. Viscanti, N., Pesatori, E. & Turozzi, G., “Improvement of a Francis runner design” 3rd IAHR International Meeting of the
Workgroup on Cavitation and Dynamic Problems in Hydraulic Machinery and Systems, October 14-16, 2009, Brno, Czech
Republic
20. Liu, S., Wu, S., Nishi, M. & Wu, Y., “Flow Simulation and Performance Prediction of a Kaplan Turbine” The 4th International
Symposium on Fluid Machinery and Fluid Engineering November 24-27, 2008, Beijing, China
21. Kim, Y. T., Nam, S. H., Cho, Y. J., Hwang, Y., C., Choi,Y. D., Nam, C. D. & Lee, Y. H., “Tubular-Type hydro turbine
performance for variable guide vane opening by CFD” The fifth international conference on fluid mechanics, Aug 15-19,2007,
Shanghai, Chaina
22. Khare, R.Prasad, V. & Kumar, S., “Derivation of Global Parametric Performance of Mixed Flow Hydraulic Turbine Using
CFD” Hydro Nepal issue no. 7 July, 2010
23. Carija, Z. & Mrsa, Z., “Complete Francis turbine flow simulation for the whole range of discharges” 4th International Congress of
Croatian Society of Mechanics September, 18-20, 2003 Bizovac, Croatia
IAETSD JOURNAL FOR ADVANCED RESEARCH IN APPLIED SCIENCES
VOLUME 4, ISSUE 7, DEC/2017
ISSN NO: 2394-8442
http://iaetsdjaras.org/260


![Heat Integration Chapt. 10. Costs Heat Exchanger Purchase Cost – C P =K(Area) 0.6 Annual Cost –C A =i m [ΣC p,i + ΣC P,A,j ]+sF s +(cw)F cw i m =return.](https://static.fdocument.org/doc/165x107/56649f165503460f94c2b934/heat-integration-chapt-10-costs-heat-exchanger-purchase-cost-c-p-karea.jpg)