Background characterization for the GERDA ...
23
Background characterization for the GERDA experiment Background characterization for the GERDA experiment Outline: Motivation GERDA Phase-I data and analysis: modeling of the background components decomposition of the background spectrum Conclusion Neslihan Becerici-Schmidt , Allen Caldwell, Bela Majorovits for the GERDA Collaboration Max-Planck-Institut für Physik, München DPG Frühjahrstagung, Dresden, 7 March 2013
Transcript of Background characterization for the GERDA ...
Background characterization for the GERDA experimentBackground characterization for the GERDA experiment
Outline:
Motivation
GERDA Phase-I data and analysis:modeling of the background componentsdecomposition of the background spectrum
Conclusion
Neslihan Becerici-Schmidt, Allen Caldwell, Bela Majorovitsfor the GERDA Collaboration
Max-Planck-Institut für Physik, München
DPG Frühjahrstagung, Dresden, 7 March 2013
2
Motivation
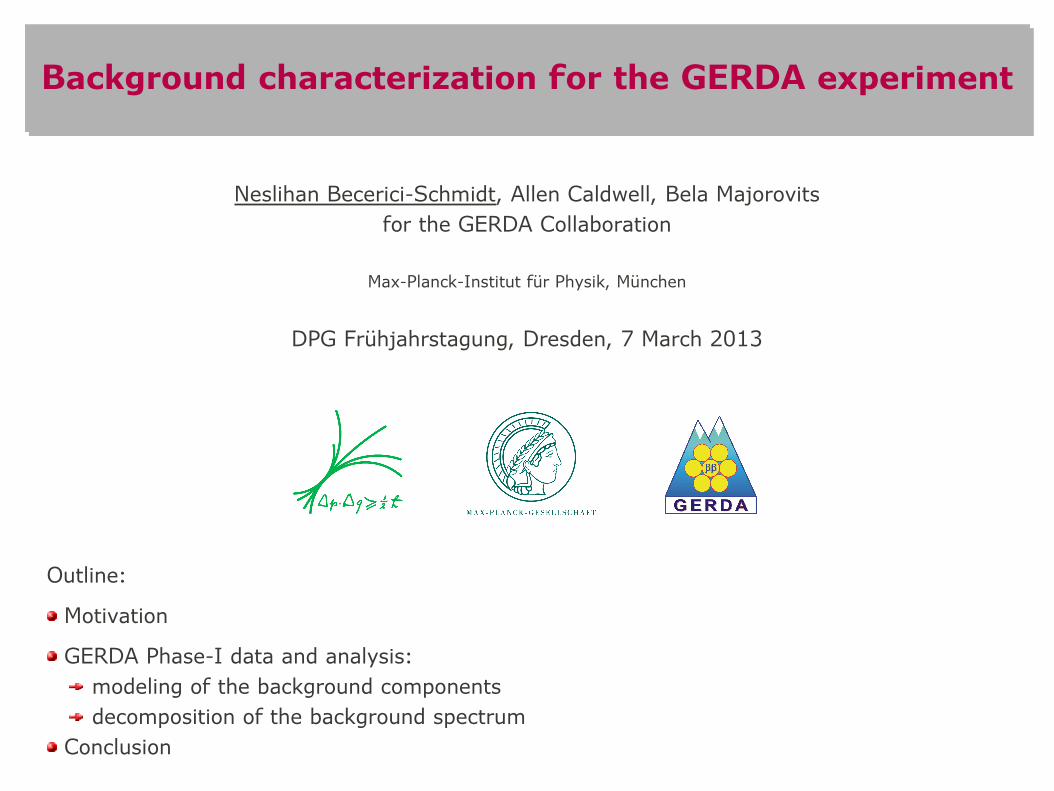
GERDA experiment is searching for the neutrinoless double beta (0νββ) decay of 76Ge, using an array of HPGe detectors enriched in 76Ge isotope.
GERDA Phase-I: T1/2 > 2 × 1025 y test the claim→
GERDA Phase-II: T1/2 > 1026 y
To achieve a higher sensitivity on the T1/2
→ larger exposure → lower background rate around Qββ
▷ Background characterization & suppression
[Phys. Rev. D 74, 092003 (2006)]
3
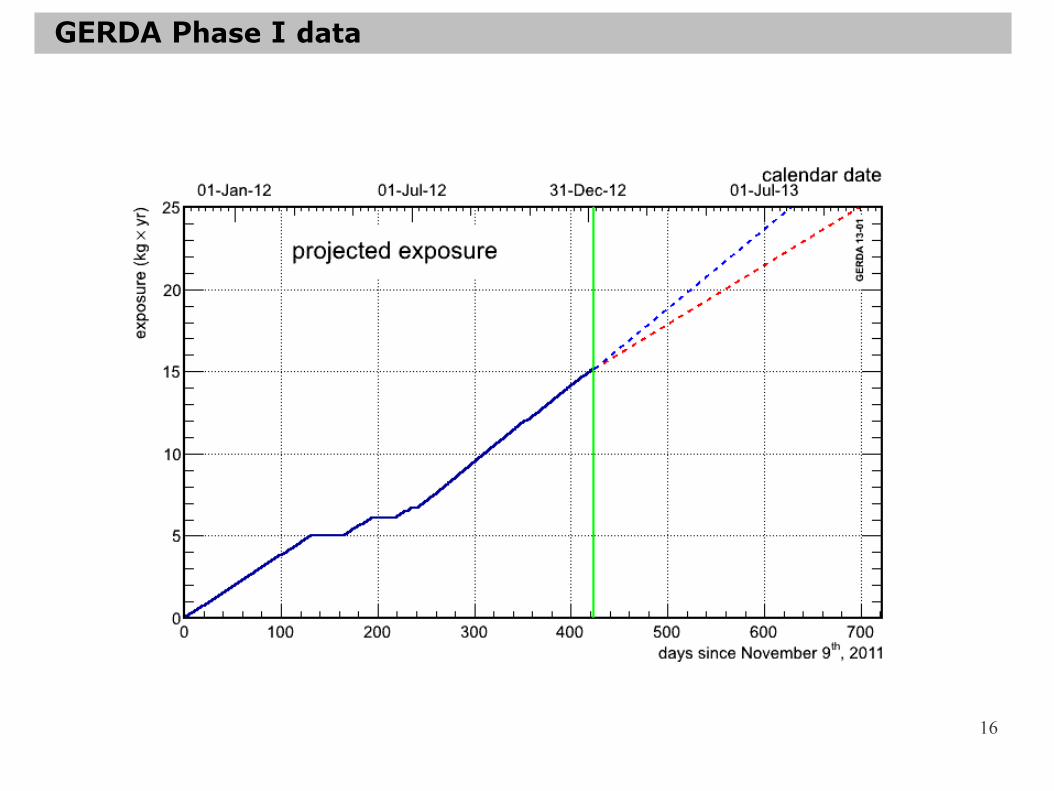
GERDA Phase I data
enrenrGe-coax detectors in Phase IGe-coax detectors in Phase I
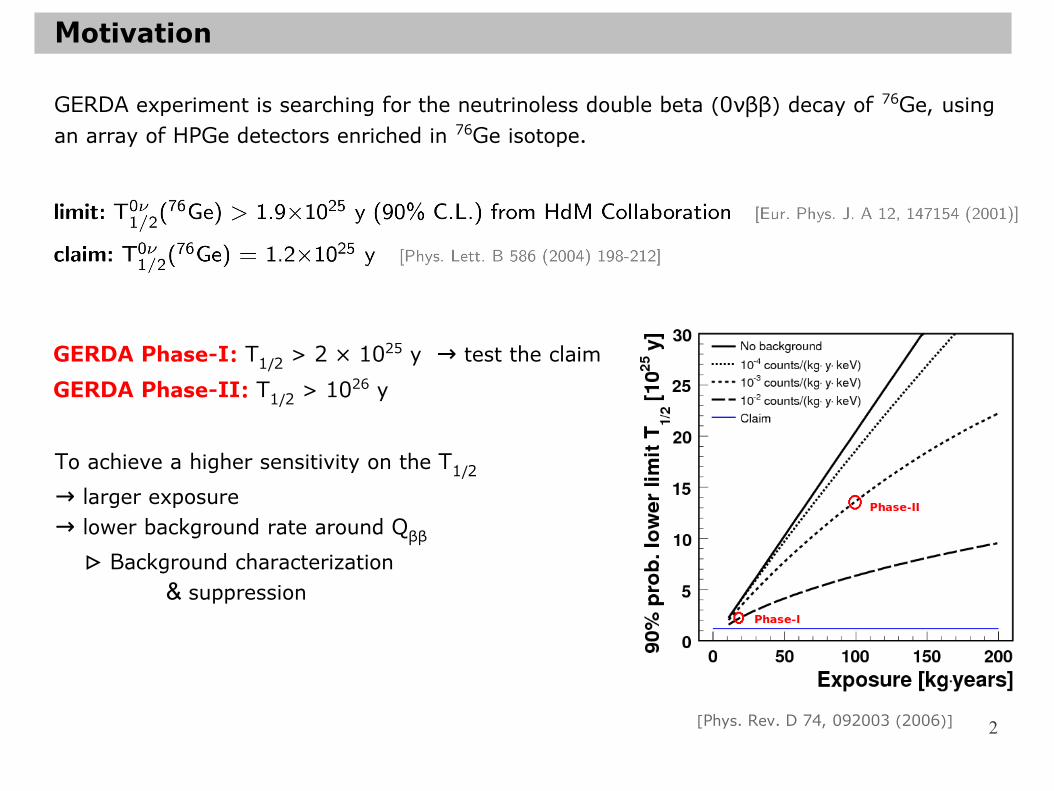
Considered data set:9 November 2011 – 5 January 2013
→ total live DAQ time: 340.94 days → total mass of the coaxial type enrGe detectors: 14.63 kg
total exposure: 13.65 kg x yr
4
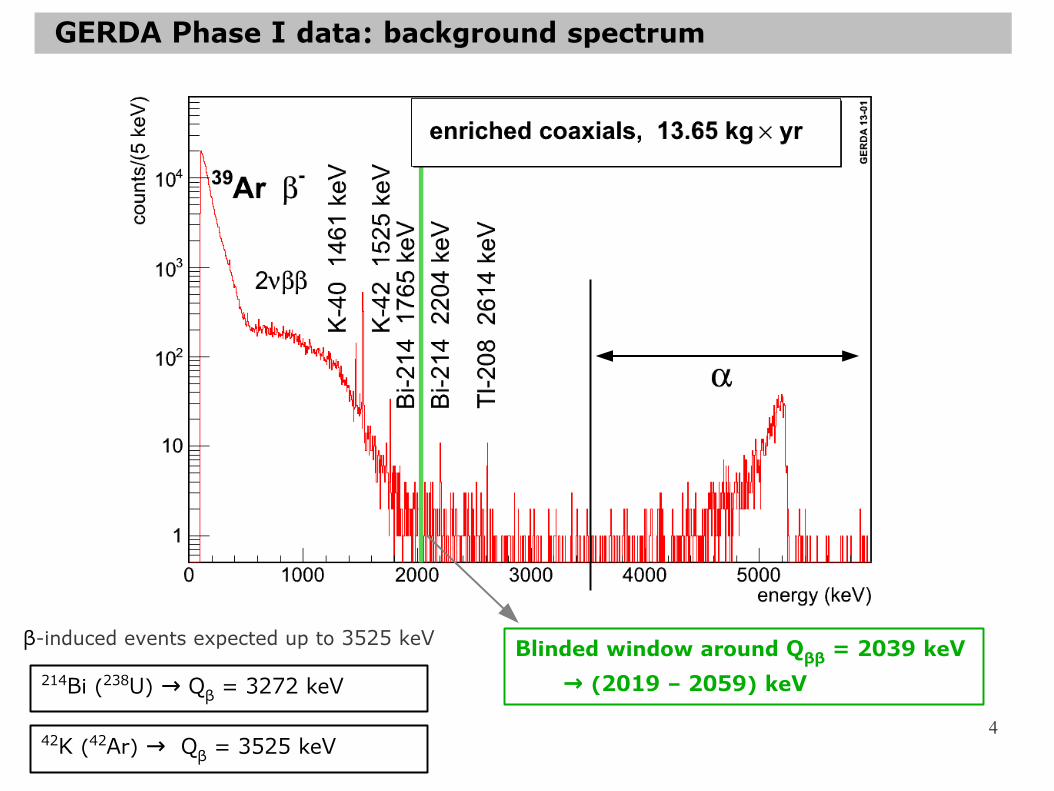
GERDA Phase I data: background spectrum
Blinded window around Qββ = 2039 keV → (2019 – 2059) keV214Bi (238U) Q→ β = 3272 keV
42K (42Ar) Q→ β = 3525 keV
β-induced events expected up to 3525 keV
5
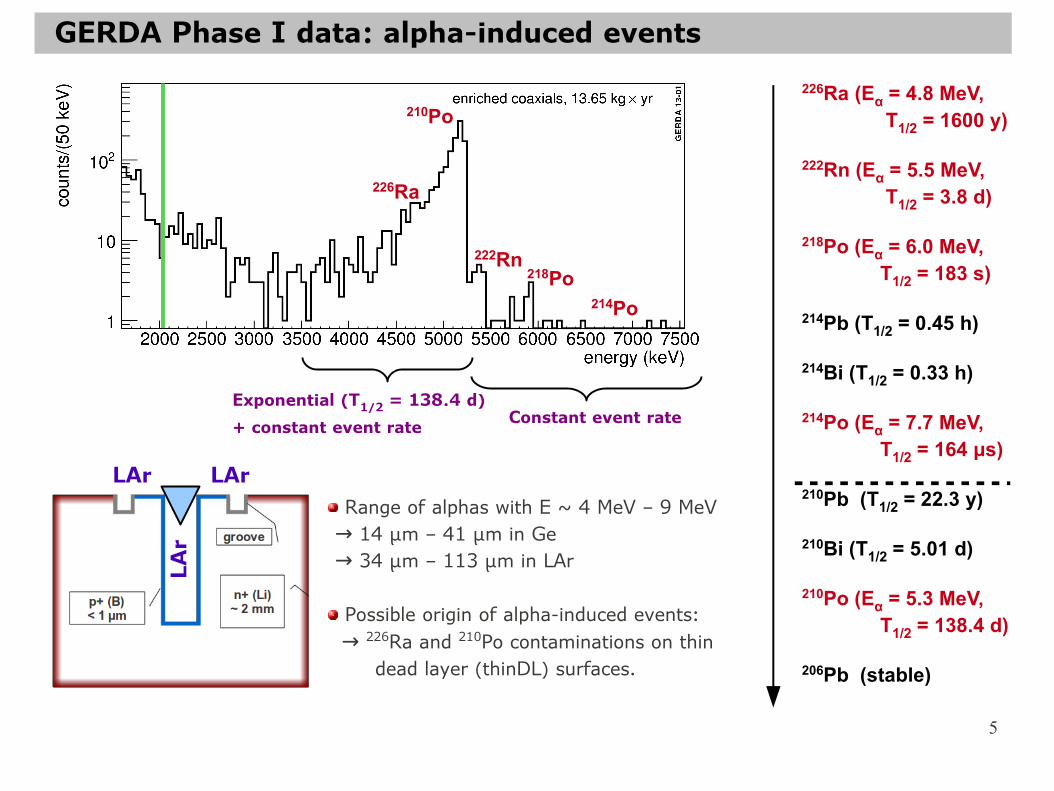
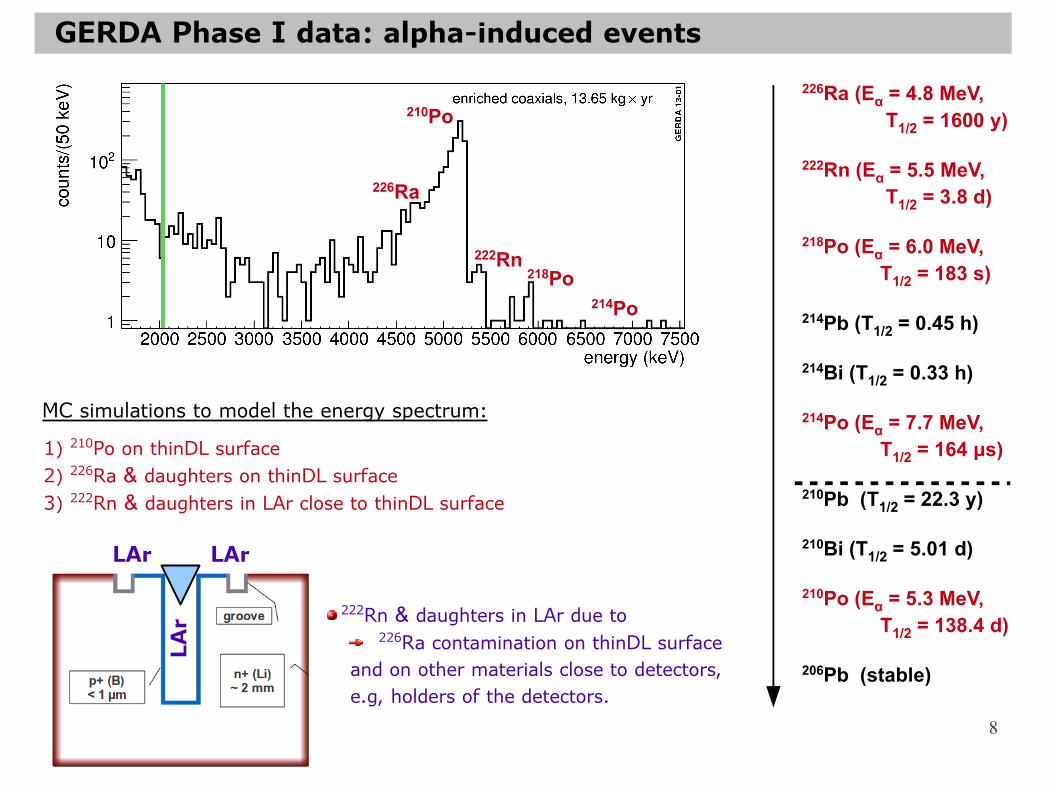
Range of alphas with E ~ 4 MeV – 9 MeV → 14 μm – 41 μm in Ge → 34 μm – 113 μm in LAr
Possible origin of alpha-induced events: → 226Ra and 210Po contaminations on thin dead layer (thinDL) surfaces.
226Ra (Eα = 4.8 MeV, T1/2 = 1600 y)
222Rn (Eα = 5.5 MeV, T1/2 = 3.8 d)
218Po (Eα = 6.0 MeV, T1/2 = 183 s)
214Pb (T1/2 = 0.45 h)
214Bi (T1/2 = 0.33 h)
214Po (Eα = 7.7 MeV, T1/2 = 164 μs)
210Pb (T1/2 = 22.3 y)
210Bi (T1/2 = 5.01 d)
210Po (Eα = 5.3 MeV, T1/2 = 138.4 d)
206Pb (stable)
LAr
LAr LAr
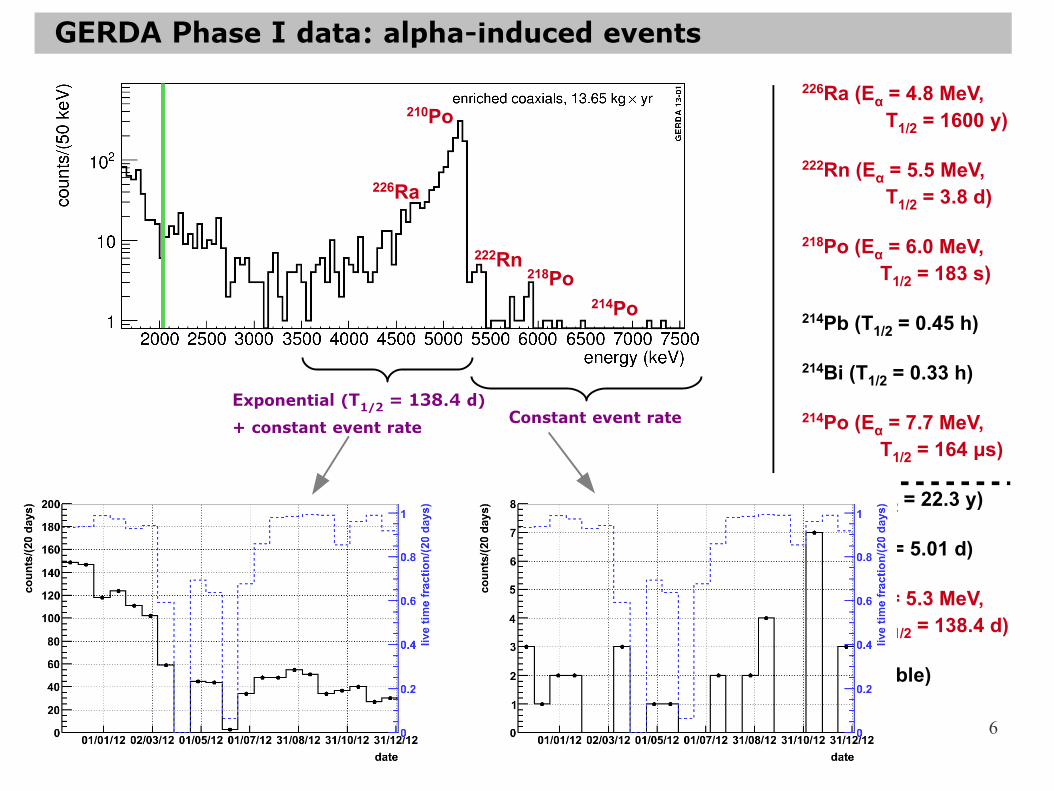
GERDA Phase I data: alpha-induced events
222Rn218Po
210Po
226Ra
214Po
Exponential (T1/2 = 138.4 d)+ constant event rate Constant event rate
6
GERDA Phase I data: alpha-induced events
226Ra (Eα = 4.8 MeV, T1/2 = 1600 y)
222Rn (Eα = 5.5 MeV, T1/2 = 3.8 d)
218Po (Eα = 6.0 MeV, T1/2 = 183 s)
214Pb (T1/2 = 0.45 h)
214Bi (T1/2 = 0.33 h)
214Po (Eα = 7.7 MeV, T1/2 = 164 μs)
210Pb (T1/2 = 22.3 y)
210Bi (T1/2 = 5.01 d)
210Po (Eα = 5.3 MeV, T1/2 = 138.4 d)
206Pb (stable)
222Rn218Po
210Po
226Ra
214Po
Exponential (T1/2 = 138.4 d)+ constant event rate Constant event rate
7
GERDA Phase I data: alpha-induced events
226Ra (Eα = 4.8 MeV, T1/2 = 1600 y)
222Rn (Eα = 5.5 MeV, T1/2 = 3.8 d)
218Po (Eα = 6.0 MeV, T1/2 = 183 s)
214Pb (T1/2 = 0.45 h)
214Bi (T1/2 = 0.33 h)
214Po (Eα = 7.7 MeV, T1/2 = 164 μs)
210Pb (T1/2 = 22.3 y)
210Bi (T1/2 = 5.01 d)
210Po (Eα = 5.3 MeV, T1/2 = 138.4 d)
206Pb (stable)
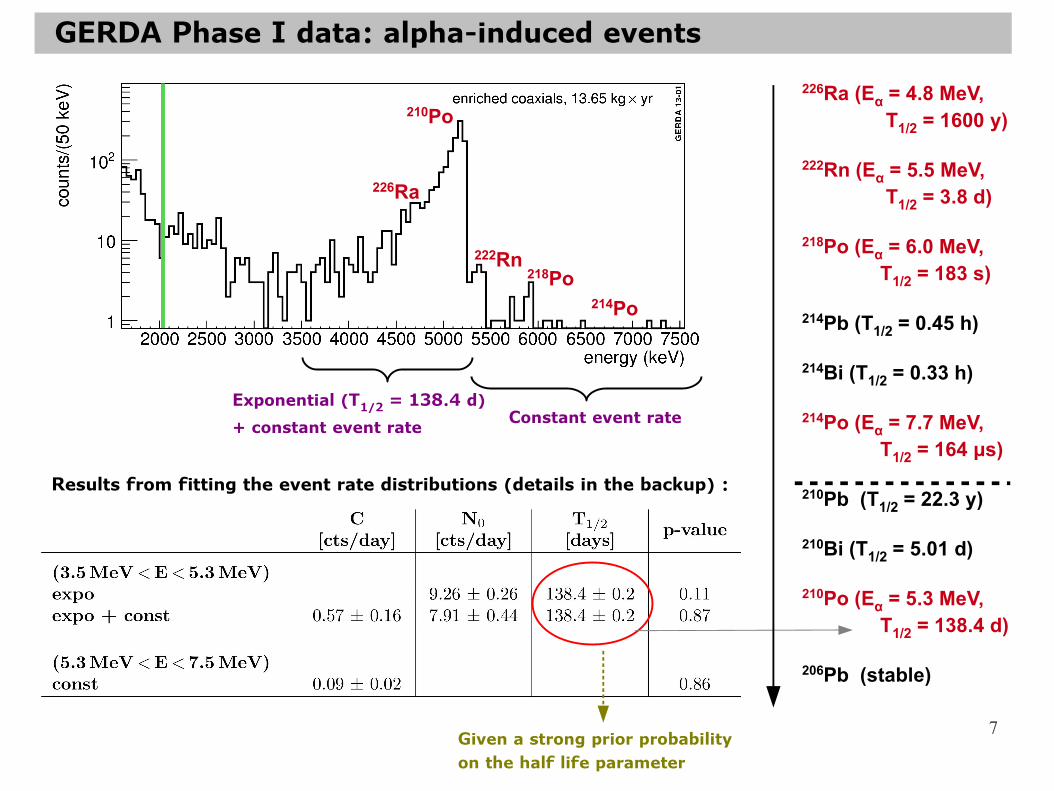
Results from fitting the event rate distributions (details in the backup) :
222Rn218Po
210Po
226Ra
214Po
Exponential (T1/2 = 138.4 d)+ constant event rate Constant event rate
Given a strong prior probabilityon the half life parameter
8
1) 210Po on thinDL surface 2) 226Ra & daughters on thinDL surface3) 222Rn & daughters in LAr close to thinDL surface
MC simulations to model the energy spectrum:
222Rn & daughters in LAr due to 226Ra contamination on thinDL surface
and on other materials close to detectors, e.g, holders of the detectors.
GERDA Phase I data: alpha-induced events
LAr
LAr LAr
226Ra (Eα = 4.8 MeV, T1/2 = 1600 y)
222Rn (Eα = 5.5 MeV, T1/2 = 3.8 d)
218Po (Eα = 6.0 MeV, T1/2 = 183 s)
214Pb (T1/2 = 0.45 h)
214Bi (T1/2 = 0.33 h)
214Po (Eα = 7.7 MeV, T1/2 = 164 μs)
210Pb (T1/2 = 22.3 y)
210Bi (T1/2 = 5.01 d)
210Po (Eα = 5.3 MeV, T1/2 = 138.4 d)
206Pb (stable)
222Rn218Po
210Po
226Ra
214Po
9
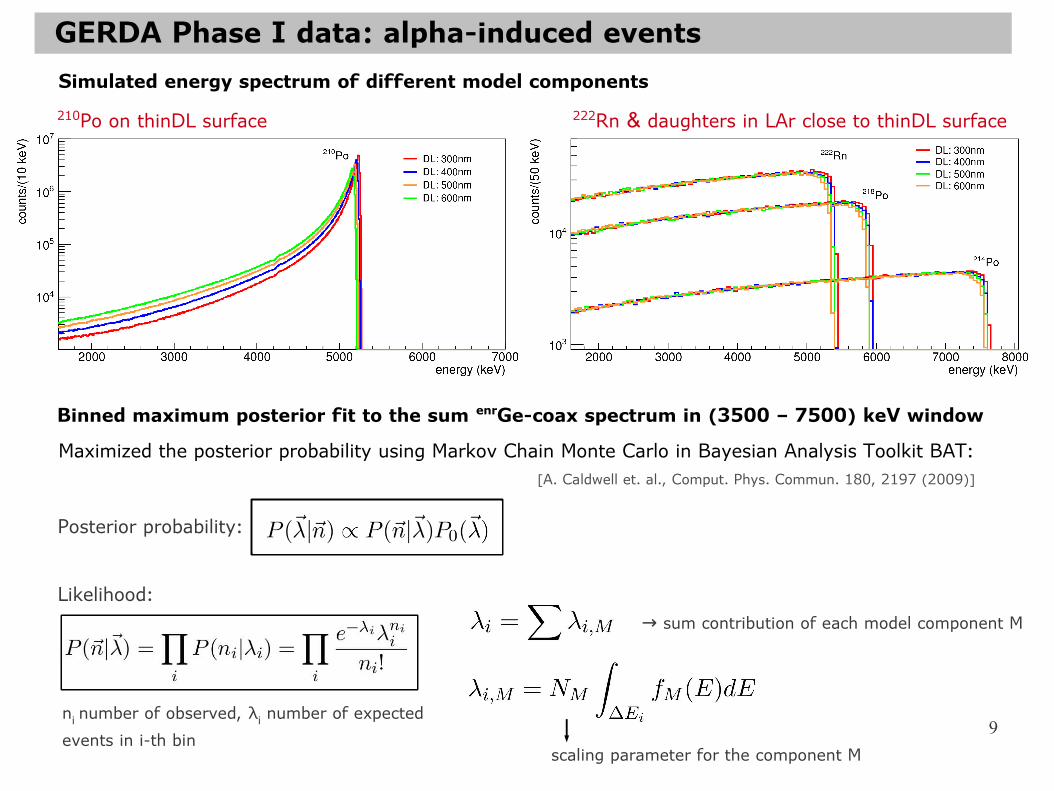
GERDA Phase I data: alpha-induced eventsSimulated energy spectrum of different model components210Po on thinDL surface 222Rn & daughters in LAr close to thinDL surface
Binned maximum posterior fit to the sum enrGe-coax spectrum in (3500 – 7500) keV window
→ sum contribution of each model component MLikelihood:
Posterior probability:
Maximized the posterior probability using Markov Chain Monte Carlo in Bayesian Analysis Toolkit BAT:[A. Caldwell et. al., Comput. Phys. Commun. 180, 2197 (2009)]
ni number of observed, λi number of expected events in i-th bin
scaling parameter for the component M
10
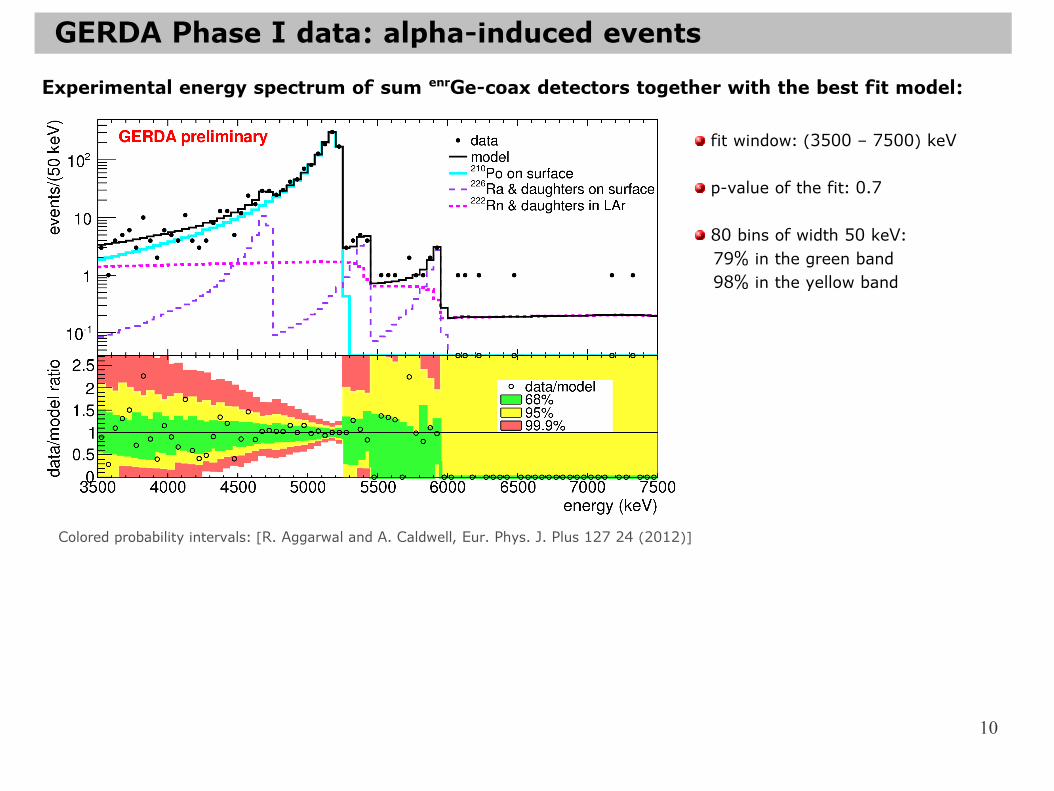
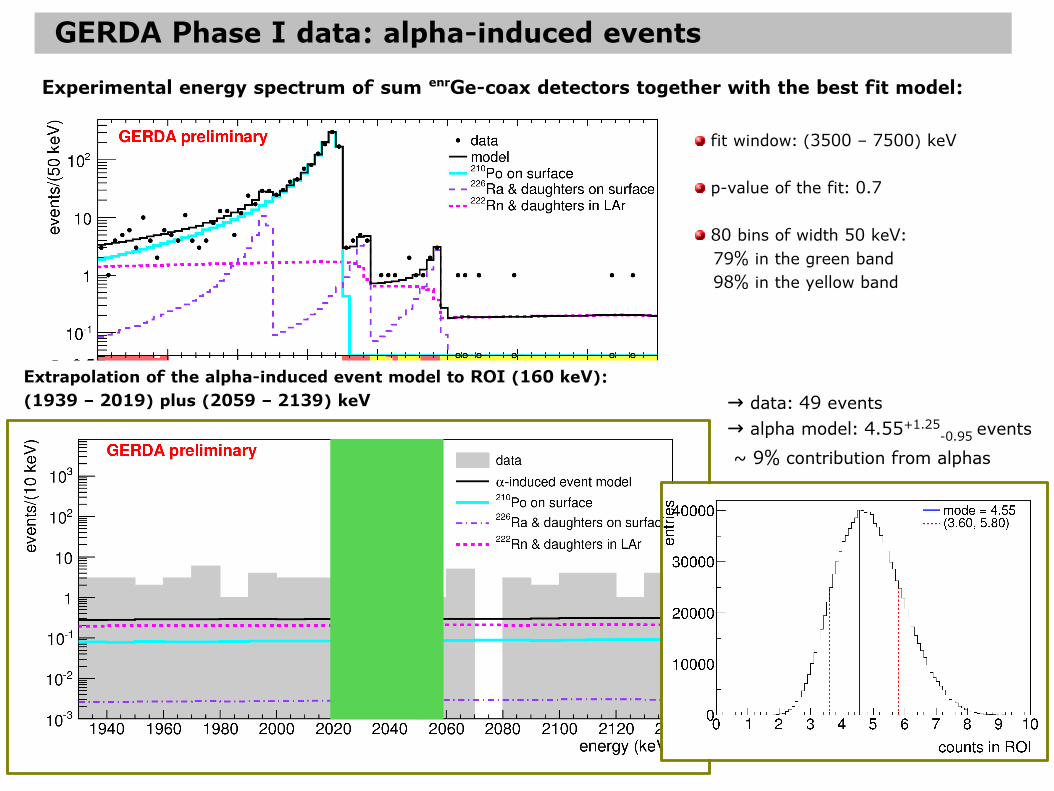
Experimental energy spectrum of sum enrGe-coax detectors together with the best fit model:
GERDA Phase I data: alpha-induced events
fit window: (3500 – 7500) keV
p-value of the fit: 0.7
80 bins of width 50 keV: 79% in the green band 98% in the yellow band
Colored probability intervals: [R. Aggarwal and A. Caldwell, Eur. Phys. J. Plus 127 24 (2012)]
11
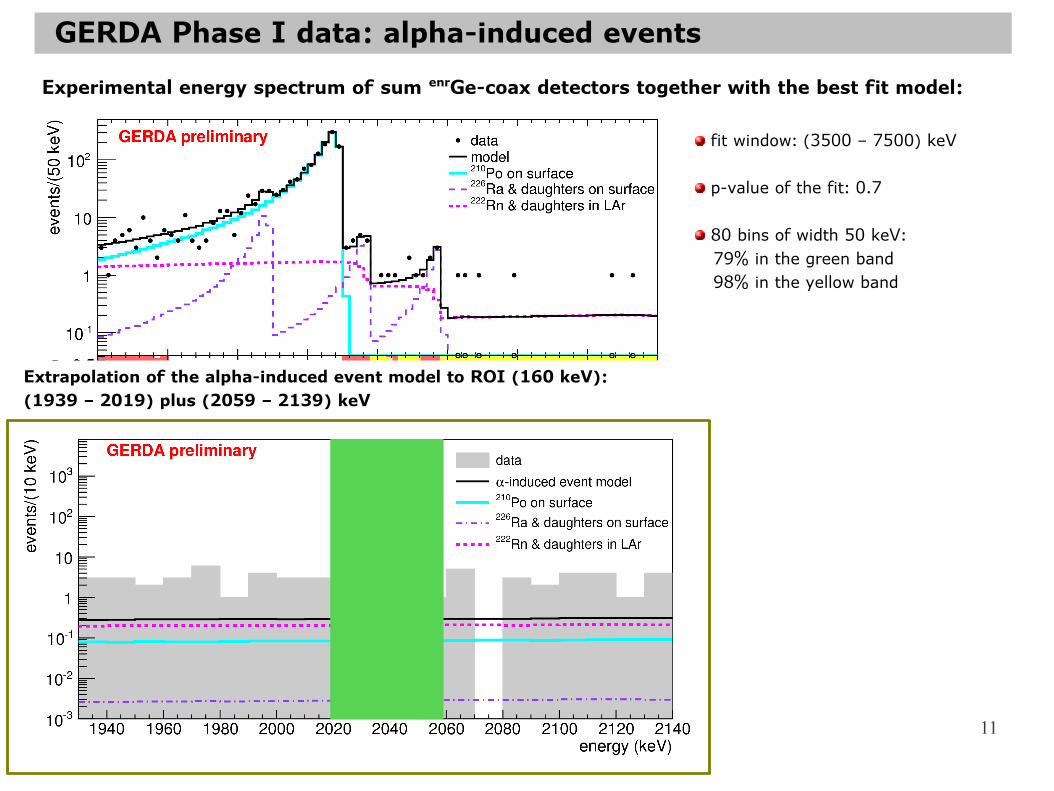
Experimental energy spectrum of sum enrGe-coax detectors together with the best fit model:
GERDA Phase I data: alpha-induced events
fit window: (3500 – 7500) keV
p-value of the fit: 0.7
80 bins of width 50 keV: 79% in the green band 98% in the yellow band
Colored probability intervals: [R. Aggarwal and A. Caldwell, Eur. Phys. J. Plus 127 24 (2012)]
Extrapolation of the alpha-induced event model to ROI (160 keV): (1939 – 2019) plus (2059 – 2139) keV
12
Experimental energy spectrum of sum enrGe-coax detectors together with the best fit model:
GERDA Phase I data: alpha-induced events
fit window: (3500 – 7500) keV
p-value of the fit: 0.7
80 bins of width 50 keV: 79% in the green band 98% in the yellow band
Colored probability intervals: [R. Aggarwal and A. Caldwell, Eur. Phys. J. Plus 127 24 (2012)]
→ data: 49 events → alpha model: 4.55+1.25
-0.95 events ~ 9% contribution from alphas
Extrapolation of the alpha-induced event model to ROI (160 keV): (1939 – 2019) plus (2059 – 2139) keV
13
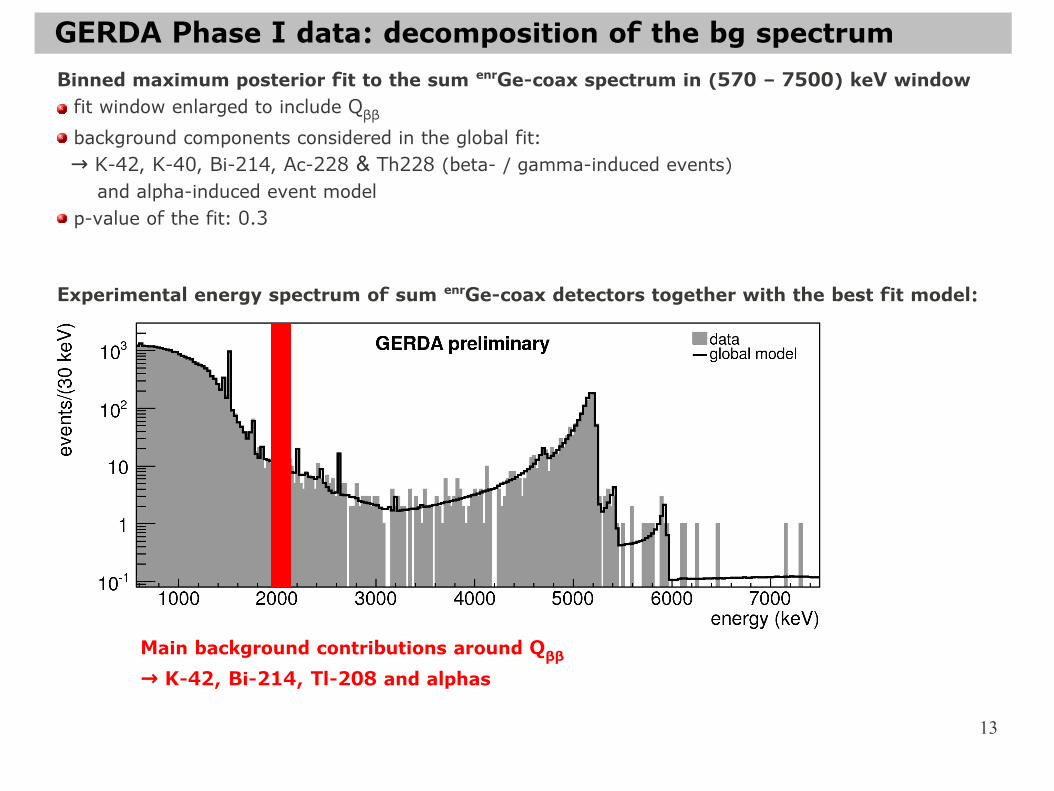
GERDA Phase I data: decomposition of the bg spectrumBinned maximum posterior fit to the sum enrGe-coax spectrum in (570 – 7500) keV window fit window enlarged to include Qββ
background components considered in the global fit: → K-42, K-40, Bi-214, Ac-228 & Th228 (beta- / gamma-induced events) and alpha-induced event model p-value of the fit: 0.3
Main background contributions around Qββ → K-42, Bi-214, Tl-208 and alphas
Experimental energy spectrum of sum enrGe-coax detectors together with the best fit model:
14
Conclusion
GERDA Phase I data-taking is ongoing. Blind analysis: 40 keV window around Qββ = 2039 keV is blinded.
Model the background energy spectrum before unblinding: Promising “preliminary” results !
Background model is important:understand the background in Phase I & mitigate it further in Phase II
estimate the expected number of background events & the shape of the background spectrum around Qββ for the upcoming 0νββ analysis.

15
Backup
16
GERDA Phase I data
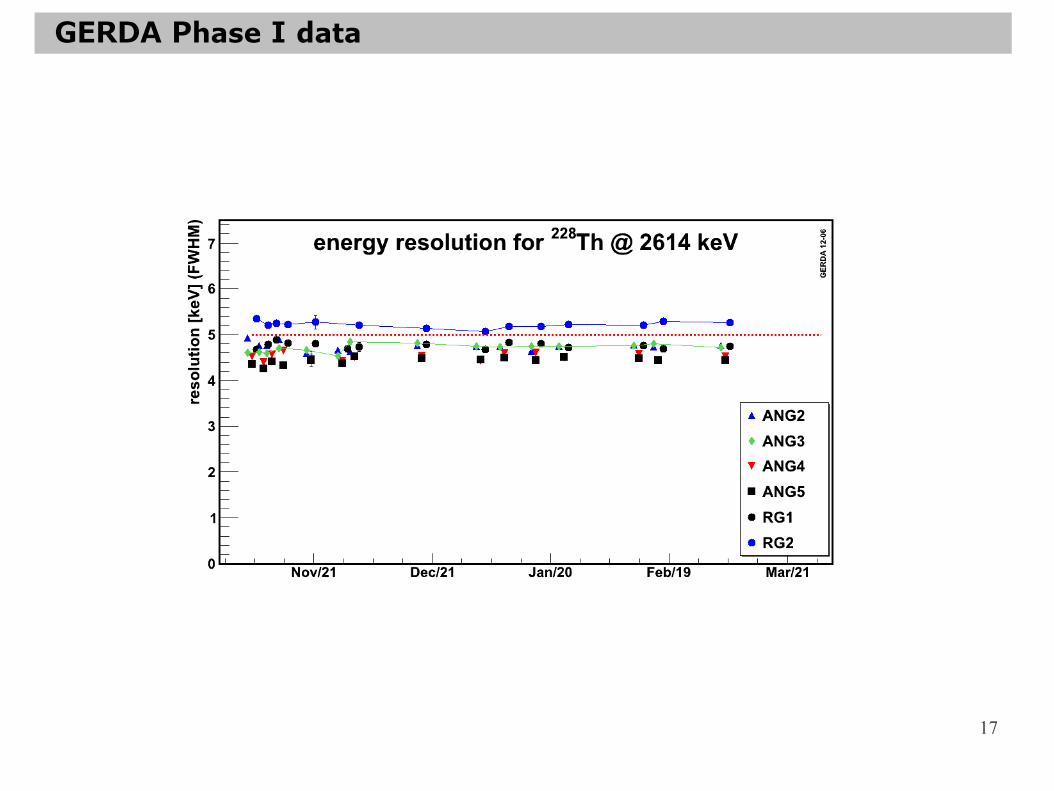
17
GERDA Phase I data
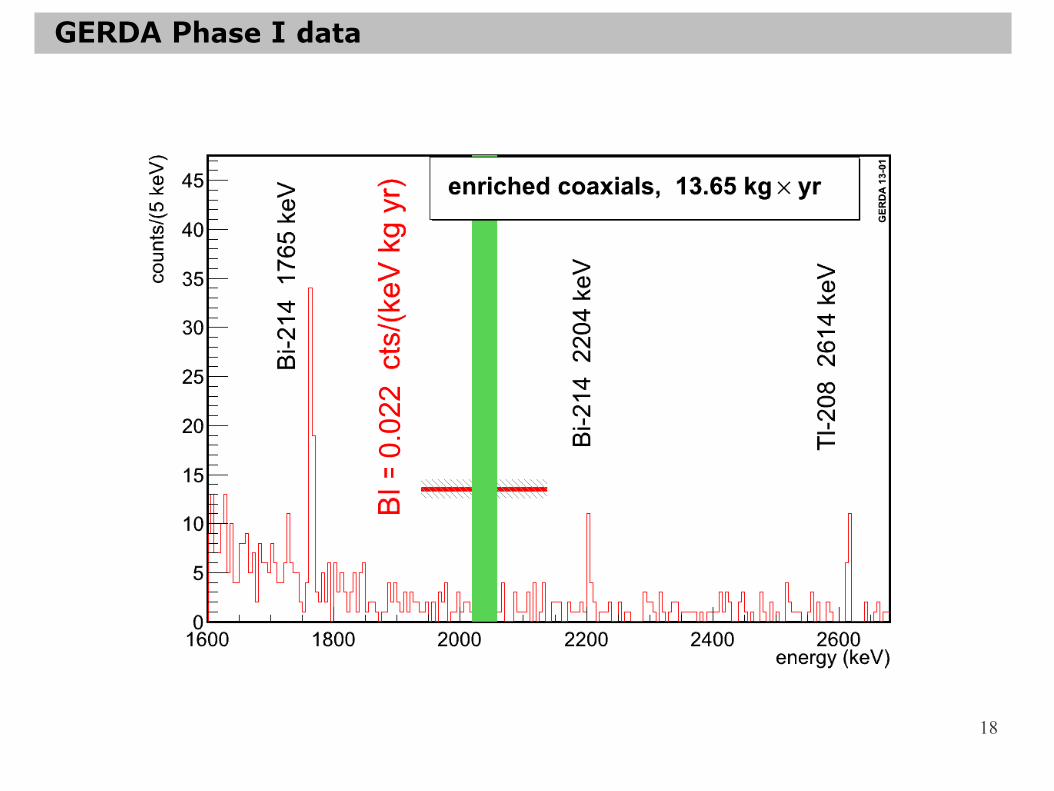
18
GERDA Phase I data
0.0
22
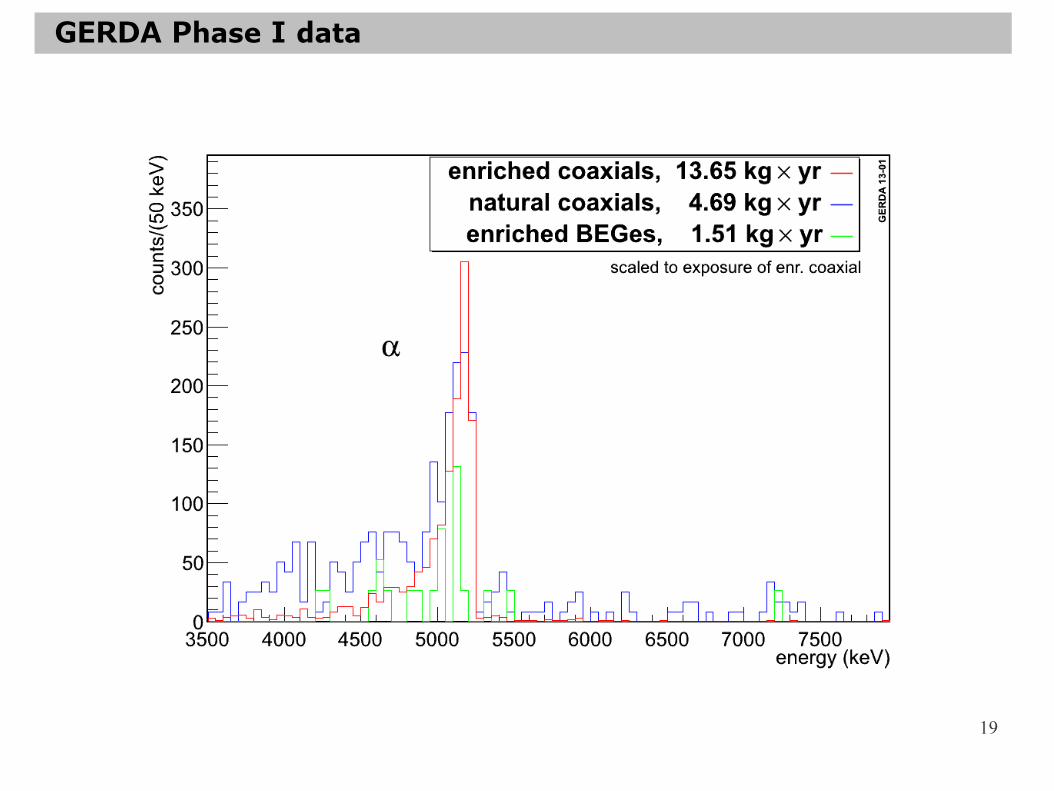
19
GERDA Phase I data
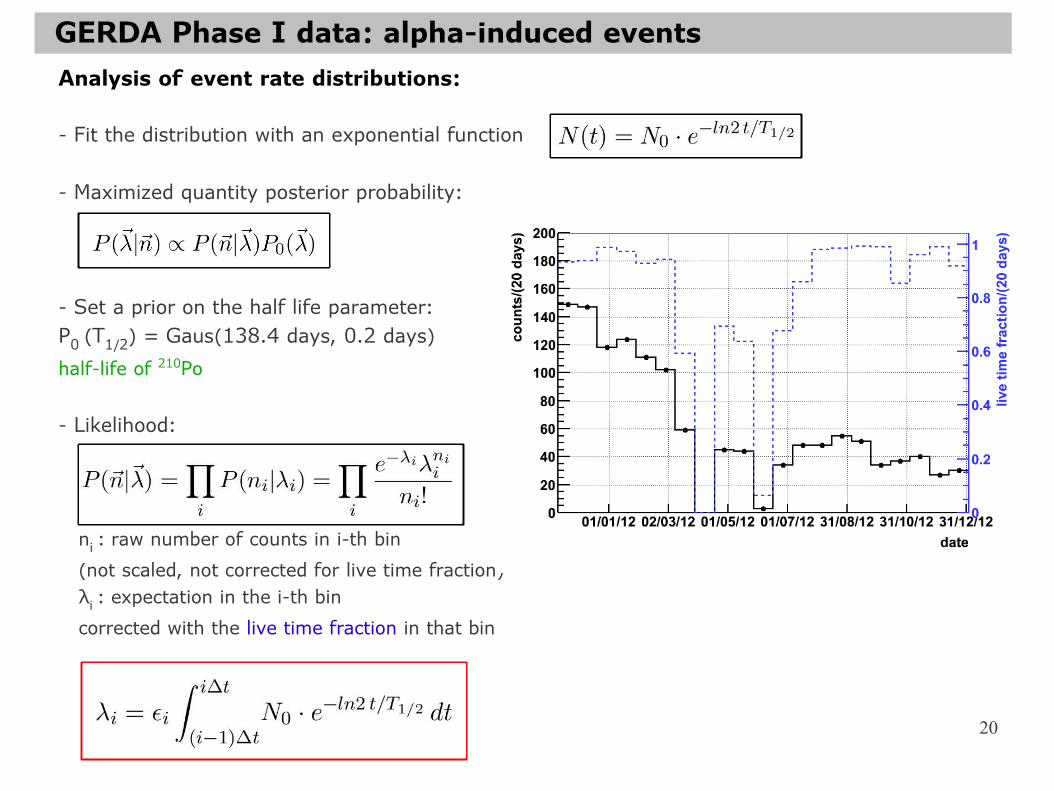
20
Analysis of event rate distributions:
- Fit the distribution with an exponential function
- Maximized quantity posterior probability:
- Set a prior on the half life parameter: P0 (T1/2) = Gaus(138.4 days, 0.2 days) half-life of 210Po
- Likelihood:
ni : raw number of counts in i-th bin (not scaled, not corrected for live time fraction) λi : expectation in the i-th bin corrected with the live time fraction in that bin
GERDA Phase I data: alpha-induced events
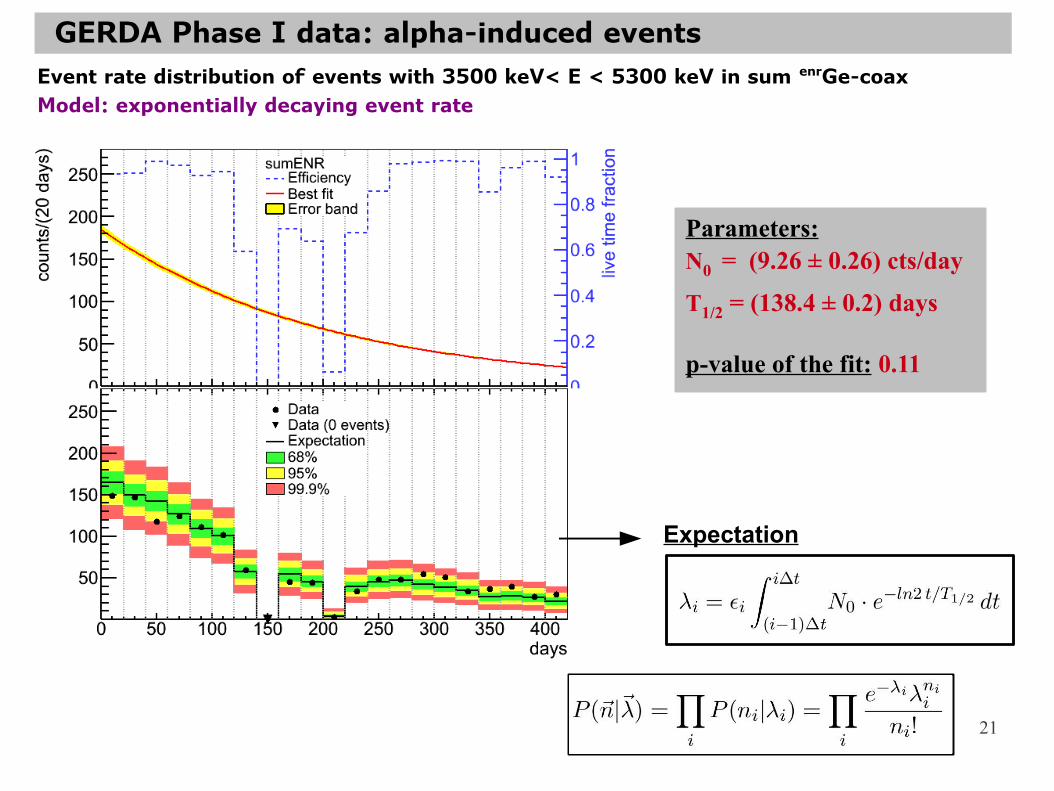
21
Parameters:N0 = (9.26 ± 0.26) cts/day
T1/2 = (138.4 ± 0.2) days
p-value of the fit: 0.11
Event rate distribution of events with 3500 keV< E < 5300 keV in sum enrGe-coaxModel: exponentially decaying event rate
Expectation
GERDA Phase I data: alpha-induced events
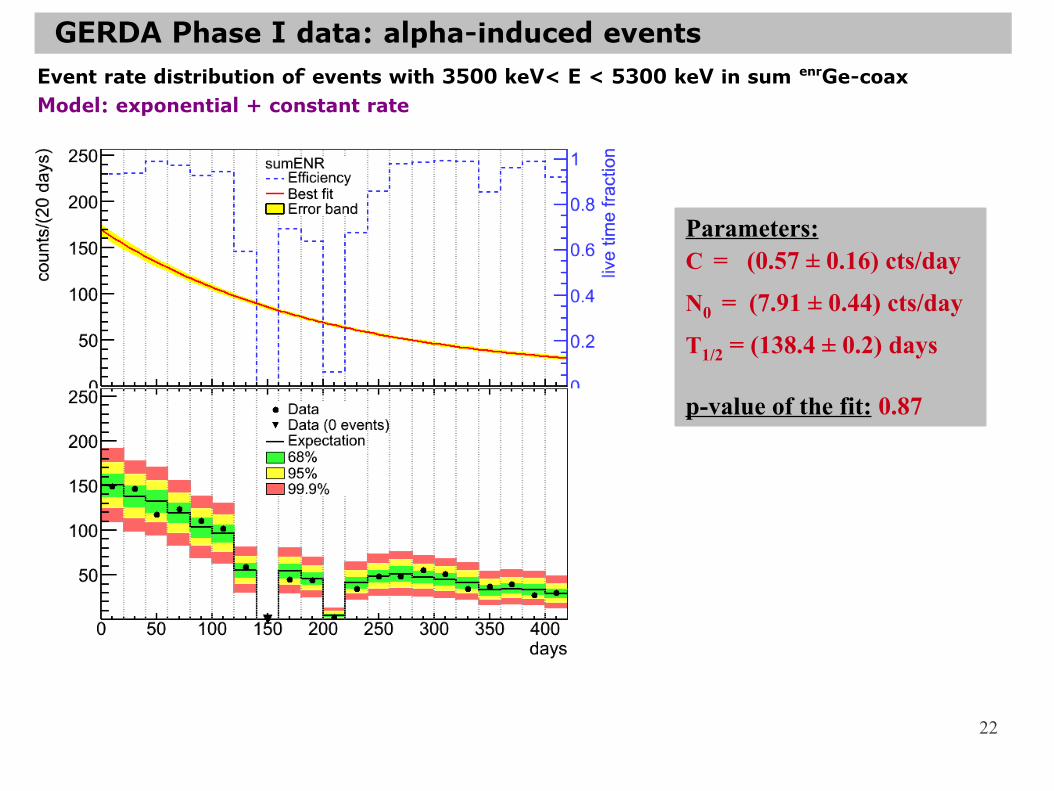
22
Parameters:C = (0.57 ± 0.16) cts/day
N0 = (7.91 ± 0.44) cts/day
T1/2 = (138.4 ± 0.2) days
p-value of the fit: 0.87
Event rate distribution of events with 3500 keV< E < 5300 keV in sum enrGe-coaxModel: exponential + constant rate
GERDA Phase I data: alpha-induced events
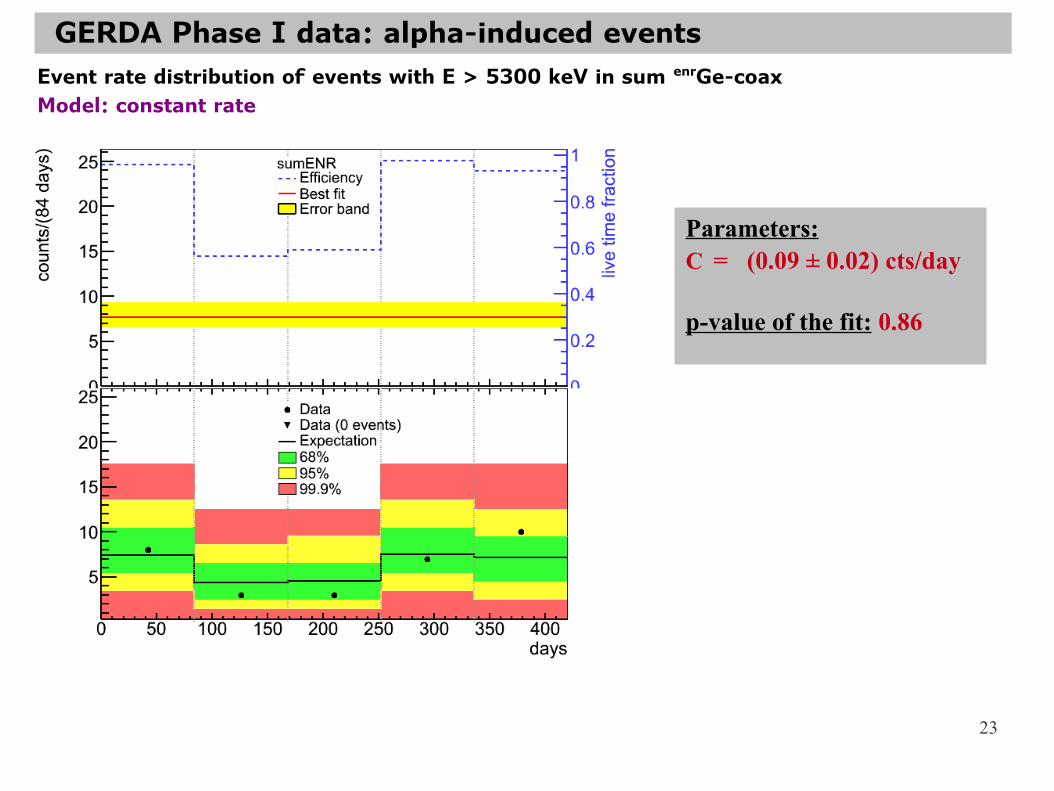
23
Parameters:C = (0.09 ± 0.02) cts/day
p-value of the fit: 0.86
Event rate distribution of events with E > 5300 keV in sum enrGe-coaxModel: constant rate
GERDA Phase I data: alpha-induced events