ASTROPHYSICS genomic and adaptive evolution. …bzhang/z09.pdf · Figure 1 | Discordance in the...
3
1. Simpson, G. G. Tempo and Mode in Evolution (Columbia Univ. Press, 1944). 2. Gould, S. J. The Structure of Evolutionary Theory (Belknap, 2002). 3. Nei, M. Molecular Evolutionary Genetics (Columbia Univ. Press, 1987). 4. Barrick, J. E. et al. Nature 461, 1243–1247 (2009). 5. Lenski, R. E., Rose, M. R., Simpson, S. C. & Tadler, S. C. Am. Nat. 138, 1315–1341 (1991). 6. Kimura, M. The Neutral Theory of Molecular Evolution (Cambridge Univ. Press, 1983). is typical of the 11 other replicate lines. If it is typical, then one is left wondering whether an explanation will lie in the ecology of compet- ing beneficial mutations, in subtle increases in mutation rate, or in the underlying details of the genotype-to-phenotype map. Nonethe- less, the facts stand: this first glimpse into a new world will never, despite the excitement, be fully satisfactory. The astute reader will recognize that there has thus far been no comment on the last 20,000 generations of evolution. This is intentional. After generation 20,000, a mutation arose in mutT — a gene encoding a protein involved in DNA repair — which caused the mutation rate to increase; the increase in mutation rate radi- cally altered the tempo and mode of genomic evolution, although it seems to have had rela- tively little impact on organismal evolution. The mutations arising during the first period of evolution numbered 45 in total: over the ensu- ing 20,000 generations, around 600 additional mutations became fixed. The footprint left by these mutations has the signature of neutral evolution, evident primarily by the fact that many mutations had no impact on the amino- acid sequence of the encoded proteins. The complexity of the relationship between tempo and mode of evolution at the genomic and organismal levels is the cause of some unease, and suggests that caution needs to be exercised in inferring mode of organismal evo- lution from rates of evolution evident in DNA. Simpson, however, would undoubtedly have relished the delight that direct knowledge of evolution on this scale brings. It is quite won- derful to see first-hand the chaos generated by the mutT mutation. Such insight shows just how 0 5,000 10,000 15,000 20,000 Number of mutations Relative fitness Generations Figure 1 | Discordance in the coupling between genomic and adaptive evolution. In this summary of the tempo of genomic change (number of mutations) and organismal adaptation (fitness) over 20,000 generations of Escherichia coli evolution, the clock-like rate of genomic evolution revealed by Barrick and colleagues 4 is difficult to understand given that the rate of fitness improvement decreases with time. In the absence of direct insight into genomic evolution, one would predict the rate of genomic evolution to have declined due to a reduction in the rate of appearance of new beneficial mutations, or a reduction in the average benefit of each mutation (or both). powerful science — and particularly the science of experimental evolution — can be, when, as Barrick et al. 4 reveal, the question asked finds resonance with the technical assay. ■ Paul B. Rainey is at the New Zealand Institute for Advanced Study, and the Allan Wilson Centre for Molecular Ecology and Evolution, Massey University, Auckland, New Zealand. e-mail: [email protected] ASTROPHYSICS Most distant cosmic blast seen Bing Zhang The most distant γ-ray burst yet sighted is the earliest astronomical object ever observed in cosmic history. This ancient beacon offers a glimpse of the little-known cosmic dark ages. In this issue, two papers 1,2 report the discovery of a γ-ray burst (GRB) at a redshift of about 8.2. This is the highest redshift — or equiva- lently the most distant — astronomical object ever detected in the Universe. For comparison, the highest redshift recorded so far for galaxies is about 6.96 (ref. 3). For quasars — extremely bright galactic nuclei powered by supermassive black holes — the record holder is an object at 6.48 (ref. 4). Tanvir et al. 1 (page 1254) and Salvaterra et al. 2 (page 1258) measured a concordant redshift for GRB 090423 on the basis of observations of its fading afterglow emission at different times after the initial burst of γ-rays. In astronomy, a larger distance (or redshift) corresponds to an earlier time in cosmic history, because it takes longer for a farther-away photon, which trav- els at finite speed, to reach Earth. Moreover, because the Universe is expanding, the wave- length of electromagnetic radiation emitted by a distant object is stretched to be longer and redder (redshifted) on its course to Earth. The farther away the source, the more the Universe has expanded, and therefore the higher the source’s redshift. The redshift measured for GRB 090423 means that the burst occurred at a time when the Universe was about nine times smaller than it is today — putting the timing of the event at about 630 million years after the Big Bang. GRBs are the most violent explosions in the Universe. They are believed to be associated with the formation of stellar-sized black holes or rapidly rotating, highly magnetized neutron stars during cataclysmic events such as the collapse of a massive star or the coalescence of two compact stellar objects. The reason why GRBs can outshine galaxies and quasars, which are much more massive, to become the redshift record holders (Fig. 1) is threefold. First, thanks to their high speed (99.9995% of the speed of light), their maximum luminos- ity is extremely high, dwarfing that of galaxies and quasars by many orders of magnitude. Second, whereas galaxies and quasars look progressively dimmer at higher redshifts (both because of a larger distance from Earth and an intrinsic smaller mass at an earlier cosmic time), the apparent brightness of GRBs and their infrared afterglows (which hold the key to redshift identification) do not decrease sig- nificantly with increasing redshift. This is due to a concerted combination of two effects, the k-correction and the time-dilation effect 5 . Finally, whereas bright galaxies and quasars become rarer as redshifts rise above 7, theoreti- cal models suggest that massive stars, thought to be the progenitors of high-redshift GRBs, can form much earlier 6 . As a result, GRBs can be more easily detected at higher redshifts, and may hold the key to illuminating the cosmic ‘dark ages’ (Fig. 2, overleaf). Although satellites such as Swift 7 have been 1960 1970 1980 1990 2000 2010 0 2 4 6 8 Redshift Figure 1 | Redshift ladder. Timeline of redshift record-breaking for three classes of astronomical object: galaxies (red), quasars (green) and γ-ray bursts (blue). The measurement of γ-ray-burst redshift began much later than that of galaxies and quasars, but since the first discovery it has seen a much faster pace of redshift record-breaking. (Courtesy of N. Tanvir.) 1221 NATURE|Vol 461|29 October 2009 NEWS & VIEWS © 2009 Macmillan Publishers Limited. All rights reserved
Transcript of ASTROPHYSICS genomic and adaptive evolution. …bzhang/z09.pdf · Figure 1 | Discordance in the...
1. Simpson, G. G. Tempo and Mode in Evolution (Columbia
Univ. Press, 1944).
2. Gould, S. J. The Structure of Evolutionary Theory (Belknap,
2002).
3. Nei, M. Molecular Evolutionary Genetics (Columbia Univ.
Press, 1987).
4. Barrick, J. E. et al. Nature 461, 1243–1247 (2009).
5. Lenski, R. E., Rose, M. R., Simpson, S. C. & Tadler, S. C.
Am. Nat. 138, 1315–1341 (1991).
6. Kimura, M. The Neutral Theory of Molecular Evolution
(Cambridge Univ. Press, 1983).
is typical of the 11 other replicate lines. If it is typical, then one is left wondering whether an explanation will lie in the ecology of compet-ing beneficial mutations, in subtle increases in mutation rate, or in the underlying details of the genotype-to-phenotype map. Nonethe-less, the facts stand: this first glimpse into a new world will never, despite the excitement, be fully satisfactory.
The astute reader will recognize that there has thus far been no comment on the last 20,000 generations of evolution. This is intentional. After generation 20,000, a mutation arose in mutT — a gene encoding a protein involved in DNA repair — which caused the mutation rate to increase; the increase in mutation rate radi-cally altered the tempo and mode of genomic evolution, although it seems to have had rela-tively little impact on organismal evolution. The mutations arising during the first period of evolution numbered 45 in total: over the ensu-ing 20,000 generations, around 600 additional mutations became fixed. The footprint left by these mutations has the signature of neutral evolution, evident primarily by the fact that many mutations had no impact on the amino-acid sequence of the encoded proteins.
The complexity of the relationship between tempo and mode of evolution at the genomic and organismal levels is the cause of some unease, and suggests that caution needs to be exercised in inferring mode of organismal evo-lution from rates of evolution evident in DNA. Simpson, however, would undoubtedly have relished the delight that direct knowledge of evolution on this scale brings. It is quite won-derful to see first-hand the chaos generated by the mutT mutation. Such insight shows just how
0 5,000 10,000 15,000 20,000
Nu
mb
er
of
mu
tati
on
s
Re
lati
ve
fitn
ess
Generations
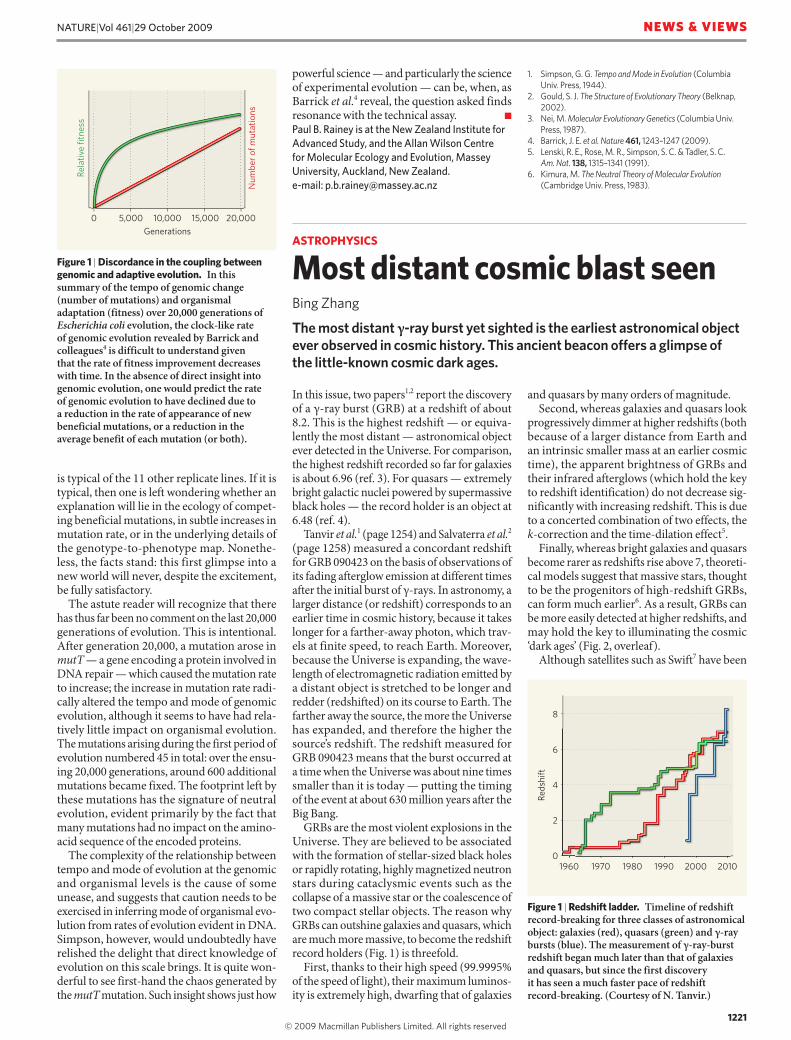
Figure 1 | Discordance in the coupling between genomic and adaptive evolution. In this summary of the tempo of genomic change (number of mutations) and organismal adaptation (fitness) over 20,000 generations of Escherichia coli evolution, the clock-like rate of genomic evolution revealed by Barrick and colleagues4 is difficult to understand given that the rate of fitness improvement decreases with time. In the absence of direct insight into genomic evolution, one would predict the rate of genomic evolution to have declined due to a reduction in the rate of appearance of new beneficial mutations, or a reduction in the average benefit of each mutation (or both).
powerful science — and particularly the science of experimental evolution — can be, when, as Barrick et al.4 reveal, the question asked finds resonance with the technical assay. ■
Paul B. Rainey is at the New Zealand Institute for
Advanced Study, and the Allan Wilson Centre
for Molecular Ecology and Evolution, Massey
University, Auckland, New Zealand.
e-mail: [email protected]
ASTROPHYSICS
Most distant cosmic blast seenBing Zhang
The most distant γ-ray burst yet sighted is the earliest astronomical object ever observed in cosmic history. This ancient beacon offers a glimpse of the little-known cosmic dark ages.
In this issue, two papers1,2 report the discovery of a γ-ray burst (GRB) at a redshift of about 8.2. This is the highest redshift — or equiva-lently the most distant — astronomical object ever detected in the Universe. For comparison, the highest redshift recorded so far for galaxies is about 6.96 (ref. 3). For quasars — extremely bright galactic nuclei powered by supermassive black holes — the record holder is an object at 6.48 (ref. 4).
Tanvir et al.1 (page 1254) and Salvaterra et al.2 (page 1258) measured a concordant redshift for GRB 090423 on the basis of observations of its fading afterglow emission at different times after the initial burst of γ-rays. In astronomy, a larger distance (or redshift) corresponds to an earlier time in cosmic history, because it takes longer for a farther-away photon, which trav-els at finite speed, to reach Earth. Moreover, because the Universe is expanding, the wave-length of electromagnetic radiation emitted by a distant object is stretched to be longer and redder (redshifted) on its course to Earth. The farther away the source, the more the Universe has expanded, and therefore the higher the source’s redshift. The redshift measured for GRB 090423 means that the burst occurred at a time when the Universe was about nine times smaller than it is today — putting the timing of the event at about 630 million years after the Big Bang.
GRBs are the most violent explosions in the Universe. They are believed to be associated with the formation of stellar-sized black holes or rapidly rotating, highly magnetized neutron stars during cataclysmic events such as the collapse of a massive star or the coalescence of two compact stellar objects. The reason why GRBs can outshine galaxies and quasars, which are much more massive, to become the redshift record holders (Fig. 1) is threefold.
First, thanks to their high speed (99.9995% of the speed of light), their maximum luminos-ity is extremely high, dwarfing that of galaxies
and quasars by many orders of magnitude.Second, whereas galaxies and quasars look
progressively dimmer at higher redshifts (both because of a larger distance from Earth and an intrinsic smaller mass at an earlier cosmic time), the apparent brightness of GRBs and their infrared afterglows (which hold the key to redshift identification) do not decrease sig-nificantly with increasing redshift. This is due to a concerted combination of two effects, the k-correction and the time-dilation effect5.
Finally, whereas bright galaxies and quasars become rarer as redshifts rise above 7, theoreti-cal models suggest that massive stars, thought to be the progenitors of high-redshift GRBs, can form much earlier6. As a result, GRBs can be more easily detected at higher redshifts, and may hold the key to illuminating the cosmic ‘dark ages’ (Fig. 2, overleaf).
Although satellites such as Swift7 have been
1960 1970 1980 1990 2000 2010
0
2
4
6
8
Re
dsh
ift
Figure 1 | Redshift ladder. Timeline of redshift record-breaking for three classes of astronomical object: galaxies (red), quasars (green) and γ-ray bursts (blue). The measurement of γ-ray-burst redshift began much later than that of galaxies and quasars, but since the first discovery it has seen a much faster pace of redshift record-breaking. (Courtesy of N. Tanvir.)
1221
NATURE|Vol 461|29 October 2009 NEWS & VIEWS
1217-1226 News and Views MH IF.indd 12211217-1226 News and Views MH IF.indd 1221 26/10/09 10:09:0326/10/09 10:09:03
© 2009 Macmillan Publishers Limited. All rights reserved
successful in detecting high-redshift GRBs, characterizing these objects and measuring their redshifts is a different matter. To do so requires catching their rapidly fading after-glows and identifying their spectral signa-tures. The main signature is a fall in emissions, caused by intervening hydrogen-gas clouds along the light path, bluewards of the Lyman-α resonance line of hydrogen. For high-redshift GRBs, this feature is best observed with near-infrared observations, because the original ultraviolet light of such GRBs is redshifted into the observable near-infrared window.
For GRB 090423, Tanvir et al.1 observed the near-infrared afterglow, starting about 17.5 hours after the burst, using the European Southern Observatory 8.2-metre Very Large Telescope in Chile. Meanwhile, Salvaterra et al.2 observed the burst from about 14 hours after it occurred using the 3.6-metre Italian Telescopio Nazionale Galileo in Spain. Both teams discovered a clear break in emissions at wavelengths shorter than about 1.1 micro-metres, which corresponds to the Lyman-α line frequency at the derived redshift.
The authors’ discovery1,2 opens up the exciting possibility of studying the cosmic ‘re-ionization’ epoch, and the preceding dark ages, using GRBs. In its spectrum, particularly in the absorption ‘damping wing’, a GRB carries information about the fraction of neutral gas
in the intergalactic medium (IGM)4, and so the IGM re-ionization state, at the cosmic time at which it occurred. Studying a number of GRBs spread over a range of redshifts would allow one to map out the course of the re-ionization process throughout cosmic time.
Realistically, two factors seem likely to hinder this prospect. First, afterglow observations suggest that there is a large amount of neutral gas in the interstellar medium (ISM) surround-ing GRBs. In some cases, the contribution of the ISM to GRB light-absorption dominates over that of IGM absorption, making it dif-ficult to extract information about cosmic re-ionization from the data8. But cosmologi-cal simulations suggest that, at high redshifts, this ISM effect should decrease with increasing redshift9, a trend that seems to be supported by observations of the second-highest-redshift burst, GRB 080913 (ref. 10). More high-redshift GRB data are needed to verify or disprove this prediction.
Second, afterglows fade rapidly with time. High-resolution spectroscopy is therefore needed at early (post-burst) epochs to catch them when they are still bright. In the case of GRB 090423, high-resolution spectra1,2 were taken from about 14 hours after the burst, when the afterglow had already faded consid-erably. The spectra presented by Tanvir et al.1 and Salvaterra et al.2 can therefore only serve
the purpose of redshift identification. To make further progress in studying the high-redshift Universe with GRBs, prompt alerts on high-redshift GRB candidates would be desirable. It is hoped that this could be achieved in the future by GRB space missions such as SVOM, JANUS and EXIST, or by ground-based, large near-infrared robotic telescopes.
That said, GRB 090423 still provides much information about the high-redshift Universe and the mechanisms that underlie GRB for-mation at that cosmic epoch. Salvaterra and colleagues2 note that the burst detection may suggest that star-formation rate at high red-shift is anomalously high, or that the GRB luminosity function (the relative number of GRBs that have a certain luminosity) evolves with redshift. Tanvir and colleagues1, however, point out that its detection is consistent with the high-redshift star-formation rate predicted by some theoretical models11. More data are needed to solve the authors’ discrepant inter-pretations of the detection of GRB 090423.
Moreover, both studies1,2 report that the X-ray and near-infrared afterglows of the burst are not very different from those of nearer GRBs, suggesting that progenitor stars simi-lar to those of their more recent counterparts already existed at cosmic times as early as 630 million years after the Big Bang. Detec-tion of radio afterglow and afterglow model-ling12 suggest that the circumburst medium of GRB 090423 is also similar to that of its nearby cousins. Taken together, all of these observations1,2,12 indicate that the progenitor of GRB 090423 is not one of the first-genera-tion stars, which, unlike their present-day ana-logues, are believed to be much more massive and metal poor (containing only hydrogen and helium)6.
Finally, the (rest-frame) duration of GRB 090423 is slightly longer than 1 second. Given its redshift, this is an unexpected prop-erty, but one that is shared by GRB 080913, and that implies that the burst may fall into the short-lived category. However, several arguments13 suggest that both GRB 090423 and GRB 080913 are related to the collapse of massive stars, rather than the merging of com-pact objects that is believed to power nearby, short-lived GRBs14.
The apparently short durations of these two bursts may be due to an observational-selection effect. A more intriguing possibility, which future observations could test, is that this is related to the properties of GRB pro-genitors at increasingly higher redshifts, which seem to produce intrinsically shorter bursts. In any case, thus far, the indication is that GRB duration alone is no longer necessarily the crucial criterion to discern the physical nature of GRBs13. ■
Bing Zhang is in the Department of Physics
and Astronomy, University of Nevada,
4505 Maryland Parkway, Las Vegas,
Nevada 89154-4002, USA.
e-mail: [email protected]
GRB 090423:630 million years
Now:
13.7 billion
years
Re-ionization ends:
800–900 million
years
Atoms form:
400,000
years
Cosmic
dark
ages
BigBang
Cosmic time
C
GRB 090423:630 million years
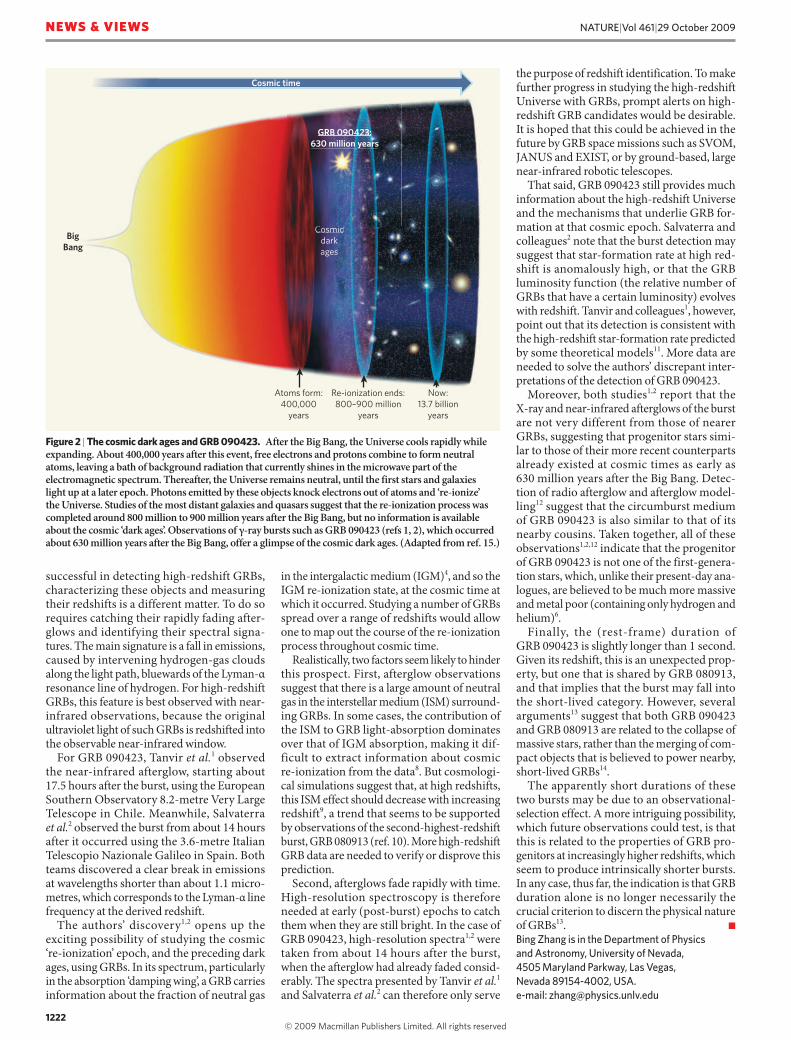
Figure 2 | The cosmic dark ages and GRB 090423. After the Big Bang, the Universe cools rapidly while expanding. About 400,000 years after this event, free electrons and protons combine to form neutral atoms, leaving a bath of background radiation that currently shines in the microwave part of the electromagnetic spectrum. Thereafter, the Universe remains neutral, until the first stars and galaxies light up at a later epoch. Photons emitted by these objects knock electrons out of atoms and ‘re-ionize’ the Universe. Studies of the most distant galaxies and quasars suggest that the re-ionization process was completed around 800 million to 900 million years after the Big Bang, but no information is available about the cosmic ‘dark ages’. Observations of γ-ray bursts such as GRB 090423 (refs 1, 2), which occurred about 630 million years after the Big Bang, offer a glimpse of the cosmic dark ages. (Adapted from ref. 15.)
1222
NATURE|Vol 461|29 October 2009NEWS & VIEWS
1217-1226 News and Views MH IF.indd 12221217-1226 News and Views MH IF.indd 1222 26/10/09 10:09:0426/10/09 10:09:04
© 2009 Macmillan Publishers Limited. All rights reserved
1. Tanvir, N. R. et al. Nature 461, 1254–1257 (2009).
2. Salvaterra, R. et al. Nature 461, 1258–1260 (2009).
3. Iye, M. et al. Nature 443, 186–188 (2006).
4. Fan, X., Carilli, C. L. & Keating, B. Annu. Rev. Astron.
Astrophys. 44, 415–462 (2006).
5. Ciardi, B. & Loeb, A. Astrophys. J. 540, 687–696 (2000).
6. Abel, T. et al. Science 295, 93–98 (2002).
7. Gehrels, N. et al. Astrophys. J. 611, 1005–1020 (2004).
8. Totani, T. et al. Publ. Astron. Soc. Jap. 58, 485–498 (2006).
9. Nagamine, K., Zhang, B. & Hernquist, L. Astrophys. J.
CATALYSIS
Bond control in surface reactions Jens K. Nørskov and Frank Abild-Pedersen
Catalysts steer reactions towards certain products — but the basis of their control is often unclear. Quantum chemical calculations reveal which parameters control bond formation in a network of catalytic reactions.
Control of bond formation in reactions is the key to making chemical production more energy-efficient and product-specific — thereby minimizing the formation of unwanted side products. It is also crucial for developing sustainable industrial processes for manufacturing fuels. In large-scale chemi-cal processes, such ‘bond control’ is typically exerted by the surfaces of catalysts that consist of porous solids, or of nanoparticles supported on other materials. Writing in Angewandte Chemie, Loffreda et al.1 report an essential step towards understanding the order in which chemical bonds form in molecules bound to a catalyst’s surface. They consider a prototype reaction in which unsaturated aldehydes react with hydrogen on a platinum surface (Fig. 1), and show that quantum chemical calculations can provide a simple set of rules to determine which bond is hydrogenated first.
Quantum chemical methods for describing surface reactions have developed extensively during the past decade, and have now reached the point at which complete catalytic reac-tions can be described in some detail. Indeed, the first examples in which such insight has been used to design new catalysts have been reported2–5. Currently, however, only the sim-plest reactions can be modelled in full using quantum calculations. For complex reaction networks, a more promising approach is to develop an understanding of which factors within a network determine the overall rates. For questions relating to reaction selectivity — that is, which bond reacts first — the challenge is to identify the descriptors that determine the relative rates of all of the possible pathways in which different bonds react. These descrip-tors can then be calculated or measured in the search for new catalysts.
The overall reactivity of a given catalyst is traditionally understood in terms of the Sabatier principle6, which states that the rate of a reaction is maximized when the inter actions between the intermediates and the catalyst
are neither too weak nor too strong. Weak bonding makes the catalyst too inert to allow the reaction to take place, whereas over ly strong bonding may cause the catalyst to hold on to intermediates, hampering the formation
of products. The energies of bonds formed between the main reaction intermediates and catalytic surfaces therefore determine the overall catalytic rate, and can be used as descriptors of that rate2. Only a few bond energies are usually needed to determine a catalyst’s reacti-vity, because the various parameters associated with reactivity tend to scale with each other, effectively limiting the number of independent variables2,7. Specifically, the activation energies of reactions (the energies required to initiate reactions) generally scale with the energy difference between reaction inter mediates, and surface-bond energies for different inter-mediates in a reaction pathway often scale with each other.
Loffreda et al.1 report that specific surface-bond energies also work as descriptors for reac-tion selectivity. They first show that the order in which the different double bonds of acrolein (a simple unsaturated aldehyde, C3H4O) are hydrogenated on the surface of a metal such as platinum can be understood by dividing all of the possible reactions that could occur into four groups. Each group is defined by its reac-tion centre — one of the three carbon atoms, or the oxygen atom. The authors find that, for each group and at any given point along a reaction pathway, the transition-state energy (the energy at which the complex of reactants becomes more product-like than reactant-like) scales linearly with the surface-bond energy of the preceding intermediate–metal complex. In fact, there is an almost one-to-one correlation between the energies. This means that the acti-vation energies for all of the different reactions that can take place at each centre are about the same, something that has also been found in studies of smaller molecules reacting on a variety of transition metals8.
Intriguingly, Loffreda et al.1 go on to show that the same scaling relationship also applies to another unsaturated aldehyde, prenal. This means that the transition-state energies for pre-nal hydrogenation could have been predicted by calculating the surface-bond energies for the relevant reaction centres of that molecule. For any given reaction that has several possible reaction pathways, the one that has the lowest transition-state energy typically has the fast-est rate — it will occur before the others. The authors have therefore shown that surface-bond energy is a descriptor of reaction selec-tivity. If this is a general result, then it will allow the reaction selectivities for hydrogenations of many aldehydes on many different catalysts to be screened rapidly using quantum chemical calculations. Hydrogenations are exception-ally useful reactions in industry, so this is an exciting prospect.
Loffreda and colleagues’ work exemplifies the great progress that has been made in our understanding of solid-state catalysts in recent years as a direct result of quantum chemical cal-culations. Extending the use of computational techniques to complex reaction networks is the next great challenge — but there are already
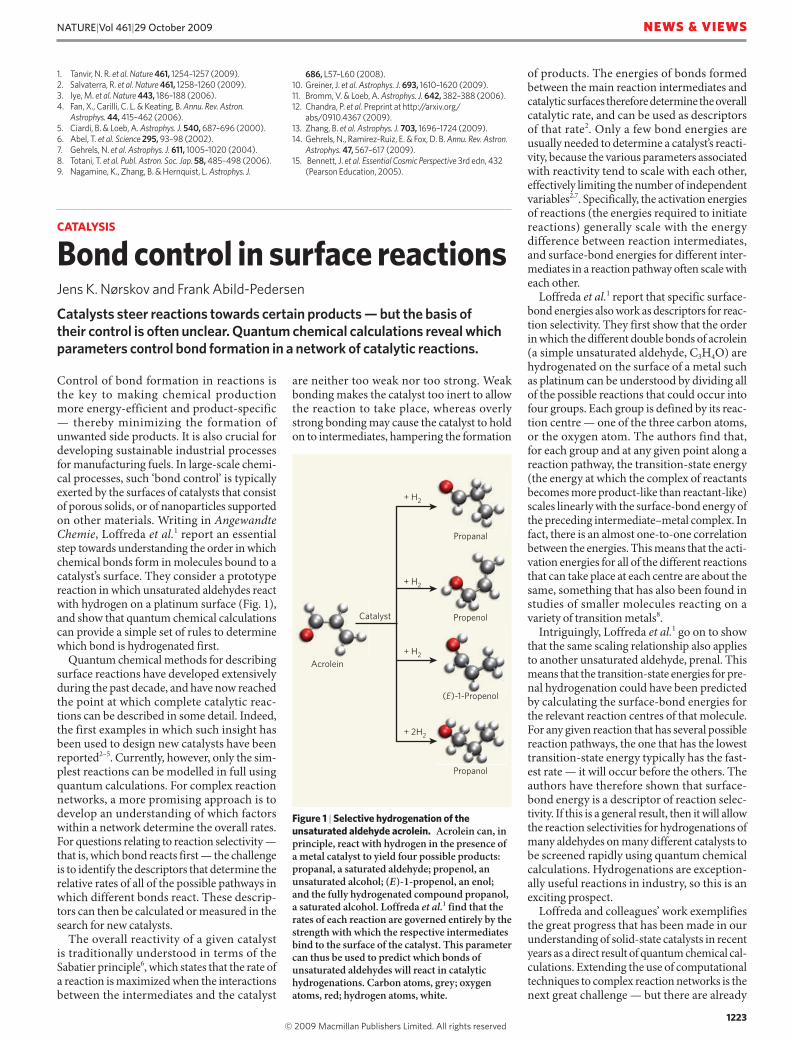
Figure 1 | Selective hydrogenation of the unsaturated aldehyde acrolein. Acrolein can, in principle, react with hydrogen in the presence of a metal catalyst to yield four possible products: propanal, a saturated aldehyde; propenol, an unsaturated alcohol; (E)-1-propenol, an enol; and the fully hydrogenated compound propanol, a saturated alcohol. Loffreda et al.1 find that the rates of each reaction are governed entirely by the strength with which the respective intermediates bind to the surface of the catalyst. This parameter can thus be used to predict which bonds of unsaturated aldehydes will react in catalytic hydrogenations. Carbon atoms, grey; oxygen atoms, red; hydrogen atoms, white.
Catalyst
+ H2
+ H2
+ H2
+ 2H2
Acrolein
Propanal
Propenol
Propanol
(E)-1-Propenol
686, L57–L60 (2008).
10. Greiner, J. et al. Astrophys. J. 693, 1610–1620 (2009).
11. Bromm, V. & Loeb, A. Astrophys. J. 642, 382–388 (2006).
12. Chandra, P. et al. Preprint at http://arxiv.org/
abs/0910.4367 (2009).
13. Zhang, B. et al. Astrophys. J. 703, 1696–1724 (2009).
14. Gehrels, N., Ramirez-Ruiz, E. & Fox, D. B. Annu. Rev. Astron.
Astrophys. 47, 567–617 (2009).
15. Bennett, J. et al. Essential Cosmic Perspective 3rd edn, 432
(Pearson Education, 2005).
1223
NATURE|Vol 461|29 October 2009 NEWS & VIEWS
1217-1226 News and Views MH IF.indd 12231217-1226 News and Views MH IF.indd 1223 26/10/09 10:09:0826/10/09 10:09:08
© 2009 Macmillan Publishers Limited. All rights reserved