,3 Ovarian Carcinoma Is Driven by Genomic Gains and...
14
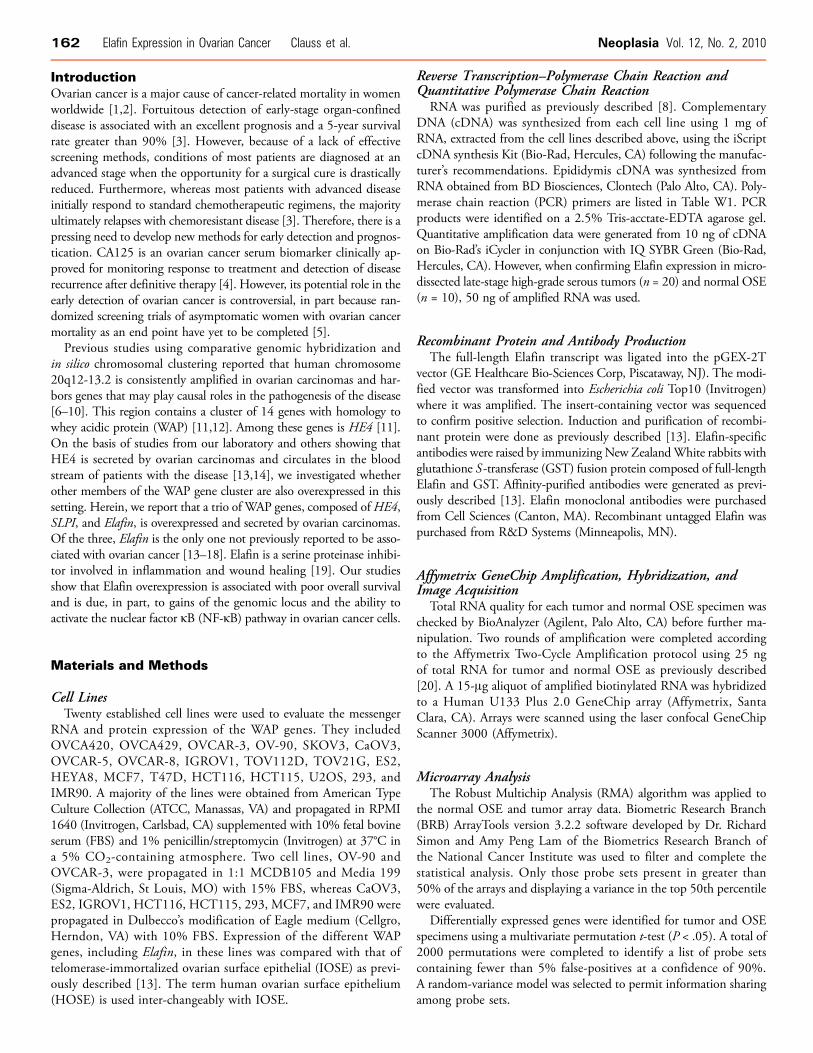
Overexpression of Elafin in Ovarian Carcinoma Is Driven by Genomic Gains and Activation of the Nuclear Factor κB Pathway and Is Associated with Poor Overall Survival 1,2 Adam Clauss * ,†,3 , Vivian Ng * ,3 , Joyce Liu * ,† , Huiying Piao*, Moises Russo* ,† , Natalie Vena ‡ , Qing Sheng †,§ , Michelle S. Hirsch †,¶ , Tomas Bonome # , Ursula Matulonis * ,† , Azra H. Ligon †,‡,¶ , Michael J. Birrer †, ** and Ronny Drapkin* ,†,‡,¶ *Dana-Farber Cancer Institute, Department of Medical Oncology, Boston, MA, USA; † Harvard Medical School, Boston, MA, USA; ‡ Dana-Farber Cancer Institute, Center for Molecular Oncologic Pathology, Boston, MA, USA; § Dana-Farber Cancer Institute, Department of Cancer Biology, Boston, MA, USA; ¶ Brigham and Women’s Hospital, Department of Pathology, Boston, MA, USA; # National Institutes of Health, Molecular Mechanisms Section, Bethesda, MD, USA; ** Massachusetts General Hospital, Department of Medicine, Boston, MA, USA Abstract Ovarian cancer is a leading cause of cancer mortality in women. The aim of this study was to elucidate whether whey acidic protein (WAP) genes on chromosome 20q13.12, a region frequently amplified in this cancer, are expressed in serous carcinoma, the most common form of the disease. Herein, we report that a trio of WAP genes (HE4, SLPI, and Elafin) is overexpressed and secreted by serous ovarian carcinomas. To our knowledge, this is the first report linking Elafin to ovarian cancer. Fluorescence in situ hybridization analysis of primary tumors demonstrates genomic gains of the Elafin locus in a majority of cases. In addition, a combination of peptidomimetics, RNA interference, and chromatin immunoprecipitation experiments shows that Elafin expression can be transcriptionally upregulated by inflammatory cytokines through activation of the nuclear factor κB pathway. Importantly, using a clinically annotated tissue microarray composed of late-stage, high-grade serous ovarian carcinomas, we show that Elafin expression correlates with poor overall survival. These results, combined with our observation that Elafin is secreted by ovarian tumors and is minimally expressed in normal tissues, suggest that Elafin may serve as a determinant of poor survival in this disease. Neoplasia (2010) 12, 161–172 Abbreviations: WAP, whey acidic protein; NF-κB, nuclear factor κB; TMA, tissue microarray; OSE, ovarian surface epithelium; IL-1β, interleukin 1β; RNAi, RNA interference Address all correspondence to: Ronny Drapkin, MD, PhD, Department of Medical Oncology, Dana-Farber Cancer Institute, JF215D, 44 Binney St, Boston, MA 02115. E-mail: [email protected] 1 This work was supported by National Cancer Institute (NCI) P50-CA105009 SPORE in Ovarian Cancer (Career Development Award, to R.D.), NCI K08 CA108748 (R.D.), NCI K12 CA87723 (J.L.), The Robert and Deborah First Fund (R.D.), The Randi and Joel Cutler Ovarian Cancer Research Fund (R.D.), The Fannie E. Ripple Foundation (R.D. and U.M.), Phi Beta Psi Sorority Charitable Trust (R.D.), Ovarian Cancer Research Fund (A.C. and R.D.), The Madeline Franchi Ovarian Cancer Foundation (A.C.), and the Harvard Medical School Center of Excellence in Women ’ s Health Award (M.S.H. and U.M.). 2 This article refers to supplementary materials, which are designated by Tables W1 and W2 and Figures W1 to W3 and are available online at www.neoplasia.com. 3 These authors contributed equally to this work. Received 7 September 2009; Revised 9 November 2009; Accepted 11 November 2009 Copyright © 2010 Neoplasia Press, Inc. All rights reserved 1522-8002/10/$25.00 DOI 10.1593/neo.91542 www.neoplasia.com Volume 12 Number 2 February 2010 pp. 161–172 161
Transcript of ,3 Ovarian Carcinoma Is Driven by Genomic Gains and...
Volume 12 Number 2 February 2010 pp. 161–172 161
AbbreviatiAddress alE-mail: ro1This worNCI K12and U.M.Harvard M2This artic3These auReceived 7
CopyrightDOI 10.1
www.neoplasia.com
Overexpression of Elafin inOvarian Carcinoma Is Driven byGenomic Gains and Activation ofthe Nuclear Factor κB Pathwayand Is Associated with PoorOverall Survival1,2
ons: WAP, whey acidic protein; NF-κB, nuclear factor κB; TMA, tissue microarl correspondence to: Ronny Drapkin, MD, PhD, Department of Medical [email protected] was supported by National Cancer Institute (NCI) P50-CA105009 SPORE inCA87723 (J.L.), The Robert and Deborah First Fund (R.D.), The Randi and Joe), Phi Beta Psi Sorority Charitable Trust (R.D.), Ovarian Cancer Research Fundedical School Center of Excellence in Women’s Health Award (M.S.H. and U.Mle refers to supplementary materials, which are designated by Tables W1 andthors contributed equally to this work.September 2009; Revised 9 November 2009; Accepted 11 November 2009
© 2010 Neoplasia Press, Inc. All rights reserved 1522-8002/10/$25.00593/neo.91542
Adam Clauss*,†,3, Vivian Ng*,3, Joyce Liu*,†,Huiying Piao*, Moises Russo*,†, Natalie Vena‡,Qing Sheng†,§, Michelle S. Hirsch†,¶,Tomas Bonome#, Ursula Matulonis*,†,Azra H. Ligon†,‡,¶, Michael J. Birrer†,**and Ronny Drapkin*,†,‡,¶
*Dana-Farber Cancer Institute, Department of MedicalOncology, Boston, MA, USA; †Harvard Medical School,Boston, MA, USA; ‡Dana-Farber Cancer Institute, Center forMolecular Oncologic Pathology, Boston, MA, USA;§Dana-Farber Cancer Institute, Department of CancerBiology, Boston, MA, USA; ¶Brigham and Women’sHospital, Department of Pathology, Boston, MA, USA;#National Institutes of Health, Molecular MechanismsSection, Bethesda, MD, USA; **Massachusetts GeneralHospital, Department of Medicine, Boston, MA, USA
AbstractOvarian cancer is a leading cause of cancer mortality in women. The aim of this study was to elucidate whether wheyacidic protein (WAP) genes on chromosome 20q13.12, a region frequently amplified in this cancer, are expressedin serous carcinoma, the most common form of the disease. Herein, we report that a trio of WAP genes (HE4, SLPI,and Elafin) is overexpressed and secreted by serous ovarian carcinomas. To our knowledge, this is the first reportlinking Elafin to ovarian cancer. Fluorescence in situ hybridization analysis of primary tumors demonstrates genomicgains of the Elafin locus in a majority of cases. In addition, a combination of peptidomimetics, RNA interference, andchromatin immunoprecipitation experiments shows that Elafin expression can be transcriptionally upregulated byinflammatory cytokines through activation of the nuclear factor κB pathway. Importantly, using a clinically annotatedtissue microarray composed of late-stage, high-grade serous ovarian carcinomas, we show that Elafin expressioncorrelates with poor overall survival. These results, combined with our observation that Elafin is secreted by ovariantumors and is minimally expressed in normal tissues, suggest that Elafin may serve as a determinant of poor survivalin this disease.
Neoplasia (2010) 12, 161–172
ray; OSE, ovarian surface epithelium; IL-1β, interleukin 1β; RNAi, RNA interferenceogy, Dana-Farber Cancer Institute, JF215D, 44 Binney St, Boston, MA 02115.
Ovarian Cancer (Career Development Award, to R.D.), NCI K08 CA108748 (R.D.),l Cutler Ovarian Cancer Research Fund (R.D.), The Fannie E. Ripple Foundation (R.D.(A.C. and R.D.), The Madeline Franchi Ovarian Cancer Foundation (A.C.), and the.).W2 and Figures W1 to W3 and are available online at www.neoplasia.com.
162 Elafin Expression in Ovarian Cancer Clauss et al. Neoplasia Vol. 12, No. 2, 2010
IntroductionOvarian cancer is a major cause of cancer-related mortality in womenworldwide [1,2]. Fortuitous detection of early-stage organ-confineddisease is associated with an excellent prognosis and a 5-year survivalrate greater than 90% [3]. However, because of a lack of effectivescreening methods, conditions of most patients are diagnosed at anadvanced stage when the opportunity for a surgical cure is drasticallyreduced. Furthermore, whereas most patients with advanced diseaseinitially respond to standard chemotherapeutic regimens, the majorityultimately relapses with chemoresistant disease [3]. Therefore, there is apressing need to develop new methods for early detection and prognos-tication. CA125 is an ovarian cancer serum biomarker clinically ap-proved for monitoring response to treatment and detection of diseaserecurrence after definitive therapy [4]. However, its potential role in theearly detection of ovarian cancer is controversial, in part because ran-domized screening trials of asymptomatic women with ovarian cancermortality as an end point have yet to be completed [5].
Previous studies using comparative genomic hybridization andin silico chromosomal clustering reported that human chromosome20q12-13.2 is consistently amplified in ovarian carcinomas and har-bors genes that may play causal roles in the pathogenesis of the disease[6–10]. This region contains a cluster of 14 genes with homology towhey acidic protein (WAP) [11,12]. Among these genes is HE4 [11].On the basis of studies from our laboratory and others showing thatHE4 is secreted by ovarian carcinomas and circulates in the bloodstream of patients with the disease [13,14], we investigated whetherother members of the WAP gene cluster are also overexpressed in thissetting. Herein, we report that a trio of WAP genes, composed ofHE4,SLPI, and Elafin, is overexpressed and secreted by ovarian carcinomas.Of the three, Elafin is the only one not previously reported to be asso-ciated with ovarian cancer [13–18]. Elafin is a serine proteinase inhibi-tor involved in inflammation and wound healing [19]. Our studiesshow that Elafin overexpression is associated with poor overall survivaland is due, in part, to gains of the genomic locus and the ability toactivate the nuclear factor κB (NF-κB) pathway in ovarian cancer cells.
Materials and Methods
Cell LinesTwenty established cell lines were used to evaluate the messenger
RNA and protein expression of the WAP genes. They includedOVCA420, OVCA429, OVCAR-3, OV-90, SKOV3, CaOV3,OVCAR-5, OVCAR-8, IGROV1, TOV112D, TOV21G, ES2,HEYA8, MCF7, T47D, HCT116, HCT115, U2OS, 293, andIMR90. A majority of the lines were obtained from American TypeCulture Collection (ATCC, Manassas, VA) and propagated in RPMI1640 (Invitrogen, Carlsbad, CA) supplemented with 10% fetal bovineserum (FBS) and 1% penicillin/streptomycin (Invitrogen) at 37°C ina 5% CO2-containing atmosphere. Two cell lines, OV-90 andOVCAR-3, were propagated in 1:1 MCDB105 and Media 199(Sigma-Aldrich, St Louis, MO) with 15% FBS, whereas CaOV3,ES2, IGROV1, HCT116, HCT115, 293, MCF7, and IMR90 werepropagated in Dulbecco’s modification of Eagle medium (Cellgro,Herndon, VA) with 10% FBS. Expression of the different WAPgenes, including Elafin, in these lines was compared with that oftelomerase-immortalized ovarian surface epithelial (IOSE) as previ-ously described [13]. The term human ovarian surface epithelium(HOSE) is used inter-changeably with IOSE.
Reverse Transcription–Polymerase Chain Reaction andQuantitative Polymerase Chain Reaction
RNA was purified as previously described [8]. ComplementaryDNA (cDNA) was synthesized from each cell line using 1 mg ofRNA, extracted from the cell lines described above, using the iScriptcDNA synthesis Kit (Bio-Rad, Hercules, CA) following the manufac-turer’s recommendations. Epididymis cDNA was synthesized fromRNA obtained from BD Biosciences, Clontech (Palo Alto, CA). Poly-merase chain reaction (PCR) primers are listed in Table W1. PCRproducts were identified on a 2.5% Tris-acctate-EDTA agarose gel.Quantitative amplification data were generated from 10 ng of cDNAon Bio-Rad’s iCycler in conjunction with IQ SYBR Green (Bio-Rad,Hercules, CA). However, when confirming Elafin expression in micro-dissected late-stage high-grade serous tumors (n = 20) and normal OSE(n = 10), 50 ng of amplified RNA was used.
Recombinant Protein and Antibody ProductionThe full-length Elafin transcript was ligated into the pGEX-2T
vector (GE Healthcare Bio-Sciences Corp, Piscataway, NJ). The modi-fied vector was transformed into Escherichia coli Top10 (Invitrogen)where it was amplified. The insert-containing vector was sequencedto confirm positive selection. Induction and purification of recombi-nant protein were done as previously described [13]. Elafin-specificantibodies were raised by immunizing New ZealandWhite rabbits withglutathione S -transferase (GST) fusion protein composed of full-lengthElafin and GST. Affinity-purified antibodies were generated as previ-ously described [13]. Elafin monoclonal antibodies were purchasedfrom Cell Sciences (Canton, MA). Recombinant untagged Elafin waspurchased from R&D Systems (Minneapolis, MN).
Affymetrix GeneChip Amplification, Hybridization, andImage Acquisition
Total RNA quality for each tumor and normal OSE specimen waschecked by BioAnalyzer (Agilent, Palo Alto, CA) before further ma-nipulation. Two rounds of amplification were completed accordingto the Affymetrix Two-Cycle Amplification protocol using 25 ngof total RNA for tumor and normal OSE as previously described[20]. A 15-μg aliquot of amplified biotinylated RNA was hybridizedto a Human U133 Plus 2.0 GeneChip array (Affymetrix, SantaClara, CA). Arrays were scanned using the laser confocal GeneChipScanner 3000 (Affymetrix).
Microarray AnalysisThe Robust Multichip Analysis (RMA) algorithm was applied to
the normal OSE and tumor array data. Biometric Research Branch(BRB) ArrayTools version 3.2.2 software developed by Dr. RichardSimon and Amy Peng Lam of the Biometrics Research Branch ofthe National Cancer Institute was used to filter and complete thestatistical analysis. Only those probe sets present in greater than50% of the arrays and displaying a variance in the top 50th percentilewere evaluated.
Differentially expressed genes were identified for tumor and OSEspecimens using a multivariate permutation t-test (P < .05). A total of2000 permutations were completed to identify a list of probe setscontaining fewer than 5% false-positives at a confidence of 90%.A random-variance model was selected to permit information sharingamong probe sets.
Neoplasia Vol. 12, No. 2, 2010 Elafin Expression in Ovarian Cancer Clauss et al. 163
Immunoblot AnalysisWestern blots were done as previously described [13]. All blots
were developed using HRP Oxidizing and Luminol Solutions (BostonBioproducts, Worcester, MA) and analyzed on the FlourChem HD2imaging system (Alpha Innotech, San Leandro, CA).
RNA InterferenceKnockdown ofNF-κB activity was achieved by targeting the p65 sub-
unit with an small interfering RNA (siRNA) SMARTpool containingfour individual siRNA against p65 (Upstate/Millipore, Charlottesville,VA). The SMARTpool sequences are 5′-GAUGAGAUCUUCCU-ACUGU, 5′-GGAUUGAGGAGAAACGUAA, 5′-CUCAAGAU-CUGCCGAGUGA, and 5′-GGCUAUAACUCGCCUAGUG andare collectively labeled as siRNA p65(1). A second independent siRNAagainst p65 (5′-GCUGAAGUGCAUCCAAAGGTT) was used as acontrol for off-target effects (Cell Signaling, Danvers, MA) and waslabeled as siRNA p65(2). An NF-κB p65-specific antibody (sc-372;Santa Cruz Technologies, Santa Cruz, CA) was used to analyze totalcell extracts from cells treated with the p65 SMARTpool versus controlsiRNA. Equal protein loading was confirmed by immunostaining ofglyceraldehyde-3-phosphate dehydrogenase (Abcam, Cambridge, MA).
Tumor-Normal Northern Blot AnalysisMembranes loaded with RNA from matched tumor and normal
tissue samples were purchased from Clontech (Cancer Profiling Arrays Iand II; Mountain View, CA). An Elafin-specific probe was generated byrandom priming of Elafin cDNA using TaKaRa Ladderman LabelingKit (Takara Bio, Inc, Madison, WI) according to the manufacturer’s in-structions. Hybridization of the membranes was carried out as describedin the Cancer Profiling Array manual. The labeled membranes wereplaced in a phosphor screen cassette for 14 days before it was scannedon a Molecular Dynamics’ STORM860 system (GE Healthcare Bio-Sciences Corp). The phosphoimage was analyzed using ImageQuantv1.2 (Molecular Dynamics; GE Healthcare Bio-Sciences Corp).
Chromatin ImmunoprecipitationThe nucleotide sequence located 1 kb upstream of the start codon of
Elafin was analyzed using a combination of algorithms that can predictpotential transcription factor binding sites (TESS http://www.cbil.upenn.edu/cgi-bin/tess/tess and AliBaba http://darwin.nmsu.edu/~molb470/fall2003/Projects/solorz/aliBaba_2_1.htm) and previouslypublished data [21,22]. We identified three potential NF-κB bindingsites. TOV21G and OVCAR8 cells were cultured to approximately70% confluence before the medium was changed to serum-free me-dium. Half of the plates were treated with 5 ng/ml of interleukin 1β(IL-1β) for 2 hours. The chromatin immunoprecipitation (ChIP) assaywas done as previously described [23]. Briefly, we cross-linked cellsusing formaldehyde (1%) for 10minutes at 37°C.The cells werewashedand lysed before theywere sonicated (Misonix Sonicator 3000; Misonix,Inc, Farmingdale, NY) three times for 10 seconds at maximum outputto shear the DNA. DNA fragment size was confirmed at 0.5 to 1.0 kbby electrophoresis. Chromatin DNA was collected by centrifugationand an input sample was collected and stored in −80°C. Supernatantwas diluted 1:10 in 1% Triton X-100, 2 mM EDTA, 150 mM NaCl,20 mM Tris-HCl, pH 8.1 and incubated with either 1 μg of p65 anti-body or 1 μg of anti–Golgi antibody (58K9; Abcam) and protein Abeads overnight at 4°C. The beads were then washed six times in radio-immunoprecipitation buffer (Boston Bioproducts) and two times in
Tris-EDTA buffer before the samples were de–cross-linked in 1%SDS, 0.1 M NaHCO3 at 65°C for 14 hours. De–cross-linked sampleswere purified using Qiagen’s spin columns according to manufacturer’sinstructions (Qiagen, Valencia, CA). PCR (at 95°C for 5 minutes fol-lowed by 35 cycles at 95°C for 30 seconds, at 60°C for 30 seconds, at72°C for 30 seconds, followed by 72°C for 5 minutes) was performedon (2 μg of total DNA) samples collected before IP(input) as well asafter p65-specific and control immunoprecipitation. Primers were de-signed to span each of the putative NF-κB binding sites as well as twocontrol regions located 2 kb upstream and 2 kb downstream of the Ela-fin transcription start site. Primer sequences are reported in Table W2.
Tissue Samples and ImmunohistochemistryAfter institutional review board approval, sections of formalin-
fixed, paraffin-embedded (FFPE) human epididymis were obtainedfrom the Department of Pathology at the Brigham and Women’s Hos-pital (Boston, MA) to evaluate the expression of Elafin in this tissue andfor subsequent use as positive control tissue. Elafin expression in normalhuman tissues was analyzed by immunohistochemistry (IHC) as previ-ously described using a collection of normal human tissue blocks [13],whereas expression in ovarian and non–ovarian tumors was analyzedusing high-density tissue microarrays (TMAs) made in-house (see below)or purchased from Biomax US (Rockville, MD). The Elafin affinity–purified rabbit antibody was used at a dilution of 1:1500 with heat-induced epitope retrieval as previously described [13]. Negative controlsincluded protein A–purified preimmune serum, anti-GST antibodiespurified as a byproduct of Elafin antibody production, and anti-Elafinantibodies preincubated with recombinant GST-Elafin protein beforeIHC. None of these controls generated a positive signal in IHC. HE4localization using affinity-purified antibodies was done as previouslydescribed [13]. Slides were counterstained with Mayer hematoxylin.
Primary Tumor CellsWith institutional review board approval, primary ovarian carcinoma
cells (DF lines) were isolated directly from peritoneal paracentesis ofpatients with advanced-stage ovarian cancer at the time of initial cyto-reductive surgery. Red blood cells were lysed as previously described[24], and the samples were enriched for tumor cells either by using im-munomagnetic beads coupled to EpCAM antibodies (Dynal/Invitrogen)or by filtration using a 40-μm nylon cell strainer (BD Falcon, San Jose,CA) to isolate tumor cell spheres. Both methods enriched for tumorcells but the yield with the cell strainer was significantly better than withthemagnetic EpCAMbeads. In all cases, the epithelial nature of the cellswas confirmed by EpCAM and HE4 antibody immunostaining as wellas reverse transcription–PCR (RT-PCR) detection of CK7. For thisstudy, we used only primary lines that were greater than 80% tumorpure after enrichment.
High-Density TMAA TMA was constructed from 134 cases of high-grade late-stage
ovarian papillary serous carcinoma who underwent primary cyto-reductive surgery at Brigham and Women’s Hospital. Cases were iden-tified by review of all pathology reports between January 1, 1999, andDecember 31, 2005, in the Brigham and Women’s Hospital databasethat included a diagnosis of “ovarian cancer.” The rationale for limitingthe enrollment date to the year 1999 is that is when taxol became thestandard of care, and the cutoff year of 2005 was established to allow
164 Elafin Expression in Ovarian Cancer Clauss et al. Neoplasia Vol. 12, No. 2, 2010
adequate follow-up time. All cases that met the eligibility criteria of In-ternational Federation of Gynecology and Obstetrics (FIGO) stage IIIor IV high-grade papillary serous ovarian carcinoma, pathology blocksavailable for generation of a TMA, and age requirements for one of twocohorts (≤55 years or ≥65 years of age at diagnosis) were included in theTMA (62 cases were from women ≤55 years of age, and 72 cases werefrom women ≥65 years of age). Patients with known BRCA mutationsor with a history of another malignancy (excepting nonmelanoma skincancers or noninvasive endometrial cancers) in the previous 5 years wereexcluded. Hematoxylin and eosin slides were reviewed to confirm theoriginal diagnosis and to identify the most appropriate area of tumorfor further studies. Corresponding FFPE tissue from each case was usedto construct four high-density TMAs: two TMAs containing samplesfrom the younger cohort and two TMAs containing samples from theolder cohort. Four cores of tissue were taken from each case, with eachcore 0.8 mm in diameter. Five-micrometer-thick, unstained sectionsof the TMAs, as well as 5-μm-thick, unstained “whole mount” sec-tions from the formalin-fixed paraffin-embedded tissue, were used forimmunohistochemical analysis, and the findings were correlated withclinical data (age, optimal vs suboptimal cytoreduction status, platinumsensitivity, and overall survival) abstracted from the patient’s medical re-cords. Optimal surgical cytoreduction was defined as residual tumor1 cm or less in diameter, and the duration of overall survival was deter-mined from the date of diagnosis to either death or censored by the dateof last follow-up. All pathology specimens and clinical data were col-lected under the approval of the institutional review board.
Fluorescence In Situ HybridizationFour-micrometer whole-mount sections of Elafin-positive high-grade
papillary serous carcinoma were mounted on standard glass slides andbaked at 60°C for at least 2 hours, then deparaffinized and digested usingmethods described previously [25]. The following DNA fosmid probeswere cohybridized: G248P8772D4 and G248P82920B4 (Spectrum-Green), which map to 20q13.12, the latter clone includes the entirecoding sequence of PI3/Elafin, and D20Z1 (SpectrumOrange), whichmaps to 20p11.1-q11.1. The D20Z1 probe was purchased from AbbottMolecular/Vysis, Inc (Des Plaines, IL). Both fosmid probes were ob-tained from CHORI (www.chori.org), direct-labeled using nick transla-tion and precipitated using standard protocols, and cohybridized as acontig probe. Final (total) fosmid probe concentrationwas approximately50 to 100 ng/μl. D20Z1 final probe concentration followed manufac-turer’s recommendations.
Tissue sections and probes were codenatured, hybridized at least16 hours at 37°C in a darkened humid chamber, washed in 2×SSC at 70°C for 10 minutes, rinsed in room temperature 2× SSC,and counterstained with 4′,6-diamidino-2-phenylindole (AbbottMolecular/Vysis, Inc). Slides were imaged using an Olympus BX51fluorescence microscope (Olympus, Center Valley, PA). Individualimages were captured using an Applied Imaging system running Cyto-Vision Genus version 3.9 (Applied Imaging, Grand Rapids, MI), andall aberrations detected by fluorescence in situ hybridization (FISH)were reviewed and confirmed by a cytogeneticist (A.L.).
NEMO-Binding Domain (NBD) AssayCells were cultured until they reached 60% confluence, after which
the medium was changed to FBS-depleted. The cells were incubatedwith 25 μM NEMO-Binding Domain (NBD) peptide (Calbiochem/EMD Biosciences, San Diego, CA) or scrambled peptide (Calbiochem/EMD Biosciences) for 24 hours before the addition of 5 ng/ml of
IL-1β. After treatment with IL-1β, the cells were cultured for an ad-ditional 2 hours before RNA was harvested, and Elafin expressionwas monitored by quantitative RT-PCR. Scrambled peptides as wellas nontreated cells were used as negative control.
Statistical AnalysisClinical cases of late-stage ovarian serous carcinoma were scored for
Elafin expression according to the following scheme: 0 = no positivecells, +1 = 1% to 5% positive cells, +2 = 6% to 50% positive cellsand +3 = more than 50% positive cells (Figure 4). Samples were alsoscored from 1 to 3 depending on the staining intensity. All scoring wasblinded and performed by two independent pathologists (R.D. andM.S.H.). The statistical analysis was done by a third party ( J.L.) withno preconception of potential outcome. Before analysis of any survivaldata, cases were divided into a high-Elafin expressor group (scores of +2or +3) and a low Elafin expressor group (scores of 0 or +1). Kaplan-Meier curves were plotted for these two groups to assess overall survival,and the difference between the curves was evaluated using the log-ranktest. An estimate of the hazard ratio (HR) was calculated with a Coxproportional hazards model. Statistical analysis was performed usingSAS version 9.1 software (SAS, Cary, NC).
Results
Elafin, HE4, and SLPI Constitute a Trio of OverexpressedWAP Genes in Ovarian Cancer
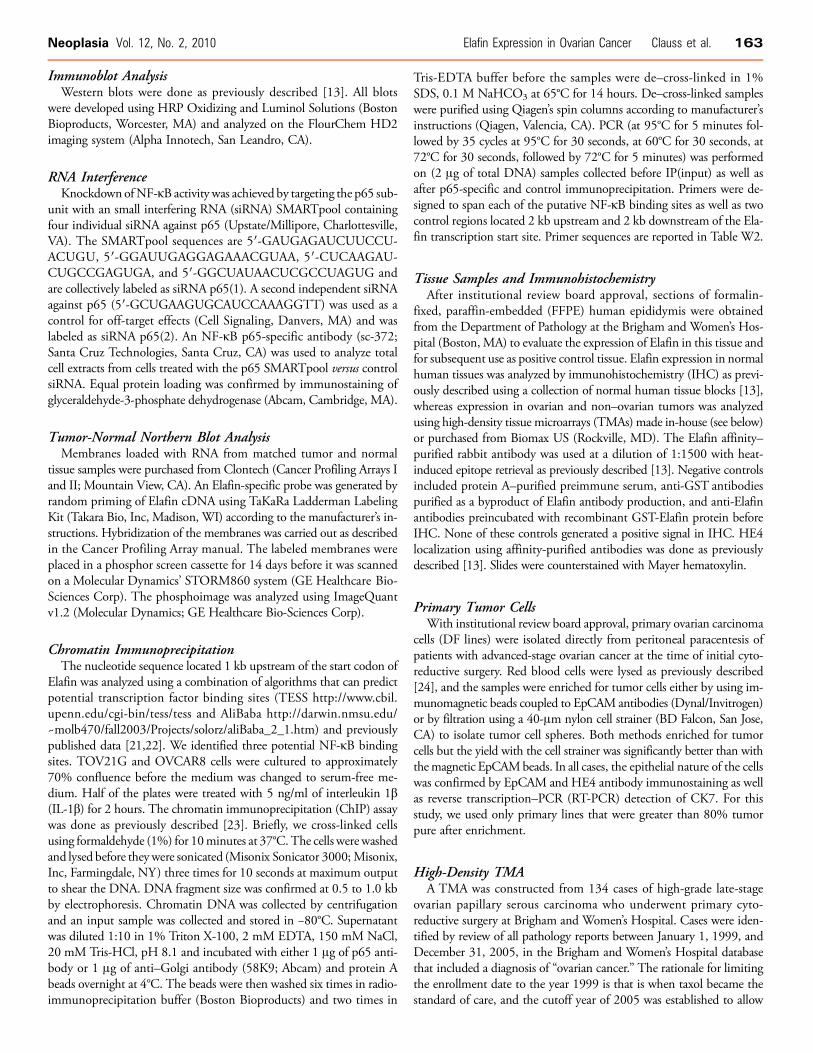
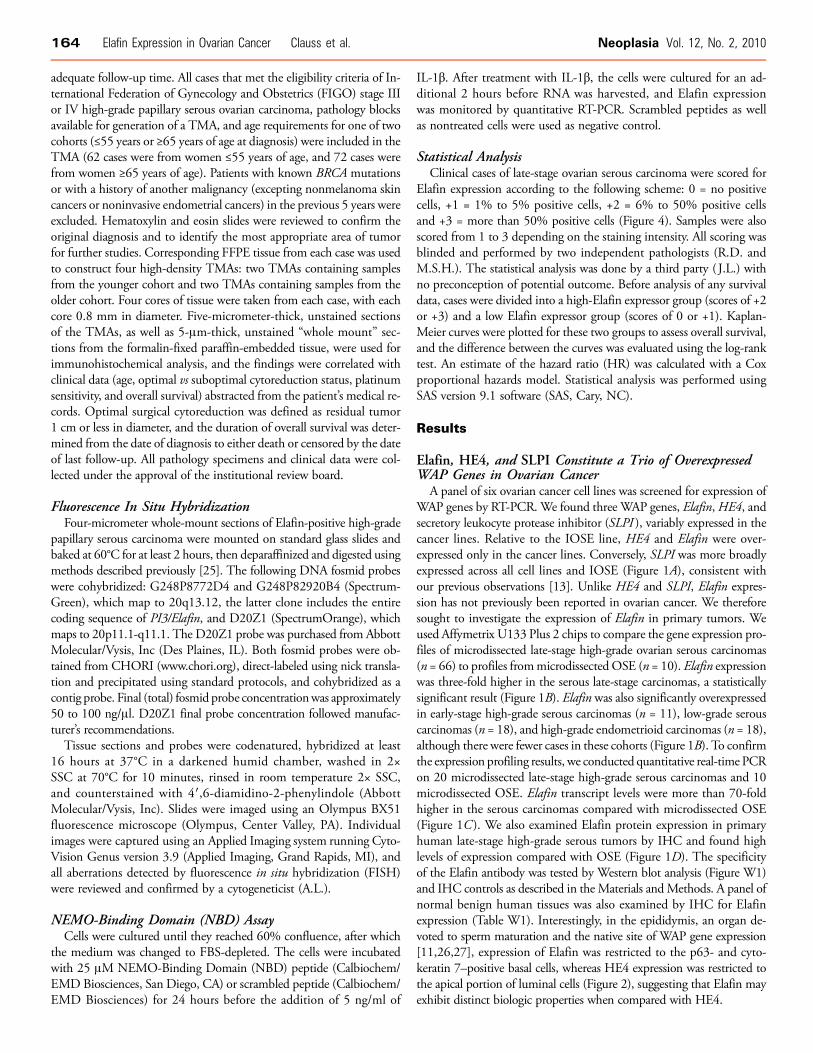
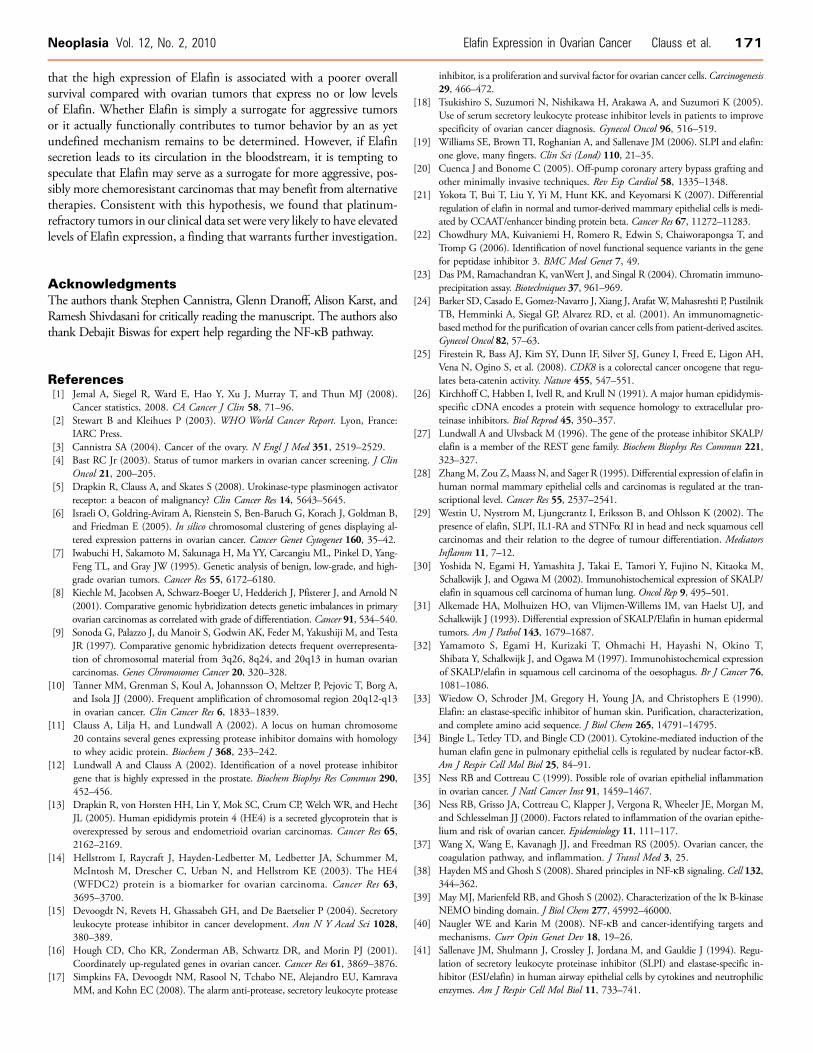
A panel of six ovarian cancer cell lines was screened for expression ofWAP genes by RT-PCR. We found three WAP genes, Elafin,HE4, andsecretory leukocyte protease inhibitor (SLPI ), variably expressed in thecancer lines. Relative to the IOSE line, HE4 and Elafin were over-expressed only in the cancer lines. Conversely, SLPI was more broadlyexpressed across all cell lines and IOSE (Figure 1A), consistent withour previous observations [13]. Unlike HE4 and SLPI, Elafin expres-sion has not previously been reported in ovarian cancer. We thereforesought to investigate the expression of Elafin in primary tumors. Weused Affymetrix U133 Plus 2 chips to compare the gene expression pro-files of microdissected late-stage high-grade ovarian serous carcinomas(n = 66) to profiles frommicrodissected OSE (n = 10). Elafin expressionwas three-fold higher in the serous late-stage carcinomas, a statisticallysignificant result (Figure 1B). Elafin was also significantly overexpressedin early-stage high-grade serous carcinomas (n = 11), low-grade serouscarcinomas (n = 18), and high-grade endometrioid carcinomas (n = 18),although there were fewer cases in these cohorts (Figure 1B). To confirmthe expression profiling results, we conducted quantitative real-time PCRon 20 microdissected late-stage high-grade serous carcinomas and 10microdissected OSE. Elafin transcript levels were more than 70-foldhigher in the serous carcinomas compared with microdissected OSE(Figure 1C ). We also examined Elafin protein expression in primaryhuman late-stage high-grade serous tumors by IHC and found highlevels of expression compared with OSE (Figure 1D). The specificityof the Elafin antibody was tested by Western blot analysis (Figure W1)and IHC controls as described in the Materials andMethods. A panel ofnormal benign human tissues was also examined by IHC for Elafinexpression (Table W1). Interestingly, in the epididymis, an organ de-voted to sperm maturation and the native site of WAP gene expression[11,26,27], expression of Elafin was restricted to the p63- and cyto-keratin 7–positive basal cells, whereas HE4 expression was restricted tothe apical portion of luminal cells (Figure 2), suggesting that Elafin mayexhibit distinct biologic properties when compared with HE4.
Figure 1. A trio of WAP genes is overexpressed in ovarian carcinomas. (A) Expression of the WAP genes was determined by semiquanti-tative RT-PCR. Epididymis served as a positive control for WAP expression, and telomerase IOSE served as a cell-of-origin control. Elafin,SLPI, and HE4 are overexpressed in a panel of ovarian carcinomas. (B) Gene expression profiling of Elafin expression in different types ofovarian carcinomas and normal OSE. The tumors are divided into five groups: late-stage high-grade (LSHG) serous, early-stage high-grade(ESHG) serous, low-grade (LG) serous, and LSHG endometrioid. Elafin expression is significantly higher in all tumors compared with OSE.(C) Quantitative RT-PCR of Elafin expression in microdissected LSHG serous carcinomas (n= 20) compared with microdissected OSE (n=10). LSHG serous cancers show a 70-fold increase of Elafin expression compared with OSE. (D) Expression of Elafin in OSE and serouscarcinoma. Representative images from a panel of 8 normal ovaries and 20 late-stage high-grade serous carcinomas immunostained forElafin. Original magnification, ×20.
Figure 2. Expression of Elafin in human epididymis. IHC was performed on epididymis tissue using antibodies against Elafin, HE4, p63,and cytokeratin 7 (CK7). Elafin expression is limited to the p63- and CK7-positive basal cells, whereas HE4 is expressed in the luminalcell compartment.
Neoplasia Vol. 12, No. 2, 2010 Elafin Expression in Ovarian Cancer Clauss et al. 165
166 Elafin Expression in Ovarian Cancer Clauss et al. Neoplasia Vol. 12, No. 2, 2010
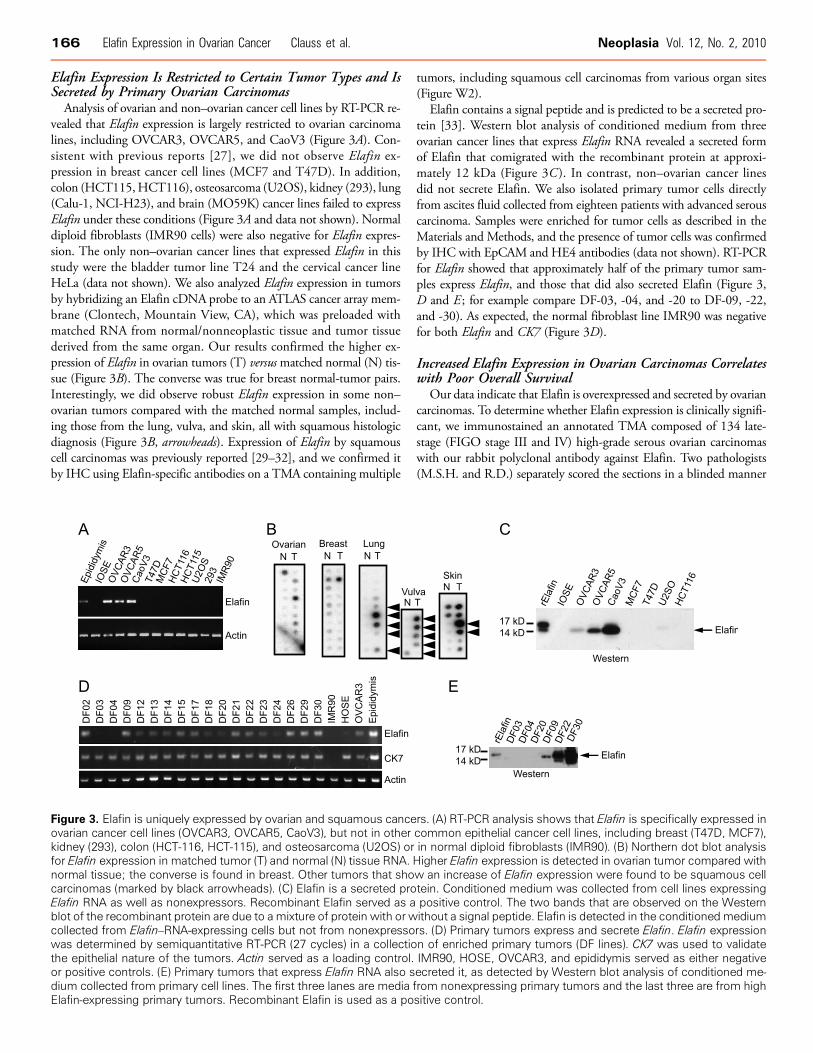
Elafin Expression Is Restricted to Certain Tumor Types and IsSecreted by Primary Ovarian Carcinomas
Analysis of ovarian and non–ovarian cancer cell lines by RT-PCR re-vealed that Elafin expression is largely restricted to ovarian carcinomalines, including OVCAR3, OVCAR5, and CaoV3 (Figure 3A). Con-sistent with previous reports [27], we did not observe Elafin ex-pression in breast cancer cell lines (MCF7 and T47D). In addition,colon (HCT115,HCT116), osteosarcoma (U2OS), kidney (293), lung(Calu-1, NCI-H23), and brain (MO59K) cancer lines failed to expressElafin under these conditions (Figure 3A and data not shown). Normaldiploid fibroblasts (IMR90 cells) were also negative for Elafin expres-sion. The only non–ovarian cancer lines that expressed Elafin in thisstudy were the bladder tumor line T24 and the cervical cancer lineHeLa (data not shown). We also analyzed Elafin expression in tumorsby hybridizing an Elafin cDNA probe to an ATLAS cancer array mem-brane (Clontech, Mountain View, CA), which was preloaded withmatched RNA from normal/nonneoplastic tissue and tumor tissuederived from the same organ. Our results confirmed the higher ex-pression of Elafin in ovarian tumors (T) versusmatched normal (N) tis-sue (Figure 3B). The converse was true for breast normal-tumor pairs.Interestingly, we did observe robust Elafin expression in some non–ovarian tumors compared with the matched normal samples, includ-ing those from the lung, vulva, and skin, all with squamous histologicdiagnosis (Figure 3B, arrowheads). Expression of Elafin by squamouscell carcinomas was previously reported [29–32], and we confirmed itby IHC using Elafin-specific antibodies on a TMA containing multiple
Figure 3. Elafin is uniquely expressed by ovarian and squamous canceovarian cancer cell lines (OVCAR3, OVCAR5, CaoV3), but not in otherkidney (293), colon (HCT-116, HCT-115), and osteosarcoma (U2OS) orfor Elafin expression in matched tumor (T) and normal (N) tissue RNA.normal tissue; the converse is found in breast. Other tumors that shocarcinomas (marked by black arrowheads). (C) Elafin is a secreted proElafin RNA as well as nonexpressors. Recombinant Elafin served as ablot of the recombinant protein are due to a mixture of protein with or wcollected from Elafin–RNA-expressing cells but not from nonexpressowas determined by semiquantitative RT-PCR (27 cycles) in a collectiothe epithelial nature of the tumors. Actin served as a loading control.or positive controls. (E) Primary tumors that express Elafin RNA also sdium collected from primary cell lines. The first three lanes are mediaElafin-expressing primary tumors. Recombinant Elafin is used as a po
tumors, including squamous cell carcinomas from various organ sites(Figure W2).
Elafin contains a signal peptide and is predicted to be a secreted pro-tein [33]. Western blot analysis of conditioned medium from threeovarian cancer lines that express Elafin RNA revealed a secreted formof Elafin that comigrated with the recombinant protein at approxi-mately 12 kDa (Figure 3C ). In contrast, non–ovarian cancer linesdid not secrete Elafin. We also isolated primary tumor cells directlyfrom ascites fluid collected from eighteen patients with advanced serouscarcinoma. Samples were enriched for tumor cells as described in theMaterials and Methods, and the presence of tumor cells was confirmedby IHC with EpCAM and HE4 antibodies (data not shown). RT-PCRfor Elafin showed that approximately half of the primary tumor sam-ples express Elafin, and those that did also secreted Elafin (Figure 3,D and E ; for example compare DF-03, -04, and -20 to DF-09, -22,and -30). As expected, the normal fibroblast line IMR90 was negativefor both Elafin and CK7 (Figure 3D).
Increased Elafin Expression in Ovarian Carcinomas Correlateswith Poor Overall Survival
Our data indicate that Elafin is overexpressed and secreted by ovariancarcinomas. To determine whether Elafin expression is clinically signifi-cant, we immunostained an annotated TMA composed of 134 late-stage (FIGO stage III and IV) high-grade serous ovarian carcinomaswith our rabbit polyclonal antibody against Elafin. Two pathologists(M.S.H. and R.D.) separately scored the sections in a blinded manner
rs. (A) RT-PCR analysis shows that Elafin is specifically expressed incommon epithelial cancer cell lines, including breast (T47D, MCF7),in normal diploid fibroblasts (IMR90). (B) Northern dot blot analysisHigher Elafin expression is detected in ovarian tumor compared withw an increase of Elafin expression were found to be squamous celltein. Conditioned medium was collected from cell lines expressingpositive control. The two bands that are observed on the Westernithout a signal peptide. Elafin is detected in the conditionedmediumrs. (D) Primary tumors express and secrete Elafin. Elafin expressionn of enriched primary tumors (DF lines). CK7 was used to validateIMR90, HOSE, OVCAR3, and epididymis served as either negativeecreted it, as detected by Western blot analysis of conditioned me-from nonexpressing primary tumors and the last three are from highsitive control.
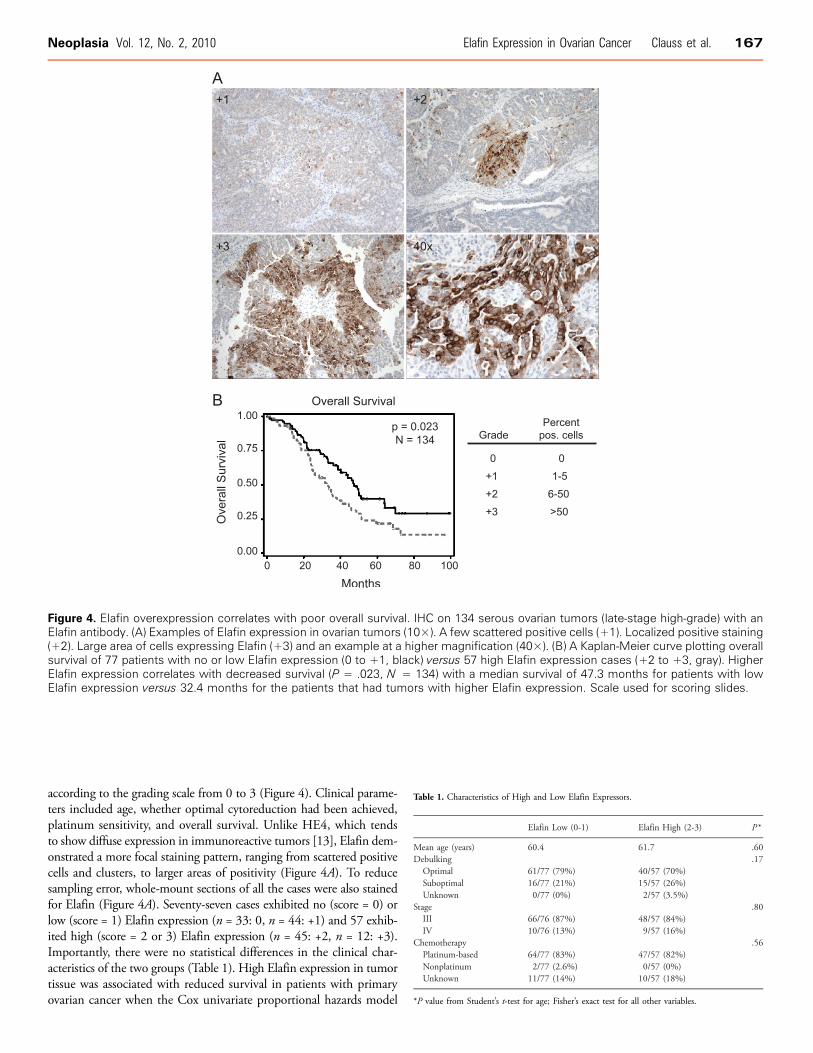
Figure 4. Elafin overexpression correlates with poor overall survival. IHC on 134 serous ovarian tumors (late-stage high-grade) with anElafin antibody. (A) Examples of Elafin expression in ovarian tumors (10×). A few scattered positive cells (+1). Localized positive staining(+2). Large area of cells expressing Elafin (+3) and an example at a higher magnification (40×). (B) A Kaplan-Meier curve plotting overallsurvival of 77 patients with no or low Elafin expression (0 to +1, black) versus 57 high Elafin expression cases (+2 to +3, gray). HigherElafin expression correlates with decreased survival (P = .023, N = 134) with a median survival of 47.3 months for patients with lowElafin expression versus 32.4 months for the patients that had tumors with higher Elafin expression. Scale used for scoring slides.
Neoplasia Vol. 12, No. 2, 2010 Elafin Expression in Ovarian Cancer Clauss et al. 167
according to the grading scale from 0 to 3 (Figure 4). Clinical parame-ters included age, whether optimal cytoreduction had been achieved,platinum sensitivity, and overall survival. Unlike HE4, which tendsto show diffuse expression in immunoreactive tumors [13], Elafin dem-onstrated a more focal staining pattern, ranging from scattered positivecells and clusters, to larger areas of positivity (Figure 4A). To reducesampling error, whole-mount sections of all the cases were also stainedfor Elafin (Figure 4A). Seventy-seven cases exhibited no (score = 0) orlow (score = 1) Elafin expression (n = 33: 0, n = 44: +1) and 57 exhib-ited high (score = 2 or 3) Elafin expression (n = 45: +2, n = 12: +3).Importantly, there were no statistical differences in the clinical char-acteristics of the two groups (Table 1). High Elafin expression in tumortissue was associated with reduced survival in patients with primaryovarian cancer when the Cox univariate proportional hazards model
Table 1. Characteristics of High and Low Elafin Expressors.
Elafin Low (0-1)
Elafin High (2-3) P *Mean age (years)
60.4 61.7 .60 Debulking .17 Optimal 61/77 (79%) 40/57 (70%) Suboptimal 16/77 (21%) 15/57 (26%) Unknown 0/77 (0%) 2/57 (3.5%)Stage
.80 III 66/76 (87%) 48/57 (84%) IV 10/76 (13%) 9/57 (16%)Chemotherapy
.56 Platinum-based 64/77 (83%) 47/57 (82%) Nonplatinum 2/77 (2.6%) 0/57 (0%) Unknown 11/77 (14%) 10/57 (18%)*P value from Student’s t-test for age; Fisher’s exact test for all other variables.
168 Elafin Expression in Ovarian Cancer Clauss et al. Neoplasia Vol. 12, No. 2, 2010
was applied, with a HR for death of 1.65 for patients with high Elafinexpression compared with low Elafin expression (95% confidenceinterval [CI], 1.07-2.54, P = .02). The relationship between Elafinexpression levels and overall survival was visualized by a Kaplan-Meierplot (Figure 4B) and demonstrated a poorer survival in patients with highElafin–expressing tumors (median survival, 32.4 months; 95%CI, 24.4-40.43 months) compared with those with no or low Elafin-expressingtumors (median survival, 47.3 months; 95% CI, 38.6-64.2 months).The P value for this difference was .02 by the log-rank test. Elafin re-mained significantly correlated with overall survival in a multivariatemodel incorporating age and debulking status (Table 2). Of note, al-though Elafin expression did not correlate with platinum sensitivity orresistance (defined as disease recurrence within 6 months of last receiptof platinum therapy; Table 1), 10 of 11 patients with primary platinum-refractory disease (defined as persistent disease or disease progressionwhile receiving platinum-based therapy) had elevated Elafin expression.This correlation was highly statistically significant (P = 8.4 × 10⁻⁶).
Genomic Gains Drive Elafin Expression in Ovarian CancersThe correlation between Elafin overexpression and patient outcome
prompted us to examine the nature of its overexpression. As described
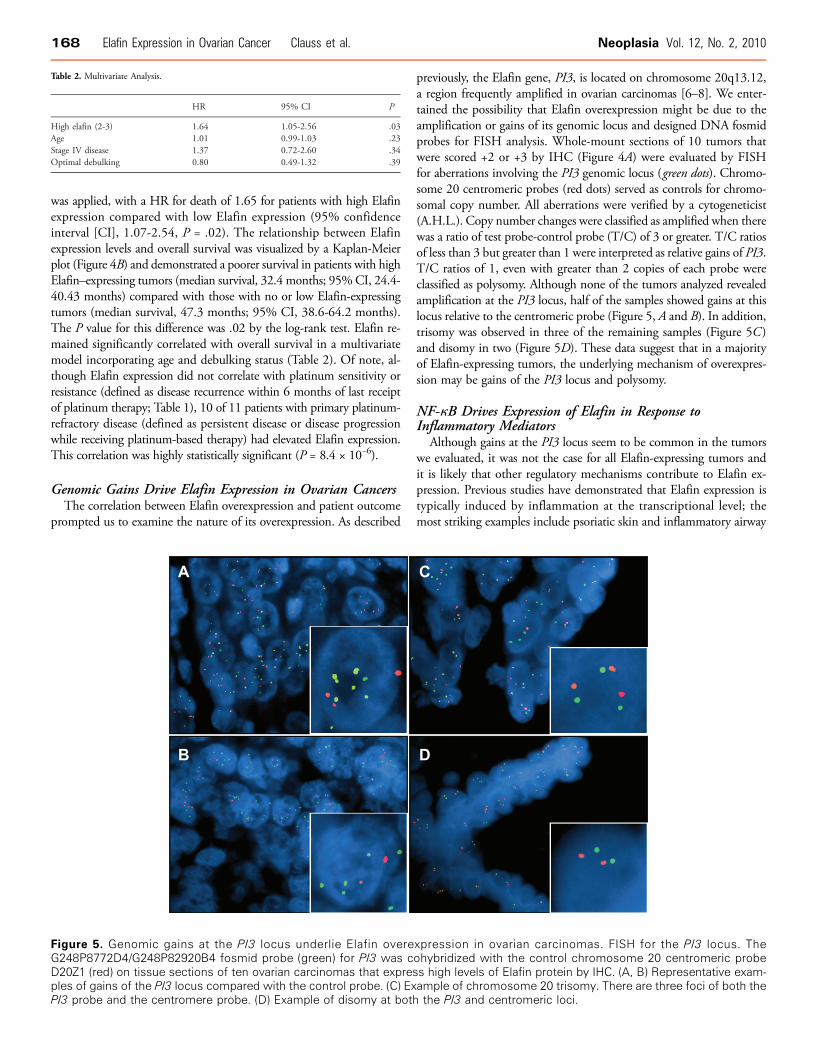
Figure 5. Genomic gains at the PI3 locus underlie Elafin overeG248P8772D4/G248P82920B4 fosmid probe (green) for PI3 was cD20Z1 (red) on tissue sections of ten ovarian carcinomas that expresples of gains of the PI3 locus compared with the control probe. (C) ExPI3 probe and the centromere probe. (D) Example of disomy at both
previously, the Elafin gene, PI3, is located on chromosome 20q13.12,a region frequently amplified in ovarian carcinomas [6–8]. We enter-tained the possibility that Elafin overexpression might be due to theamplification or gains of its genomic locus and designed DNA fosmidprobes for FISH analysis. Whole-mount sections of 10 tumors thatwere scored +2 or +3 by IHC (Figure 4A) were evaluated by FISHfor aberrations involving the PI3 genomic locus (green dots). Chromo-some 20 centromeric probes (red dots) served as controls for chromo-somal copy number. All aberrations were verified by a cytogeneticist(A.H.L.). Copy number changes were classified as amplified when therewas a ratio of test probe-control probe (T/C) of 3 or greater. T/C ratiosof less than 3 but greater than 1 were interpreted as relative gains of PI3.T/C ratios of 1, even with greater than 2 copies of each probe wereclassified as polysomy. Although none of the tumors analyzed revealedamplification at the PI3 locus, half of the samples showed gains at thislocus relative to the centromeric probe (Figure 5, A and B). In addition,trisomy was observed in three of the remaining samples (Figure 5C )and disomy in two (Figure 5D). These data suggest that in a majorityof Elafin-expressing tumors, the underlying mechanism of overexpres-sion may be gains of the PI3 locus and polysomy.
NF-κB Drives Expression of Elafin in Response toInflammatory Mediators
Although gains at the PI3 locus seem to be common in the tumorswe evaluated, it was not the case for all Elafin-expressing tumors andit is likely that other regulatory mechanisms contribute to Elafin ex-pression. Previous studies have demonstrated that Elafin expression istypically induced by inflammation at the transcriptional level; themost striking examples include psoriatic skin and inflammatory airway
Table 2. Multivariate Analysis.
HR
95% CI PHigh elafin (2-3)
1.64 1.05-2.56 .03 Age 1.01 0.99-1.03 .23 Stage IV disease 1.37 0.72-2.60 .34 Optimal debulking 0.80 0.49-1.32 .39xpression in ovarian carcinomas. FISH for the PI3 locus. Theohybridized with the control chromosome 20 centromeric probes high levels of Elafin protein by IHC. (A, B) Representative exam-ample of chromosome 20 trisomy. There are three foci of both thethe PI3 and centromeric loci.
Neoplasia Vol. 12, No. 2, 2010 Elafin Expression in Ovarian Cancer Clauss et al. 169
disease [19,34]. Given the link between chronic inflammation andovarian cancer pathogenesis [35–37], we examined whether inflamma-tion might contribute to Elafin expression in ovarian cancer. A panel of13 established ovarian cancer cell lines was screened by RT-PCR. Sevenlines were found to strongly express Elafin, whereas six demonstrated
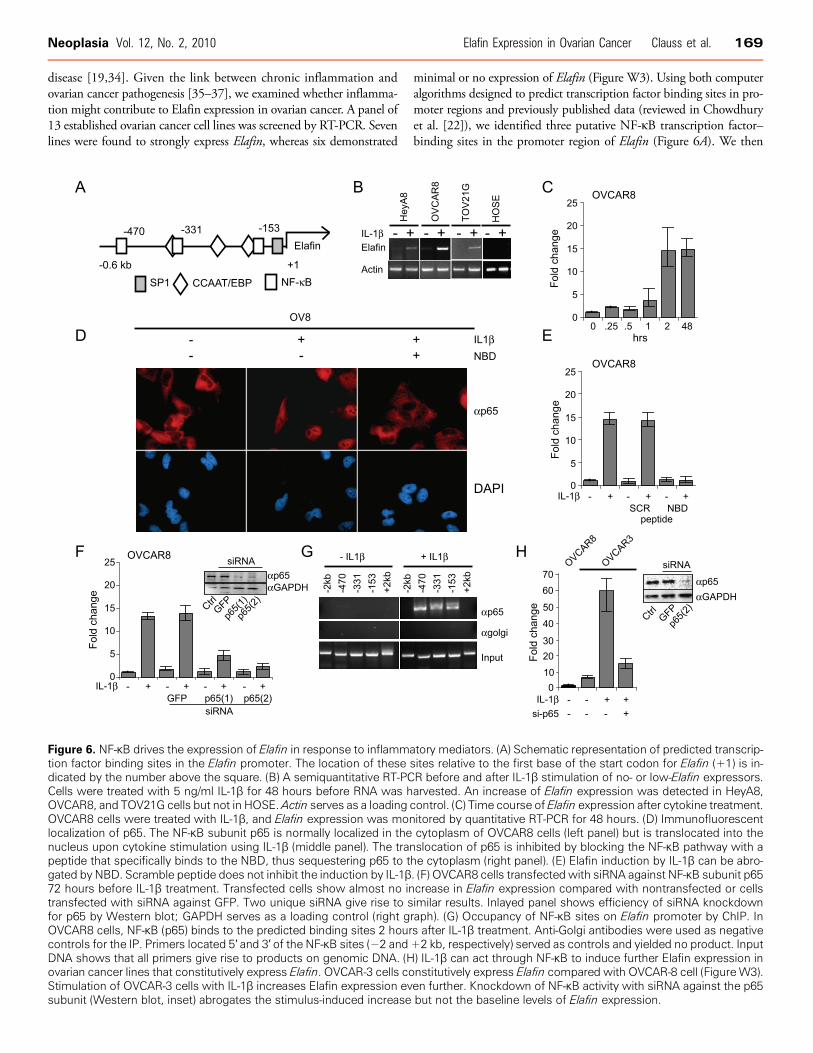
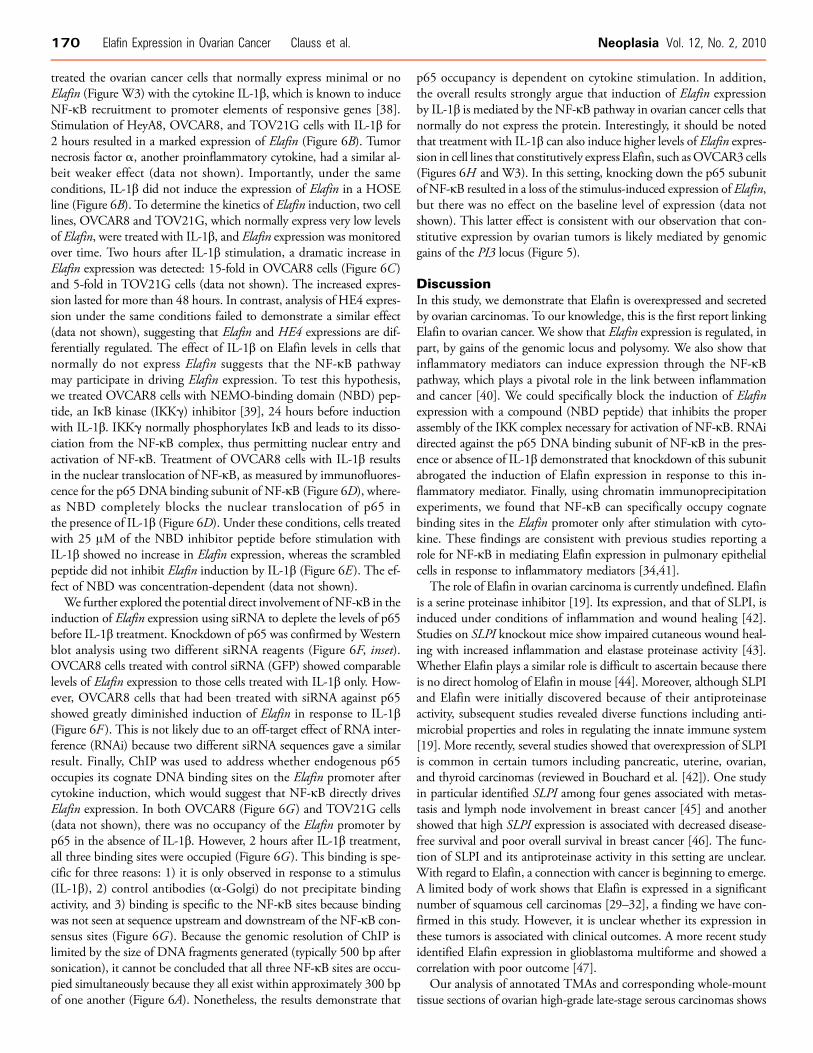
Figure 6. NF-κB drives the expression of Elafin in response to inflammation factor binding sites in the Elafin promoter. The location of thesedicated by the number above the square. (B) A semiquantitative RT-PCCells were treated with 5 ng/ml IL-1β for 48 hours before RNA was hOVCAR8, and TOV21G cells but not in HOSE.Actin serves as a loadingOVCAR8 cells were treated with IL-1β, and Elafin expression was monlocalization of p65. The NF-κB subunit p65 is normally localized in thenucleus upon cytokine stimulation using IL-1β (middle panel). The tranpeptide that specifically binds to the NBD, thus sequestering p65 to tgated by NBD. Scramble peptide does not inhibit the induction by IL-1β72 hours before IL-1β treatment. Transfected cells show almost no intransfected with siRNA against GFP. Two unique siRNA give rise to sfor p65 by Western blot; GAPDH serves as a loading control (right gOVCAR8 cells, NF-κB (p65) binds to the predicted binding sites 2 hourcontrols for the IP. Primers located 5′ and 3′ of the NF-κB sites (−2 andDNA shows that all primers give rise to products on genomic DNA. (Hovarian cancer lines that constitutively express Elafin. OVCAR-3 cells coStimulation of OVCAR-3 cells with IL-1β increases Elafin expression evsubunit (Western blot, inset) abrogates the stimulus-induced increase
minimal or no expression of Elafin (Figure W3). Using both computeralgorithms designed to predict transcription factor binding sites in pro-moter regions and previously published data (reviewed in Chowdhuryet al. [22]), we identified three putative NF-κB transcription factor–binding sites in the promoter region of Elafin (Figure 6A). We then
tory mediators. (A) Schematic representation of predicted transcrip-sites relative to the first base of the start codon for Elafin (+1) is in-R before and after IL-1β stimulation of no- or low-Elafin expressors.arvested. An increase of Elafin expression was detected in HeyA8,control. (C) Time course of Elafin expression after cytokine treatment.itored by quantitative RT-PCR for 48 hours. (D) Immunofluorescentcytoplasm of OVCAR8 cells (left panel) but is translocated into theslocation of p65 is inhibited by blocking the NF-κB pathway with ahe cytoplasm (right panel). (E) Elafin induction by IL-1β can be abro-. (F) OVCAR8 cells transfected with siRNA against NF-κB subunit p65crease in Elafin expression compared with nontransfected or cellsimilar results. Inlayed panel shows efficiency of siRNA knockdownraph). (G) Occupancy of NF-κB sites on Elafin promoter by ChIP. Ins after IL-1β treatment. Anti-Golgi antibodies were used as negative+2 kb, respectively) served as controls and yielded no product. Input) IL-1β can act through NF-κB to induce further Elafin expression innstitutively express Elafin compared with OVCAR-8 cell (FigureW3).en further. Knockdown of NF-κB activity with siRNA against the p65but not the baseline levels of Elafin expression.
170 Elafin Expression in Ovarian Cancer Clauss et al. Neoplasia Vol. 12, No. 2, 2010
treated the ovarian cancer cells that normally express minimal or noElafin (Figure W3) with the cytokine IL-1β, which is known to induceNF-κB recruitment to promoter elements of responsive genes [38].Stimulation of HeyA8, OVCAR8, and TOV21G cells with IL-1β for2 hours resulted in a marked expression of Elafin (Figure 6B). Tumornecrosis factor α, another proinflammatory cytokine, had a similar al-beit weaker effect (data not shown). Importantly, under the sameconditions, IL-1β did not induce the expression of Elafin in a HOSEline (Figure 6B). To determine the kinetics of Elafin induction, two celllines, OVCAR8 and TOV21G, which normally express very low levelsof Elafin, were treated with IL-1β, and Elafin expression was monitoredover time. Two hours after IL-1β stimulation, a dramatic increase inElafin expression was detected: 15-fold in OVCAR8 cells (Figure 6C)and 5-fold in TOV21G cells (data not shown). The increased expres-sion lasted for more than 48 hours. In contrast, analysis of HE4 expres-sion under the same conditions failed to demonstrate a similar effect(data not shown), suggesting that Elafin and HE4 expressions are dif-ferentially regulated. The effect of IL-1β on Elafin levels in cells thatnormally do not express Elafin suggests that the NF-κB pathwaymay participate in driving Elafin expression. To test this hypothesis,we treated OVCAR8 cells with NEMO-binding domain (NBD) pep-tide, an IκB kinase (IKKγ) inhibitor [39], 24 hours before inductionwith IL-1β. IKKγ normally phosphorylates IκB and leads to its disso-ciation from the NF-κB complex, thus permitting nuclear entry andactivation of NF-κB. Treatment of OVCAR8 cells with IL-1β resultsin the nuclear translocation of NF-κB, as measured by immunofluores-cence for the p65 DNA binding subunit of NF-κB (Figure 6D), where-as NBD completely blocks the nuclear translocation of p65 inthe presence of IL-1β (Figure 6D). Under these conditions, cells treatedwith 25 μM of the NBD inhibitor peptide before stimulation withIL-1β showed no increase in Elafin expression, whereas the scrambledpeptide did not inhibit Elafin induction by IL-1β (Figure 6E). The ef-fect of NBD was concentration-dependent (data not shown).
We further explored the potential direct involvement ofNF-κB in theinduction of Elafin expression using siRNA to deplete the levels of p65before IL-1β treatment. Knockdown of p65 was confirmed byWesternblot analysis using two different siRNA reagents (Figure 6F, inset).OVCAR8 cells treated with control siRNA (GFP) showed comparablelevels of Elafin expression to those cells treated with IL-1β only. How-ever, OVCAR8 cells that had been treated with siRNA against p65showed greatly diminished induction of Elafin in response to IL-1β(Figure 6F ). This is not likely due to an off-target effect of RNA inter-ference (RNAi) because two different siRNA sequences gave a similarresult. Finally, ChIP was used to address whether endogenous p65occupies its cognate DNA binding sites on the Elafin promoter aftercytokine induction, which would suggest that NF-κB directly drivesElafin expression. In both OVCAR8 (Figure 6G ) and TOV21G cells(data not shown), there was no occupancy of the Elafin promoter byp65 in the absence of IL-1β. However, 2 hours after IL-1β treatment,all three binding sites were occupied (Figure 6G). This binding is spe-cific for three reasons: 1) it is only observed in response to a stimulus(IL-1β), 2) control antibodies (α-Golgi) do not precipitate bindingactivity, and 3) binding is specific to the NF-κB sites because bindingwas not seen at sequence upstream and downstream of the NF-κB con-sensus sites (Figure 6G ). Because the genomic resolution of ChIP islimited by the size of DNA fragments generated (typically 500 bp aftersonication), it cannot be concluded that all three NF-κB sites are occu-pied simultaneously because they all exist within approximately 300 bpof one another (Figure 6A). Nonetheless, the results demonstrate that
p65 occupancy is dependent on cytokine stimulation. In addition,the overall results strongly argue that induction of Elafin expressionby IL-1β is mediated by the NF-κB pathway in ovarian cancer cells thatnormally do not express the protein. Interestingly, it should be notedthat treatment with IL-1β can also induce higher levels of Elafin expres-sion in cell lines that constitutively express Elafin, such asOVCAR3 cells(Figures 6H and W3). In this setting, knocking down the p65 subunitof NF-κB resulted in a loss of the stimulus-induced expression of Elafin,but there was no effect on the baseline level of expression (data notshown). This latter effect is consistent with our observation that con-stitutive expression by ovarian tumors is likely mediated by genomicgains of the PI3 locus (Figure 5).
DiscussionIn this study, we demonstrate that Elafin is overexpressed and secretedby ovarian carcinomas. To our knowledge, this is the first report linkingElafin to ovarian cancer. We show that Elafin expression is regulated, inpart, by gains of the genomic locus and polysomy. We also show thatinflammatory mediators can induce expression through the NF-κBpathway, which plays a pivotal role in the link between inflammationand cancer [40]. We could specifically block the induction of Elafinexpression with a compound (NBD peptide) that inhibits the properassembly of the IKK complex necessary for activation of NF-κB. RNAidirected against the p65 DNA binding subunit of NF-κB in the pres-ence or absence of IL-1β demonstrated that knockdown of this subunitabrogated the induction of Elafin expression in response to this in-flammatory mediator. Finally, using chromatin immunoprecipitationexperiments, we found that NF-κB can specifically occupy cognatebinding sites in the Elafin promoter only after stimulation with cyto-kine. These findings are consistent with previous studies reporting arole for NF-κB in mediating Elafin expression in pulmonary epithelialcells in response to inflammatory mediators [34,41].
The role of Elafin in ovarian carcinoma is currently undefined. Elafinis a serine proteinase inhibitor [19]. Its expression, and that of SLPI, isinduced under conditions of inflammation and wound healing [42].Studies on SLPI knockout mice show impaired cutaneous wound heal-ing with increased inflammation and elastase proteinase activity [43].Whether Elafin plays a similar role is difficult to ascertain because thereis no direct homolog of Elafin in mouse [44]. Moreover, although SLPIand Elafin were initially discovered because of their antiproteinaseactivity, subsequent studies revealed diverse functions including anti-microbial properties and roles in regulating the innate immune system[19]. More recently, several studies showed that overexpression of SLPIis common in certain tumors including pancreatic, uterine, ovarian,and thyroid carcinomas (reviewed in Bouchard et al. [42]). One studyin particular identified SLPI among four genes associated with metas-tasis and lymph node involvement in breast cancer [45] and anothershowed that high SLPI expression is associated with decreased disease-free survival and poor overall survival in breast cancer [46]. The func-tion of SLPI and its antiproteinase activity in this setting are unclear.With regard to Elafin, a connection with cancer is beginning to emerge.A limited body of work shows that Elafin is expressed in a significantnumber of squamous cell carcinomas [29–32], a finding we have con-firmed in this study. However, it is unclear whether its expression inthese tumors is associated with clinical outcomes. A more recent studyidentified Elafin expression in glioblastoma multiforme and showed acorrelation with poor outcome [47].
Our analysis of annotated TMAs and corresponding whole-mounttissue sections of ovarian high-grade late-stage serous carcinomas shows
Neoplasia Vol. 12, No. 2, 2010 Elafin Expression in Ovarian Cancer Clauss et al. 171
that the high expression of Elafin is associated with a poorer overallsurvival compared with ovarian tumors that express no or low levelsof Elafin. Whether Elafin is simply a surrogate for aggressive tumorsor it actually functionally contributes to tumor behavior by an as yetundefined mechanism remains to be determined. However, if Elafinsecretion leads to its circulation in the bloodstream, it is tempting tospeculate that Elafin may serve as a surrogate for more aggressive, pos-sibly more chemoresistant carcinomas that may benefit from alternativetherapies. Consistent with this hypothesis, we found that platinum-refractory tumors in our clinical data set were very likely to have elevatedlevels of Elafin expression, a finding that warrants further investigation.
AcknowledgmentsThe authors thank Stephen Cannistra, Glenn Dranoff, Alison Karst, andRamesh Shivdasani for critically reading the manuscript. The authors alsothank Debajit Biswas for expert help regarding the NF-κB pathway.
References[1] Jemal A, Siegel R, Ward E, Hao Y, Xu J, Murray T, and Thun MJ (2008).
Cancer statistics, 2008. CA Cancer J Clin 58, 71–96.[2] Stewart B and Kleihues P (2003). WHO World Cancer Report. Lyon, France:
IARC Press.[3] Cannistra SA (2004). Cancer of the ovary. N Engl J Med 351, 2519–2529.[4] Bast RC Jr (2003). Status of tumor markers in ovarian cancer screening. J Clin
Oncol 21, 200–205.[5] Drapkin R, Clauss A, and Skates S (2008). Urokinase-type plasminogen activator
receptor: a beacon of malignancy? Clin Cancer Res 14, 5643–5645.[6] Israeli O, Goldring-Aviram A, Rienstein S, Ben-Baruch G, Korach J, Goldman B,
and Friedman E (2005). In silico chromosomal clustering of genes displaying al-tered expression patterns in ovarian cancer. Cancer Genet Cytogenet 160, 35–42.
[7] Iwabuchi H, Sakamoto M, Sakunaga H, Ma YY, Carcangiu ML, Pinkel D, Yang-Feng TL, and Gray JW (1995). Genetic analysis of benign, low-grade, and high-grade ovarian tumors. Cancer Res 55, 6172–6180.
[8] Kiechle M, Jacobsen A, Schwarz-Boeger U, Hedderich J, Pfisterer J, and Arnold N(2001). Comparative genomic hybridization detects genetic imbalances in primaryovarian carcinomas as correlated with grade of differentiation. Cancer 91, 534–540.
[9] Sonoda G, Palazzo J, du Manoir S, Godwin AK, Feder M, Yakushiji M, and TestaJR (1997). Comparative genomic hybridization detects frequent overrepresenta-tion of chromosomal material from 3q26, 8q24, and 20q13 in human ovariancarcinomas. Genes Chromosomes Cancer 20, 320–328.
[10] Tanner MM, Grenman S, Koul A, Johannsson O, Meltzer P, Pejovic T, Borg A,and Isola JJ (2000). Frequent amplification of chromosomal region 20q12-q13in ovarian cancer. Clin Cancer Res 6, 1833–1839.
[11] Clauss A, Lilja H, and Lundwall A (2002). A locus on human chromosome20 contains several genes expressing protease inhibitor domains with homologyto whey acidic protein. Biochem J 368, 233–242.
[12] Lundwall A and Clauss A (2002). Identification of a novel protease inhibitorgene that is highly expressed in the prostate. Biochem Biophys Res Commun 290,452–456.
[13] Drapkin R, von Horsten HH, Lin Y, Mok SC, Crum CP, Welch WR, and HechtJL (2005). Human epididymis protein 4 (HE4) is a secreted glycoprotein that isoverexpressed by serous and endometrioid ovarian carcinomas. Cancer Res 65,2162–2169.
[14] Hellstrom I, Raycraft J, Hayden-Ledbetter M, Ledbetter JA, Schummer M,McIntosh M, Drescher C, Urban N, and Hellstrom KE (2003). The HE4(WFDC2) protein is a biomarker for ovarian carcinoma. Cancer Res 63,3695–3700.
[15] Devoogdt N, Revets H, Ghassabeh GH, and De Baetselier P (2004). Secretoryleukocyte protease inhibitor in cancer development. Ann N Y Acad Sci 1028,380–389.
[16] Hough CD, Cho KR, Zonderman AB, Schwartz DR, and Morin PJ (2001).Coordinately up-regulated genes in ovarian cancer. Cancer Res 61, 3869–3876.
[17] Simpkins FA, Devoogdt NM, Rasool N, Tchabo NE, Alejandro EU, KamravaMM, and Kohn EC (2008). The alarm anti-protease, secretory leukocyte protease
inhibitor, is a proliferation and survival factor for ovarian cancer cells.Carcinogenesis29, 466–472.
[18] Tsukishiro S, Suzumori N, Nishikawa H, Arakawa A, and Suzumori K (2005).Use of serum secretory leukocyte protease inhibitor levels in patients to improvespecificity of ovarian cancer diagnosis. Gynecol Oncol 96, 516–519.
[19] Williams SE, Brown TI, Roghanian A, and Sallenave JM (2006). SLPI and elafin:one glove, many fingers. Clin Sci (Lond) 110, 21–35.
[20] Cuenca J and Bonome C (2005). Off-pump coronary artery bypass grafting andother minimally invasive techniques. Rev Esp Cardiol 58, 1335–1348.
[21] Yokota T, Bui T, Liu Y, Yi M, Hunt KK, and Keyomarsi K (2007). Differentialregulation of elafin in normal and tumor-derived mammary epithelial cells is medi-ated by CCAAT/enhancer binding protein beta. Cancer Res 67, 11272–11283.
[22] Chowdhury MA, Kuivaniemi H, Romero R, Edwin S, Chaiworapongsa T, andTromp G (2006). Identification of novel functional sequence variants in the genefor peptidase inhibitor 3. BMC Med Genet 7, 49.
[23] Das PM, Ramachandran K, vanWert J, and Singal R (2004). Chromatin immuno-precipitation assay. Biotechniques 37, 961–969.
[24] Barker SD, Casado E, Gomez-Navarro J, Xiang J, Arafat W,Mahasreshti P, PustilnikTB, Hemminki A, Siegal GP, Alvarez RD, et al. (2001). An immunomagnetic-basedmethod for the purification of ovarian cancer cells from patient-derived ascites.Gynecol Oncol 82, 57–63.
[25] Firestein R, Bass AJ, Kim SY, Dunn IF, Silver SJ, Guney I, Freed E, Ligon AH,Vena N, Ogino S, et al. (2008). CDK8 is a colorectal cancer oncogene that regu-lates beta-catenin activity. Nature 455, 547–551.
[26] Kirchhoff C, Habben I, Ivell R, and Krull N (1991). A major human epididymis-specific cDNA encodes a protein with sequence homology to extracellular pro-teinase inhibitors. Biol Reprod 45, 350–357.
[27] Lundwall A and Ulvsback M (1996). The gene of the protease inhibitor SKALP/elafin is a member of the REST gene family. Biochem Biophys Res Commun 221,323–327.
[28] ZhangM, Zou Z,Maass N, and Sager R (1995). Differential expression of elafin inhuman normal mammary epithelial cells and carcinomas is regulated at the tran-scriptional level. Cancer Res 55, 2537–2541.
[29] Westin U, Nystrom M, Ljungcrantz I, Eriksson B, and Ohlsson K (2002). Thepresence of elafin, SLPI, IL1-RA and STNFα RI in head and neck squamous cellcarcinomas and their relation to the degree of tumour differentiation. MediatorsInflamm 11, 7–12.
[30] Yoshida N, Egami H, Yamashita J, Takai E, Tamori Y, Fujino N, Kitaoka M,Schalkwijk J, and Ogawa M (2002). Immunohistochemical expression of SKALP/elafin in squamous cell carcinoma of human lung. Oncol Rep 9, 495–501.
[31] Alkemade HA, Molhuizen HO, van Vlijmen-Willems IM, van Haelst UJ, andSchalkwijk J (1993). Differential expression of SKALP/Elafin in human epidermaltumors. Am J Pathol 143, 1679–1687.
[32] Yamamoto S, Egami H, Kurizaki T, Ohmachi H, Hayashi N, Okino T,Shibata Y, Schalkwijk J, and Ogawa M (1997). Immunohistochemical expressionof SKALP/elafin in squamous cell carcinoma of the oesophagus. Br J Cancer 76,1081–1086.
[33] Wiedow O, Schroder JM, Gregory H, Young JA, and Christophers E (1990).Elafin: an elastase-specific inhibitor of human skin. Purification, characterization,and complete amino acid sequence. J Biol Chem 265, 14791–14795.
[34] Bingle L, Tetley TD, and Bingle CD (2001). Cytokine-mediated induction of thehuman elafin gene in pulmonary epithelial cells is regulated by nuclear factor-κB.Am J Respir Cell Mol Biol 25, 84–91.
[35] Ness RB and Cottreau C (1999). Possible role of ovarian epithelial inflammationin ovarian cancer. J Natl Cancer Inst 91, 1459–1467.
[36] Ness RB, Grisso JA, Cottreau C, Klapper J, Vergona R, Wheeler JE, Morgan M,and Schlesselman JJ (2000). Factors related to inflammation of the ovarian epithe-lium and risk of ovarian cancer. Epidemiology 11, 111–117.
[37] Wang X, Wang E, Kavanagh JJ, and Freedman RS (2005). Ovarian cancer, thecoagulation pathway, and inflammation. J Transl Med 3, 25.
[38] Hayden MS and Ghosh S (2008). Shared principles in NF-κB signaling. Cell 132,344–362.
[39] May MJ, Marienfeld RB, and Ghosh S (2002). Characterization of the Iκ B-kinaseNEMO binding domain. J Biol Chem 277, 45992–46000.
[40] Naugler WE and Karin M (2008). NF-κB and cancer-identifying targets andmechanisms. Curr Opin Genet Dev 18, 19–26.
[41] Sallenave JM, Shulmann J, Crossley J, Jordana M, and Gauldie J (1994). Regu-lation of secretory leukocyte proteinase inhibitor (SLPI) and elastase-specific in-hibitor (ESI/elafin) in human airway epithelial cells by cytokines and neutrophilicenzymes. Am J Respir Cell Mol Biol 11, 733–741.

172 Elafin Expression in Ovarian Cancer Clauss et al. Neoplasia Vol. 12, No. 2, 2010
[42] Bouchard D, Morisset D, Bourbonnais Y, and Tremblay GM (2006). Proteinswith whey-acidic-protein motifs and cancer. Lancet Oncol 7, 167–174.
[43] Ashcroft GS, Lei K, Jin W, Longenecker G, Kulkarni AB, Greenwell-Wild T,Hale-Donze H, McGrady G, Song XY, and Wahl SM (2000). Secretory leukocyteprotease inhibitor mediates non-redundant functions necessary for normal woundhealing. Nat Med 6, 1147–1153.
[44] Clauss A, Lilja H, and Lundwall A (2005). The evolution of a genetic locus encodingsmall serine proteinase inhibitors. Biochem Biophys Res Commun 333, 383–389.
[45] Kluger HM, Chelouche Lev D, Kluger Y, McCarthy MM, Kiriakova G, CampRL, Rimm DL, and Price JE (2005). Using a xenograft model of human breast
cancer metastasis to find genes associated with clinically aggressive disease. CancerRes 65, 5578–5587.
[46] Cimino D, Fuso L, Sfiligoi C, Biglia N, Ponzone R, Maggiorotto F, Russo G,Cicatiello L, Weisz A, Taverna D, et al. (2008). Identification of new genes asso-ciated with breast cancer progression by gene expression analysis of predefinedsets of neoplastic tissues. Int J Cancer 123, 1327–1338.
[47] Saidi A, Javerzat S, Bellahcene A, De Vos J, Bello L, Castronovo V, Deprez M,Loiseau H, Bikfalvi A, and Hagedorn M (2008). Experimental anti-angiogenesiscauses upregulation of genes associated with poor survival in glioblastoma. Int JCancer 122, 2187–2198.
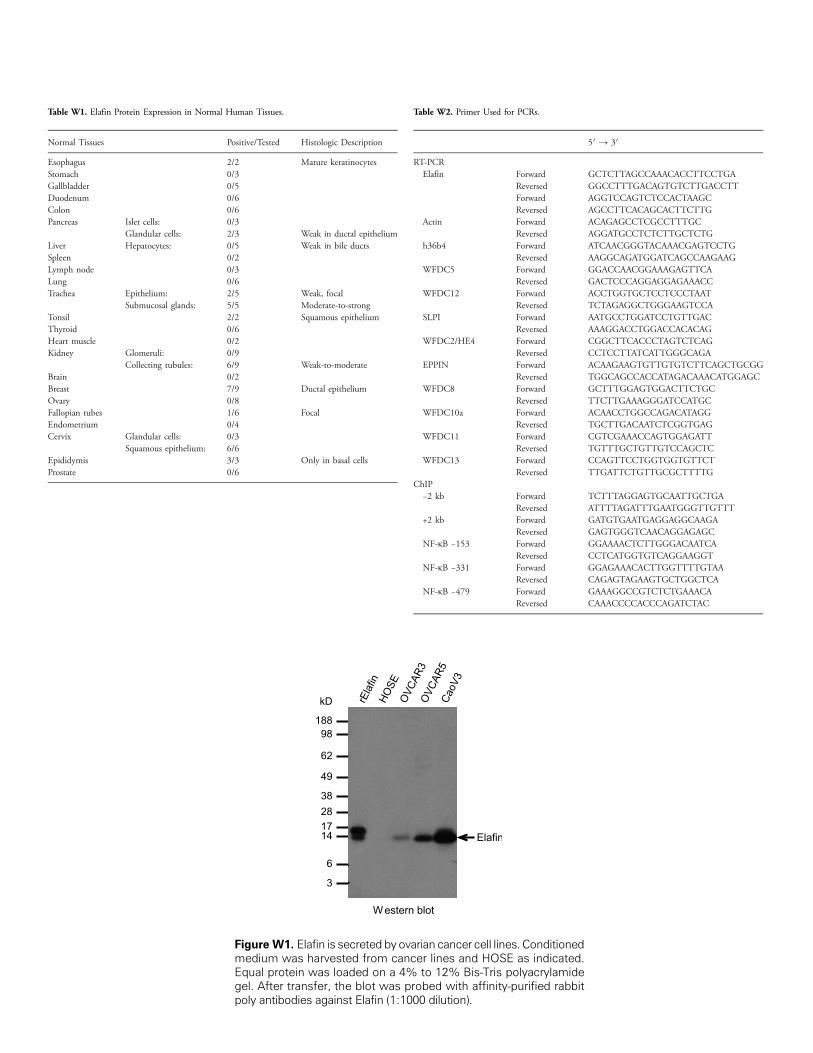
Table W1. Elafin Protein Expression in Normal Human Tissues.
Normal Tissues
Positive/TestedFigure W1.medium waEqual proteigel. After trapoly antibod
Histologic Description
Esophagus
2/2 Mature keratinocytes Stomach 0/3 Gallbladder 0/5 Duodenum 0/6 Colon 0/6 Pancreas Islet cells: 0/3Glandular cells:
2/3 Weak in ductal epithelium Liver Hepatocytes: 0/5 Weak in bile ducts Spleen 0/2 Lymph node 0/3 Lung 0/6 Trachea Epithelium: 2/5 Weak, focalSubmucosal glands:
5/5 Moderate-to-strong Tonsil 2/2 Squamous epithelium Thyroid 0/6 Heart muscle 0/2 Kidney Glomeruli: 0/9Collecting tubules:
6/9 Weak-to-moderate Brain 0/2 Breast 7/9 Ductal epithelium Ovary 0/8 Fallopian tubes 1/6 Focal Endometrium 0/4 Cervix Glandular cells: 0/3Squamous epithelium:
6/6 Epididymis 3/3 Only in basal cells Prostate 0/6Elafin is secreted byovs harvested from cann was loaded on a 4%nsfer, the blot was pies against Elafin (1:10
Table W2. Primer Used for PCRs.
arian cancer cell linescer lines and HOSEto 12% Bis-Tris p
robed with affinity-p00 dilution).
. Conditionedas indicated.olyacrylamideurified rabbit
5′ → 3′
RT-PCR
Elafin Forward GCTCTTAGCCAAACACCTTCCTGAReversed
GGCCTTTGACAGTGTCTTGACCTT Forward AGGTCCAGTCTCCACTAAGC Reversed AGCCTTCACAGCACTTCTTGActin
Forward ACAGAGCCTCGCCTTTGC Reversed AGGATGCCTCTCTTGCTCTGh36b4
Forward ATCAACGGGTACAAACGAGTCCTG Reversed AAGGCAGATGGATCAGCCAAGAAGWFDC5
Forward GGACCAACGGAAAGAGTTCA Reversed GACTCCCAGGAGGAGAAACCWFDC12
Forward ACCTGGTGCTCCTCCCTAAT Reversed TCTAGAGGCTGGGAAGTCCASLPI
Forward AATGCCTGGATCCTGTTGAC Reversed AAAGGACCTGGACCACACAGWFDC2/HE4
Forward CGGCTTCACCCTAGTCTCAG Reversed CCTCCTTATCATTGGGCAGAEPPIN
Forward ACAAGAAGTGTTGTGTCTTCAGCTGCGG Reversed TGGCAGCCACCATAGACAAACATGGAGCWFDC8
Forward GCTTTGGAGTGGACTTCTGC Reversed TTCTTGAAAGGGATCCATGCWFDC10a
Forward ACAACCTGGCCAGACATAGG Reversed TGCTTGACAATCTCGGTGAGWFDC11
Forward CGTCGAAACCAGTGGAGATT Reversed TGTTTGCTGTTGTCCAGCTCWFDC13
Forward CCAGTTCCTGGTGGTGTTCT Reversed TTGATTCTGTTGCGCTTTTGChIP
−2 kb Forward TCTTTAGGAGTGCAATTGCTGAReversed
ATTTTAGATTTGAATGGGTTGTTT +2 kb Forward GATGTGAATGAGGAGGCAAGAReversed
GAGTGGGTCAACAGGAGAGC NF-κB −153 Forward GGAAAACTCTTGGGACAATCAReversed
CCTCATGGTGTCAGGAAGGT NF-κB −331 Forward GGAGAAACACTTGGTTTTGTAAReversed
CAGAGTAGAAGTGCTGGCTCA NF-κB −479 Forward GAAAGGCCGTCTCTGAAACAReversed
CAAACCCCACCCAGATCTAC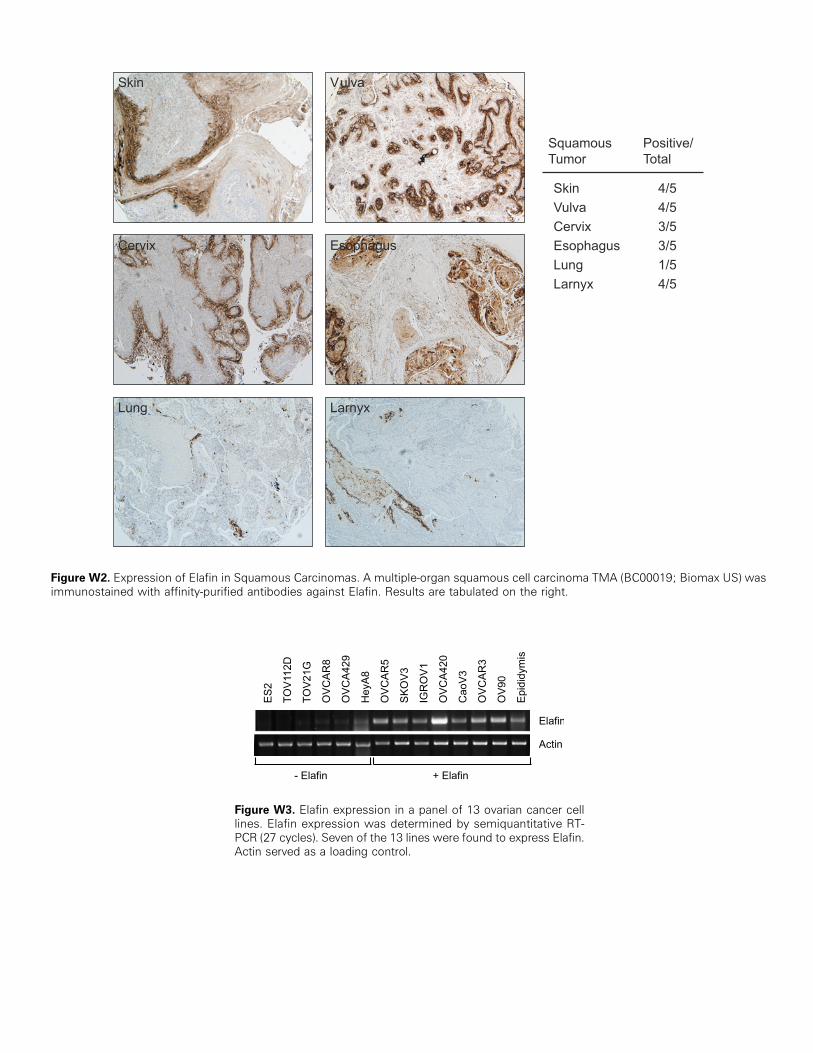
Figure W2. Expression of Elafin in Squamous Carcinomas. A multiple-organ squamous cell carcinoma TMA (BC00019; Biomax US) wasimmunostained with affinity-purified antibodies against Elafin. Results are tabulated on the right.
Figure W3. Elafin expression in a panel of 13 ovarian cancer celllines. Elafin expression was determined by semiquantitative RT-PCR (27 cycles). Seven of the 13 lines were found to express Elafin.Actin served as a loading control.