Assessing Sources and Ages of Organic Matter Supporting ... · Source: Limnology and Oceanography,...
17
Assessing Sources and Ages of Organic Matter Supporting River and Estuarine Bacterial Production: A Multiple-Isotope (Δ 14C, δ 13C, and δ 15N) Approach Author(s): S. Leigh McCallister, James E. Bauer, Jennifer E. Cherrier, Hugh W. Ducklow Source: Limnology and Oceanography, Vol. 49, No. 5 (Sep., 2004), pp. 1687-1702 Published by: American Society of Limnology and Oceanography Stable URL: http://www.jstor.org/stable/3597437 . Accessed: 31/01/2011 16:05 Your use of the JSTOR archive indicates your acceptance of JSTOR's Terms and Conditions of Use, available at . http://www.jstor.org/page/info/about/policies/terms.jsp. JSTOR's Terms and Conditions of Use provides, in part, that unless you have obtained prior permission, you may not download an entire issue of a journal or multiple copies of articles, and you may use content in the JSTOR archive only for your personal, non-commercial use. Please contact the publisher regarding any further use of this work. Publisher contact information may be obtained at . http://www.jstor.org/action/showPublisher?publisherCode=limnoc. . Each copy of any part of a JSTOR transmission must contain the same copyright notice that appears on the screen or printed page of such transmission. JSTOR is a not-for-profit service that helps scholars, researchers, and students discover, use, and build upon a wide range of content in a trusted digital archive. We use information technology and tools to increase productivity and facilitate new forms of scholarship. For more information about JSTOR, please contact [email protected]. American Society of Limnology and Oceanography is collaborating with JSTOR to digitize, preserve and extend access to Limnology and Oceanography. http://www.jstor.org
Transcript of Assessing Sources and Ages of Organic Matter Supporting ... · Source: Limnology and Oceanography,...
Assessing Sources and Ages of Organic Matter Supporting River and Estuarine BacterialProduction: A Multiple-Isotope (Δ 14C, δ 13C, and δ 15N) ApproachAuthor(s): S. Leigh McCallister, James E. Bauer, Jennifer E. Cherrier, Hugh W. DucklowSource: Limnology and Oceanography, Vol. 49, No. 5 (Sep., 2004), pp. 1687-1702Published by: American Society of Limnology and OceanographyStable URL: http://www.jstor.org/stable/3597437 .Accessed: 31/01/2011 16:05
Your use of the JSTOR archive indicates your acceptance of JSTOR's Terms and Conditions of Use, available at .http://www.jstor.org/page/info/about/policies/terms.jsp. JSTOR's Terms and Conditions of Use provides, in part, that unlessyou have obtained prior permission, you may not download an entire issue of a journal or multiple copies of articles, and youmay use content in the JSTOR archive only for your personal, non-commercial use.
Please contact the publisher regarding any further use of this work. Publisher contact information may be obtained at .http://www.jstor.org/action/showPublisher?publisherCode=limnoc. .
Each copy of any part of a JSTOR transmission must contain the same copyright notice that appears on the screen or printedpage of such transmission.
JSTOR is a not-for-profit service that helps scholars, researchers, and students discover, use, and build upon a wide range ofcontent in a trusted digital archive. We use information technology and tools to increase productivity and facilitate new formsof scholarship. For more information about JSTOR, please contact [email protected].
American Society of Limnology and Oceanography is collaborating with JSTOR to digitize, preserve andextend access to Limnology and Oceanography.
http://www.jstor.org
Limnol. Oceanogr., 49(5), 2004, 1687-1702 ? 2004, by the American Society of Limnology and Oceanography, Inc.
Assessing sources and ages of organic matter supporting river and estuarine bacterial production: A multiple-isotope (A14C, 813C, and 15N) approach
S. Leigh McCallisterl and James E. Bauer School of Marine Science, College of William and Mary, Gloucester Point, Virginia 23062
Jennifer E. Cherrier Environmental Sciences Institute, Florida A&M University, Tallahassee, Florida 32307
Hugh W. Ducklow School of Marine Science, College of William and Mary, Gloucester Point, Virginia 23062
Abstract We used radiocarbon (A14C) and stable isotopic (813C, 8&5N) signatures of bacterial nucleic acids to estimate the
sources and ages of organic matter (OM) assimilated by bacteria in the Hudson River and York River estuary. Dual- isotope plots of A14C and s13C coupled with a three-source mixing model resolved the major OM sources supporting bacterial biomass production (BBP). However, overlap in the stable isotopic (s83C and s81N) values of potential source end members (i.e., terrestrial, freshwater phytoplankton, and marsh-derived) prohibited unequivocal source assignments for certain samples. In freshwater regions of the York, terrigenous material of relatively recent origin (i.e., decadal in age) accounted for the majority of OM assimilated by bacteria (49-83%). Marsh and freshwater planktonic material made up the other major source of OM, with 5-33% and 6-25% assimilated, respectively. In the mesohaline York, BBP was supported primarily by estuarine phytoplankton-derived OM during spring and summer (53-87%) and by marsh-derived OM during fall (as much as 83%). Isotopic signatures from higher salinity regions of the York suggested that BBP there was fueled predominantly by either estuarine phytoplankton-derived OM (July and November) or by material advected in from the Chesapeake Bay proper (October). In contrast to the York, BBP in the Hudson River estuary was subsidized by a greater portion (up to -25%) of old (-24,000 yr BP) allochthonous OM, which was presumably derived from soils. These findings collectively suggest that bacterial metabolism and degradation in rivers and estuaries may profoundly alter the mean composition and age of OM during transport within these systems and before its export to the coastal ocean.
The fate of organic matter (OM) in aquatic systems is controlled primarily by heterotrophic bacterial respiration and biomass production (Findlay et al. 1992; Williams 2000). Sources and sinks of OM in river and estuarine sys- tems in particular are often difficult to establish quantita- tively because of such factors as spatial and temporal vari- ability in the simultaneous inputs and turnover of autochthonous and allochthonous forms and the subsequent homogenization of OM source signatures (Canuel et al.
1 Corresponding author ([email protected]). Present address: Dept des Sciences Biologiques, Universite du Quebec a Montraal, CP 8888, Succ. Centre Ville, Montreal, Quebec, Canada H3C 3P8.
Acknowledgments We are grateful;to the G. G. Hatch Isotope Laboratories, Univer-
sity of Ottawa, for stable isotope analyses and to Brian Frantz and Paula Zermeno at the Lawrence Livermore National Lab for their invaluable help with radiocarbon analyses. We thank Nina Caraco and Jon Cole for logistical support and the use of unpublished data. We extend special thanks to Stuart Findlay for the collection of water samples for humic extraction. This manuscript was greatly improved through insightful comments from two anonymous re- viewers.
This work was supported by grants from the National Science Foundation (OCE-9810669) and the U.S. Department of Energy Ocean Margins Program (FG05-94ER61833) to J.E.B. and from the Hudson River Foundation and National Science Foundation-Divi- sion of Environmental Biology to S.L.M.
1995; Cloern et al. 2002). Although bioassays are frequently used to evaluate the reactivity of bulk pools such as dis- solved organic matter (DOM; del Giorgio and Davis 2003), the information they provide about the biochemical com- position and age structure of potential sources of OM sup- porting heterotrophic production is often limited.
Globally, rivers transport -0.25 Pg of dissolved organic carbon (DOC) per year toward the ocean (Hedges et al. 1997). This typically occurs via estuaries or similar mixing zones, where a number of biogeochemical and physical pro- cesses may modify the quantities and characteristics of the OM delivered to the ocean. Some studies have reported con- servative transport of DOC through estuaries (e.g., Mantoura and Woodward 1983; Ittekot 1989), which suggests insig- nificant removal by bacteria. However, others have indicated that DOC processing in estuaries is more complex and may include both internal sources and sinks of DOC (Mannino and Harvey 2000; Raymond and Bauer 2000a). Thus, there may be no general pattern governing OM transport through estuaries as a whole. Instead, different river-estuary systems may possess unique physical, hydrological, and biogeochem- ical features that result in distinct OM dynamics.
Biogeochemical processing in estuaries is a primary con- trol on the transfer of terrigenous OM from land to the coast- al sea. Allochthonous OM delivered from watersheds to riv- ers and estuaries has traditionally been classified as refractory. However, net system heterotrophy in coastal eco-
1687
McCallister et al.
B A
0
37.60
Pamunkey River
-s G 37.40
37.20 vn,r T, I uIiK 1VCI1 CSoLU.Iy
77.00 76.80 76.60 76.40 Longitude (W)
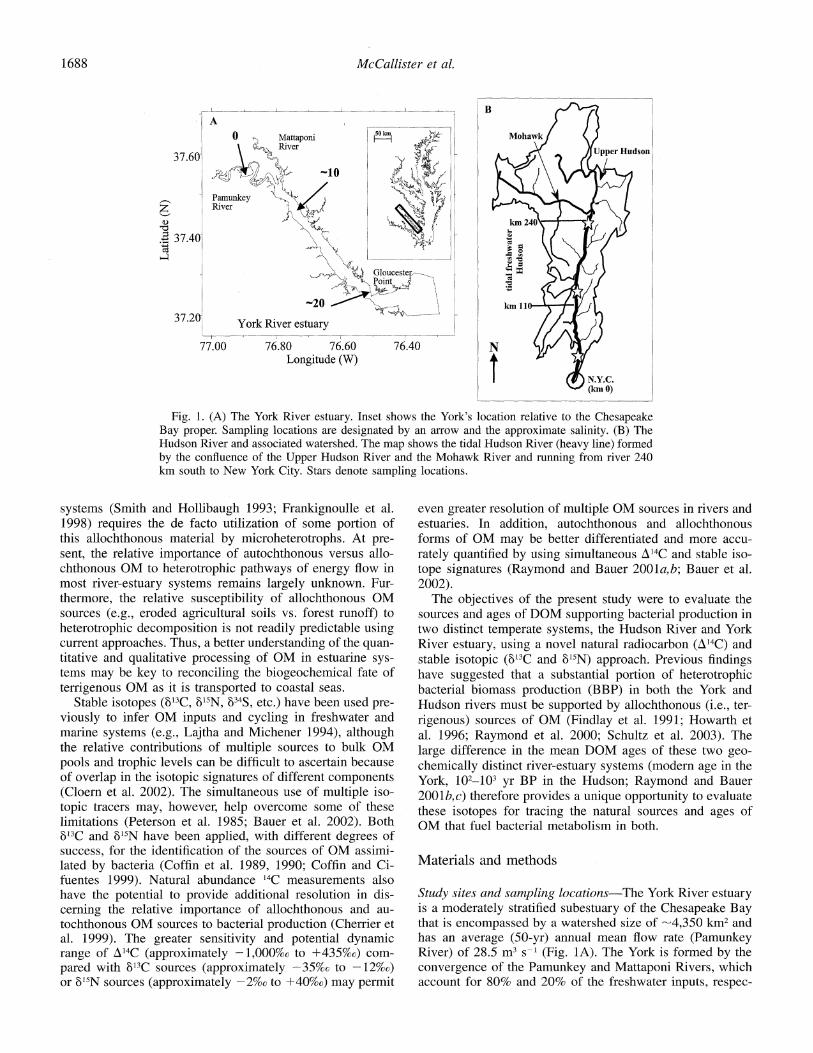
Fig. 1. (A) The York River estuary. Inset shows the York's location relative to the Chesapeake Bay proper. Sampling locations are designated by an arrow and the approximate salinity. (B) The Hudson River and associated watershed. The map shows the tidal Hudson River (heavy line) formed by the confluence of the Upper Hudson River and the Mohawk River and running from river 240 km south to New York City. Stars denote sampling locations.
systems (Smith and Hollibaugh 1993; Frankignoulle et al. 1998) requires the de facto utilization of some portion of this allochthonous material by microheterotrophs. At pre- sent, the relative importance of autochthonous versus allo- chthonous OM to heterotrophic pathways of energy flow in most river-estuary systems remains largely unknown. Fur- thermore, the relative susceptibility of allochthonous OM sources (e.g., eroded agricultural soils vs. forest runoff) to heterotrophic decomposition is not readily predictable using current approaches. Thus, a better understanding of the quan- titative and qualitative processing of OM in estuarine sys- tems may be key to reconciling the biogeochemical fate of terrigenous OM as it is transported to coastal seas.
Stable isotopes (6s3C, 1'5N, s34S, etc.) have been used pre- viously to infer OM inputs and cycling in freshwater and marine systems (e.g., Lajtha and Michener 1994), although the relative contributions of multiple sources to bulk OM pools and trophic levels can be difficult to ascertain because of overlap in the isotopic signatures of different components (Cloern et al. 2002). The simultaneous use of multiple iso- topic tracers may, however, help overcome some of these limitations (Peterson et al. 1985; Bauer et al. 2002). Both 813C and b15N have been applied, with different degrees of success, for the identification of the sources of OM assimi- lated by bacteria (Coffin et al. 1989, 1990; Coffin and Ci- fuentes 1999). Natural abundance '4C measurements also have the potential to provide additional resolution in dis- cerning the relative importance of allochthonous and au- tochthonous OM sources to bacterial production (Cherrier et al. 1999). The greater sensitivity and potential dynamic range of A'4C (approximately -1,000%o to +435%o) com- pared with 8'3C sources (approximately -35%0 to -12%o) or 815N sources (approximately -2%c to +40%6) may permit
even greater resolution of multiple OM sources in rivers and estuaries. In addition, autochthonous and allochthonous forms of OM may be better differentiated and more accu- rately quantified by using simultaneous A14C and stable iso- tope signatures (Raymond and Bauer 2001a,b; Bauer et al. 2002).
The objectives of the present study were to evaluate the sources and ages of DOM supporting bacterial production in two distinct temperate systems, the Hudson River and York River estuary, using a novel natural radiocarbon (A14C) and stable isotopic (8b3C and &85N) approach. Previous findings have suggested that a substantial portion of heterotrophic bacterial biomass production (BBP) in both the York and Hudson rivers must be supported by allochthonous (i.e., ter- rigenous) sources of OM (Findlay et al. 1991; Howarth et al. 1996; Raymond et al. 2000; Schultz et al. 2003). The large difference in the mean DOM ages of these two geo- chemically distinct river-estuary systems (modern age in the York, 102-103 yr BP in the Hudson; Raymond and Bauer 2001b,c) therefore provides a unique opportunity to evaluate these isotopes for tracing the natural sources and ages of OM that fuel bacterial metabolism in both.
Materials and methods
Study sites and sampling locations-The York River estuary is a moderately stratified subestuary of the Chesapeake Bay that is encompassed by a watershed size of -4,350 km2 and has an average (50-yr) annual mean flow rate (Pamunkey River) of 28.5 m3 s-1 (Fig. 1A). The York is formed by the convergence of the Pamunkey and Mattaponi Rivers, which account for 80% and 20% of the freshwater inputs, respec-
1688
Pi-wpr i-c-hinrw
Sources and ages of organic matter
Table 1. Water characteristics of the York River estuary and Hudson River.
Water volume Water Stream (L) tempera-
Site and flow* (method of ture Chl a date (m3 s-1) Salinity concentration) (?C) (A/g L-1)
York River Estuary Mar 2000 30.5 0 NDt 14.9 3.5
10 140 (GM)t 12.2 34.4 22 180 (GM) 11.3 8.0
May 2000 18.0 0 ND 21.2 5.0 11 75 (GM) 20.4 15.7 20 90 (GM) 17.9 7.1
Jul 2000 9.4 0 ND 27.0 5.7 10 115 (GM) 27.0 23.5 20 120 (GM) 26.5 17.9
Oct 2000 3.5 0 95 (HF)? 19.0 3.7 13 125 (GM) 19.0 12.3 21 85 (GM) 20.0 4.911
Nov 2000 5.0 0 215 (HF) 16.0 2.611 10 215 (HF) 15.2 10.011 21 215 (HF) 13.7 10.111
Hudson River estuary Oct 2000 457.3
240 km 0 220 (HF) ND 0.5[ 122 km 0 200 (HF) ND 6.6
Jun 2001 263.4 240 km 0 185 (GM) ND 2.5# 122 km 0 185 (GM) ND 5.8 25 km 3.2 95 (GM) ND ND
* Data obtained from the U.S. Geological Survey (http://waterdata.usgs. gov). The Pamunkey River freshwater flow reported for the York River estuary.
t Not determined. t GM, concentration of bacteria directly onto Gelman microcapsules (0.2
Am). ? HF, samples concentrated by tangential flow filtration (hollow-fiber car-
tridge, 0.1 jrm) before Gelman microcapsules. [I Data obtained from the Chesapeake Bay Program (http://chesapeakebay.
net). m Data courtesy of Drs. Nina Caraco and Jon Cole, IES. # June 2001 Chl a concentrations are the average of data collected 16 May
2001 and 17 July 2001 (data courtesy of Drs. Nina Caraco and Jon Cole, IES).
tively. Both rivers are considerably narrower than the estuary proper, and the Pamunkey has extensive tidal freshwater marshes that encompass an area of -2.0 X 10⁷ m2 (Neubauer et al. 2000). During our study, the maximal flow (30.5 m3 s-1) in the Pamunkey occurred during spring (March 2000) and decreased to a low during fall (October 2000; 3.5 m3 s-1; Table 1). Levels of chlorophyll a (Chl a) varied in space and time, with maximal concentrations consistently associ- ated with the midsalinity station (Table 1).
The Hudson River basin (33,500 km2) encompasses parts of Vermont, eastern New York, Massachusetts, Connecticut, and New Jersey and has an average (50 yr) annual mean flow rate of 390 m3 s-1 (Fig. 1B). The tidally influenced, freshwater Hudson extends south from the head of tide at Green Island, New York (240 km) for -130 km before it
encounters saline waters in the Hudson River estuary in the vicinity of Newburgh, New York. We concentrated on the freshwater region of the Hudson; however, seawater intruded into the lower reaches of the study area in June 2001. The phytoplankton biomass in the Hudson River, although his- torically high, has been decimated in recent years by the invasion of the zebra mussel (Dreissena polymorpha), which has drastically reduced the standing stock of phytoplankton (Chl a -30 to <5 mg m-3; Smith et al. 1998). More than 90% of the freshwater inputs are attributed to flow over the Green Island dam (83%) and Roundout Creek (10%; Findlay et al. 1998). Samples were collected from the Hudson River estuary during moderate to high flow periods (260-460 m3 s-1, Table 1). Chl a concentrations (Table 1) were consis- tently higher at km 122 (Poughkeepsie) compared with the upriver station (km 240, Corning Preserve).
Sampling and experimental design-Water samples for bacterial nucleic acid extractions were collected from three sites along the salinity gradient of the York River estuary (Fig. 1A) during different flow regimes and seasons (Table 1). In the tidal freshwater Hudson River, water samples were collected from Poughkeepsie at 122 km and Corning Pre- serve at 240 km in October 2000 (Fig. 1B) and from these two sites and an additional downstream site (George Wash- ington Bridge, salinity 3.2 at 25 km) in June 2001. Humic substances were found to coextract with nucleic acids in Oc- tober and November 2000 at the freshwater York station and during the June 2001 sampling of the Hudson River (Corn- ing Preserve and Poughkeepsie). Therefore, separate water samples were collected at a later date (October 2001 for the York and June 2002 for Hudson km 240) at these sites and extracted for the isotopic determination of the humic mate- rials, which were then used to correct the values for bacterial biomass (see below).
The different methodologies used for collecting samples for the stable and radioisotope signatures of OM assimilated by bacteria are listed in Table 1. On the basis of initial es- timates of cell abundances in the two systems (Findlay et al. 1991; Schultz et al. 2003), an assumed nucleic acid content per cell of 6-35 fg cell-' (Coffin and Cifuentes 1993), and the assumed C content of nucleic acids (-45%; Coffin and Cifuentes 1993), it was estimated that 100-200 liters of sam- ple would be necessary for the extraction of sufficient bac- terial C for radiocarbon analysis (minimum of 100 pg C). After collection, water samples were returned to the School of Marine Science (York samples) or the Institute of Eco- system Studies (IES) (Hudson samples) for immediate pro- cessing.
Sample collection and concentration of bacteria-Surface water samples were collected in multiple acid-leached (10% HC1) Nanopure-rinsed polycarbonate bottles (-20 liters). Water samples were prefiltered through Whatman 0.7-pm combusted glass-fiber filters to remove macrozooplankton, particulate organic matter (POM), protozoans, and larger phytoplankton (Coffin et al. 1990; Cherrier et al. 1999); bac- teria were subsequently concentrated by tangential flow ul- trafiltration to a final volume of -1 liter using an Amicon DC-10 ultrafiltration unit equipped with a single polysulfone
1689
McCallister et al.
hollow-fiber cartridge (0.1 Lm pore size; Table 1). Bacterial concentrates were then filtered onto acid-soaked (10% HCl), Nanopure-rinsed Gelman microculture capsules (0.2 Jim pore size). The filter capsule was purged of water and sealed with combusted aluminum foil and stored at -80?C until extraction. An alternative means of sample collection was to concentrate bacteria directly onto the microcapsules (Table 1) after in-line prefiltration through glass-fiber filters. Micro- capsules were kept on ice throughout the concentration pro- cess and stored as described above until extraction.
Nucleic acid extraction-Bacterial nucleic acid extrac- tions for isotopic analysis were performed according to the modified method of Coffin and Cifuentes (1993) as outlined in Cherrier (1997). In brief, bacterial cells collected in the microcapsules were lysed by adding a detergent/buffer so- lution (20 mmol L-1 Tris, 2 nM ethylene diaminetetraacetic acid, and 2% sodium dodecyl sulfate [SDS]) and heating the sealed capsule in a 100?C water bath for 15 min. After pre- cipitation and the removal of the SDS from the lysate, nu- cleic acids were isolated and purified by dialysis, followed by ethanol, phenol, and isoamyl alcohol/chloroform precip- itations. Two capsules were reextracted using the same pro- tocol, to serve as methodological blanks for assessing po- tential contamination by solvents and processing. Possible contamination of the extract by protein was assessed by spectrophotometric absorbance (A260: A280) ratios (Sambrook et al. 1989). Approximately 10% of the extract was used to verify purity and was then retained for the subsequent 813C and 685N stable isotope analysis. The remainder was used for natural abundance A'4C analysis. Extracts were stored at -80?C until isotopic analysis (<1 month).
The specificity to bacteria of nucleic acids in the 0.2-0.7- jim fraction has been demonstrated previously with 16S RNA analysis (Coffin et al. 1990); however, the potential for an isotopic bias by the inclusion of picoplankton may exist in different systems. Picoplankton (e.g., cyanobacteria) in the York make up only -7% of the total autotrophic biomass (Ray et al. 1989) and contribute an order of magnitude less C than bacteria (Eldridge and Sieracki 1993). Since the es- tablishment of Dreissena in the Hudson, cyanobacterial den- sities have decreased >700-fold, and they are now no more than a few percentage of total cell counts (Smith et al. 1998). Thus, cyanobacterial contributions to the observed nucleic acid isotopic signature should be minimal, and no correction was applied.
Humic materials may coextract with nucleic acids when they are present in high concentrations (Coffin and Cifuentes 1993; Jackson et al. 1997; Edgecomb et al. 1999). The coex- traction of humics occurred in October and November 2000 at the freshwater York station and during the June 2001 sam- pling of Hudson River (Corning Preserve and Poughkeep- sie). In an initial attempt to remove humics from the nucleic acid extracts, two different gel separation techniques were used, according to manufacturers' specifications and proce- dures outlined in Edgecomb et al. (1999) and Jackson et al. (1997). Columns retained a fraction of humic material, but the eluent remained amber colored, despite several passes of sample through columns. Because the complete removal of contaminating humic materials was not possible, the 863C
and A'4C isotopic values of the total extracts were corrected for the contribution of humics as
C(humics+NA) C(humics)(X) C(NA)(Y) (1) where C(humics+NA) is the measured isotopic value (&83C and A14C) for the total extract, C(hmics) is the isotopic signature of humics (measured as described below), and x and y are the relative contributions from humic and nucleic acid car- bon, respectively (x + y = 1.0). The values of x and y were estimated independently from C: N values as
C N(humics+NA) C: N(humics)() + C N(NA)(y) (2)
The C: N values of the total extract (C: N(humics+NA)) and of the humic materials alone were measured on a FinniganMAT DeltaPlus dual-inlet continuous flow isotope ratio mass spec- trometer. A literature value of -2.25 was used for C: N val- ues for nucleic acids (Coffin and Cifuentes 1993). Humic compounds from both the York and Hudson were isolated as described in Moran and Hodson (1994). Equation 2 was then solved for the relative contribution of humics and nu- cleic acids in the total extract value. Values for x and y were subsequently substituted into Eq. 1 and solved for C(NA), the isotopic composition of nucleic acids.
DOM isolation-DOM for stable isotopic (8l3C and 815N) and A14C analyses was concentrated by tangential flow ul- trafiltration (Amicon DC-10 equipped with a 3-kDa poly- sulfone spiral-wound cartridge) after filtration through a Gel- man capsule (0.2 Jim) of York River water (- 75-125 L) at three sampling locations (0, 10, and 20 salinity in March and October 2000). After initial concentration to -1 liter, the sample was further reduced to a final volume of -50 ml by turboevaporation and then lyophilized. Lyophilized DOM was reconstituted in -10 ml of deionized (DI) water and desalted overnight in Pierce 3.5-kDa slide-a-lyzers according to manufacturer's specifications. The desalted DOM was ly- ophilized, acidified with 10% HC1, and prepared for isotope analysis as outlined below. Leaves of Peltandra virginica, the most prominent freshwater plant in the York, were col- lected in July 2000, before senescence, for 813C analysis. After rinsing with DI water, the leaves were allowed to ex- tract in the dark at laboratory temperature in an aerated acid washed carboy (20 liters) with DI water for 10 d. A subsam- ple (2 liters) was subsequently reduced in volume by tur- boevaporation to -50 ml and was then lyophilized to re- move all associated water. After acidification with 10% HC1, samples were analyzed for 813C (see below).
Sample preparation and isotopic analyses-For stable isotope analyses, aliquots of nucleic acid extracts (approxi- mately one tenth the initial sample) were thawed and trans- ferred quantitatively to combusted (500?C) Pyrex centrifuge tubes. Samples were reduced in volume to -100 1ul by vac- uum evaporation (Labconco Centrivap model 78100-OOD). Nucleic acids and lyophilized DOM (humics, Peltandra leachate, and high-molecular-weight [HMW] DOM) were transferred quantitatively to acetone-rinsed tin foil CHN cap- sules and dried overnight at 60?C. Nucleic acids and humic OM were analyzed using a FinniganMAT DeltaPlus dual-inlet continuous flow isotope ratio mass spectrometer (G.G. Hatch
1690
Sources and ages of organic matter
Table 2. Bacterial nucleic acid A14C and 513C values, corrected for humic contributions.
Salinity Uncorrected Corrected Salinity
Site and or river A&4C 813C A14C &13C date km C:N (%o) (%c) (%o) (%o)
York Oct 2000 S=0 8.5 188 -28.7 234 -29.4 Nov 2000 S=0 7.5 168 -28.1 193 -28.3 Humic S=0 18.5 111 -27.5 NA* NA
Hudson Jun 2001 240 km 7.5 6 -27.2 3 -27.2 Jun 2001 122 km 6.2 16 -25.3 16 -25.0 Humic 240 km 34.7 21 -27.2 NA NA
* NA, not applicable.
Isotope Laboratories, University of Ottawa). HMW DOM and lyophilized Peltandra leachate were analyzed with a Eu- ropa Scientific Hydra 20/20 continuous flow isotope ratio mass spectrometer (Stable Isotope Facility, University of California, Davis). Stable isotope values are reported in stan- dard (8) notation as
X [(Rsample/standard) - 1] X 103 (3)
where X is '3C or '5N and R is '3C/12C or 15N/14N. The rec- ognized standards are PeeDee Belemnite (NBS-1) and at- mospheric N2 for 813C and Sl5N, respectively.
For natural abundance A14C measurements, nucleic acid extracts (-1 ml final volume) were thawed, transferred quantitatively (three rinses) to prebaked (500?C) 13-mm-di- ameter Pyrex tubes, and reduced in volume to ~2 ml by vacuum evaporation. Lyophilized humic OM and HMW DOM (freshwater) were transferred to prebaked (500?C) Py- rex tubes. Samples were subsequently acidified overnight with 1 ml of 3% H3PO4, reduced in volume again by vacuum evaporation, transferred to combusted (500?C) quartz tubes (6 mm diameter), and evaporated under vacuum until all water was removed (minimum 14 h). The tubes were then sealed under vacuum and combusted at 900?C using a CuO/ Ag metal catalyst to CO2 (Sofer 1980). The CO2 was sub- sequently reduced to graphite in an atmosphere of H2 over cobalt catalyst (Vogel et al. 1987). Graphite targets were analyzed at the Center for Accelerator Mass Spectometry at Lawrence Livermore National Laboratory. A14C is defined as the per mil (%o) deviation of a sample from the 14C activity of 19th-century wood. All reported A14C values were cor- rected for fractionation using the s13C values of the samples and the conventions of Stuiver and Pollach (1977). Total measurement uncertainties for A14C analyses of these sam- ples were typically ?+5-10%o.
Results
Isotopic signatures of bacterial nucleic acids-Humic cor- rection: Humic materials were discernible from nucleic acids by their greater C:N ratios of 18.5 and 34.7 for the York and Hudson, respectively (Table 2). The mean 863C values of humic materials collected from the York (-27.5%o) and
Table 3. Stable (S13C and 615N) and radio (A14C) isotopic values of extracted nucleic acids.
Salinity or 613C 515N A 4C
Location and date river km (%o) (%0)* (%o)
York River estuary Mar 2000 S=10 -22.8
S=22 -21.2 May 2000 S=ll -22.2 91
S=20 -27.6 Jul 2000 S=10 -22.5 12.6 45
S=20 -21.6 7.6 39 Oct 2000 S=0? -29.4 5.5 234
S= 13 -24.5 61 S=21 -23.0 -35
Nov 2000 S=0O -28.3 5.4 193 S=10 -25.4 17.3 52 S=21 -22.2 8.9 41
Hudson River estuary Oct 2000 S=0/240 km -28.4 NA:
S=0/122 km -26.8 -153 Jun 2001 S=0/240 kmt -27.2 0.9 3
S=0/122 kmt -25.0 8.7 16 S=3.2/25 km -25.6 -144
* Sample prioritized for S13C; 615N was obtained when possible. t Corrected for the contribution of humics. See Table 2 and associated text
for a full explanation. t Not applicable, sample lost.
Hudson (-27.2%o) river estuaries were similar to those for the uncorrected nucleic acid extracts; thus, '3C corrections were <1%o for both systems (Table 2). In the York River estuary, however, isolated humics were significantly depleted in A14C (A14Chun,c = 111%o) relative to uncorrected nucleic acid extracts (A4C(huics+NA) = 168-188%o). Corrected nu- cleic acid extracts were therefore enriched in A14C by -25- 46%0 (Table 2) relative to uncorrected values. Conversely, humic isolates in the Hudson River were slightly enriched in A'4C (by 15%o and 5%o for Corning Preserve and Pough- keepsie, respectively) relative to uncorrected extracts (Table 2).
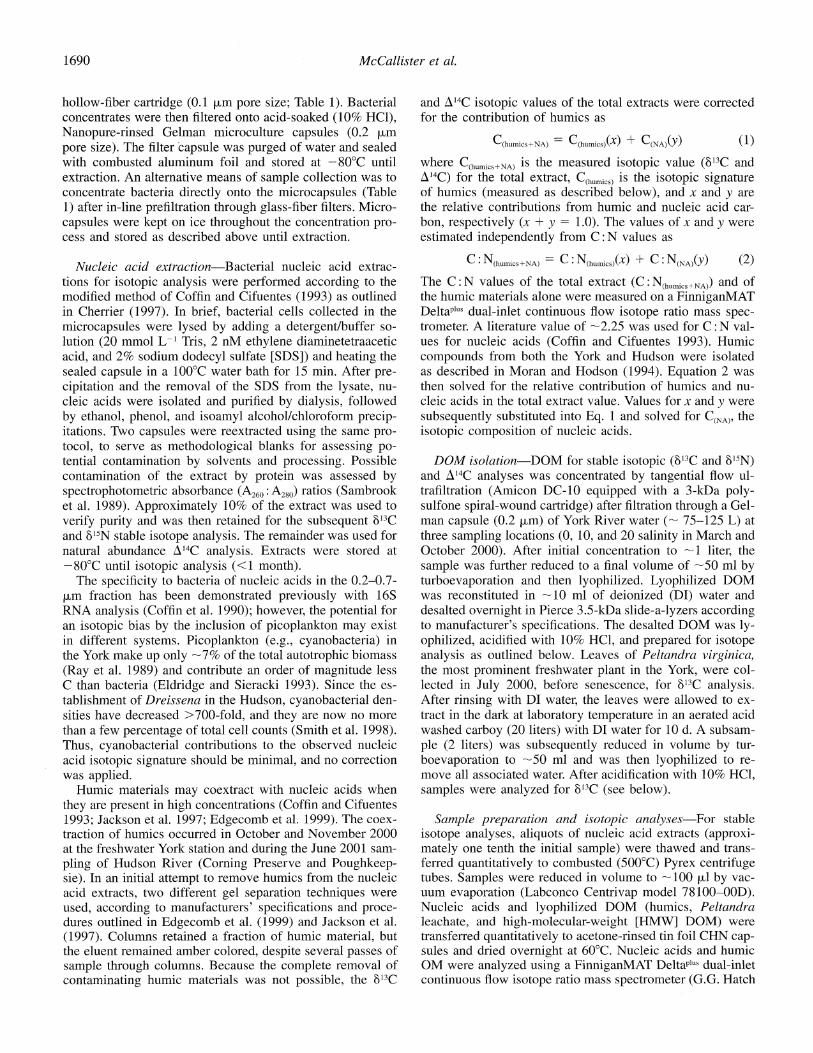
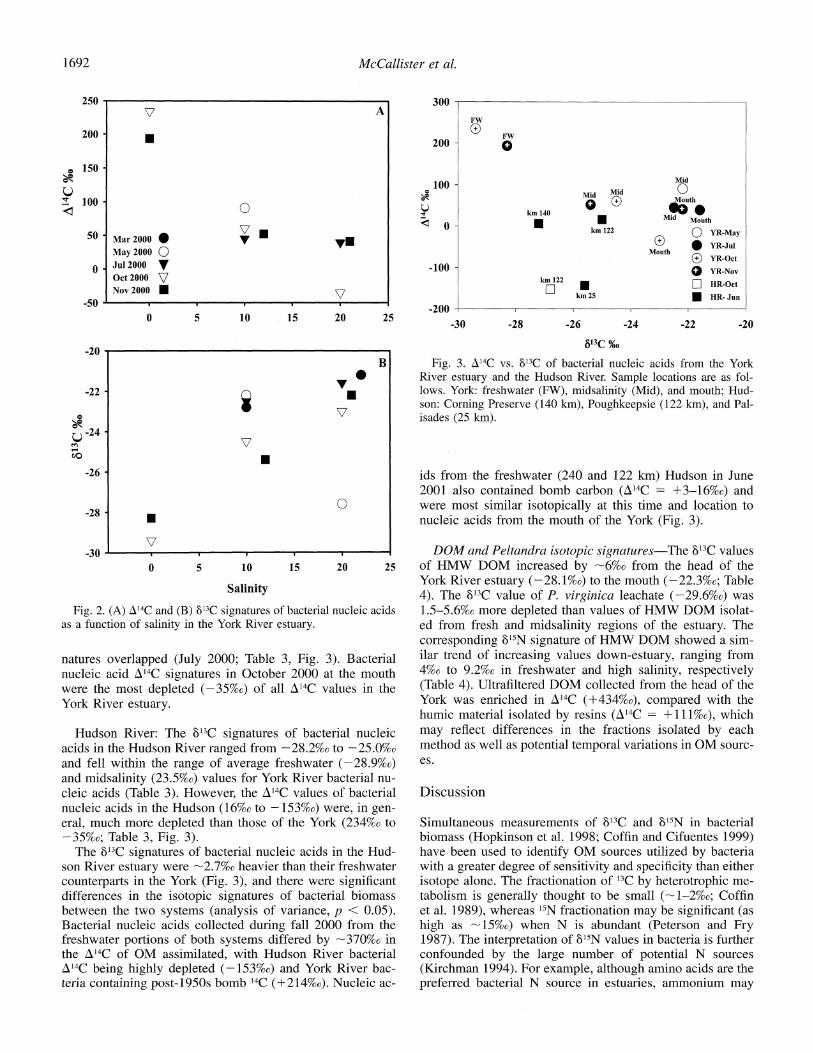
York River estuary: The A14C signatures of bacterial nu- cleic acids were most enriched at the freshwater end member of the York where values averaged 214 ? 29%o (Table 3, Fig. 2A). Values became more depleted (i.e., older) with increasing salinity (Fig. 2A) and averaged 62 + 20%o and 15 + 43%o for the midsalinity and mouth locations, respec- tively (Table 3). The corresponding 13C values were lightest at the freshwater end member (-28.9 + 0.9%o) and in- creased seaward with the exception of May 2000, when bac- terial nucleic acids at the mouth displayed an anomalously light 813C value of -27.6%o (Fig. 2B).
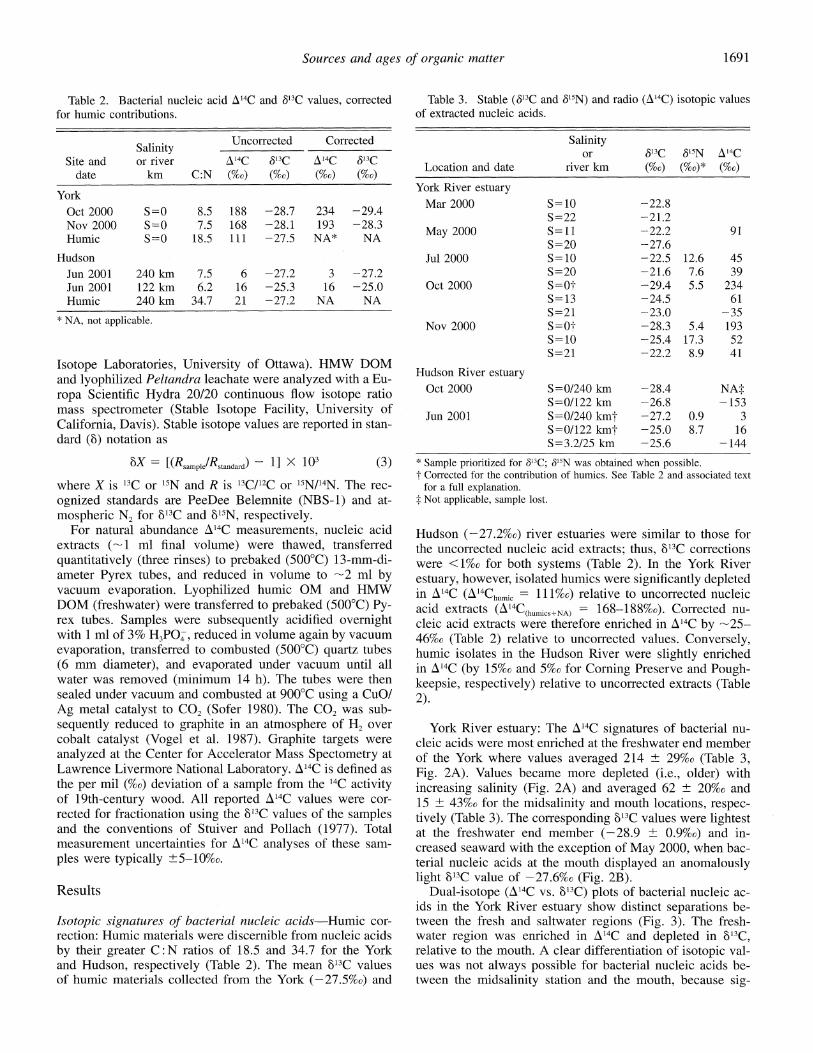
Dual-isotope (A14C vs. '13C) plots of bacterial nucleic ac- ids in the York River estuary show distinct separations be- tween the fresh and saltwater regions (Fig. 3). The fresh- water region was enriched in AZ4C and depleted in 681C, relative to the mouth. A clear differentiation of isotopic val- ues was not always possible for bacterial nucleic acids be- tween the midsalinity station and the mouth, because sig-
1691
McCallister et al.
250
200
e 150
; 100
50
0
-50
-20
-22
.-24 co
-26
-28
-30
V A
.
300
200 -
FW ?
100 -
Mar 2000 May 2000 Jul 2000 Oct 2000 Nov 2000
0
V Y 0
0
V II
'e' ,It
0
VI
V
0 5 10 15 20 25
B O
' V~~ v
V
7
0 0
V i i I i
0 5 10 15 20 25
Salinity
Fig. 2. (A) A14C and (B) 813C signatures of bacterial nucleic acids as a function of salinity in the York River estuary.
natures overlapped (July 2000; Table 3, Fig. 3). Bacterial nucleic acid A14C signatures in October 2000 at the mouth were the most depleted (-35%0) of all A'4C values in the York River estuary.
Hudson River: The 813C signatures of bacterial nucleic acids in the Hudson River ranged from -28.2%o to -25.0%o and fell within the range of average freshwater (-28.9%o) and midsalinity (23.5%o) values for York River bacterial nu- cleic acids (Table 3). However, the A14C values of bacterial nucleic acids in the Hudson (16%o to -153%o) were, in gen- eral, much more depleted than those of the York (234%o to -35%o; Table 3, Fig. 3).
The 813C signatures of bacterial nucleic acids in the Hud- son River estuary were -2.7%o heavier than their freshwater counterparts in the York (Fig. 3), and there were significant differences in the isotopic signatures of bacterial biomass between the two systems (analysis of variance, p < 0.05). Bacterial nucleic acids collected during fall 2000 from the freshwater portions of both systems differed by -370%o in the A14C of OM assimilated, with Hudson River bacterial A14C being highly depleted (-153%o) and York River bac- teria containing post-1950s bomb 14C (+214%o). Nucleic ac-
-100 -
-200
FW
O
Mid M
o ? km 140
km 122
km 122
km km 25
Mid 0
Mouth
Mid Mouth
0 YR-May ? * YR-Jul
Mouth (M ) YR-Oct
O YR-Nov
0 HR-Oct
* HR- Jun
-30 -28 -26 -24 -22 -20
613C %o
Fig. 3. A14C vs. 8'3C of bacterial nucleic acids from the York River estuary and the Hudson River. Sample locations are as fol- lows. York: freshwater (FW), midsalinity (Mid), and mouth; Hud- son: Corning Preserve (140 km), Poughkeepsie (122 km), and Pal- isades (25 km).
ids from the freshwater (240 and 122 km) Hudson in June 2001 also contained bomb carbon (A4C = +3-16%o) and were most similar isotopically at this time and location to nucleic acids from the mouth of the York (Fig. 3).
DOM and Peltandra isotopic signatures-The 813C values of HMW DOM increased by -6%o from the head of the York River estuary (-28.1%o) to the mouth (-22.3%o; Table 4). The 8o3C value of P. virginica leachate (-29.6%o) was 1.5-5.6%o more depleted than values of HMW DOM isolat- ed from fresh and midsalinity regions of the estuary. The corresponding 815N signature of HMW DOM showed a sim- ilar trend of increasing values down-estuary, ranging from 4%c to 9.2%o in freshwater and high salinity, respectively (Table 4). Ultrafiltered DOM collected from the head of the York was enriched in A14C (+434%o), compared with the humic material isolated by resins (A14C = +111%o), which may reflect differences in the fractions isolated by each method as well as potential temporal variations in OM sourc- es.
Discussion
Simultaneous measurements of 813C and 815N in bacterial biomass (Hopkinson et al. 1998; Coffin and Cifuentes 1999) have been used to identify OM sources utilized by bacteria with a greater degree of sensitivity and specificity than either isotope alone. The fractionation of 13C by heterotrophic me- tabolism is generally thought to be small (-1-2%o; Coffin et al. 1989), whereas 15N fractionation may be significant (as high as -15%o) when N is abundant (Peterson and Fry 1987). The interpretation of 815N values in bacteria is further confounded by the large number of potential N sources (Kirchman 1994). For example, although amino acids are the preferred bacterial N source in estuaries, ammonium may
I I I I
1692
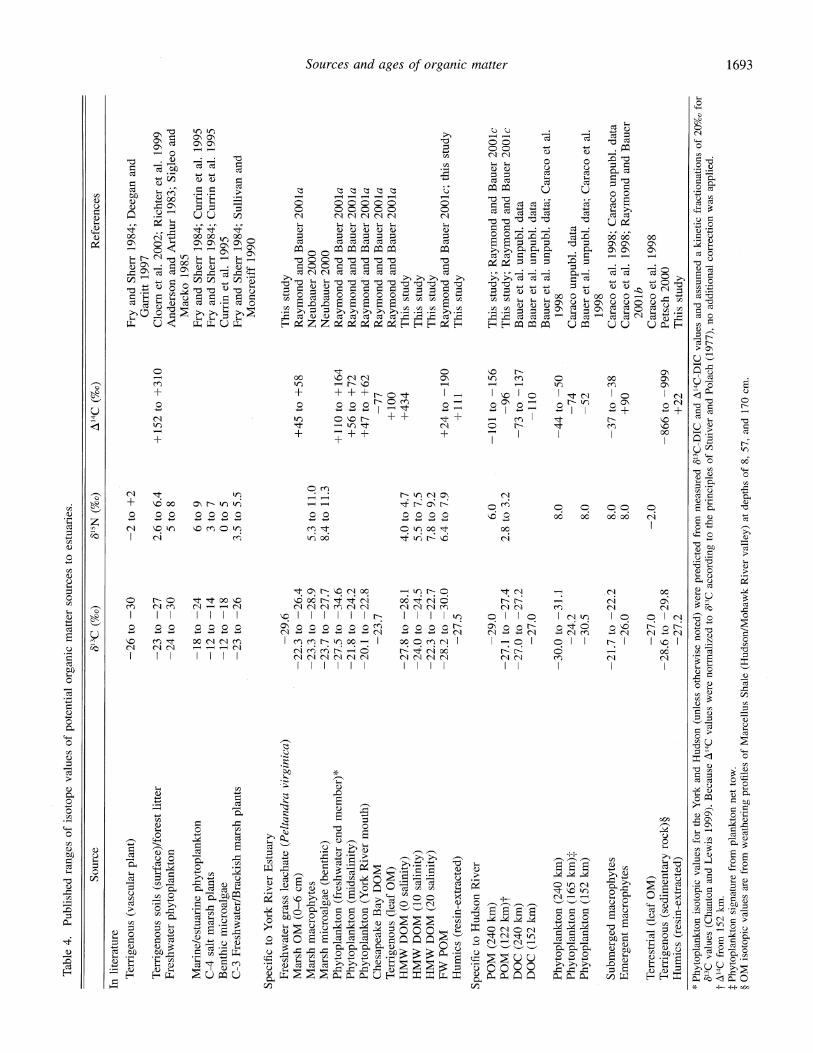
Table 4. Published ranges of isotope values of potential organic matter sources to estuaries.
Source 613C (%o) 615N (%o) A14C (%o) References
In literature
Terrigenous (vascular plant) -26 to -30
Terrigenous soils (surface)/forest litter Freshwater phytoplankton
-23 to -27 24 to -30
Marine/estuarine phytoplankton C-4 salt marsh plants Benthic microalgae C-3 Freshwater/Brackish marsh plants
-18 to -12 to -12 to -23 to
-2 to +2
2.6 to 6.4 5 to 8
-24 -14 -18 -26
+152 to +310
6 to 9 3 to 7 0 to 5
3.5 to 5.5
Fry and Sherr 1984; Deegan and Garritt 1997
Cloer et al. 2002; Richter et al. 1999 Anderson and Arthur 1983; Sigleo and
Macko 1985 Fry and Sherr 1984; Currin et al. 1995 Fry and Sherr 1984; Currin et al. 1995 Currin et al. 1995 Fry and Sherr 1984; Sullivan and
Moncreiff 1990
Specific to York River Estuary Freshwater grass leachate (Peltandra virginica) Marsh OM (0-6 cm) Marsh macrophytes Marsh microalgae (benthic) Phytoplankton (freshwater end member)* Phytoplankton (midsalinity) Phytoplankton (York River mouth) Chesapeake Bay DOM Terrigenous (leaf OM) HMW DOM (0 salinity) HMW DOM (10 salinity) HMW DOM (20 salinity) FW POM Humics (resin-extracted)
Specific to Hudson River POM (240 km) POM (122 km)t DOC (240 km) DOC (152 km)
Phytoplankton (240 km) Phytoplankton (165 km): Phytoplankton (152 km)
Submerged macrophytes Emergent macrophytes
Terrestrial (leaf OM) Terrigenous (sedimentary rock)? Humics (resin-extracted)
-29.6 -22.3 to -26.4 -23.3 to -28.9 -23.7 to -27.7 -27.5 to -34.6 -21.8 to -24.2 -20.1 to -22.8
-23.7
-27.8 to -28.1 -24.0 to -24.5 -22.3 to -22.7 -28.2 to -30.0
-27.5
-29.0 -27.1 to -27.4 -27.0 to -27.2
-27.0
-30.0 to -31.1 -24.2 -30.5
-21.7 to -22.2 -26.0
-27.0 28.6 to -29.8
-27.2
5.3 to 11.0 8.4 to 11.3
4.0 to 4.7 5.5 to 7.5 7.8 to 9.2 6.4 to 7.9
6.0 2.8 to 3.2
8.0
8.0
8.0 8.0
-2.0
+45 to +58
+110 to +164 +56 to +72 +47 to +62
-77 +100 +434
+24 to -190 +111
-101 to -156 -96
-73 to -137 -110
-44 to -50 -74 -52
-37 to -38 +90
-866 to -999 +22
This study Raymond and Bauer 2001a Neubauer 2000 Neubauer 2000 Raymond and Bauer 2001a Raymond and Bauer 2001a Raymond and Bauer 2001a Raymond and Bauer 2001a Raymond and Bauer 2001a This study This study This study Raymond and Bauer 2001c; this study This study
This study; Raymond and Bauer 2001c This study; Raymond and Bauer 2001c Bauer et al. unpubl. data Bauer et al. unpubl. data Bauer et al. unpubl. data; Caraco et al.
1998 Caraco unpubl. data Bauer et al. unpubl. data; Caraco et al.
1998 Caraco et al. 1998; Caraco unpubl. data Caraco et al. 1998; Raymond and Bauer
2001b Caraco et al. 1998 Petsch 2000 This study
* Phytoplankton isotopic values for the York and Hudson (unless otherwise noted) were predicted from measured 613C-DIC and A14C-DIC values and assumed a kinetic fractionations of 20%o fo] 8'3C values (Chanton and Lewis 1999). Because A14C values were normalized to (13C according to the principles of Stuiver and Polach (1977), no additional correction was applied.
t A14C from 152 km. t Phytoplankton signature from plankton net tow. ? OM isotopic values are from weathering profiles of Marcellus Shale (Hudson/Mohawk River valley) at depths of 8, 57, and 170 cm.
o
x
s
a C-1 Z.
Z I
Y
a
cs
(i. 0-7
r
McCallister et al.
also account for a significant fraction (5-60%) of total N uptake by bacteria (Kirchman 1994). The subsidization of N from inorganic sources may therefore limit the use of s15N for tracing OM sources.
The natural abundance of 14C may make it a useful alter- native tracer for examining the sources of OM supporting BBP (Cherrier et al. 1999). Its much greater dynamic range (>1,000%o), compared with s13C (-30%0) and 815N (-40%o) in coastal systems, potentially makes it a more sensitive trac- er of coastal and estuarine carbon and OM cycling (Ray- mond and Bauer 2001; Bauer et al. 2002). Radiocarbon also often displays a much broader range of values across poten- tial OM reservoirs than stable isotopes, which thus allows for greater differentiation of the sources of OM to a given pool.
Potential OM sources to York River estuarine bacteria- 813C-8'5N signatures of potential OM sources to bacteria: Potential inputs of OM to estuaries may arise from numerous allochthonous and autochthonous sources that span a broad range of A14C, b83C, and 815N signatures. For most systems, however, isotopic data with which to constrain potential OM sources are limited or incomplete, especially for 815N and A14C. Existing literature values (Table 4) were therefore compiled in an attempt to constrain the isotopic signatures of potential allochthonous and autochthonous OM sources supporting BBP.
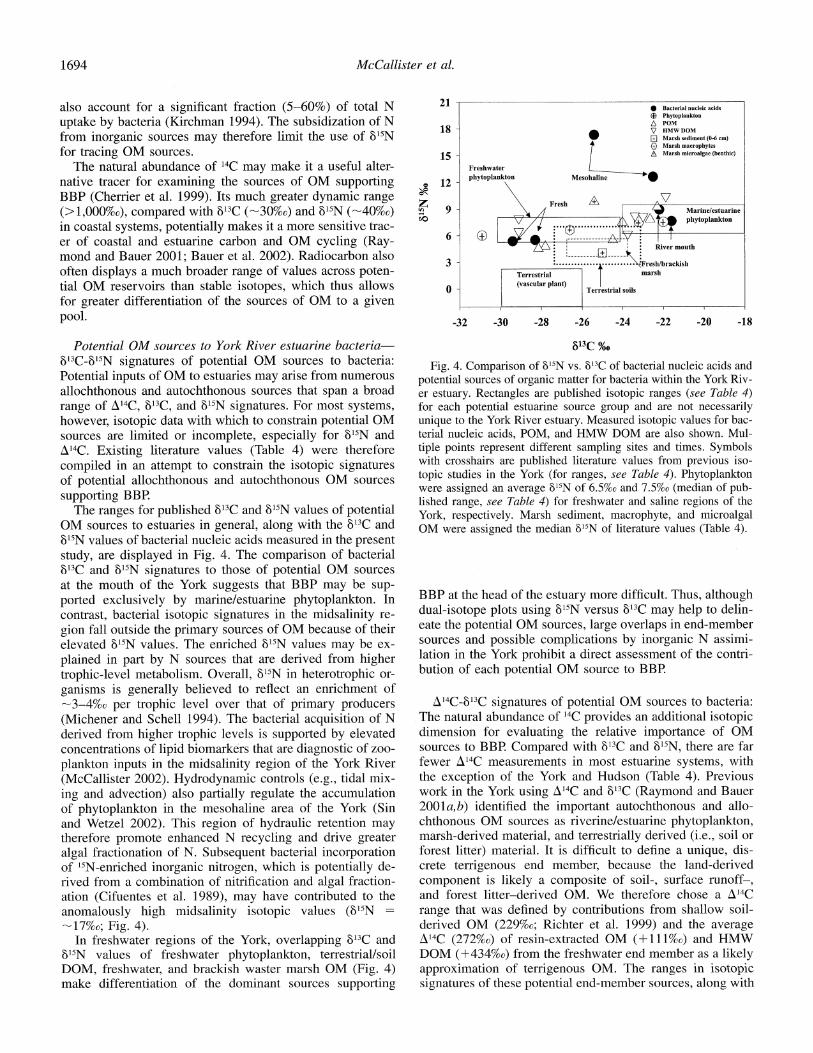
The ranges for published 6'3C and 815N values of potential OM sources to estuaries in general, along with the s13C and s85N values of bacterial nucleic acids measured in the present study, are displayed in Fig. 4. The comparison of bacterial 863C and 815N signatures to those of potential OM sources at the mouth of the York suggests that BBP may be sup- ported exclusively by marine/estuarine phytoplankton. In contrast, bacterial isotopic signatures in the midsalinity re- gion fall outside the primary sources of OM because of their elevated 815N values. The enriched s15N values may be ex- plained in part by N sources that are derived from higher trophic-level metabolism. Overall, s15N in heterotrophic or- ganisms is generally believed to reflect an enrichment of -3-4%0 per trophic level over that of primary producers (Michener and Schell 1994). The bacterial acquisition of N derived from higher trophic levels is supported by elevated concentrations of lipid biomarkers that are diagnostic of zoo- plankton inputs in the midsalinity region of the York River (McCallister 2002). Hydrodynamic controls (e.g., tidal mix- ing and advection) also partially regulate the accumulation of phytoplankton in the mesohaline area of the York (Sin and Wetzel 2002). This region of hydraulic retention may therefore promote enhanced N recycling and drive greater algal fractionation of N. Subsequent bacterial incorporation of 15N-enriched inorganic nitrogen, which is potentially de- rived from a combination of nitrification and algal fraction- ation (Cifuentes et al. 1989), may have contributed to the anomalously high midsalinity isotopic values (85N ~17%o; Fig. 4).
In freshwater regions of the York, overlapping 813C and 815N values of freshwater phytoplankton, terrestrial/soil DOM, freshwater, and brackish waster marsh OM (Fig. 4) make differentiation of the dominant sources supporting
21
18
15
12
9
6 - () I - --------- A--- v : I A: * , E River mouth
3 F : , ... Fresh/brackish Terrestrial marsh
(vascular plant) 0 - Terrestrial soils
-32 -30 -28 -26 -24 -22 -20 -18
613C %o
Fig. 4. Comparison of 815N vs. 813C of bacterial nucleic acids and potential sources of organic matter for bacteria within the York Riv- er estuary. Rectangles are published isotopic ranges (see Table 4) for each potential estuarine source group and are not necessarily unique to the York River estuary. Measured isotopic values for bac- terial nucleic acids, POM, and HMW DOM are also shown. Mul- tiple points represent different sampling sites and times. Symbols with crosshairs are published literature values from previous iso- topic studies in the York (for ranges, see Table 4). Phytoplankton were assigned an average 815N of 6.5%o and 7.5%0 (median of pub- lished range, see Table 4) for freshwater and saline regions of the York, respectively. Marsh sediment, macrophyte, and microalgal OM were assigned the median 815N of literature values (Table 4).
BBP at the head of the estuary more difficult. Thus, although dual-isotope plots using 815N versus 813C may help to delin- eate the potential OM sources, large overlaps in end-member sources and possible complications by inorganic N assimi- lation in the York prohibit a direct assessment of the contri- bution of each potential OM source to BBP.
A14C-b13C signatures of potential OM sources to bacteria: The natural abundance of 14C provides an additional isotopic dimension for evaluating the relative importance of OM sources to BBP. Compared with s83C and s15N, there are far fewer A'4C measurements in most estuarine systems, with the exception of the York and Hudson (Table 4). Previous work in the York using Az4C and 813C (Raymond and Bauer 2001a,b) identified the important autochthonous and allo- chthonous OM sources as riverine/estuarine phytoplankton, marsh-derived material, and terrestrially derived (i.e., soil or forest litter) material. It is difficult to define a unique, dis- crete terrigenous end member, because the land-derived component is likely a composite of soil-, surface runoff-, and forest litter-derived OM. We therefore chose a A14C
range that was defined by contributions from shallow soil- derived OM (229%o; Richter et al. 1999) and the average A14C (272%o) of resin-extracted OM (+111%o) and HMW DOM (+434%o) from the freshwater end member as a likely approximation of terrigenous OM. The ranges in isotopic signatures of these potential end-member sources, along with
1694
o
Sources and ages of organic matter
A ,E0
I
~~A~~~ ~A
I-.A ... .._ ......_..
1___!
All [
300 B
......'""' 200 - ...?
> rE. -*-s..- ......... ..........;p.. _
'***..- - *.
I__ _ 0
Freshwater -100 , I ..
_ . . . . .,
-36 -34 -32 -30 -28 -26 -24 -22 -2
,13c o^
300 C ia...
200 -
100- A.
o - ~ ~'
Mid-salinity -100
300 Terrigenous (soil) D Phytoplankton (estuarine) - *- Phytoplankton (freshwater) - -
200 - Marsh Chesapeake Bay (DOC) D Bacterial nucleic acids (mouth) 0 Bacterial nucleic acids (mid-salinity) A
100 - Bacterial nucleic acids (freshwater) y
0 -
100 iver mouth 20 -36 -34 -32 -30 -28 -26 -24 -22 -20
813C %o
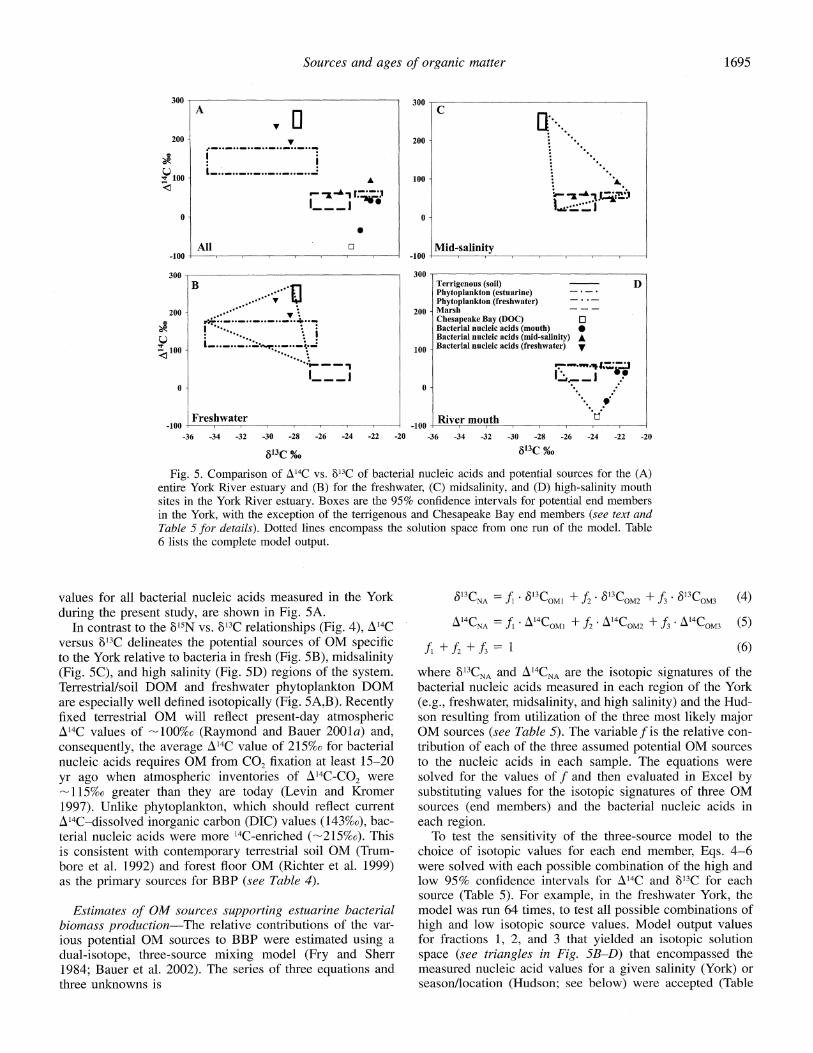
Fig. 5. Comparison of A14C vs. 813C of bacterial nucleic acids and potential sources for the (A) entire York River estuary and (B) for the freshwater, (C) midsalinity, and (D) high-salinity mouth sites in the York River estuary. Boxes are the 95% confidence intervals for potential end members in the York, with the exception of the terrigenous and Chesapeake Bay end members (see text and Table 5 for details). Dotted lines encompass the solution space from one run of the model. Table 6 lists the complete model output.
values for all bacterial nucleic acids measured in the York during the present study, are shown in Fig. 5A.
In contrast to the 815N vs. 13C relationships (Fig. 4), A14C versus 8'3C delineates the potential sources of OM specific to the York relative to bacteria in fresh (Fig. 5B), midsalinity (Fig. 5C), and high salinity (Fig. 5D) regions of the system. Terrestrial/soil DOM and freshwater phytoplankton DOM are especially well defined isotopically (Fig. 5A,B). Recently fixed terrestrial OM will reflect present-day atmospheric
1'4C values of -100%o (Raymond and Bauer 2001a) and, consequently, the average A14C value of 215%o for bacterial nucleic acids requires OM from CO2 fixation at least 15-20 yr ago when atmospheric inventories of A'4C-CO2 were -115%o greater than they are today (Levin and Kromer 1997). Unlike phytoplankton, which should reflect current A'4C-dissolved inorganic carbon (DIC) values (143%o), bac- terial nucleic acids were more 14C-enriched (-215%o). This is consistent with contemporary terrestrial soil OM (Trum- bore et al. 1992) and forest floor OM (Richter et al. 1999) as the primary sources for BBP (see Table 4).
Estimates of OM sources supporting estuarine bacterial biomass production-The relative contributions of the var- ious potential OM sources to BBP were estimated using a dual-isotope, three-source mixing model (Fry and Sherr 1984; Bauer et al. 2002). The series of three equations and three unknowns is
613CNA = fi * 813COM1 + f2 * 513CM2 + 3 . S13COM3 (4)
A14CNA = f, A14COM1 + f2 * A'4CM2 + f3 * A14CM3 (5)
f, + f, + f = 1 (6)
where 813CNA and A14CNA are the isotopic signatures of the bacterial nucleic acids measured in each region of the York (e.g., freshwater, midsalinity, and high salinity) and the Hud- son resulting from utilization of the three most likely major OM sources (see Table 5). The variable fis the relative con- tribution of each of the three assumed potential OM sources to the nucleic acids in each sample. The equations were solved for the values of f and then evaluated in Excel by substituting values for the isotopic signatures of three OM sources (end members) and the bacterial nucleic acids in each region.
To test the sensitivity of the three-source model to the choice of isotopic values for each end member, Eqs. 4-6 were solved with each possible combination of the high and low 95% confidence intervals for A14C and 813C for each source (Table 5). For example, in the freshwater York, the model was run 64 times, to test all possible combinations of high and low isotopic source values. Model output values for fractions 1, 2, and 3 that yielded an isotopic solution space (see triangles in Fig. 5B-D) that encompassed the measured nucleic acid values for a given salinity (York) or season/location (Hudson; see below) were accepted (Table
300
200
o
t 100
O
-lUU I llI I I I
1695
---
0
? "T 1-
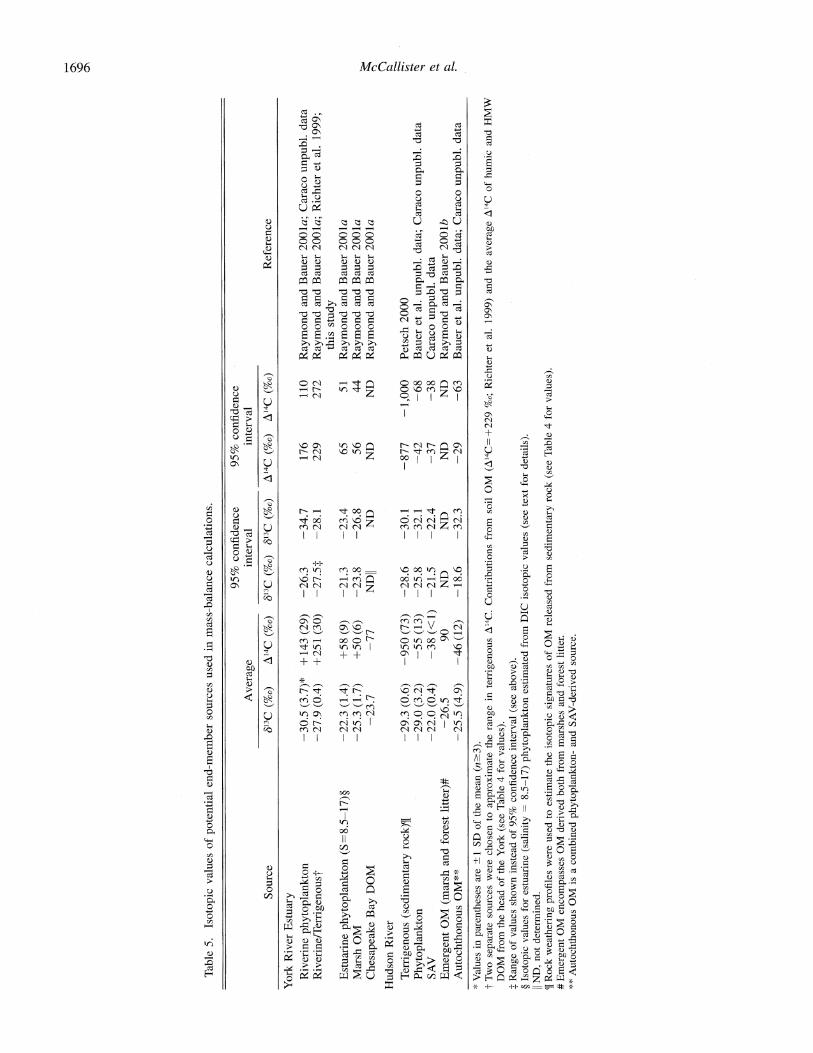
Table 5. Isotopic values of potential end-member sources used in mass-balance calculations.
95% confidence 95% confidence Average interval interval
Source 613C (%) A14C (%o) 613C (%o) '13C (%o) A14C (%o) A14C (%o) Reference
York River Estuary Riverine phytoplankton -30.5 (3.7)* +143 (29) -26.3 -34.7 176 110 Raymond and Bauer 2001a; Caraco unpubl. data Riverine/Terrigenoust -27.9 (0.4) +251 (30) -27.5: -28.1 229 272 Raymond and Bauer 2001a; Richter et al. 1999;
this study Estuarine phytoplankton (S=8.5-17)? -22.3 (1.4) +58 (9) -21.3 -23.4 65 51 Raymond and Bauer 2001a Marsh OM -25.3 (1.7) +50 (6) -23.8 -26.8 56 44 Raymond and Bauer 2001a Chesapeake Bay DOM -23.7 -77 NDII ND ND ND Raymond and Bauer 2001a
Hudson River
Terigenous (sedimentary rock)[ -29.3 (0.6) -950 (73) -28.6 -30.1 -877 -1,000 Petsch 2000 Phytoplankton -29.0 (3.2) -55 (13) -25.8 -32.1 -42 -68 Bauer et al. unpubl. data; Caraco unpubl. data SAV -22.0 (0.4) -38 (<1) -21.5 -22.4 -37 -38 Caraco unpubl. data Emergent OM (marsh and forest litter)# -26.5 90 ND ND ND ND Raymond and Bauer 2001b Autochthonous OM** -25.5 (4.9) -46 (12) -18.6 -32.3 -29 -63 Bauer et al. unpubl. data; Caraco unpubl. data
* Values in parentheses are + 1 SD of the mean (n>-3). t Two separate sources were chosen to approximate the range in terrigenous A14C. Contributions from soil OM (A14C=+229 %o; Richter et al. 1999) and the average A14C of humic and HMW
DOM from the head of the York (see Table 4 for values). t Range of values shown instead of 95% confidence interval (see above). ? Isotopic values for estuarine (salinity = 8.5-17) phytoplankton estimated from DIC isotopic values (see text for details). [ ND, not determined. ? Rock weathering profiles were used to estimate the isotopic signatures of OM released from sedimentary rock (see Table 4 for values). # Emergent OM encompasses OM derived both from marshes and forest litter. ** Autochthonous OM is a combined phytoplankton- and SAV-derived source.
rz
_
C') p t_.
_* rl z
I
Sources and ages of organic matter
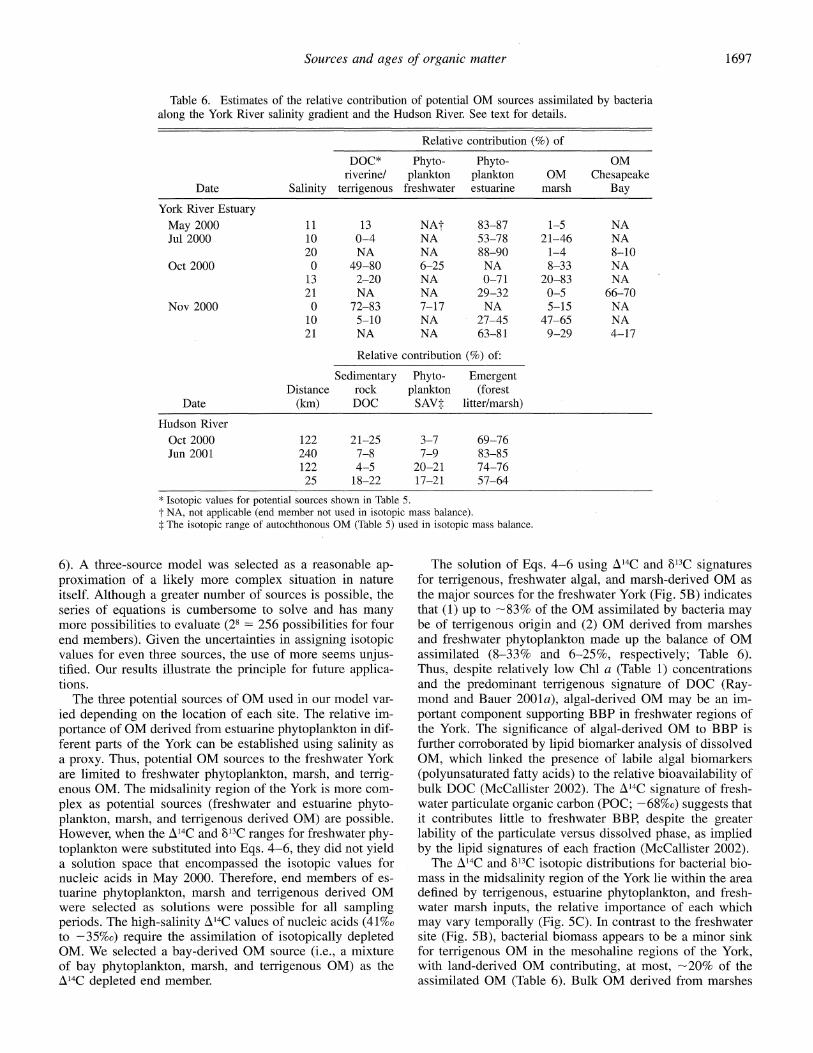
Table 6. Estimates of the relative contribution of potential OM sources assimilated by bacteria along the York River salinity gradient and the Hudson River. See text for details.
Relative contribution (%) of
DOC* Phyto- Phyto- OM riverine/ plankton plankton OM Chesapeake
Date Salinity terrigenous freshwater estuarine marsh Bay
York River Estuary May 2000 11 13 NAt 83-87 1-5 NA Jul 2000 10 0-4 NA 53-78 21-46 NA
20 NA NA 88-90 1-4 8--10 Oct 2000 0 49-80 6-25 NA 8-33 NA
13 2-20 NA 0-71 20-83 NA 21 NA NA 29-32 0-5 66--70
Nov 2000 0 72-83 7-17 NA 5-15 NA 10 5-10 NA 27-45 47-65 NA 21 NA NA 63-81 9-29 4-17
Relative contribution (%) of:
Sedimentary Phyto- Emergent Distance rock plankton (forest
Date (km) DOC SAV: litter/marsh)
Hudson River Oct 2000 122 21-25 3-7 69-76 Jun 2001 240 7-8 7-9 83-85
122 4-5 20-21 74-76 25 18-22 17-21 57-64
* Isotopic values for potential sources shown in Table 5. t NA, not applicable (end member not used in isotopic mass balance). $ The isotopic range of autochthonous OM (Table 5) used in isotopic mass balance.
6). A three-source model was selected as a reasonable ap- proximation of a likely more complex situation in nature itself. Although a greater number of sources is possible, the series of equations is cumbersome to solve and has many more possibilities to evaluate (28 = 256 possibilities for four end members). Given the uncertainties in assigning isotopic values for even three sources, the use of more seems unjus- tified. Our results illustrate the principle for future applica- tions.
The three potential sources of OM used in our model var- ied depending on the location of each site. The relative im- portance of OM derived from estuarine phytoplankton in dif- ferent parts of the York can be established using salinity as a proxy. Thus, potential OM sources to the freshwater York are limited to freshwater phytoplankton, marsh, and terrig- enous OM. The midsalinity region of the York is more com- plex as potential sources (freshwater and estuarine phyto- plankton, marsh, and terrigenous derived OM) are possible. However, when the A14C and 813C ranges for freshwater phy- toplankton were substituted into Eqs. 4-6, they did not yield a solution space that encompassed the isotopic values for nucleic acids in May 2000. Therefore, end members of es- tuarine phytoplankton, marsh and terrigenous derived OM were selected as solutions were possible for all sampling periods. The high-salinity A'4C values of nucleic acids (41%o to -35%0) require the assimilation of isotopically depleted OM. We selected a bay-derived OM source (i.e., a mixture of bay phytoplankton, marsh, and terrigenous OM) as the A14C depleted end member.
The solution of Eqs. 4-6 using A14C and 813C signatures for terrigenous, freshwater algal, and marsh-derived OM as the major sources for the freshwater York (Fig. 5B) indicates that (1) up to -83% of the OM assimilated by bacteria may be of terrigenous origin and (2) OM derived from marshes and freshwater phytoplankton made up the balance of OM assimilated (8-33% and 6-25%, respectively; Table 6). Thus, despite relatively low Chl a (Table 1) concentrations and the predominant terrigenous signature of DOC (Ray- mond and Bauer 2001a), algal-derived OM may be an im- portant component supporting BBP in freshwater regions of the York. The significance of algal-derived OM to BBP is further corroborated by lipid biomarker analysis of dissolved OM, which linked the presence of labile algal biomarkers (polyunsaturated fatty acids) to the relative bioavailability of bulk DOC (McCallister 2002). The A14C signature of fresh- water particulate organic carbon (POC; -68%0) suggests that it contributes little to freshwater BBP, despite the greater lability of the particulate versus dissolved phase, as implied by the lipid signatures of each fraction (McCallister 2002).
The A'4C and 613C isotopic distributions for bacterial bio- mass in the midsalinity region of the York lie within the area defined by terrigenous, estuarine phytoplankton, and fresh- water marsh inputs, the relative importance of each which may vary temporally (Fig. 5C). In contrast to the freshwater site (Fig. 5B), bacterial biomass appears to be a minor sink for terrigenous OM in the mesohaline regions of the York, with land-derived OM contributing, at most, -20% of the assimilated OM (Table 6). Bulk OM derived from marshes
1697
McCallister et al.
was -2%o to 4%o depleted in s83C relative to phytoplankton sources, but both sources were similar in their A14C signa- tures (Table 5, Fig. 5C). During spring and summer (May and July 2000), the bacterial isotopic distribution is best de- scribed by OM primarily of phytoplankton origin, which contributed 53-87% of the bacterial nucleic acid signature (Table 6; Fig. 5C). Potential solutions to the three-source model for the midsalinity region in October yielded a broad range of estimated contributions from the two primary sourc- es: algal (0-71%) and marsh-derived (20-83%) OM (Table 6). These ranges are a consequence of the broad ranges in isotopic values for the potential OM sources (large rectan- gles in Fig. 5) and the multiple solutions to Eqs. 4-6. How- ever, solutions to the model suggest that marsh-derived OM is of greater importance to BBP in the fall (October and November 2000), and accounts for an estimated 20-83% of the OM assimilated by bacteria, compared with in the spring (1-5%; Table 6). Bacterial assimilation of marsh-derived OM coincides with Peltandra senescence and a -90% re- duction in above-ground biomass from mean summer values (Neubauer et al. 2000).
These findings are consistent with previous work in the York, which indicated that marshes in the low-salinity reach- es are sites of intense OM recycling and export -60 g C m-2 yr-~ (Neubauer et al. 2000). Furthermore, marsh-derived OM is thought to subsidize a significant portion of BBP in the York (Raymond and Bauer 2001a). The enriched '83C signatures of bacterial nucleic acids that appear to corre- spond almost exclusively with OM of phytoplankton origin may alternatively result from the selective utilization of an isotopically enriched component of marsh-derived OM. In addition, bacteria are expected to preferentially assimilate more highly reactive components of DOM and to discrimi- nate between individual compounds derived from the same source reservoir (Benner 1987; Coffin et al. 1990). For ex- ample, Coffin et al. (1990) suggested that bacteria selected cellulose and hemicellulose components of Spartina alter- niflora and discriminated against the more refractory and isotopically lighter lignin component. Conceivably, the anomalously light 813C value (-27.6%o) from the mouth of the York in May 2000 may reflect a preferential assimilation of more bioreactive OM compounds.
Isotopic distributions of bacterial nucleic acids from the high-salinity mouth of the York were best described by pri- mary contributions from in situ algal production and the landward advection of Chesapeake Bay OM and secondary contributions from marsh-derived OM (Fig. 5D; Table 6). Although marsh-derived OM was not a dominant source (<29%) of OM supporting BBP in the high-salinity regions of the York (Fig. 5D, Table 6), its greatest contribution was in November, consistent with the increased importance of marsh-derived OM during fall in the midsalinity region. In July and November, bacteria from the lower York assimilat- ed OM of estuarine phytoplankton origin almost exclusively (63-90%), with nominal contributions from Chesapeake Bay DOC (4-17%; Table 6, Fig. 5D). In contrast, in October 2000, when Chl a concentrations declined by 72% and 50% over July and November values (Table 1), respectively, al- lochthonous (Bay) OM made up the greater portion (66- 70%) of OM assimilated by bacteria in the lower York (Table
6). This finding challenges the widely held assumption that OM age and bioavailability are inversely related, because approximately two-thirds of the OM assimilated was older and more depleted of A14C than alternative sources (i.e., phy- toplankton and marsh). In contrast to the conclusions of Ray- mond and Bauer (2001a) in the York and Cherrier et al. (1999) from the Santa Rosa Sound (Florida), who found that bacteria were solely supported by OM of modern origin, our results suggest a greater complexity in the age and source of OM assimilated by estuarine bacteria.
Potential OM sources to bacterial production in the Hud- son River-In comparison to the York River estuary, fewer stable isotopic and radiocarbon values are available for Hud- son River OM. Table 4 lists the available 813C, b15N, and A14C values for potential OM sources at stations sampled in the freshwater Hudson River. Corning Preserve, the north- ward extent of sampling, is primarily influenced by large inputs of allochthonous carbon from the surrounding water- shed, which flows over the Green Island Dam at Troy, New York. In contrast, the middle sampling location (Poughkeep- sie) may be influenced by OM export from freshwater wet- lands (i.e., near Tivoli Bays), release from shoals and fine sediments (i.e., near Kingston), and input from additional tributaries (near Roundout Creek; Table 4; Findlay et al. 1998). Terrestrial inputs to the Hudson River are relatively large in comparison to autochthonous sources and are esti- mated at -650 g C m-2 yr-1 (Howarth et al. 1996). Con- versely, combined in situ phytoplankton and macrophyte production in the Hudson accounts for only -5% of the OM supplied by allochthonous sources (Howarth et al. 1996). It is important to note that human-induced (e.g., urban devel- opment and agriculture) and ecological (i.e., introduction of Dreissena) changes over the past 200 yr may have funda- mentally altered the biogeochemical functioning of the Hud- son River ecosystem by artificially inflating the current im- portance of terrestrial OM inputs to the food web (Howarth et al. 1991, 1996; Smith et al. 1998).
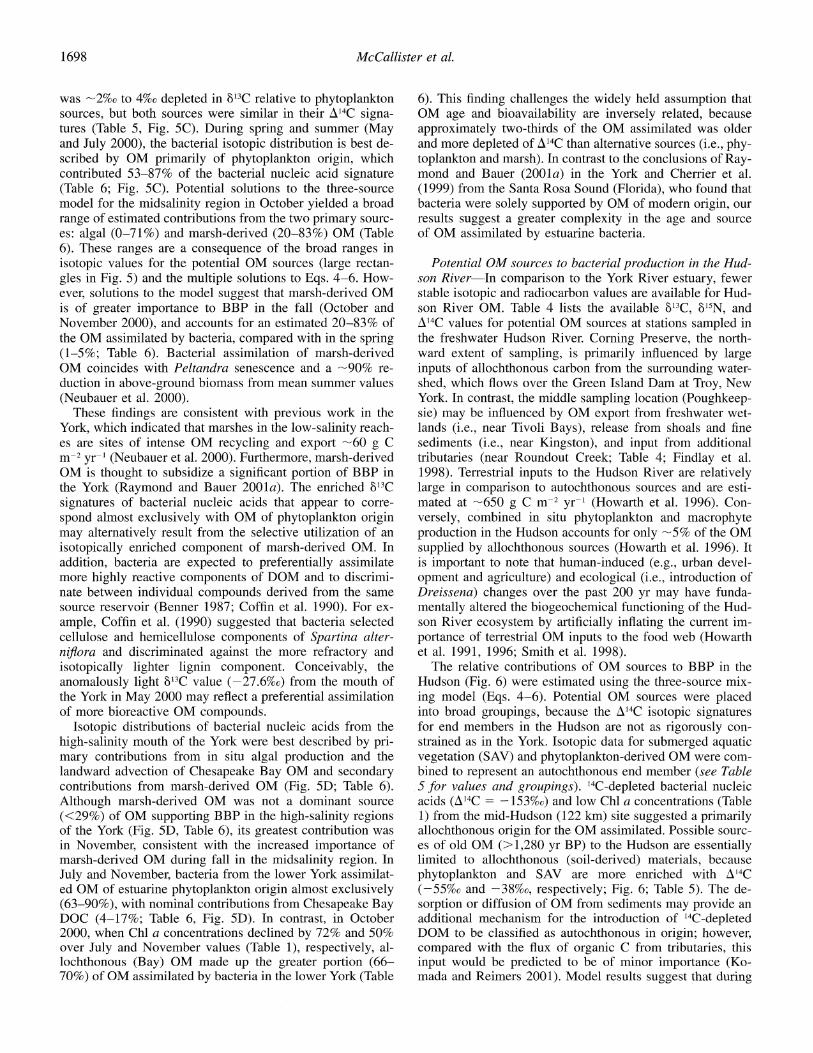
The relative contributions of OM sources to BBP in the Hudson (Fig. 6) were estimated using the three-source mix- ing model (Eqs. 4-6). Potential OM sources were placed into broad groupings, because the A14C isotopic signatures for end members in the Hudson are not as rigorously con- strained as in the York. Isotopic data for submerged aquatic vegetation (SAV) and phytoplankton-derived OM were com- bined to represent an autochthonous end member (see Table 5 for values and groupings). 14C-depleted bacterial nucleic acids (A14C = -153%o) and low Chl a concentrations (Table 1) from the mid-Hudson (122 km) site suggested a primarily allochthonous origin for the OM assimilated. Possible sourc- es of old OM (>1,280 yr BP) to the Hudson are essentially limited to allochthonous (soil-derived) materials, because phytoplankton and SAV are more enriched with A14C (-55%o and -38%0, respectively; Fig. 6; Table 5). The de- sorption or diffusion of OM from sediments may provide an additional mechanism for the introduction of '4C-depleted DOM to be classified as autochthonous in origin; however, compared with the flux of organic C from tributaries, this input would be predicted to be of minor importance (Ko- mada and Reimers 2001). Model results suggest that during
1698
Sources and ages of organic matter
small, input of other OM sources (e.g., sewage or marine/ estuarine phytoplankton) that was not taken into account in the model solutions. Collectively, our findings of the relative proportion of potential sources contributing to BBP in the Hudson (Table 6) are consistent with the conclusions of Findlay et al. (1998), who suggested that the relative im- portance of OM sources to BBP is determined by quantita- tive differences in source inputs.
P ....'
* . . *
*: -o . .
"oo
..' * . Differences in the OM sources supporting BBP in the York
'..' . Ti CThous pytpanktonSAV) and Hudson-System net heterotrophy in the York River ? ,~ * --'-- Autochthonous (phytoplankton/SAV)
Emergent plants(forest itter/marsh) estuary (Raymond et al. 2000) and Hudson River (Findlay A km 122 (Oct 2000)
km240(Jun 2001) et al. 1991; Howarth et al. 1996), and in rivers and estuaries A km 122 (Jun 2001) v km 25 (Jun2001) in general (Raymond and Bauer 2001b), necessitates the uti-
-32 -28 -24 -20 -16 lization of allochthonous OM within these systems. The York and Hudson appear to be fundamentally similar with
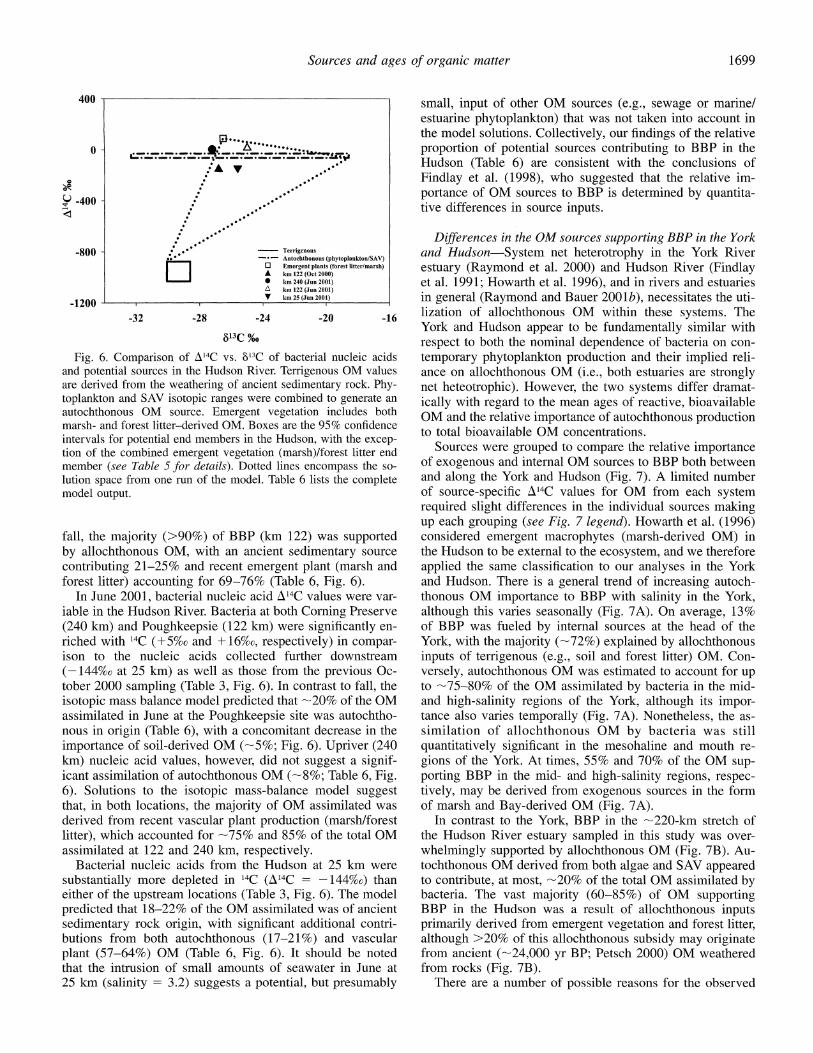
613C %0 respect to both the nominal dependence of bacteria on con- 6. Comparison of A14C vs. 813C of bacterial nucleic acids temporary phytoplankton production and their implied reli- ential sources in the Hudson River. Terrigenous OM values ance on allochthonous OM (i.e., both estuaries are strongly ved from the weathering of ancient sedimentary rock. Phy- net heteotrophic). However, the two systems differ dramat- ton and SAV isotopic ranges were combined to generate an ically with regard to the mean ages of reactive, bioavailable honous OM source. Emergent vegetation includes both OM and the relative importance of autochthonous production and forest litter-derived OM. Boxes are the 95% confidence to tol be M to total bioavailable OM concentrations. s for potential end members in the Hudson, with the excep- the combined emergent vegetation (marsh)/forest litter end ources were group to comar the relative importance r (see Table 5 for details). Dotted lines encompass the so- of exogenous and internal OM sources to BBP both between pace from one run of the model. Table 6 lists the complete and along the York and Hudson (Fig. 7). A limited number Dutput. of source-specific A'4C values for OM from each system
required slight differences in the individual sources making up each grouping (see Fig. 7 legend). Howarth et al. (1996)
e majority (>90%) of BBP (km 122) was supported considered emergent macrophytes (marsh-derived OM) in )chthonous OM, with an ancient sedimentary source the Hudson to be external to the ecosystem, and we therefore ruting 21-25% and recent emergent plant (marsh and applied the same classification to our analyses in the York litter) accounting for 69-76% (Table 6, Fig. 6). and Hudson. There is a general trend of increasing autoch- Lne 2001, bacterial nucleic acid A14C values were var- thonous OM importance to BBP with salinity in the York, a the Hudson River. Bacteria at both Corning Preserve although this varies seasonally (Fig. 7A). On average, 13% m) and Poughkeepsie (122 km) were significantly en- of BBP was fueled by internal sources at the head of the with 14C (+5%0 and +16%o, respectively) in compar- York, with the majority (-72%) explained by allochthonous o the nucleic acids collected further downstream inputs of terrigenous (e.g., soil and forest litter) OM. Con- %0 at 25 km) as well as those from the previous Oc- versely, autochthonous OM was estimated to account for up '000 sampling (Table 3, Fig. 6). In contrast to fall, the to -75-80% of the OM assimilated by bacteria in the mid- c mass balance model predicted that -20% of the OM and high-salinity regions of the York, although its impor- lated in June at the Poughkeepsie site was autochtho- tance also varies temporally (Fig. 7A). Nonetheless, the as- i origin (Table 6), with a concomitant decrease in the similation of allochthonous OM by bacteria was still ance of soil-derived OM (-5%; Fig. 6). Upriver (240 quantitatively significant in the mesohaline and mouth re- icleic acid values, however, did not suggest a signif- gions of the York. At times, 55% and 70% of the OM sup- ssimilation of autochthonous OM (-8%; Table 6, Fig. porting BBP in the mid- and high-salinity regions, respec- lutions to the isotopic mass-balance model suggest tively, may be derived from exogenous sources in the form l both locations, the majority of OM assimilated was of marsh and Bay-derived OM (Fig. 7A). I from recent vascular plant production (marsh/forest In contrast to the York, BBP in the -220-km stretch of which accounted for -75% and 85% of the total OM the Hudson River estuary sampled in this study was over- lated at 122 and 240 km, respectively. whelmingly supported by allochthonous OM (Fig. 7B). Au- terial nucleic acids from the Hudson at 25 km were tochthonous OM derived from both algae and SAV appeared itially more depleted in 14C (A14C = -144%o) than to contribute, at most, -20% of the total OM assimilated by of the upstream locations (Table 3, Fig. 6). The model bacteria. The vast majority (60-85%) of OM supporting :ed that 18-22% of the OM assimilated was of ancient BBP in the Hudson was a result of allochthonous inputs rntary rock origin, with significant additional contri- primarily derived from emergent vegetation and forest litter, s from both autochthonous (17-21%) and vascular although >20% of this allochthonous subsidy may originate 57-64%) OM (Table 6, Fig. 6). It should be noted from ancient (-24,000 yr BP; Petsch 2000) OM weathered e intrusion of small amounts of seawater in June at from rocks (Fig. 7B). (salinity = 3.2) suggests a potential, but presumably There are a number of possible reasons for the observed
400
0
Y -400
-800
-1200
Fig. and pot are deri toplank autochtl marsh- interval tion of membei lution s model c
fall, th by allc contrib forest ]
In Ji iable ir (240 ki riched ison t{ (-1441 tober 2 isotopi assimil nous ir import km) nu icant a; 6). Sol that, in derivec litter), assimil
Bact substar either ( predict sedime butions plant ( that th 25 km
1699
McCallister et al.
Autochthonous (phytoplankton FW/estuarine) Terrigenous Emergent (marsh) Chesapeake Bay DOC
Fresh Mesohaline River mouth
Autochthonous (phytoplankton/SAV) Terrigenous (sedimentary rock) Emergent OM (marsh/forest litter)
km 244 km 122 km 25
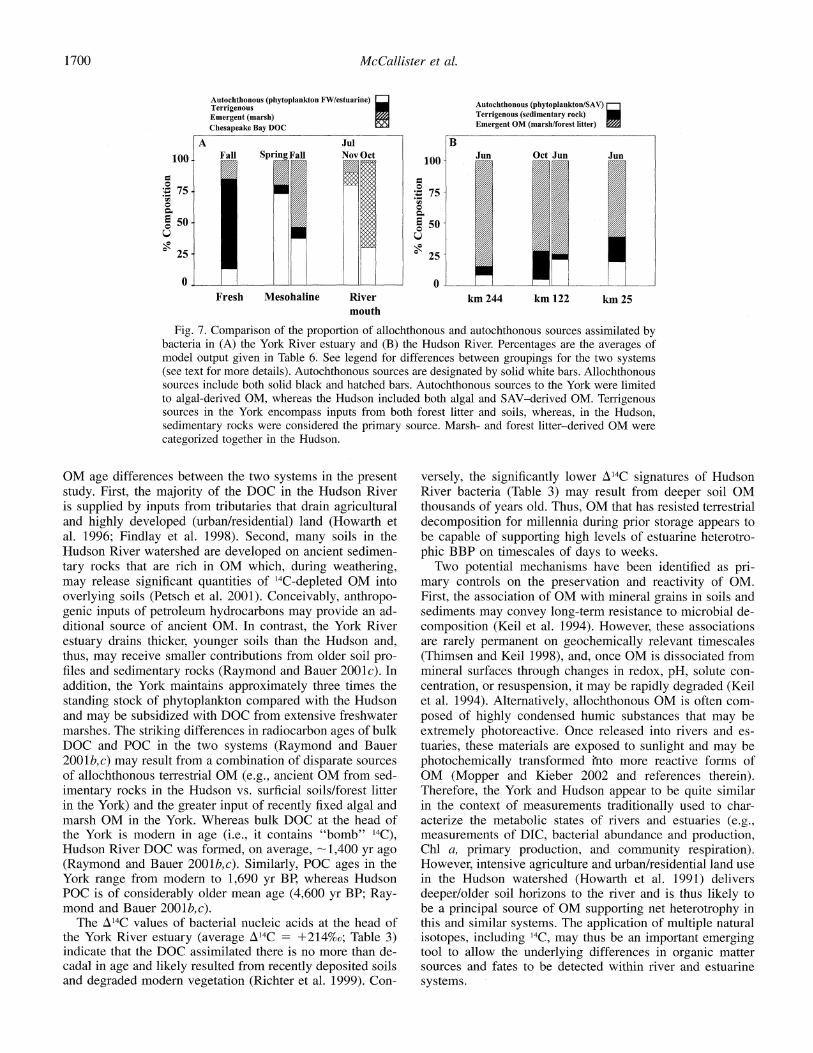
Fig. 7. Comparison of the proportion of allochthonous and autochthonous sources assimilated by bacteria in (A) the York River estuary and (B) the Hudson River. Percentages are the averages of model output given in Table 6. See legend for differences between groupings for the two systems (see text for more details). Autochthonous sources are designated by solid white bars. Allochthonous sources include both solid black and hatched bars. Autochthonous sources to the York were limited to algal-derived OM, whereas the Hudson included both algal and SAV-derived OM. Terrigenous sources in the York encompass inputs from both forest litter and soils, whereas, in the Hudson, sedimentary rocks were considered the primary source. Marsh- and forest litter-derived OM were categorized together in the Hudson.
OM age differences between the two systems in the present study. First, the majority of the DOC in the Hudson River is supplied by inputs from tributaries that drain agricultural and highly developed (urban/residential) land (Howarth et al. 1996; Findlay et al. 1998). Second, many soils in the Hudson River watershed are developed on ancient sedimen- tary rocks that are rich in OM which, during weathering, may release significant quantities of '4C-depleted OM into overlying soils (Petsch et al. 2001). Conceivably, anthropo- genic inputs of petroleum hydrocarbons may provide an ad- ditional source of ancient OM. In contrast, the York River estuary drains thicker, younger soils than the Hudson and, thus, may receive smaller contributions from older soil pro- files and sedimentary rocks (Raymond and Bauer 2001c). In addition, the York maintains approximately three times the standing stock of phytoplankton compared with the Hudson and may be subsidized with DOC from extensive freshwater marshes. The striking differences in radiocarbon ages of bulk DOC and POC in the two systems (Raymond and Bauer 2001b,c) may result from a combination of disparate sources of allochthonous terrestrial OM (e.g., ancient OM from sed- imentary rocks in the Hudson vs. surficial soils/forest litter in the York) and the greater input of recently fixed algal and marsh OM in the York. Whereas bulk DOC at the head of the York is modern in age (i.e., it contains "bomb" 14C), Hudson River DOC was formed, on average, -1,400 yr ago (Raymond and Bauer 2001b,c). Similarly, POC ages in the York range from modern to 1,690 yr BP, whereas Hudson POC is of considerably older mean age (4,600 yr BP; Ray- mond and Bauer 2001b,c).
The A14C values of bacterial nucleic acids at the head of the York River estuary (average A14C = +214%o; Table 3) indicate that the DOC assimilated there is no more than de- cadal in age and likely resulted from recently deposited soils and degraded modern vegetation (Richter et al. 1999). Con-
versely, the significantly lower A14C signatures of Hudson River bacteria (Table 3) may result from deeper soil OM thousands of years old. Thus, OM that has resisted terrestrial decomposition for millennia during prior storage appears to be capable of supporting high levels of estuarine heterotro- phic BBP on timescales of days to weeks.
Two potential mechanisms have been identified as pri- mary controls on the preservation and reactivity of OM. First, the association of OM with mineral grains in soils and sediments may convey long-term resistance to microbial de- composition (Keil et al. 1994). However, these associations are rarely permanent on geochemically relevant timescales (Thimsen and Keil 1998), and, once OM is dissociated from mineral surfaces through changes in redox, pH, solute con- centration, or resuspension, it may be rapidly degraded (Keil et al. 1994). Alternatively, allochthonous OM is often com- posed of highly condensed humic substances that may be extremely photoreactive. Once released into rivers and es- tuaries, these materials are exposed to sunlight and may be photochemically transformed into more reactive forms of OM (Mopper and Kieber 2002 and references therein). Therefore, the York and Hudson appear to be quite similar in the context of measurements traditionally used to char- acterize the metabolic states of rivers and estuaries (e.g., measurements of DIC, bacterial abundance and production, Chl a, primary production, and community respiration). However, intensive agriculture and urban/residential land use in the Hudson watershed (Howarth et al. 1991) delivers deeper/older soil horizons to the river and is thus likely to be a principal source of OM supporting net heterotrophy in this and similar systems. The application of multiple natural isotopes, including 14C, may thus be an important emerging tool to allow the underlying differences in organic matter sources and fates to be detected within river and estuarine systems.
100
0 o o._ 75 0
u5 V1' o? ?U
1700
Sources and ages of organic matter
A traditional paradigm in biogeochemistry has been that terrigenous OM is refractory and that its age is a reasonable first-order indicator of bioreactivity. Although this paradigm has undergone revision (Moran and Hodson 1994), the term "old" still remains synonymous with refractory. However, A14C values of bacterial nucleic acids in the Hudson River estuary suggest that the terms "refractory" and "old" are not necessarily interchangeable. Additionally, bacteria from both the Hudson and York were shown to incorporate sub- stantial amounts of terrigenous OM into their biomass. The present findings of OM assimilation by bacteria suggest the existence of broad classifications of OM reactivity based on source (e.g., terrigenous) or age are not entirely valid.
References
ANDERSON, T. E, AND M. A. ARTHUR. 1983. Stable isotopes of oxygen and carbon and their application to sedimentologic and paleoenvironmental problems, p. 1-151. In M. A. Arthur, T. E Anderson, I. R. Kaplan, J. Veizer, and L. S. Land [eds.], Stable isotopes in sedimentary geology. Soc. Econ. Paleontol. Min- eral.
BAUER, J. E., E. R. M. DRUFFEL, D. M. WOLGAST, AND S. GRIFFIN. 2002. Temporal and regional variability in sources and cycling of DOC and POC in the northwest Atlantic continental shelf and slope. Deep-Sea Res. II 49: 4387-4419.
BENNER, R., M. L. FOGEL, E. K. SPRAGUE, AND R. E. HODSON. 1987. Depletion of 13C in lignin and its implications for stable carbon isotope studies. Nature 327: 708-710.
CANUEL, E. A., J. E. CLOERN, D. B. RINGELBERG, J. B. GUCKERT, AND G. H. RAU. 1995. Molecular and isotopic tracers used to examine sources of organic matter and its incorporation into the food webs of San Francisco Bay. Limnol. Oceanogr. 40: 67-81.
CARACO, N. E, G. LAPMAN, J. J. COLE, K. E. LIMBURG, M. L. PACE, AND D. FISCHER. 1998. Microbial assimilation of DIN in a
nitrogen rich estuary: Implications for food quality and isotope studies. Mar. Ecol. Prog. Ser. 167: 59-71.
CHANTON, J. P., AND F G. LEWIS. 1999. Plankton and dissolved
inorganic carbon isotopic composition in a river-dominated es- tuary: Apalachicola Bay, Florida. Limnol. Oceanogr. 22: 575- 583.
CHERRIER, J. E. 1997. Carbon flow through bacterioplankton in eastern North Pacific surface waters. Ph.D. dissertation, Florida State Univ.
, J. E. BAUER, E. M. DRUFFEL, R. B. COFFIN, AND J. P. CHANTON. 1999. Radiocarbon in marine bacteria: Evidence for the ages of assimilated carbon. Limnol. Oceanogr. 44: 730- 736.
CIFUENTES, L. A., M. L. FOGEL, J. R. PENNOCK, AND J. H. SHARP. 1989. Biogeochemical factors that influence the stable nitrogen isotope ratio of dissolved ammonium in the Delaware Estuary. Geochim. Cosmochim. Acta 53: 2713-2721.
CLOERN, J. E., E. A. CANUEL, AND D. HARRIS. 2002. Stable carbon and nitrogen isotope composition of aquatic and terrestrial plants of the San Francisco Bay estuarine system. Limnol. Oceanogr. 47: 713-729.
COFFIN, R. B., AND L. A. CIFUENTES. 1993. Approaches for mea- suring stable carbon and nitrogen isotopes in bacteria, p. 663- 675. In P. Kemp, B. E Sherr, E. B. Sherr, and J. J. Cole [eds.], Handbook of methods in aquatic microbial ecology. Lewis.
, AND . 1999. Stable isotope analysis of carbon cy- cling in the Perdido Estuary, Florida. Estuaries 22: 917-926.
COFFIN, R. B., B. FRY, B. J. PETERSON, AND R. T WRIGHT. 1989. Carbon isotopic composition of estuarine bacteria. Limnol. Oceanogr. 34: 1305-1310.
COFFIN, R. B., D. J. VELINSKY, R. DEVEREUX, W. A. PRICE, AND L. A. CIFUENTES. 1990. Stable carbon isotope analysis of nu- cleic acids to trace sources of dissolved substrates used by estuarine bacteria. Appl. Environ. Microbiol. 56: 2012-2020.
CURRIN, C. A., S. Y. NEWELL, AND H. W. PEARL. 1995. The role of standing dead Spartina alterniflora and benthic microalgae in salt marsh food webs: Considerations based on multiple sta- ble isotope analysis. Mar. Ecol. Prog. Ser. 121: 99-116.
DEEGAN, L. A., AND R. H. GARRITT. 1997. Evidence for spatial variability in estuarine food webs. Mar. Ecol. Prog. Ser. 147: 31-47.
DEL GIORGIO, P., AND J. DAVIS. 2003. Patterns in dissolved organic matter lability and consumption across aquatic ecosystems, p. 400-424. In S. E. G. Findlay and R. L. Sinsabaugh [eds.], Aquatic ecosystems: Interactivity of dissolved organic matter. Academic.
EDGECOMB, V. P., J. H. MCDONALD, R. DEVEREUX, AND D. W. SMITH. 1999. Estimation of bacterial cell numbers in humic acid-rich salt marsh sediments with probes directed to 16S ri- bosomal DNA. Appl. Environ. Microbiol. 65: 1516-1523.
ELDRIDGE, P. M., AND M. E. SIERACKI. 1993. Biological and hy- drodynamic regulation of the microbial food web in a period- ically mixed estuary. Limnol. Oceanogr. 38: 1666-1679.
FINDLAY, S., M. L. PACE, AND D. LINTS. 1992. Bacterial metabo- lism of organic carbon in the tidal freshwater Hudson estuary. Mar. Ecol. Prog. Ser. 89: 147-153.
, , , D. LINTS, J. J. COLE, N. CARACO, AND B. PEIERLS. 1991. Weak coupling of bacterial and algal pro- duction in a heterotrophic ecosystem, the Hudson River estu- ary. Limnol. Oceanogr. 36: 268-278.
, R. L. SINSABAUGH, D. T. FISHER, AND P. FRANCHINI. 1998. Sources of dissolved organic carbon supporting planktonic bac- terial production in the tidal freshwater Hudson River. Ecosys- tems 1: 227-239.
FRANKIGNOULLE, M., AND OTHERS. 1998. Carbon dioxide emission from European estuaries. Science 282: 434-436.
FRY, B., AND E. B. SHERR. 1984. 13C Measurements as indicators of carbon flow in marine and freshwater ecosystems. Contrib. Mar. Sci. 27: 13-47.
HEDGES, J. I., R. G. KEIL, AND R. BENNER. 1997. What happens to terrestrial organic matter in the ocean? Org. Geochem. 27: 195-212.
HOPKINSON JR., C. S., J. GIBLIN, R. H. GARRITT, J. TUCKER, AND M. A. J. HULLAR. 1998. Influence of the benthos on growth of planktonic estuarine bacteria. Aquat. Microb. Ecol. 16: 109- 118.
HOWARTH, R. W., J. R. FRUCI, AND D. SHERMAN. 1991. Inputs of sediment and carbon to an estuarine ecosystem: Influence of land use. Ecol. Appl. 1: 27-39.
, R. SCHNEIDER, AND D. SWANEY. 1996. Metabolism and organic carbon fluxes in the tidal freshwater Hudson River. Estuaries 19: 848-865.
ITTEKOT, V. 1989. Global trends in the nature of organic matter in river suspension. Nature 332: 436-438.
JACKSON, C. R., J. P. HARPER, D. WILLOUGHBY, E. E. RODEN, AND P. F CHURCHILL. 1997. A simple efficient method for the sep- aration of humic substances and DNA from environmental samples. Appl. Environ. Microbiol. 63: 4993-4995.
KEIL, R. G., D. B. MONTLUCON, E G. PRAHL, AND J. I. HEDGES. 1994. Sorptive preservation of labile organic matter in marine sediments. Nature 370: 549-552.
KIRCHMAN, D. L. 1994. The uptake of inorganic nutrients by het- erotrophic bacteria. Microb. Ecol. 28: 255-271.
1701
McCallister et al.
KOMADA, T., AND C. E. REIMERS. 2001. Resuspension-induced par- titioning of organic carbon between solid and solution phases from a river-ocean transition. Mar. Chem. 76: 155-174.
LAJTHA, K., AND R. H. MICHENER. 1994. Stable isotopes in ecology and environmental science. Blackwell Scientific.
LEVIN, I., AND B. KROMER. 1997. Twenty years of atmospheric 14CO2 observations at Schauinsland station, Germany. Radio- carbon 39: 205-218.
MANNINO, A., AND H. R. HARVEY. 2000. Terrigenous dissolved or-
ganic matter along an estuarine gradient and its flux to the coastal ocean. Org. Geochem. 31: 1611-1625.
MANTOURA, R. E C., AND E. M. S. WOODWARD. 1983. Conserva- tive behavior of riverine DOC in the Severn Estuary: Chemical and geochemical implications. Geochim. Cosmochim. Acta 7: 1293-1309.
MCCALLISTER, S. L. 2002. Organic matter cycling in the York River estuary, VA: An analysis of potential sources and sinks. Ph.D. dissertation, School of Marine Science, The College of William and Mary.
MICHENER, R. H., AND D. M. SCHELL. 1994. Stable isotope ratios as tracers in marine aquatic food webs, p. 138-157. In K. Lajtha and R. H. Michener [eds.], Methods in ecology: Stable isotopes in ecology and environmental science. Blackwell Sci- entific.
MOPPER, K., AND D. J. KIEBER. 2002. Photochemistry and the cy- cling of carbon, sulfur, nitrogen and phosphorus, p. 455-508. In D. A. Hansell and C. A. Carlson [eds.], Biogeochemistry of marine dissolved organic matter. Academic.
MORAN, M. A., AND R. E. HODSON. 1994. Support of bacterioplank- ton production by dissolved humic substances from three ma- rine environments. Mar. Ecol. Prog. Ser. 110: 241-247.
NEUBAUER, S. C. 2000. Carbon dynamics in a tidal freshwater marsh. Ph.D. dissertation, School of Marine Science, The Col- lege of William and Mary.
, W. D. MILLER, AND I. C. ANDERSON. 2000. Carbon cycling in a tidal freshwater marsh ecosystem: A carbon gas flux study. Mar. Ecol. Prog. Ser. 199: 13-30.
PETERSON, B. J., AND B. FRY. 1987. Stable isotopes in ecosystem studies. Annu. Rev. Ecol. Syst. 18: 293-320.
, R. W. HOWARTH, AND R. H. GARRIT. 1985. Multiple stable
isotopes used to trace the flow of organic matter in estuarine food webs. Science 227: 1361-1363.
PETSCH, S. T. 2000. A study on the weathering of organic matter in black shales and implications for the geochemical cycles of carbon and oxygen. Ph.D. dissertation, Yale Univ.
, T. I. EGLINTON, AND K. J. EDWARDS. 2001. 14C-dead living biomass: Evidence for microbial assimilation of ancient organ- ic carbon during shale weathering. Science 292: 1127-1131.
RAY, R. T., L. W. HAAS, AND M. E. SIERACKI. 1989. Autotrophic picoplankton dynamics in a Chesapeake Bay sub-estuary. Mar. Ecol. Prog. Ser. 52: 273-285.
RAYMOND, P., AND J. BAUER. 2001a. DOC cycling in a temperate estuary: A mass balance approach using natural 14C and 13C isotopes. Limnol. Oceanogr. 46: 655-667.
, AND . 2001b. Use of 14C and '3C natural abundances for evaluating riverine, estuarine, and coastal DOC and POC
sources and cycling: A review and synthesis. Org. Geochem. 23: 469-485.
, AND . 2001c. Riverine export of aged terrestrial or- ganic matter to the North Atlantic Ocean. Nature 409: 497- 499.
, AND J. J. COLE. 2000. Atmospheric CO2 evasion, dissolved inorganic carbon production, and net heterotrophy in the York River Estuary. Limnol. Oceanogr. 45: 1707-1717.
RICHTER, D. D., D. MARKEWITZ, S. E. TRUMBORE, AND C. G. WELLS. 1999. Rapid accumulation and turnover of soil carbon in a re-establishing forest. Nature 400: 56-58.
SAMBROOK, J., E. E FRITSCH, AND T. MANIATIS. 1989. Molecular
cloning: A laboratory manual. Cold Spring Harbor Laboratory. SCHULTZ, G. E. J., E. D. I. WHITE, AND H. W. DUCKLOW. 2003.
Bacterioplankton dynamics in the York River estuary: Primary influence of temperature and freshwater inputs. Aquat. Microb. Ecol. 30: 135-148.
SIGLEO, A. C., AND S. A. MACKO. 1985. Stable isotope and amino acid composition of estuarine dissolved colloidal material, p. 29-46. In A. C. Sigleo and A. Hattori [eds.], Marine and es- tuarine geochemistry. Lewis.
SIN, Y., AND R. L. WETZEL. 2002. Ecosystem modeling analysis of size-structured phytoplankton dynamics in the York RIver es- tuary, Virginia (USA). II. Use of a plankton ecosystem model for investigating controlling factors on phytoplankton and nu- trient dynamics. Mar. Ecol. Prog. Ser. 228: 91-101.
SMITH, S. V., AND J. T. HOLLIBAUGH. 1993. Coastal metabolism and the oceanic organic carbon balance. Rev. Geophys. 31: 75-89.
SMITH, T. E., R. J. STEVENSON, N. E CARACO, AND J. J. COLE. 1998.
Changes in phytoplankton community structure during the ze- bra mussel (Dreissena polymorpha) invasion of the Hudson River (New York). J. Plankton Res. 20: 1567-1579.
SOFER, Z. 1980. Preparation of carbon dioxide for stable carbon isotope analysis of petroleum fractions. Anal. Chem. 52: 1389- 1391.
STUIVER, M., AND H. A. POLACH. 1977. Discussion: Reporting of C14 data. Radiocarbon 19: 355-363.
SULLIVAN, M. J., AND C. A. MONCREIFF. 1990. Edaphic algae are an important component of salt marsh food webs: Evidence from multiple stable isotope analyses. Mar. Ecol. Prog. Ser. 62: 149-159.
THIMSEN, C. A., AND R. G. KEIL. 1998. Potential interactions be- tween sedimentary dissolved organic matter and mineral sur- faces. Mar. Chem. 62: 65-76.
TRUMBORE, S. E., S. L. SCHIFF, R. ARAVENA, AND R. ELGOOD. 1992. Sources and transformation of dissolved organic carbon in the Harp Lake forested catchment: The role of soils. Radio- carbon 34: 635-636.
VOGEL, J. S., D. E. NELSON, AND J. R. SOUTHON. 1987. 14C back-
ground levels in an accelerator mass spectrometry system. Ra- diocarbon 29: 323-333.
WILLIAMS, P. J. LE B. 2000. Heterotrophic bacteria and the dynam- ics of dissolved organic material, p. 153-200. In D. L. Kirch- man [ed.], Microbial ecology of the oceans. Wiley-Liss.
Received: 23 October 2003 Accepted: 18 March 2004
Amended: 26 April 2004
1702