APPENDIX D DIRECT SHEAR INTERFACE TEST … INTERFACE DIRECT SHEAR TESTING (ASTM D 5321) Shear...
12
ONONDAGA LAKE SEDIMENT CONSOLIDATION AREA CIVIL & GEOTECHNICAL FINAL DESIGN PARSONS P:\Honeywell -SYR\444853 - Lake Detail Design\09 Reports\9.5 Final Report - SCA\Final SCA Design - APRIL\TEXT\Final SCA Design rev 0.docx April 19, 2011 APPENDIX D DIRECT SHEAR INTERFACE TEST RESULTS
Transcript of APPENDIX D DIRECT SHEAR INTERFACE TEST … INTERFACE DIRECT SHEAR TESTING (ASTM D 5321) Shear...
ONONDAGA LAKESEDIMENT CONSOLIDATION AREA CIVIL
& GEOTECHNICAL FINAL DESIGN
PARSONS
P:\Honeywell -SYR\444853 - Lake Detail Design\09 Reports\9.5 Final Report - SCA\Final SCA Design - APRIL\TEXT\Final SCA Design rev 0.docx April 19, 2011
APPENDIX D
DIRECT SHEAR INTERFACE TEST RESULTS
PARSONS
ONONDAGA LAKE PRE DESIGN INVESTIGATION
SEDIMENT CONSOLIDATION AREA (SCA) INTERFACE DIRECT SHEAR TESTING
SUMMARY REPORT
Prepared For:
301 Plainfield Road, Suite 330
Syracuse, NY 13212
Prepared By:
Parsons
301 Plainfield Road, Suite 350 Syracuse, NY 13212
Phone: (315) 451-9560 Fax: (315) 451-9570
JANUARY 2010
ONONDAGA LAKE PDI SCA INTERFACE DIRECT SHEAR TESTING
SUMMARY REPORT
PARSONS
P:\Honeywell -SYR\444853 - Lake Detail Design\09 Reports\9.8 SCA Draft Final\Appendices\Appendix D - Interface Testing\Interface_text.doc January 12, 2010
1
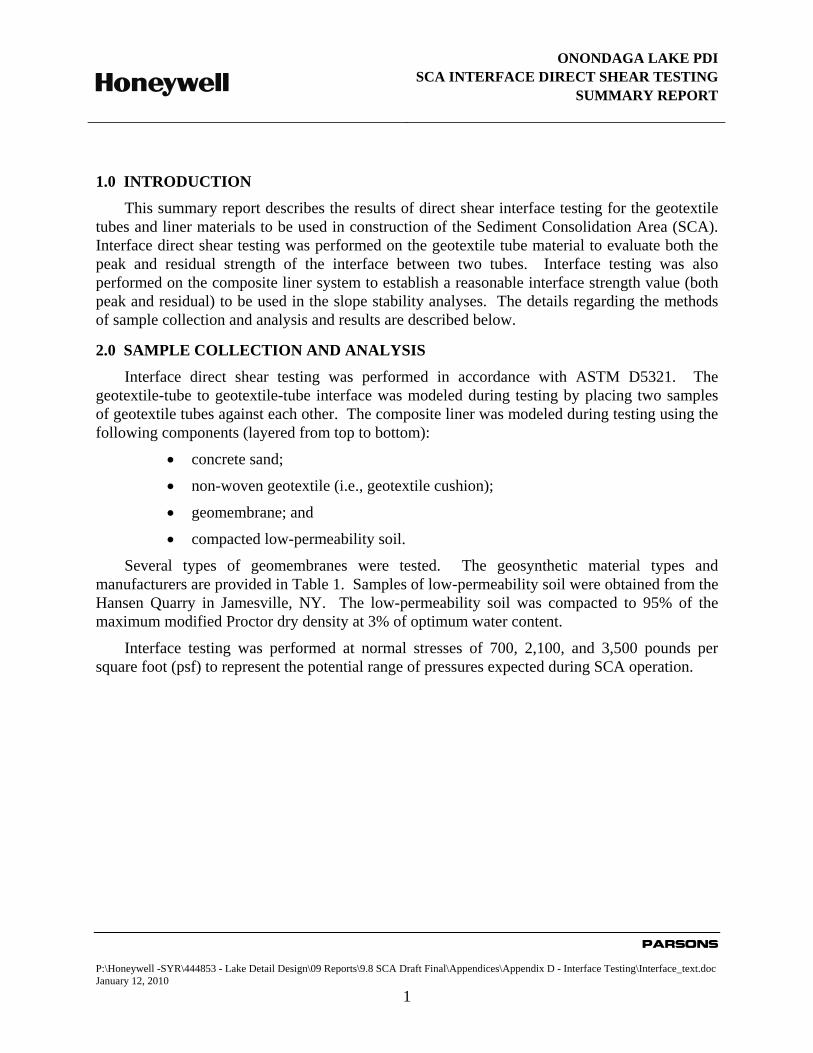
1.0 INTRODUCTION
This summary report describes the results of direct shear interface testing for the geotextile tubes and liner materials to be used in construction of the Sediment Consolidation Area (SCA). Interface direct shear testing was performed on the geotextile tube material to evaluate both the peak and residual strength of the interface between two tubes. Interface testing was also performed on the composite liner system to establish a reasonable interface strength value (both peak and residual) to be used in the slope stability analyses. The details regarding the methods of sample collection and analysis and results are described below.
2.0 SAMPLE COLLECTION AND ANALYSIS
Interface direct shear testing was performed in accordance with ASTM D5321. The geotextile-tube to geotextile-tube interface was modeled during testing by placing two samples of geotextile tubes against each other. The composite liner was modeled during testing using the following components (layered from top to bottom):
• concrete sand;
• non-woven geotextile (i.e., geotextile cushion);
• geomembrane; and
• compacted low-permeability soil.
Several types of geomembranes were tested. The geosynthetic material types and manufacturers are provided in Table 1. Samples of low-permeability soil were obtained from the Hansen Quarry in Jamesville, NY. The low-permeability soil was compacted to 95% of the maximum modified Proctor dry density at 3% of optimum water content.
Interface testing was performed at normal stresses of 700, 2,100, and 3,500 pounds per square foot (psf) to represent the potential range of pressures expected during SCA operation.
ONONDAGA LAKE PDI SCA INTERFACE DIRECT SHEAR TESTING
SUMMARY REPORT
PARSONS
P:\Honeywell -SYR\444853 - Lake Detail Design\09 Reports\9.8 SCA Draft Final\Appendices\Appendix D - Interface Testing\Interface_text.doc January 12, 2010
2
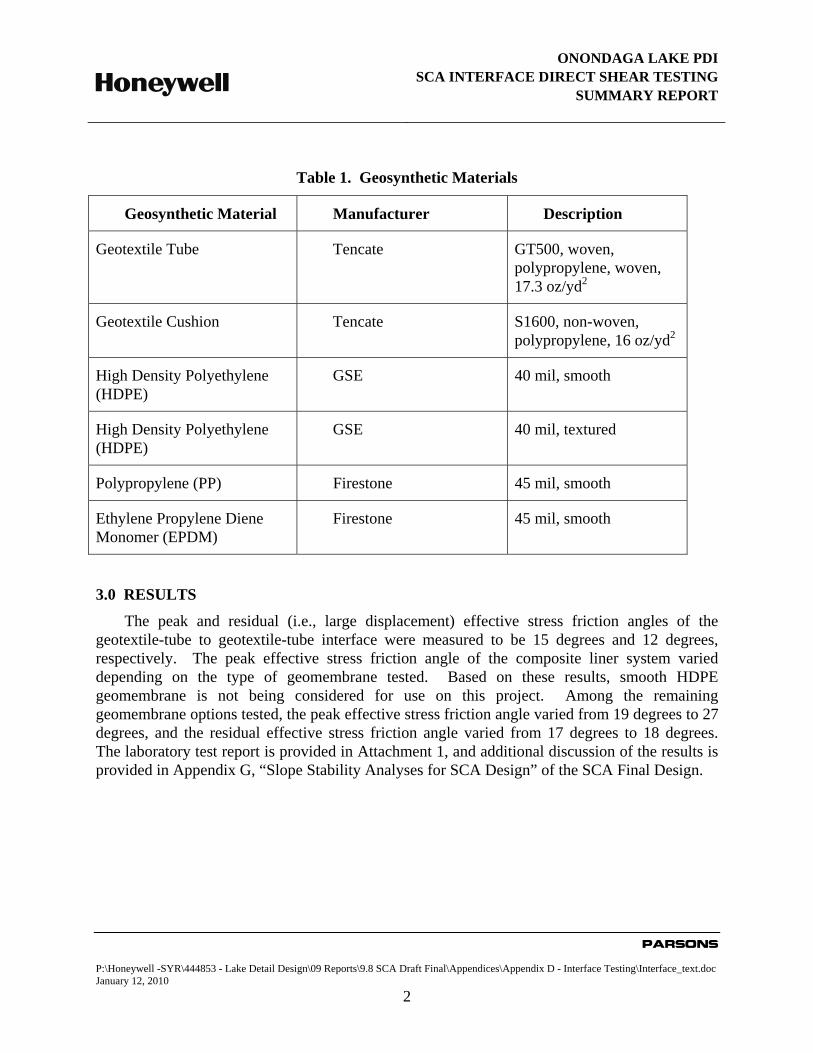
Table 1. Geosynthetic Materials
Geosynthetic Material Manufacturer Description
Geotextile Tube Tencate GT500, woven, polypropylene, woven, 17.3 oz/yd2
Geotextile Cushion Tencate S1600, non-woven, polypropylene, 16 oz/yd2
High Density Polyethylene (HDPE)
GSE 40 mil, smooth
High Density Polyethylene (HDPE)
GSE 40 mil, textured
Polypropylene (PP) Firestone 45 mil, smooth
Ethylene Propylene Diene Monomer (EPDM)
Firestone 45 mil, smooth
3.0 RESULTS
The peak and residual (i.e., large displacement) effective stress friction angles of the geotextile-tube to geotextile-tube interface were measured to be 15 degrees and 12 degrees, respectively. The peak effective stress friction angle of the composite liner system varied depending on the type of geomembrane tested. Based on these results, smooth HDPE geomembrane is not being considered for use on this project. Among the remaining geomembrane options tested, the peak effective stress friction angle varied from 19 degrees to 27 degrees, and the residual effective stress friction angle varied from 17 degrees to 18 degrees. The laboratory test report is provided in Attachment 1, and additional discussion of the results is provided in Appendix G, “Slope Stability Analyses for SCA Design” of the SCA Final Design.
ONONDAGA LAKE PDI SCA INTERFACE DIRECT SHEAR TESTING
SUMMARY REPORT
PARSONS
P:\Honeywell -SYR\444853 - Lake Detail Design\09 Reports\9.8 SCA Draft Final\Appendices\Appendix D - Interface Testing\Interface_text.doc January 12, 2010
ATTACHMENT 1
LABORATORY TEST REPORT
A Geor gia Limit ed Lia bil it y Compa ny
SGI9002.REPORT.09.01
4 4 0 5 Int er na t iona l Boul eva r dSuit e B- 1 1 7
Nor cr oss, Geor gia 3 0 0 9 3
Phone : 7 7 0 .9 3 1 .8 2 2 2 Fa x: 7 7 0 .9 3 1 .8 2 4 0
Fa c il it y Loc a t ion P.O. Box 2 4 2 7 Lil bur n, Geor gia 3 0 0 4 8 - 2 4 2 7 W eb Sit e: w w w .int er a c t ionspec ia l ist s.c om
Ma il T o: SGI T est ing Ser vic es, LLC
5 April 2009 Mr. David Steele Parsons 290 Elwood Davis Road, Suite 312 Liverpool, NY 13088 Subject: Laboratory Test Results Transmittal
Interface Direct Shear Testing
Dear Mr. Barker, SGI Testing Services, LLC (SGI) is pleased to present the attached results for the above-mentioned testing program. The note section below addresses sample preparation, sample disposal and a disclosure statement. SGI appreciates the opportunity to provide laboratory testing services to Parsons. Should you have any questions regarding the attached document(s), or if you require additional information, please do not hesitate to contact the undersigned. Sincerely,
Zehong Yuan, Ph.D., P.E. Laboratory Manager Attachments Notes: (1) Unless otherwise noted in the test results the sample(s)/specimen(s) were prepared in accordance with the applicable test standards or generally accepted sampling procedures. (2) Contaminated/chemical samples and all related laboratory generated waste (i.e., test liquids, PPE, absorbents, etc.) will be returned to the client or designated representative(s), at the client’s cost, within 60 days following the completion of the testing program, unless special arrangements for proper disposal are made with SGI. (3) Materials that are not contaminated will be discarded after test specimens and archived specimens are obtained. Archived specimens will be discarded 30 days after the completion of the testing program, unless long-term storage arrangements are specifically made with SGI. (4) The reported results apply only to the materials and test conditions used in the laboratory testing program. The results do not necessarily apply to other materials or test conditions. The test results should not be used in engineering analysis unless the test conditions model the anticipated field conditions. The testing was performed in accordance with general engineering testing standards and requirements. The reported results are submitted for the exclusive use of the client to whom they are addressed.
ATTACHMENT A
INTERFACE DIRECT SHEAR
TEST RESULTS
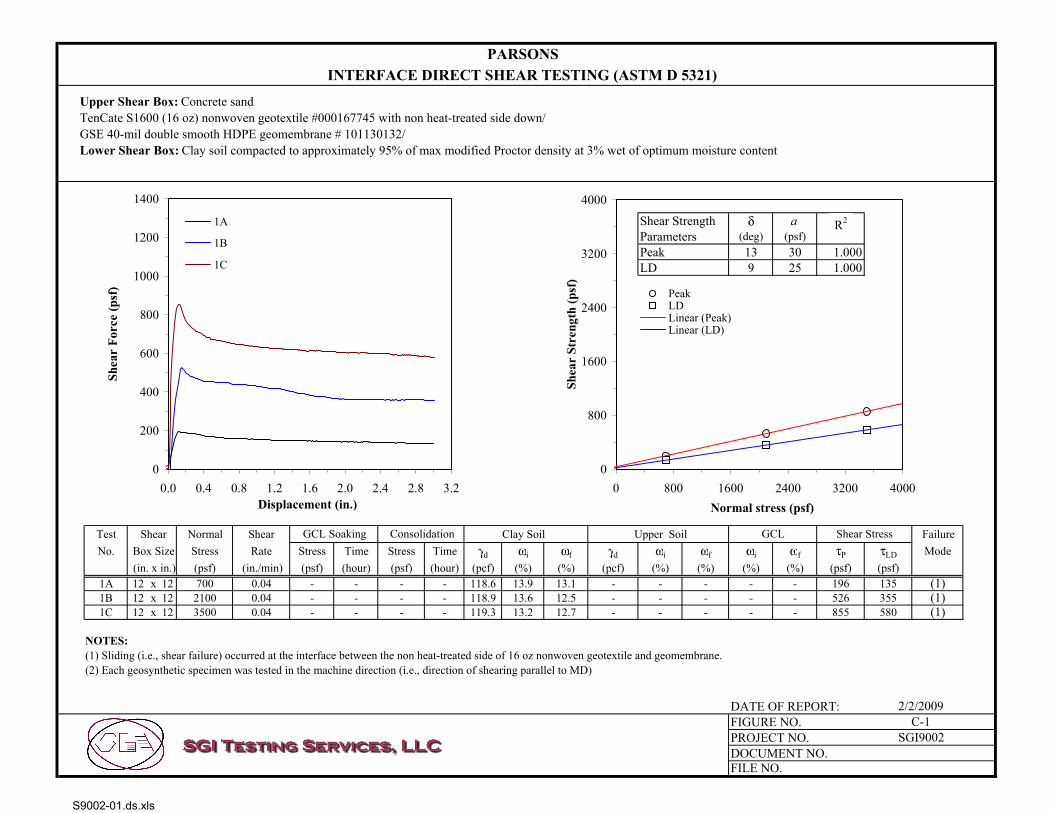
PARSONSINTERFACE DIRECT SHEAR TESTING (ASTM D 5321)
Shear Strength δ aParameters (deg) (psf)Peak 13 30 1.000LD 9 25 1.000
Test Shear Normal Shear Clay Soil Upper Soil FailureNo. Box Size Stress Rate Stress Time Stress Time γd ωi ωf γd ωi ωf ωi ωf τP τLD Mode
(in. x in.) (psf) (in./min) (psf) (hour) (psf) (hour) (pcf) (%) (%) (pcf) (%) (%) (%) (%) (psf) (psf)1A 12 x 12 700 0.04 - - - - 118.6 13.9 13.1 - - - - - 196 135 (1)1B 12 x 12 2100 0.04 - - - - 118.9 13.6 12.5 - - - - - 526 355 (1)1C 12 x 12 3500 0.04 - - - - 119.3 13.2 12.7 - - - - - 855 580 (1)
DATE OF REPORT:FIGURE NO.PROJECT NO.DOCUMENT NO.FILE NO.
SGI9002
ConsolidationGCL Soaking GCL Shear Stress
2/2/2009C-1
0
800
1600
2400
3200
4000
0 800 1600 2400 3200 4000Normal stress (psf)
Shea
r St
reng
th (p
sf)
PeakLDLinear (Peak)Linear (LD)
0
200
400
600
800
1000
1200
1400
0.0 0.4 0.8 1.2 1.6 2.0 2.4 2.8 3.2Displacement (in.)
Shea
r Fo
rce
(psf
)
1A
1B
1C
R2R2
NOTES: (1) Sliding (i.e., shear failure) occurred at the interface between the non heat-treated side of 16 oz nonwoven geotextile and geomembrane.(2) Each geosynthetic specimen was tested in the machine direction (i.e., direction of shearing parallel to MD)
Upper Shear Box: Concrete sandTenCate S1600 (16 oz) nonwoven geotextile #000167745 with non heat-treated side down/GSE 40-mil double smooth HDPE geomembrane # 101130132/Lower Shear Box: Clay soil compacted to approximately 95% of max modified Proctor density at 3% wet of optimum moisture content
S9002-01.ds.xls
PARSONSINTERFACE DIRECT SHEAR TESTING (ASTM D 5321)
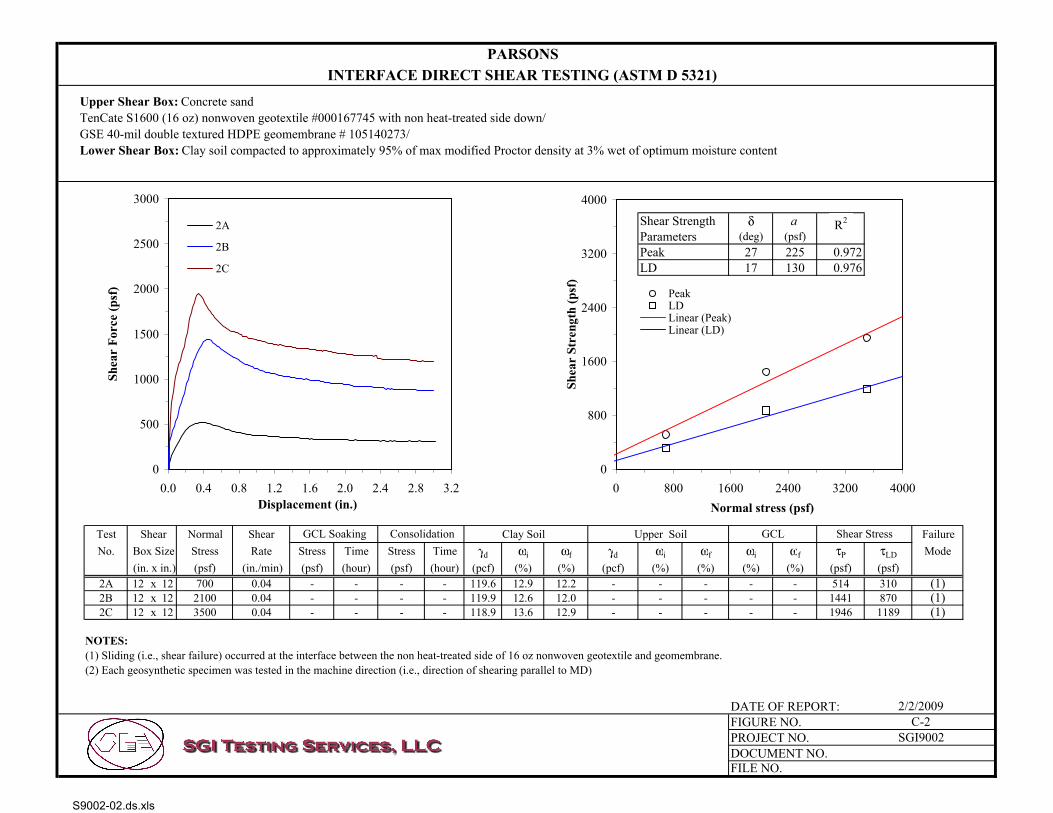
Shear Strength δ aParameters (deg) (psf)Peak 27 225 0.972LD 17 130 0.976
Test Shear Normal Shear Clay Soil Upper Soil FailureNo. Box Size Stress Rate Stress Time Stress Time γd ωi ωf γd ωi ωf ωi ωf τP τLD Mode
(in. x in.) (psf) (in./min) (psf) (hour) (psf) (hour) (pcf) (%) (%) (pcf) (%) (%) (%) (%) (psf) (psf)2A 12 x 12 700 0.04 - - - - 119.6 12.9 12.2 - - - - - 514 310 (1)2B 12 x 12 2100 0.04 - - - - 119.9 12.6 12.0 - - - - - 1441 870 (1)2C 12 x 12 3500 0.04 - - - - 118.9 13.6 12.9 - - - - - 1946 1189 (1)
DATE OF REPORT:FIGURE NO.PROJECT NO.DOCUMENT NO.FILE NO.
SGI9002
ConsolidationGCL Soaking GCL Shear Stress
2/2/2009C-2
0
800
1600
2400
3200
4000
0 800 1600 2400 3200 4000Normal stress (psf)
Shea
r St
reng
th (p
sf)
PeakLDLinear (Peak)Linear (LD)
0
500
1000
1500
2000
2500
3000
0.0 0.4 0.8 1.2 1.6 2.0 2.4 2.8 3.2Displacement (in.)
Shea
r Fo
rce
(psf
)
2A
2B
2C
R2R2
NOTES: (1) Sliding (i.e., shear failure) occurred at the interface between the non heat-treated side of 16 oz nonwoven geotextile and geomembrane.(2) Each geosynthetic specimen was tested in the machine direction (i.e., direction of shearing parallel to MD)
Upper Shear Box: Concrete sandTenCate S1600 (16 oz) nonwoven geotextile #000167745 with non heat-treated side down/GSE 40-mil double textured HDPE geomembrane # 105140273/Lower Shear Box: Clay soil compacted to approximately 95% of max modified Proctor density at 3% wet of optimum moisture content
S9002-02.ds.xls
PARSONSINTERFACE DIRECT SHEAR TESTING (ASTM D 5321)
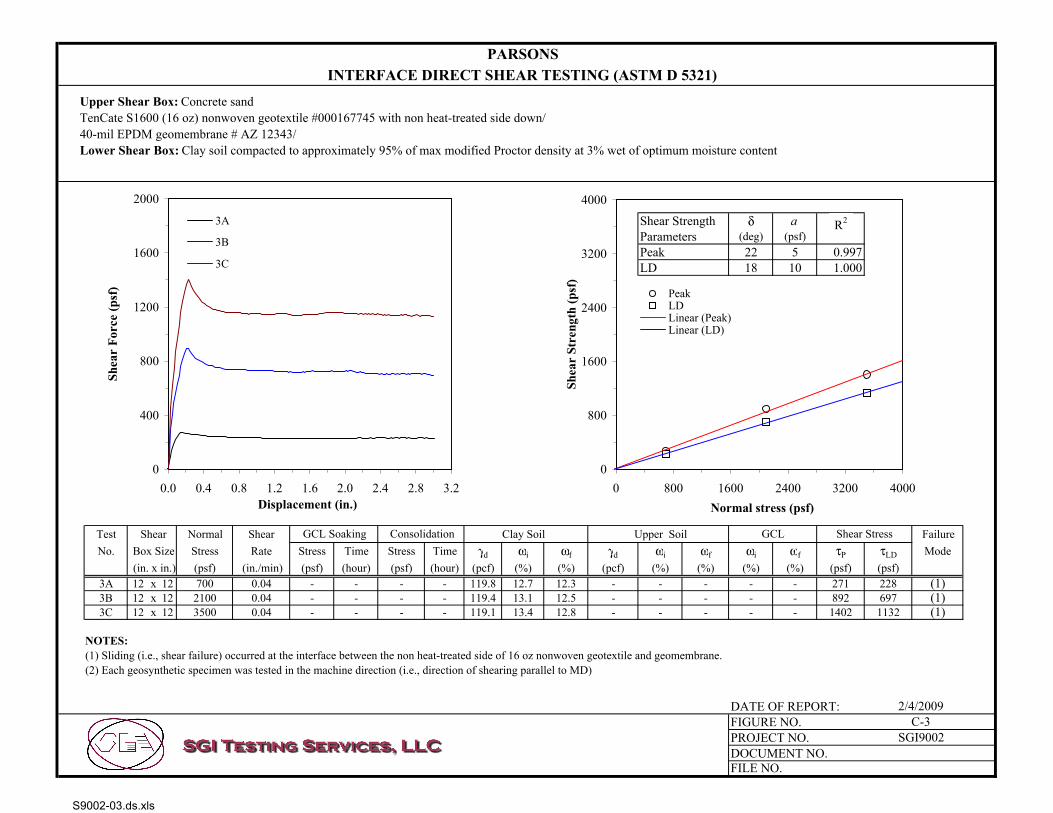
Shear Strength δ aParameters (deg) (psf)Peak 22 5 0.997LD 18 10 1.000
Test Shear Normal Shear Clay Soil Upper Soil FailureNo. Box Size Stress Rate Stress Time Stress Time γd ωi ωf γd ωi ωf ωi ωf τP τLD Mode
(in. x in.) (psf) (in./min) (psf) (hour) (psf) (hour) (pcf) (%) (%) (pcf) (%) (%) (%) (%) (psf) (psf)3A 12 x 12 700 0.04 - - - - 119.8 12.7 12.3 - - - - - 271 228 (1)3B 12 x 12 2100 0.04 - - - - 119.4 13.1 12.5 - - - - - 892 697 (1)3C 12 x 12 3500 0.04 - - - - 119.1 13.4 12.8 - - - - - 1402 1132 (1)
DATE OF REPORT:FIGURE NO.PROJECT NO.DOCUMENT NO.FILE NO.
SGI9002
ConsolidationGCL Soaking GCL Shear Stress
2/4/2009C-3
0
800
1600
2400
3200
4000
0 800 1600 2400 3200 4000Normal stress (psf)
Shea
r St
reng
th (p
sf)
PeakLDLinear (Peak)Linear (LD)
0
400
800
1200
1600
2000
0.0 0.4 0.8 1.2 1.6 2.0 2.4 2.8 3.2Displacement (in.)
Shea
r Fo
rce
(psf
)
3A
3B
3C
R2R2
NOTES: (1) Sliding (i.e., shear failure) occurred at the interface between the non heat-treated side of 16 oz nonwoven geotextile and geomembrane.(2) Each geosynthetic specimen was tested in the machine direction (i.e., direction of shearing parallel to MD)
Upper Shear Box: Concrete sandTenCate S1600 (16 oz) nonwoven geotextile #000167745 with non heat-treated side down/40-mil EPDM geomembrane # AZ 12343/Lower Shear Box: Clay soil compacted to approximately 95% of max modified Proctor density at 3% wet of optimum moisture content
S9002-03.ds.xls

PARSONSINTERFACE DIRECT SHEAR TESTING (ASTM D 5321)
Shear Strength δ aParameters (deg) (psf)Peak 19 5 0.997LD 18 5 0.996
Test Shear Normal Shear Clay Soil Upper Soil FailureNo. Box Size Stress Rate Stress Time Stress Time γd ωi ωf γd ωi ωf ωi ωf τP τLD Mode
(in. x in.) (psf) (in./min) (psf) (hour) (psf) (hour) (pcf) (%) (%) (pcf) (%) (%) (%) (%) (psf) (psf)4A 12 x 12 700 0.04 - - - - 118.6 13.9 13.3 - - - - - 226 215 (1)4B 12 x 12 2100 0.04 - - - - 119.0 13.5 12.9 - - - - - 742 726 (1)4C 12 x 12 3500 0.04 - - - - 118.8 13.7 12.5 - - - - - 1166 1133 (1)
DATE OF REPORT:FIGURE NO.PROJECT NO.DOCUMENT NO.FILE NO.
SGI9002
ConsolidationGCL Soaking GCL Shear Stress
2/4/2009C-4
0
800
1600
2400
3200
4000
0 800 1600 2400 3200 4000Normal stress (psf)
Shea
r St
reng
th (p
sf)
PeakLDLinear (Peak)Linear (LD)
0
400
800
1200
1600
2000
0.0 0.4 0.8 1.2 1.6 2.0 2.4 2.8 3.2Displacement (in.)
Shea
r Fo
rce
(psf
)
4A
4B
4C
R2R2
NOTES: (1) Sliding (i.e., shear failure) occurred at the interface between the non heat-treated side of 16 oz nonwoven geotextile and rough side of geomembrane.(2) Each geosynthetic specimen was tested in the machine direction (i.e., direction of shearing parallel to MD)
Upper Shear Box: Concrete sandTenCate S1600 (16 oz) nonwoven geotextile #000167745 with non heat-treated side down/40-mil PP geomembrane with rough side up to geotextile and smooth side down to clay soil/Lower Shear Box: Clay soil compacted to approximately 95% of max modified Proctor density at 3% wet of optimum moisture content
S9002-04.ds.xls
PARSONSINTERFACE DIRECT SHEAR TESTING (ASTM D 5321)
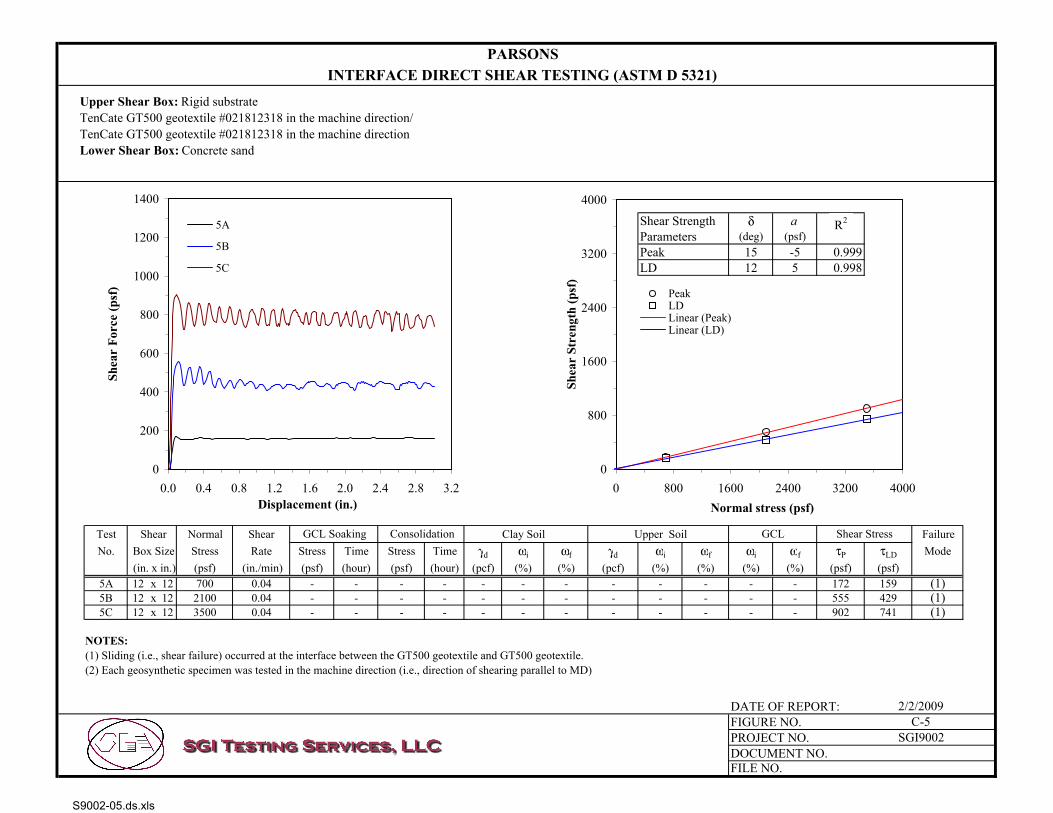
Shear Strength δ aParameters (deg) (psf)Peak 15 -5 0.999LD 12 5 0.998
Test Shear Normal Shear Clay Soil Upper Soil FailureNo. Box Size Stress Rate Stress Time Stress Time γd ωi ωf γd ωi ωf ωi ωf τP τLD Mode
(in. x in.) (psf) (in./min) (psf) (hour) (psf) (hour) (pcf) (%) (%) (pcf) (%) (%) (%) (%) (psf) (psf)5A 12 x 12 700 0.04 - - - - - - - - - - - - 172 159 (1)5B 12 x 12 2100 0.04 - - - - - - - - - - - - 555 429 (1)5C 12 x 12 3500 0.04 - - - - - - - - - - - - 902 741 (1)
DATE OF REPORT:FIGURE NO.PROJECT NO.DOCUMENT NO.FILE NO.
SGI9002
ConsolidationGCL Soaking GCL Shear Stress
2/2/2009C-5
0
800
1600
2400
3200
4000
0 800 1600 2400 3200 4000Normal stress (psf)
Shea
r St
reng
th (p
sf)
PeakLDLinear (Peak)Linear (LD)
0
200
400
600
800
1000
1200
1400
0.0 0.4 0.8 1.2 1.6 2.0 2.4 2.8 3.2Displacement (in.)
Shea
r Fo
rce
(psf
)
5A
5B
5C
R2R2
NOTES: (1) Sliding (i.e., shear failure) occurred at the interface between the GT500 geotextile and GT500 geotextile.(2) Each geosynthetic specimen was tested in the machine direction (i.e., direction of shearing parallel to MD)
Upper Shear Box: Rigid substrate TenCate GT500 geotextile #021812318 in the machine direction/TenCate GT500 geotextile #021812318 in the machine directionLower Shear Box: Concrete sand
S9002-05.ds.xls