Annual Report 2002 Ετήσιος Απολογισµός
13
2002 Annual Report Ετήσιος Απολογισµός
Transcript of Annual Report 2002 Ετήσιος Απολογισµός
2002Annual Report
Ετήσιος Απολογισµός

2002Annual Report
32
2002Annual Report
Ετήσιος Απολογισµός
Dear Shareholders,
2002 proved to be a year of significant success and solid growth for the Sarantis Group of Companies, despite thecurrent unstable business environment present both in Greece and abroad. To be more specific, the 2002consolidated results for the Group realized a TurnOver growth of 18.6 % versus year ago, reaching up to 219.4million Euros, while Earnings Before Tax grew to an impressive 18,1 million Euros, 10,2% up versus year ago.
There is no doubt to the management committee of our company, that the agreed strategic decisions which thecompany is being drifting along for the last three years, have both secured and benefited our operations. Thesesame directions do constitute the ideal pathway for a successful company growth plan for the upcoming five years.
Our key drivers, as summarised in 2002, that is the development and marketing of fast moving consumer ownbrands, coupled with successful growth start up initiatives in the markets of Central and Eastern Europe, do reflectsuccessfully through a series of impressive results.
While it was only in 2002 that the final PackPlast purchase deal was completed, a successful turnaround planwas immediately put in place and reverted thoroughly PackPlast results from a negative ground of 1.3 million EuroEBT in 2002 mid year, to a positive year end EBT of 0.5 million Euro. It is through this purchase that SarantisGroup intends to generate a very strong affiliate in the Polish market, a market with significant growthopportunities for the coming years.
Equally impressive are the results that the Group delivered in all of the Central Eastern European Geographies inwhich it operates, posting steadily growing results for all related affiliates, as will be further elaborated in otherchapters of our annual report.
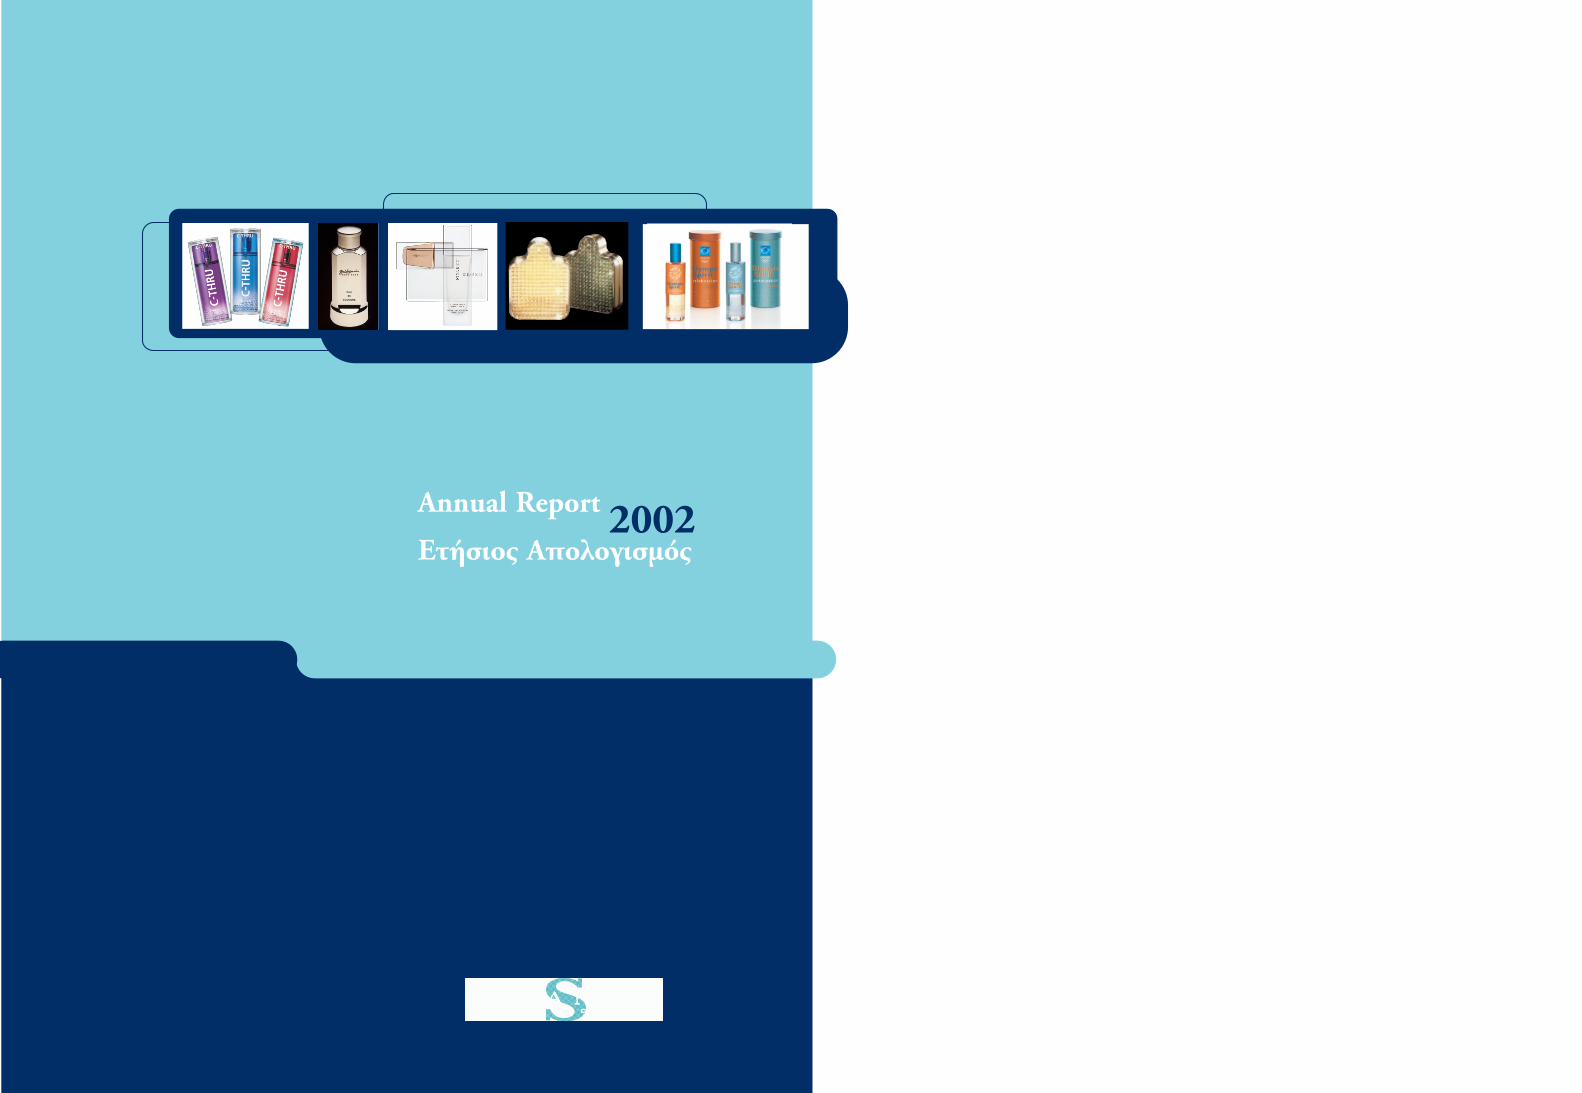
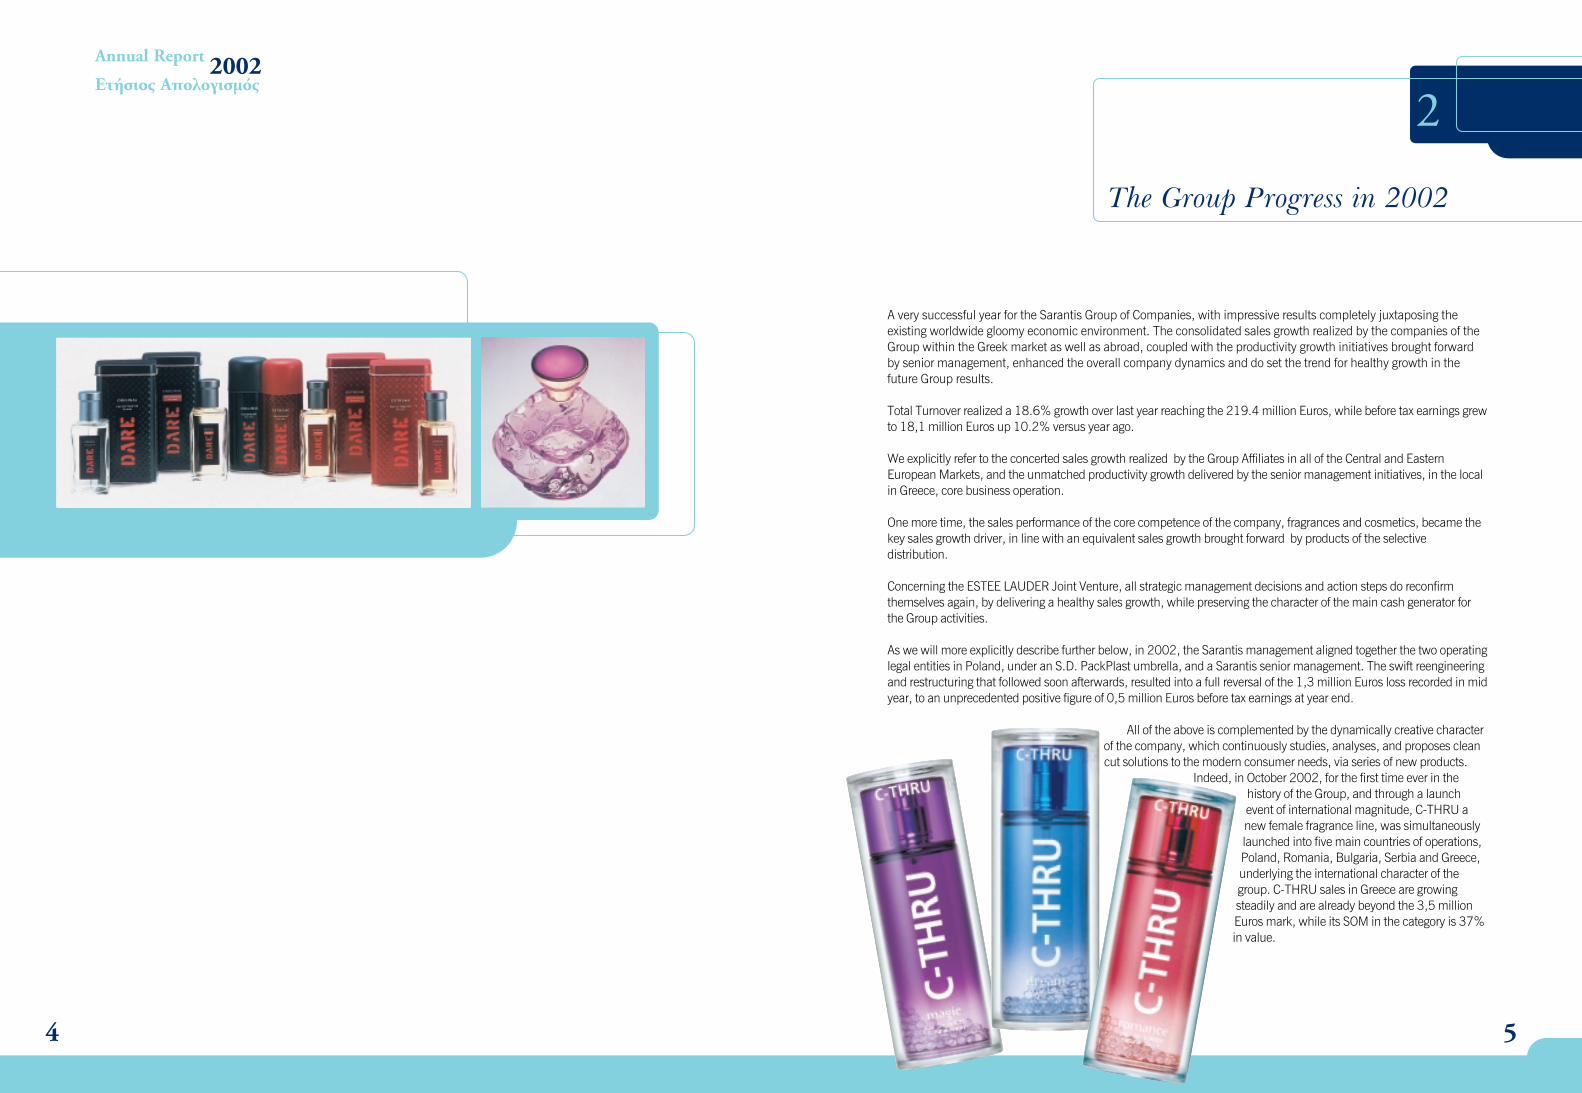
Last but not least, a product development related comment, that, in October 2002, Sarantis aggressivelyintroduced its new fragrance C-THRU, which for the first time ever, was simultaneously launched into 5 keymarkets. C-THRU sales in Greece are already beyond the 3.5 million Euro mark, while its Share in the categoryreached the 37% (in value).
There is no doubt, 2002, has been a milestone year which allows us to be optimistic about the future, despite thegloomy global business environment. It was a year which reconfirmed the Group’s long term strategies anddecisions, which will lead us to growth while they will secure our earnings.
With Honour,
Gregory Sarantis,President of the Board of the Sarantis Group of Companies.
1
Letter to the Shareholders
A very successful year for the Sarantis Group of Companies, with impressive results completely juxtaposing theexisting worldwide gloomy economic environment. The consolidated sales growth realized by the companies of theGroup within the Greek market as well as abroad, coupled with the productivity growth initiatives brought forwardby senior management, enhanced the overall company dynamics and do set the trend for healthy growth in thefuture Group results.
Total Turnover realized a 18.6% growth over last year reaching the 219.4 million Euros, while before tax earnings grewto 18,1 million Euros up 10.2% versus year ago.
We explicitly refer to the concerted sales growth realized by the Group Affiliates in all of the Central and EasternEuropean Markets, and the unmatched productivity growth delivered by the senior management initiatives, in the localin Greece, core business operation.
One more time, the sales performance of the core competence of the company, fragrances and cosmetics, became thekey sales growth driver, in line with an equivalent sales growth brought forward by products of the selectivedistribution.
Concerning the ESTEE LAUDER Joint Venture, all strategic management decisions and action steps do reconfirmthemselves again, by delivering a healthy sales growth, while preserving the character of the main cash generator forthe Group activities.
As we will more explicitly describe further below, in 2002, the Sarantis management aligned together the two operatinglegal entities in Poland, under an S.D. PackPlast umbrella, and a Sarantis senior management. The swift reengineeringand restructuring that followed soon afterwards, resulted into a full reversal of the 1,3 million Euros loss recorded in midyear, to an unprecedented positive figure of 0,5 million Euros before tax earnings at year end.
All of the above is complemented by the dynamically creative characterof the company, which continuously studies, analyses, and proposes cleancut solutions to the modern consumer needs, via series of new products.
Indeed, in October 2002, for the first time ever in thehistory of the Group, and through a launchevent of international magnitude, C-THRU anew female fragrance line, was simultaneouslylaunched into five main countries of operations,Poland, Romania, Bulgaria, Serbia and Greece,underlying the international character of thegroup. C-THRU sales in Greece are growingsteadily and are already beyond the 3,5 millionEuros mark, while its SOM in the category is 37%in value.
54
2002Annual Report
Ετήσιος Απολογισµός
2
The Group Progress in 2002
76
2002Annual Report
Ετήσιος Απολογισµός
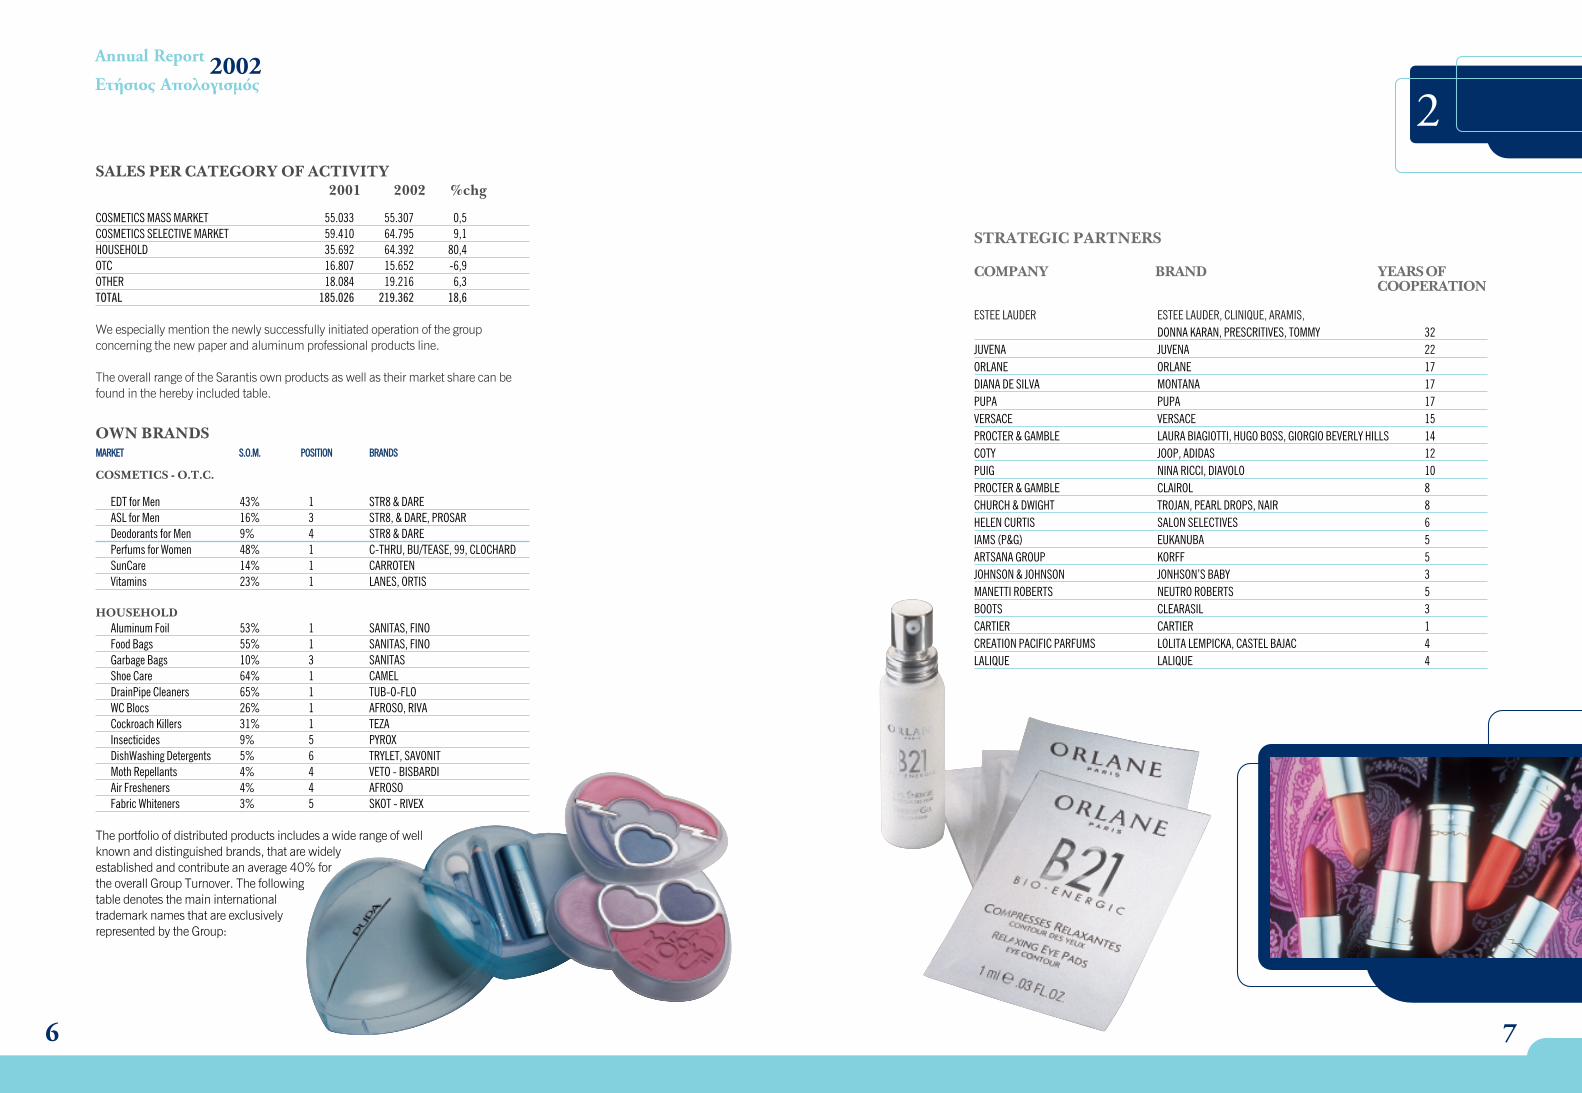
STRATEGIC PARTNERS
COMPANY BRAND YEARS OFCOOPERATION
ESTEE LAUDER ESTEE LAUDER, CLINIQUE, ARAMIS, DONNA KARAN, PRESCRITIVES, TOMMY 32
JUVENA JUVENA 22ORLANE ORLANE 17DIANA DE SILVA MONTANA 17PUPA PUPA 17VERSACE VERSACE 15PROCTER & GAMBLE LAURA BIAGIOTTI, HUGO BOSS, GIORGIO BEVERLY HILLS 14COTY JOOP, ADIDAS 12PUIG NINA RICCI, DIAVOLO 10PROCTER & GAMBLE CLAIROL 8CHURCH & DWIGHT TROJAN, PEARL DROPS, NAIR 8HELEN CURTIS SALON SELECTIVES 6IAMS (P&G) EUKANUBA 5∞RTSANA GROUP KORFF 5JOHNSON & JOHNSON JONHSON’S BABY 3ª∞¡∂∆TI ROBERTS NEUTRO ROBERTS 5BOOTS CLEARASIL 3CARTIER CARTIER 1CREATION PACIFIC PARFUMS LOLITA LEMPICKA, CASTEL BAJAC 4LALIQUE LALIQUE 4
SALES PER CATEGORY OF ACTIVITY2001 2002 %chg
COSMETICS MASS MARKET 55.033 55.307 0,5COSMETICS SELECTIVE MARKET 59.410 64.795 9,1HOUSEHOLD 35.692 64.392 80,4OTC 16.807 15.652 -6,9OTHER 18.084 19.216 6,3TOTAL 185.026 219.362 18,6
We especially mention the newly successfully initiated operation of the groupconcerning the new paper and aluminum professional products line.
The overall range of the Sarantis own products as well as their market share can befound in the hereby included table.
OWN BRANDSMMAARRKKEETT SS..OO..MM.. PPOOSSIITTIIOONN BBRRAANNDDSS
COSMETICS - O.T.C.
EDT for Men 43% 1 STR8 & DAREASL for Men 16% 3 STR8, & DARE, PROSARDeodorants for Men 9% 4 STR8 & DAREPerfums for Women 48% 1 C-THRU, µU/TEASE, 99, CLOCHARDSunCare 14% 1 CARROTENVitamins 23% 1 LANES, ORTIS
HOUSEHOLDAluminum Foil 53% 1 SANITAS, FINOFood Bags 55% 1 SANITAS, FINOGarbage Bags 10% 3 SANITASShoe Care 64% 1 CAMELDrainPipe Cleaners 65% 1 TUB-O-FLOWC Blocs 26% 1 AFROSO, RIVACockroach Killers 31% 1 TEZAInsecticides 9% 5 PYROXDishWashing Detergents 5% 6 TRYLET, SAVONITMoth Repellants 4% 4 VETO - BISBARDIAir Fresheners 4% 4 AFROSOFabric Whiteners 3% 5 SKOT - RIVEX
The portfolio of distributed products includes a wide range of wellknown and distinguished brands, that are widelyestablished and contribute an average 40% forthe overall Group Turnover. The followingtable denotes the main internationaltrademark names that are exclusivelyrepresented by the Group:
2
98
2002Annual Report
Ετήσιος Απολογισµός
3S. D. PackPlast and SarPol Merger
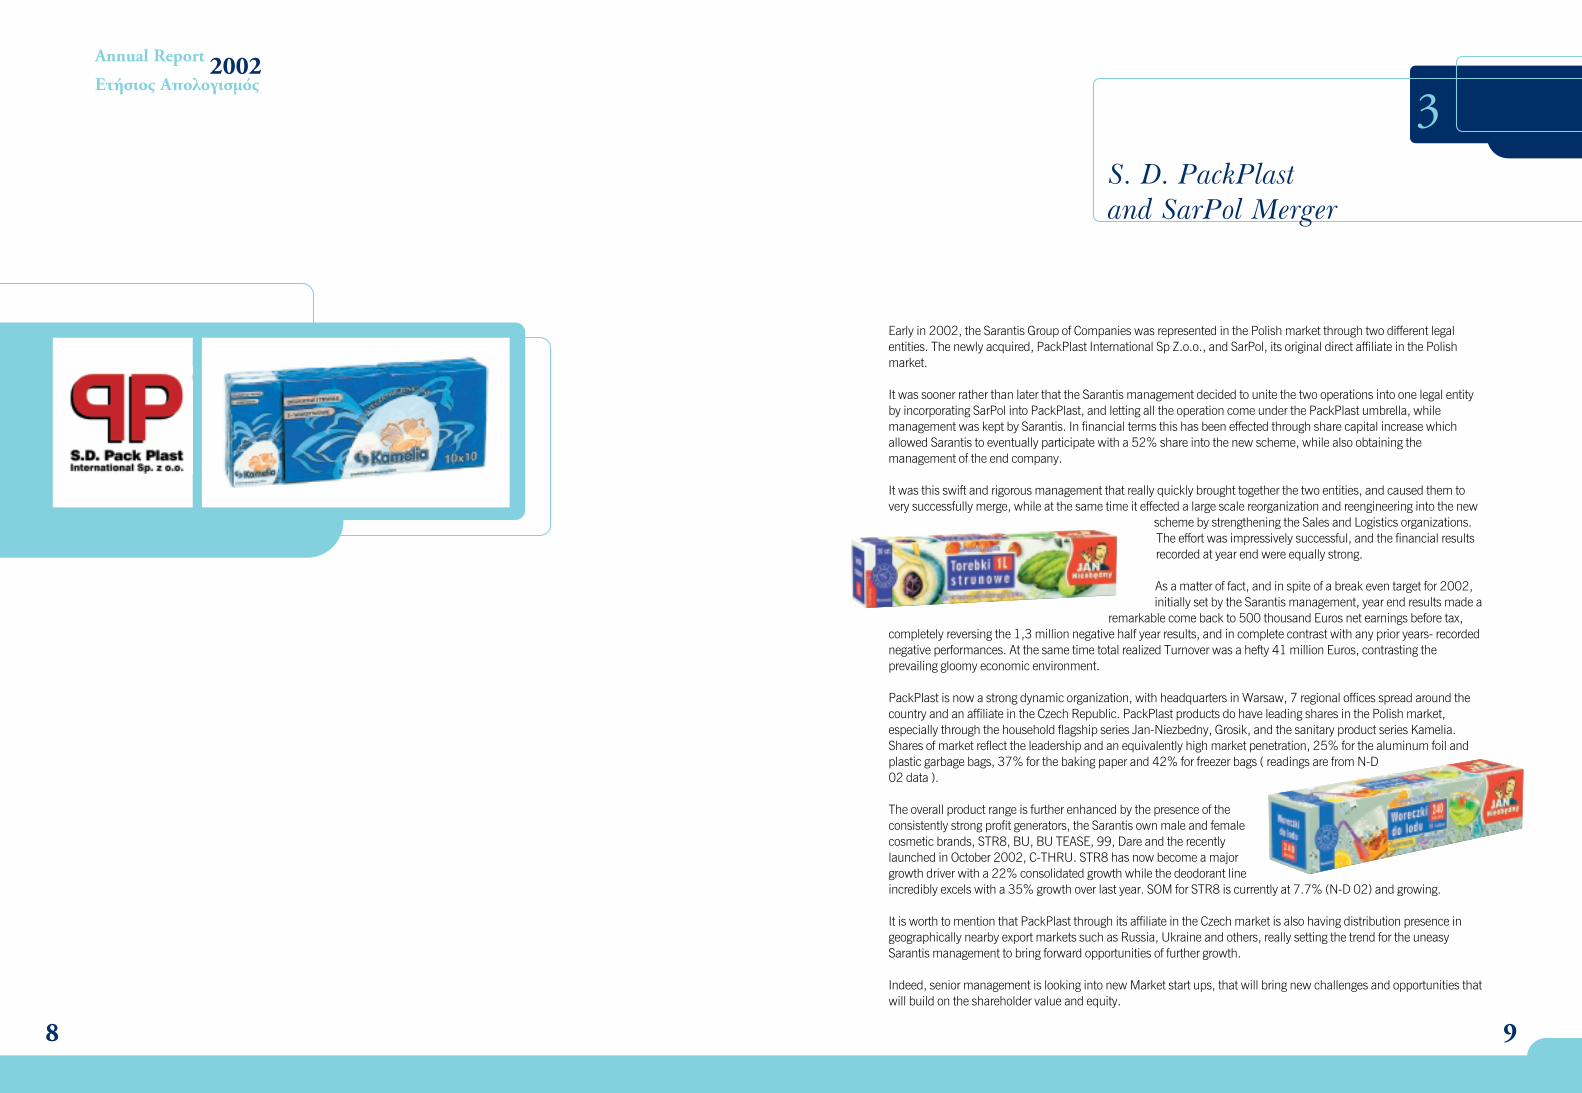
Early in 2002, the Sarantis Group of Companies was represented in the Polish market through two different legalentities. The newly acquired, PackPlast International Sp Z.o.o., and SarPol, its original direct affiliate in the Polishmarket.
It was sooner rather than later that the Sarantis management decided to unite the two operations into one legal entityby incorporating SarPol into PackPlast, and letting all the operation come under the PackPlast umbrella, whilemanagement was kept by Sarantis. In financial terms this has been effected through share capital increase whichallowed Sarantis to eventually participate with a 52% share into the new scheme, while also obtaining themanagement of the end company.
It was this swift and rigorous management that really quickly brought together the two entities, and caused them tovery successfully merge, while at the same time it effected a large scale reorganization and reengineering into the new
scheme by strengthening the Sales and Logistics organizations.The effort was impressively successful, and the financial resultsrecorded at year end were equally strong.
As a matter of fact, and in spite of a break even target for 2002,initially set by the Sarantis management, year end results made a
remarkable come back to 500 thousand Euros net earnings before tax,completely reversing the 1,3 million negative half year results, and in complete contrast with any prior years- recordednegative performances. At the same time total realized Turnover was a hefty 41 million Euros, contrasting theprevailing gloomy economic environment.
PackPlast is now a strong dynamic organization, with headquarters in Warsaw, 7 regional offices spread around thecountry and an affiliate in the Czech Republic. PackPlast products do have leading shares in the Polish market,especially through the household flagship series Jan-Niezbedny, Grosik, and the sanitary product series Kamelia.Shares of market reflect the leadership and an equivalently high market penetration, 25% for the aluminum foil andplastic garbage bags, 37% for the baking paper and 42% for freezer bags ( readings are from N-D02 data ).
The overall product range is further enhanced by the presence of theconsistently strong profit generators, the Sarantis own male and femalecosmetic brands, STR8, BU, BU TEASE, 99, Dare and the recentlylaunched in October 2002, C-THRU. STR8 has now become a majorgrowth driver with a 22% consolidated growth while the deodorant lineincredibly excels with a 35% growth over last year. SOM for STR8 is currently at 7.7% (N-D 02) and growing.
It is worth to mention that PackPlast through its affiliate in the Czech market is also having distribution presence ingeographically nearby export markets such as Russia, Ukraine and others, really setting the trend for the uneasySarantis management to bring forward opportunities of further growth.
Indeed, senior management is looking into new Market start ups, that will bring new challenges and opportunities thatwill build on the shareholder value and equity.
10
2002Annual Report
Ετήσιος Απολογισµός
4
Operating Figures 2002
Total Assets, on a consolidated basis, registered a marginal decrease of 2,8% settling at 295,7 million Euros. The TotalAssets decrease, on absolute basis, of approximately 8,7 million Euros, is due both to the reduction of the Fixed andCurrent Assets.
The Net Fixed Assets, after depreciations, in 2002, settled at 121,6 million Euros from the 123,1 million Euros of2001, marginally down by 1,2%. The Group’s Total Current Assets decreased by 5,2% and settled at 164,4 millionEuros. This particular decrease reflects the concerted outcome, on one hand, of a 6% decrease in the AccountsReceivables figure which settled at 107,8 million Euros, and of a 55,6% decrease in the Securities figure, while on theother hand, it reflects an increase in the Inventories by 4,8% and in the Cash figure of 53%, which in 2002respectively settled at 37,4 million Euros and 12,7 million Euros.
Total Liabilities in 2002, registered a marginal decrease of 2,34%. To be more specific, the Short Term liabilitiessettled at 100,6 million Euros, down by a considerable 21,5% versus year ago, while Long Term Liabilities showed anincrease of 33,2% and settled now at 91,9 million Euros up from the 69 million Euros of 2001. The Current ratioregistered an increase in 2002, setting at 1,57 versus the 1,24 of 2001, while the Acid Test Ratio also increasedsettling at 1,20 versus the 0,96 of year ago.
The Group’s Shareholders’ equity verifies its strong financial position. More specifically, the Shareholders’ equity settledat 139,7 million Euros. The ratio of Shareholders’ equity versus the Total Assets settled at 47,25% as opposed to the46,46% of last year.
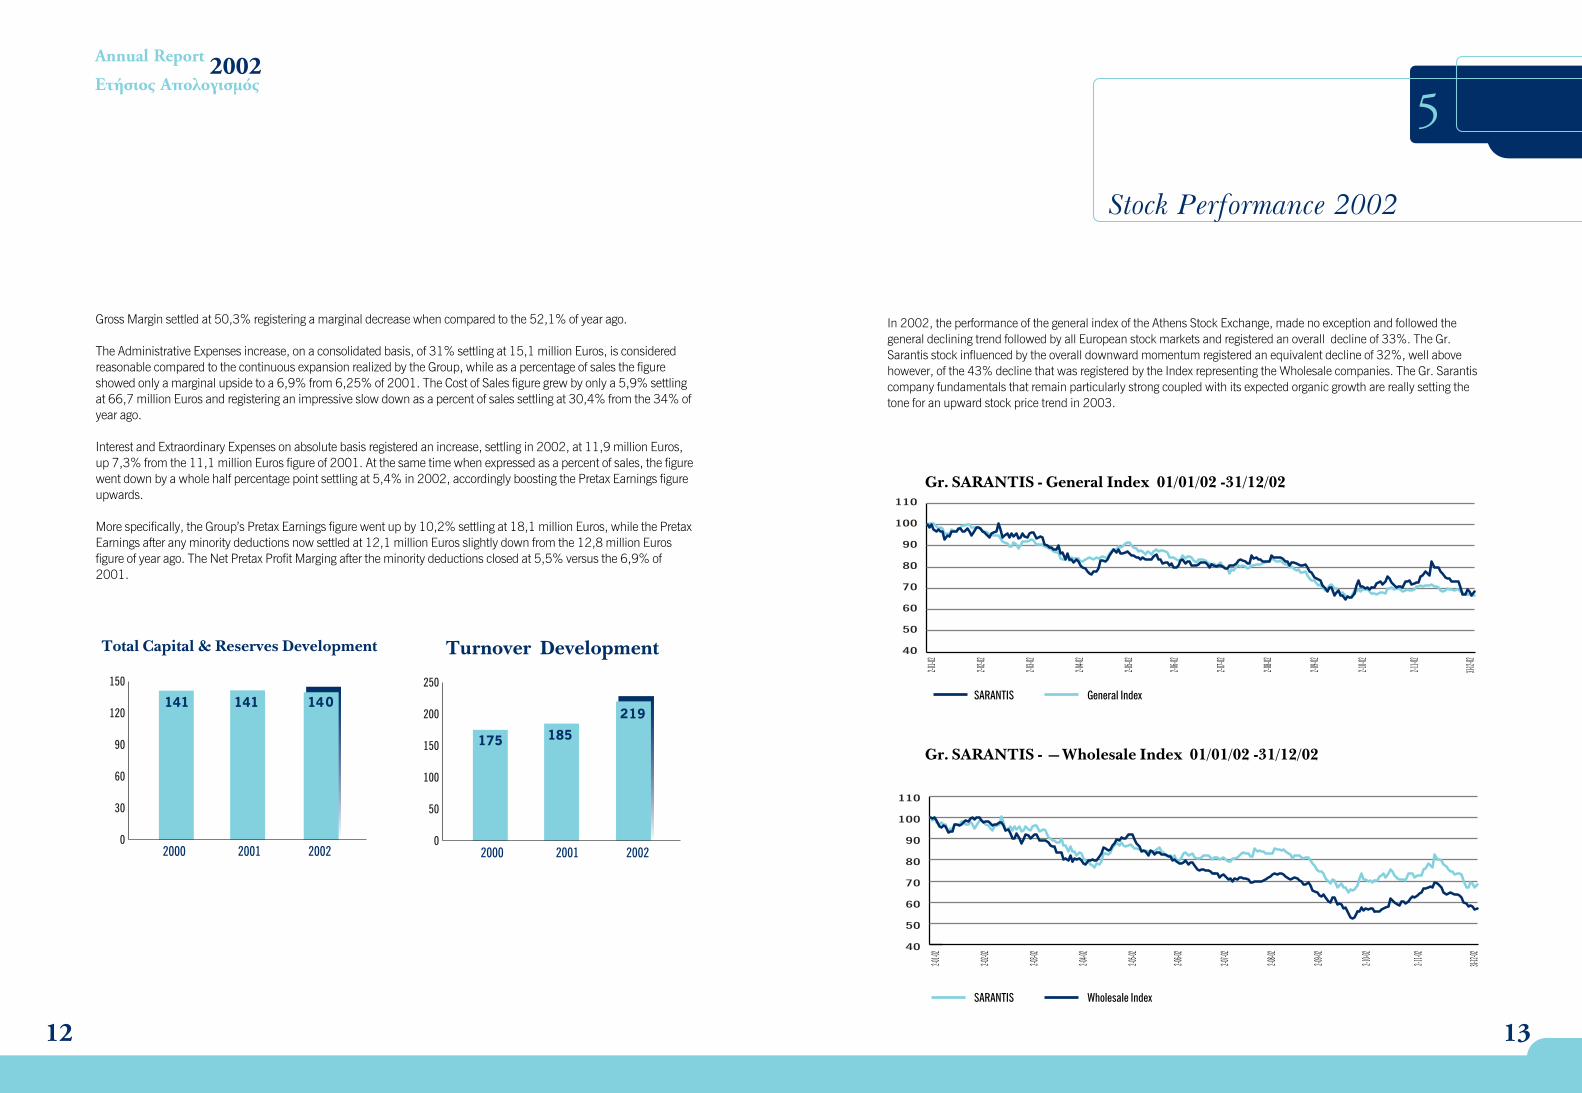
Total Turnover on a consolidated basis showed considerable growth of 18,6% in 2002, and closed at 219,4 millionEuros, up from the 185 million Euros of 2001. Itis worth to mention that the average cumulativeGroup Turnover Growth rate in the period of1996-2002, is considerably higher than theaverage sector growth and one of the highestamong the listed in the Athens Stock Exchangecompanies.
0
5
10
15
20
Net Profit Development
11
1312
2002Annual Report
Ετήσιος Απολογισµός
5
Stock Performance 2002
Gross Margin settled at 50,3% registering a marginal decrease when compared to the 52,1% of year ago.
The Administrative Expenses increase, on a consolidated basis, of 31% settling at 15,1 million Euros, is consideredreasonable compared to the continuous expansion realized by the Group, while as a percentage of sales the figureshowed only a marginal upside to a 6,9% from 6,25% of 2001. The Cost of Sales figure grew by only a 5,9% settlingat 66,7 million Euros and registering an impressive slow down as a percent of sales settling at 30,4% from the 34% ofyear ago.
Interest and Extraordinary Expenses on absolute basis registered an increase, settling in 2002, at 11,9 million Euros,up 7,3% from the 11,1 million Euros figure of 2001. At the same time when expressed as a percent of sales, the figurewent down by a whole half percentage point settling at 5,4% in 2002, accordingly boosting the Pretax Earnings figureupwards.
More specifically, the Group’s Pretax Earnings figure went up by 10,2% settling at 18,1 million Euros, while the PretaxEarnings after any minority deductions now settled at 12,1 million Euros slightly down from the 12,8 million Eurosfigure of year ago. The Net Pretax Profit Marging after the minority deductions closed at 5,5% versus the 6,9% of2001.
0
30
60
90
120
150
Total Capital & Reserves Development
0
50
100
150
200
250
Turnover Development 40
50
60
70
80
90
100
110
40
50
60
70
80
90
100
110
In 2002, the performance of the general index of the Athens Stock Exchange, made no exception and followed thegeneral declining trend followed by all European stock markets and registered an overall decline of 33%. The Gr.Sarantis stock influenced by the overall downward momentum registered an equivalent decline of 32%, well abovehowever, of the 43% decline that was registered by the Index representing the Wholesale companies. The Gr. Sarantiscompany fundamentals that remain particularly strong coupled with its expected organic growth are really setting thetone for an upward stock price trend in 2003.
Gr. SARANTIS - General Index 01/01/02 -31/12/02
SARANTIS General Index
Gr. SARANTIS - —Wholesale Index 01/01/02 -31/12/02
SARANTIS Wholesale Index
VENUS S.A.Main company for the Group encompasses the vehicle for the Joint - Venture operations with ESTEE LAUDERINC. in the Greek and Balkan Markets. Total recorded turnover for 2002 was 53.3 million Euros while EBT was at9.8 million Euros.
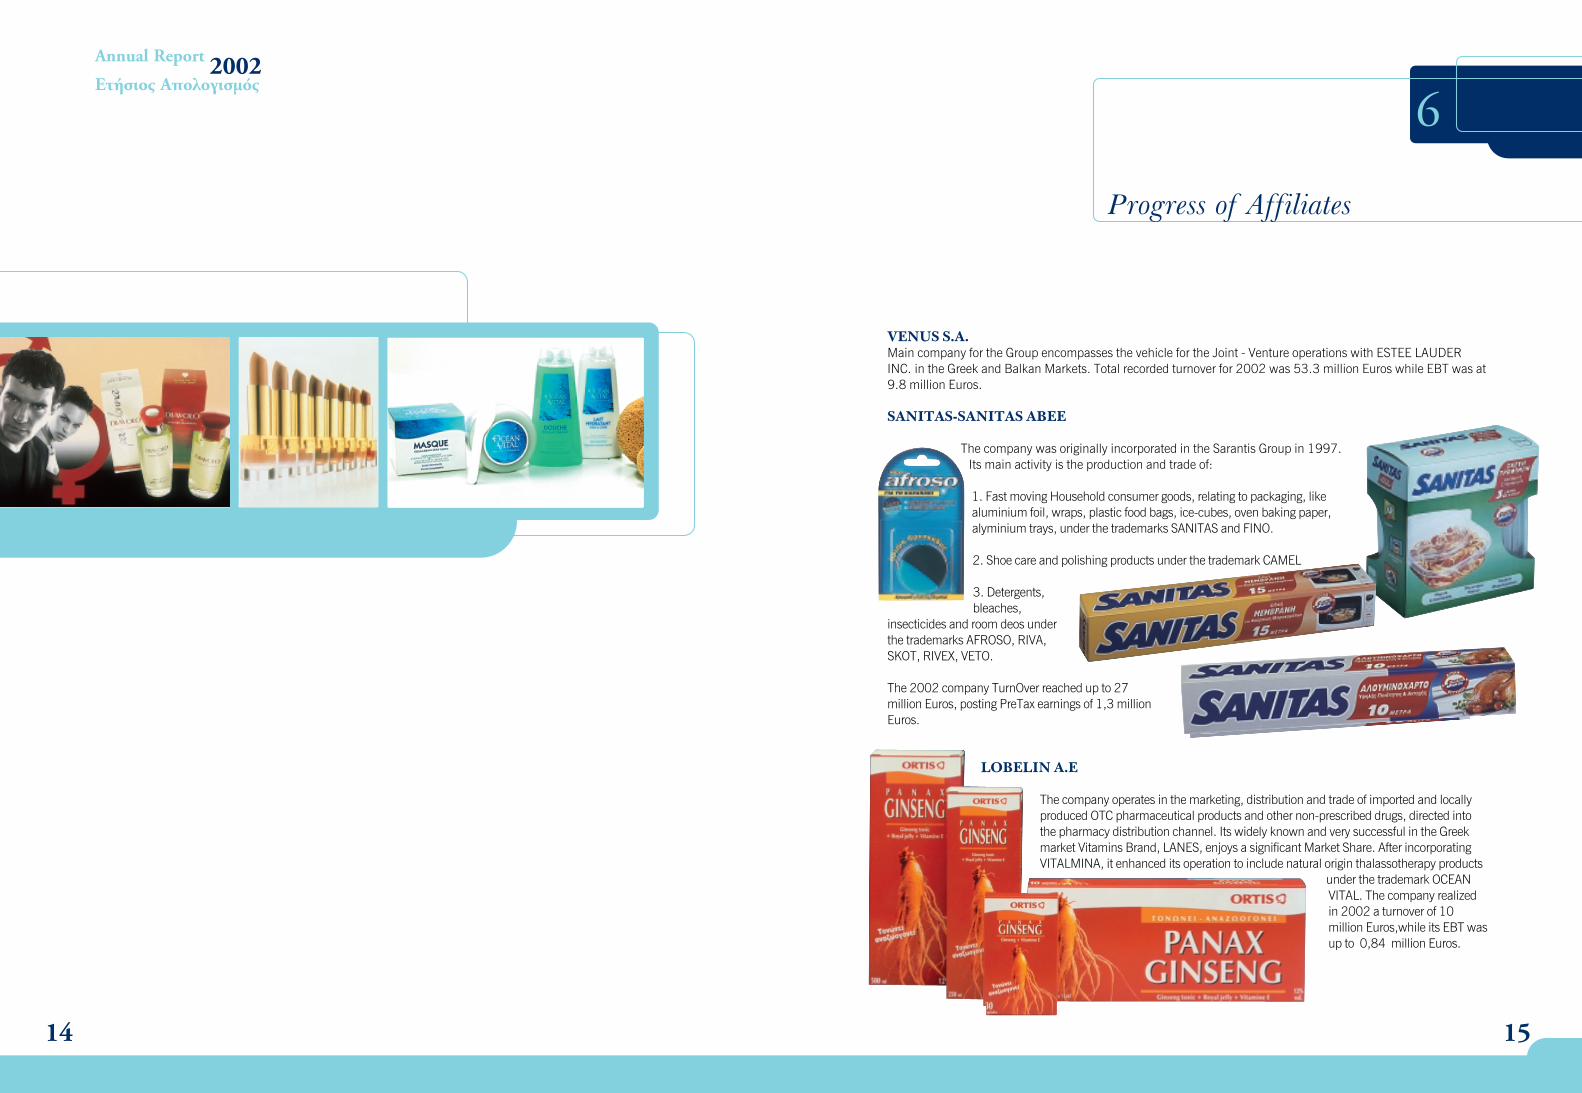
SANITAS-SANITAS ABEE
The company was originally incorporated in the Sarantis Group in 1997.Its main activity is the production and trade of:
1. Fast moving Household consumer goods, relating to packaging, likealuminium foil, wraps, plastic food bags, ice-cubes, oven baking paper,alyminium trays, under the trademarks SANITAS and FINO.
2. Shoe care and polishing products under the trademark CAMEL
3. Detergents,bleaches,
insecticides and room deos underthe trademarks AFROSO, RIVA,SKOT, RIVEX, VETO.
The 2002 company TurnOver reached up to 27million Euros, posting PreTax earnings of 1,3 millionEuros.
LOBELIN A.E
The company operates in the marketing, distribution and trade of imported and locallyproduced OTC pharmaceutical products and other non-prescribed drugs, directed intothe pharmacy distribution channel. Its widely known and very successful in the Greekmarket Vitamins Brand, LANES, enjoys a significant Market Share. After incorporatingVITALMINA, it enhanced its operation to include natural origin thalassotherapy products
under the trademark OCEANVITAL. The company realizedin 2002 a turnover of 10million Euros,while its EBT wasup to 0,84 million Euros.
15
6
Progress of Affiliates
14
2002Annual Report
Ετήσιος Απολογισµός
17
PACKPLAST International Sp. Zoo, POLAND
In 2002, the two business operating entities of the Sarantis Group, S.D. Pack Plast the new acquisition and SarPol thelocal affiliate, came together, merging into one entity, under the Sarantis management. The new scheme became asuccess story, right from the start, by yielding operating results well into the positive domain,completely reversing any negative results of prior years, or even the initial break even target forthe year set by management.
The company’s turnover reached up to 41 million Euros , while earnings before tax closed at aremarkable 0,5 million Euros, a big achievement really, and in full contrast with the halfyear_s cumulative losses of 1,3 million Euros, just before the new Sarantis managementtook over.
The key drivers of this impressive performance were :� The successful and swift merging of PackPlast with SarPol , a process which involved
a subsequent full company restructuring and reengineering with specialstrengthening focus given into the Sales and logistics structures.
� The maintenance of the leading market position for the company’s flagship brandnames Jan_Niezbedny and Grossik , especially in an adverse market environmentcharacterized by Economic Recession and fierce competition.
� The further market penetration of existing cosmetic products , and especially STR8 , thatrealized a hefty 22% sales increase .
� The successful launches of the cosmetics brands C-THRU , Manetti Roberts and Diavolo ,which contributed to the strengthening of our in market product portfolio .
� The Corporate Operating controls put in place and the strong trade liquidity as a cash generator.
ROMSAR S.A. , ROMANIA
2002 marked the seventh year of successful performance for our subsidiary in Romania since it’s initial establishmentback in September 1996. The company is now well recognized to be one of the top distribution companies operatingin the country, with a full distribution network of 9 branches that facilitate the 100% geographical logistics coverage.
Total turnover reached 19.8 Million Euros , recording a healthy top line growth of 16% over last year. Before TaxEarnings grew by 25% over year ago, driving this figure to the 2 million Euros mark .
Key drivers of this top performance were :� The successful introduction of brands from our new principals, namely Georgia Pacific (Delica), Glaxo-Smithkline-
Beecham (Sensodyne , Paradontax)� The stable performance of products of our core principals Antonio Puig (Thais , Aqua Brava) , J & J (Neutrogena) .
L’Oreal and Manetti Roberts � The steadily growing performance realized by the own Sarantis cosmetic brands BU and STR8 � The successful launch of the new Sarantis female and male cosmetics brands, C-THRU and Dare� The expansion of current product portfolio to include a complete line of household products, contributing to a 15%
of turnover� The further increase in the distribution network
16
2002Annual Report
Ετήσιος Απολογισµός
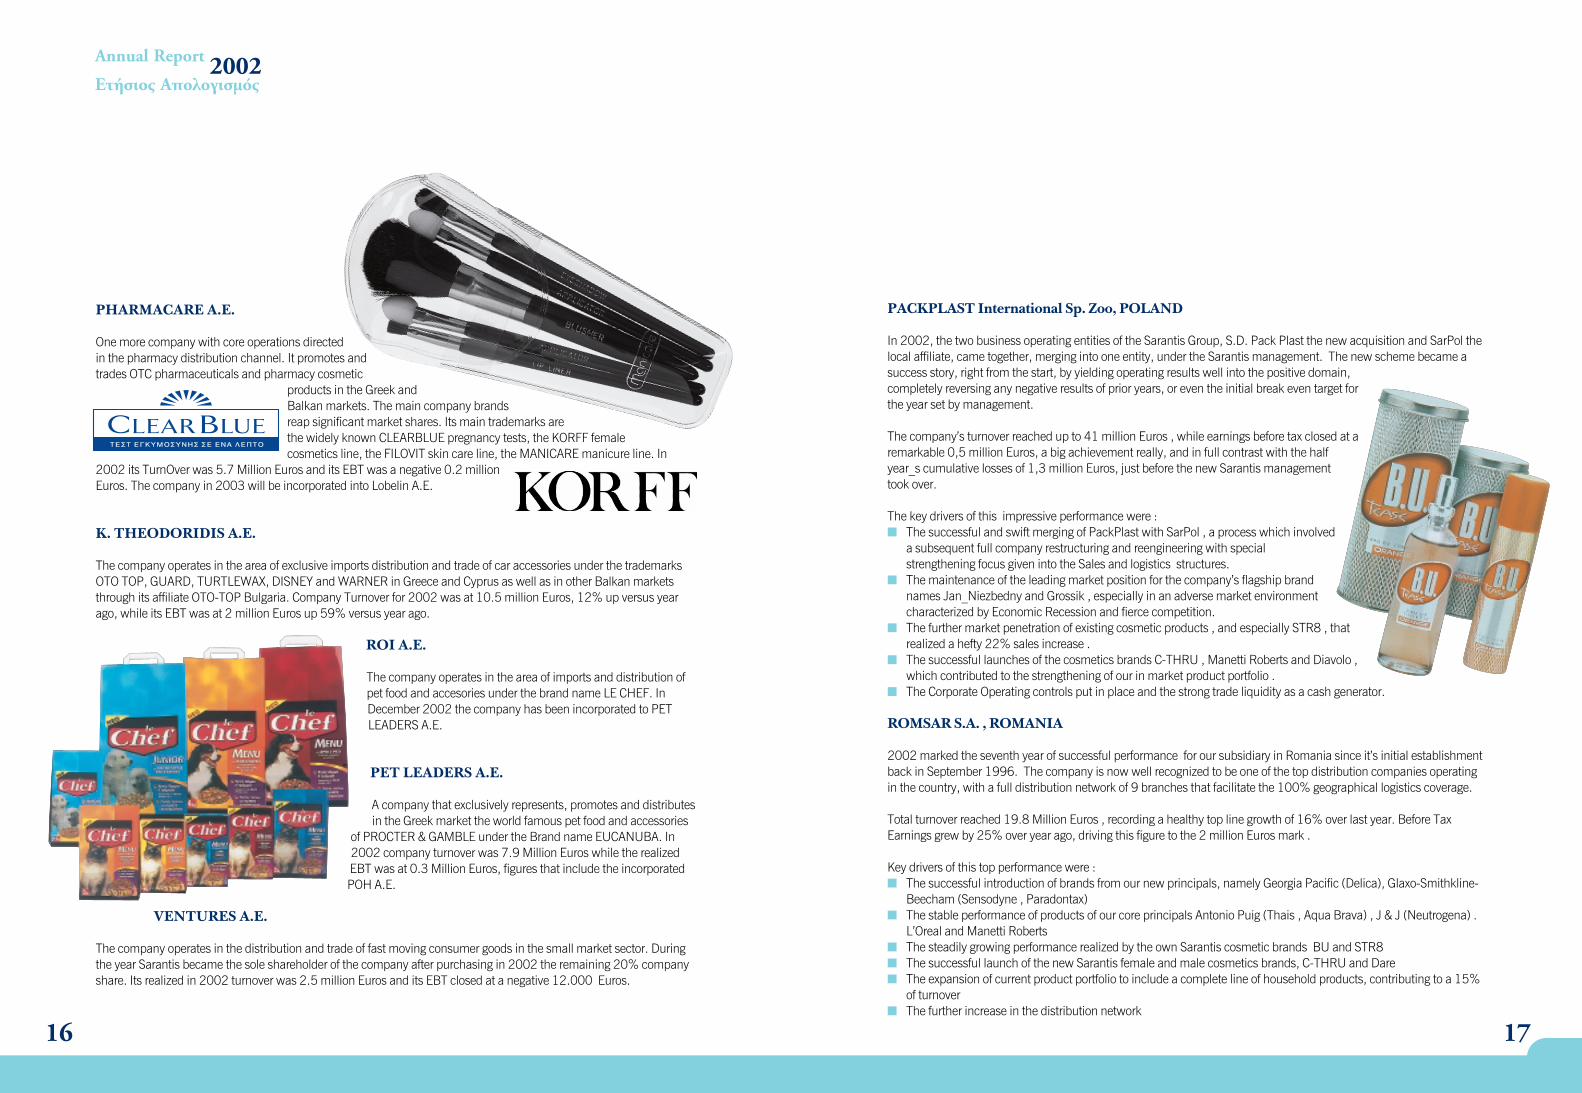
PHARMACARE A.E.
One more company with core operations directedin the pharmacy distribution channel. It promotes andtrades OTC pharmaceuticals and pharmacy cosmetic
products in the Greek andBalkan markets. The main company brandsreap significant market shares. Its main trademarks arethe widely known CLEARBLUE pregnancy tests, the KORFF femalecosmetics line, the FILOVIT skin care line, the MANICARE manicure line. In
2002 its TurnOver was 5.7 Million Euros and its EBT was a negative 0.2 millionEuros. The company in 2003 will be incorporated into Lobelin A.E.
K. THEODORIDIS ∞.∂.
The company operates in the area of exclusive imports distribution and trade of car accessories under the trademarksOTO TOP, GUARD, TURTLEWAX, DISNEY and WARNER in Greece and Cyprus as well as in other Balkan marketsthrough its affiliate OTO-TOP Bulgaria. Company Turnover for 2002 was at 10.5 million Euros, 12% up versus yearago, while its EBT was at 2 million Euros up 59% versus year ago.
ROI ∞.∂.
The company operates in the area of imports and distribution ofpet food and accesories under the brand name LE CHEF. InDecember 2002 the company has been incorporated to PETLEADERS A.E.
PET LEADERS A.E.
A company that exclusively represents, promotes and distributesin the Greek market the world famous pet food and accessories
of PROCTER & GAMBLE under the Brand name EUCANUBA. In2002 company turnover was 7.9 Million Euros while the realizedEBT was at 0.3 Million Euros, figures that include the incorporatedƒ√∏ ∞.∂.
VENTURES A.E.
The company operates in the distribution and trade of fast moving consumer goods in the small market sector. Duringthe year Sarantis became the sole shareholder of the company after purchasing in 2002 the remaining 20% companyshare. Its realized in 2002 turnover was 2.5 million Euros and its EBT closed at a negative 12.000 Euros.
1918
2002Annual Report
Ετήσιος Απολογισµός
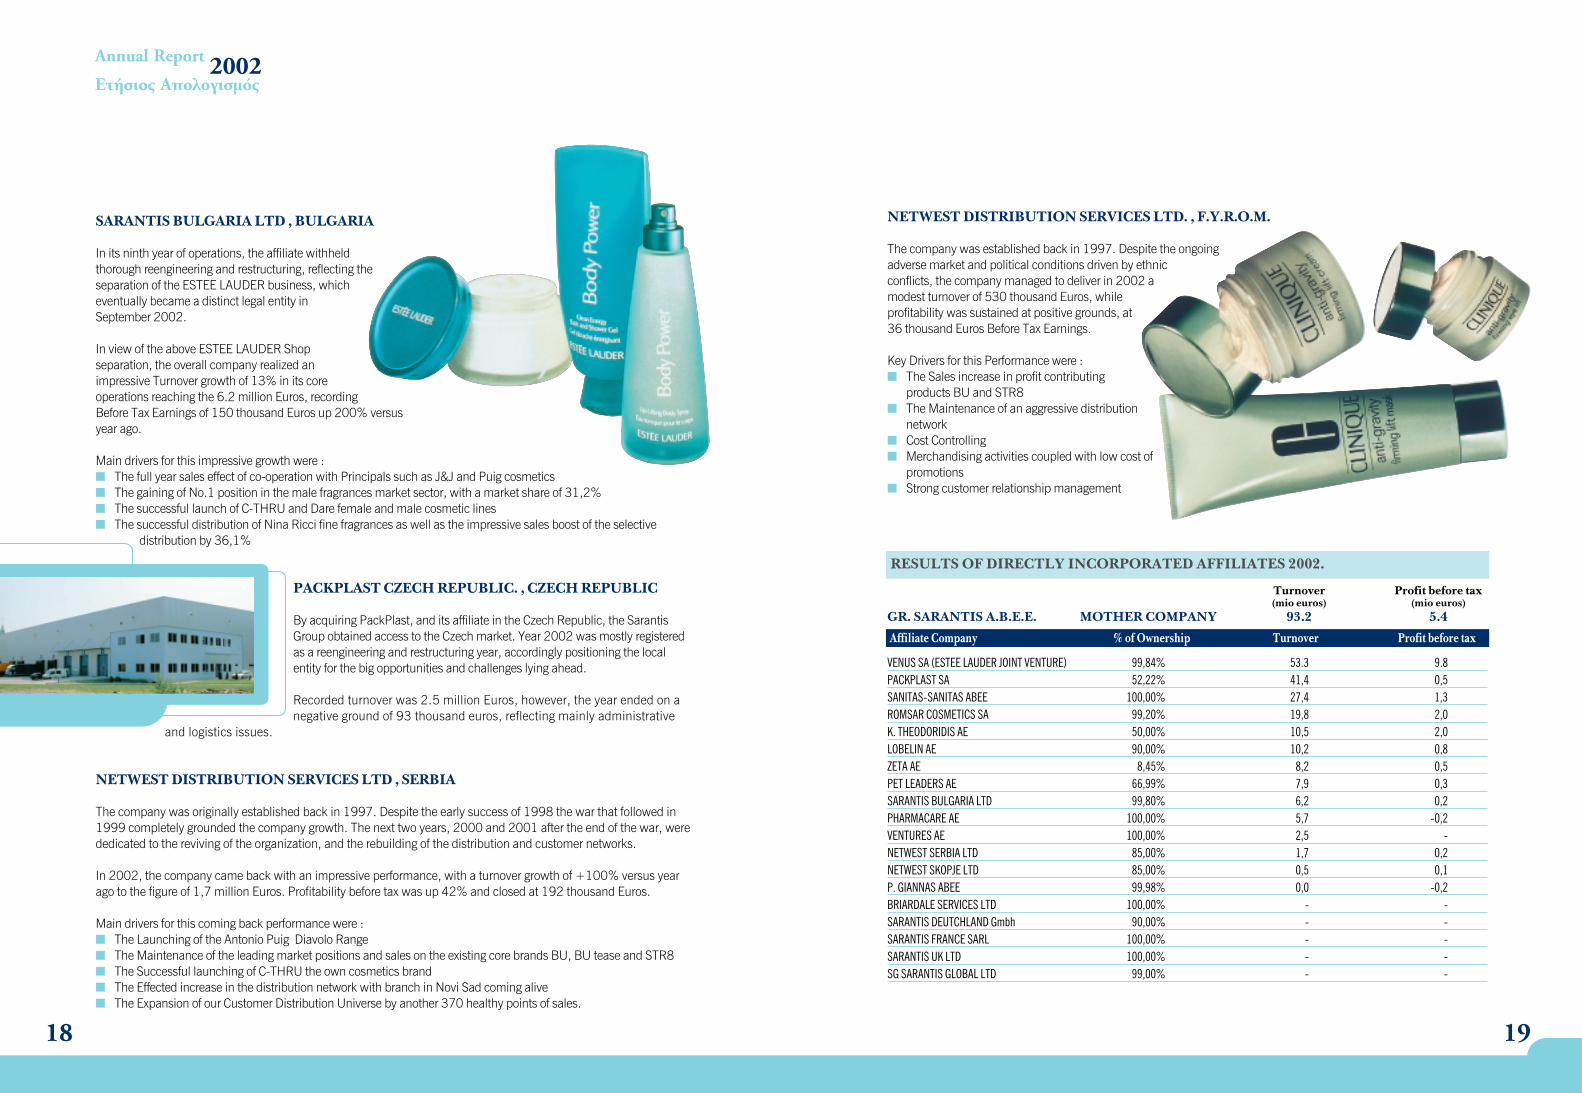
SARANTIS BULGARIA LTD , BULGARIA
In its ninth year of operations, the affiliate withheldthorough reengineering and restructuring, reflecting theseparation of the ESTEE LAUDER business, whicheventually became a distinct legal entity inSeptember 2002.
In view of the above ESTEE LAUDER Shopseparation, the overall company realized animpressive Turnover growth of 13% in its coreoperations reaching the 6.2 million Euros, recordingBefore Tax Earnings of 150 thousand Euros up 200% versusyear ago.
Main drivers for this impressive growth were :� The full year sales effect of co-operation with Principals such as J&J and Puig cosmetics � The gaining of No.1 position in the male fragrances market sector, with a market share of 31,2%� The successful launch of C-THRU and Dare female and male cosmetic lines � The successful distribution of Nina Ricci fine fragrances as well as the impressive sales boost of the selective
distribution by 36,1%
PACKPLAST CZECH REPUBLIC. , CZECH REPUBLIC
By acquiring PackPlast, and its affiliate in the Czech Republic, the SarantisGroup obtained access to the Czech market. Year 2002 was mostly registeredas a reengineering and restructuring year, accordingly positioning the localentity for the big opportunities and challenges lying ahead.
Recorded turnover was 2.5 million Euros, however, the year ended on anegative ground of 93 thousand euros, reflecting mainly administrative
and logistics issues.
NETWEST DISTRIBUTION SERVICES LTD , SERBIA
The company was originally established back in 1997. Despite the early success of 1998 the war that followed in1999 completely grounded the company growth. The next two years, 2000 and 2001 after the end of the war, werededicated to the reviving of the organization, and the rebuilding of the distribution and customer networks.
In 2002, the company came back with an impressive performance, with a turnover growth of +100% versus yearago to the figure of 1,7 million Euros. Profitability before tax was up 42% and closed at 192 thousand Euros.
Main drivers for this coming back performance were :� The Launching of the Antonio Puig Diavolo Range � The Maintenance of the leading market positions and sales on the existing core brands BU, BU tease and STR8 � The Successful launching of C-THRU the own cosmetics brand� The Effected increase in the distribution network with branch in Novi Sad coming alive� The Expansion of our Customer Distribution Universe by another 370 healthy points of sales.
NETWEST DISTRIBUTION SERVICES LTD. , F.Y.R.O.M.
The company was established back in 1997. Despite the ongoingadverse market and political conditions driven by ethnicconflicts, the company managed to deliver in 2002 amodest turnover of 530 thousand Euros, whileprofitability was sustained at positive grounds, at36 thousand Euros Before Tax Earnings.
Key Drivers for this Performance were :� The Sales increase in profit contributing
products BU and STR8� The Maintenance of an aggressive distribution
network� Cost Controlling � Merchandising activities coupled with low cost of
promotions� Strong customer relationship management
RESULTS OF DIRECTLY INCORPORATED AFFILIATES 2002.
Turnover Profit before tax (mio euros) (mio euros)
GR. SARANTIS A.B.E.E. MOTHER COMPANY 93.2 5.4
Affiliate Company % of Ownership Turnover Profit before tax
VENUS SA (ESTEE LAUDER JOINT VENTURE) 99,84% 53.3 9.8PACKPLAST SA 52,22% 41,4 0,5SANITAS-SANITAS ABEE 100,00% 27,4 1,3ROMSAR COSMETICS SA 99,20% 19,8 2,0∫. THEODORIDIS ∞∂ 50,00% 10,5 2,0LOBELIN AE 90,00% 10,2 0,8ZETA AE 8,45% 8,2 0,5PET LEADERS AE 66,99% 7,9 0,3SARANTIS BULGARIA LTD 99,80% 6,2 0,2PHARMACARE AE 100,00% 5,7 -0,2VENTURES AE 100,00% 2,5 -NETWEST SERBIA LTD 85,00% 1,7 0,2NETWEST SKOPJE LTD 85,00% 0,5 0,1P. GIANNAS ∞µ∂∂ 99,98% 0,0 -0,2BRIARDALE SERVICES LTD 100,00% - -SARANTIS DEUTCHLAND Gmbh 90,00% - -SARANTIS FRANCE SARL 100,00% - -SARANTIS UK LTD 100,00% - -SG SARANTIS GLOBAL LTD 99,00% - -
20
2002Annual Report
Ετήσιος Απολογισµός
21
The Prospects for the Sarantis group of Companies in 2003 are very promising, despite the unfavorable and unstablemacroeconomic environment prevailing in Europe.
The leading drivers which the group plans to move along in the coming years, will continue to be the same ones thathave guided us so far in the last three years.
The Development of fragrances and other fast moving consumer own brands coupled with the simultaneouspenetration in the markets of Central and Eastern Europe.
With reference to the above frame of action, Sarantis in 2003 plans to introduce new innovative fast moving consumerbrands especially into the market segments of shoe care and toiletry fragrance. Furthermore,early in 2003, Sarantis introduced the new official 2004 Olympic Games fragrances line,targeting to exploit the trademark rights as an official licensee of the Olympic trademark. Thesefragrances are targeting to both female and male users through two different variants for eachgenre.
A key challenge for 2003, is to start up a business operation into another major market of theEastern European geography. With regard to this aspiration direct targets are thechallenging markets of either Russia, Ukraine or Turkey, which post bigopportunities for the Sarantis brands.In 2003, the Sarantis Group of Companies, is forecasting a TurnOver of 232million Euro, and before tax earnings of 19 million Euro.
7
Prospects for 2003
2322
2002Annual Report
Ετήσιος Απολογισµός
B.FO
RMAT
ION
EXPE
NSES
1.Pr
elimi
nary
expe
nses
468.9
13,46
312.2
31,80
156.6
81,66
252.0
36,42
69.22
3,88
182.8
12,54
4.Ot
her f
orma
tion
expe
nses
9.215
.636,0
92.5
42.27
3,17
6.673
.362,9
28.4
38.74
1,10
2.353
.674,2
06.0
85.06
6,90
---------
---------
---------
---------
---------
---------
9.684
.549,5
52.8
54.50
4,97
6.830
.044,5
88.6
90.77
7,52
2.422
.898,0
86.2
67.87
9,44
==
==
==
==
==
==
==
==
==
==
==
==
==
==
==
==
==
==
==
==
==
==
==
==
==
==
==
C.FI
XED
ASSE
TSI.
Inta
ngib
le As
sets
Diffe
renc
es in
cons
olida
tion
77.70
2.259
,9659
.4006
12,95
18.30
1.647
,0172
.986.8
66,28
48.92
5.351
,6724
.061.5
14,61
1.Re
sear
ch a
nd d
evelo
pmen
t cos
ts27
.172,7
321
.738,1
85.4
34,55
27.17
2,73
21.73
8,18
5.434
,552.
Conc
essio
ns, p
aten
ts, lic
ence
s tra
de m
arks
and
simila
r righ
ts an
d as
sets
613.8
66,36
44.66
2,76
569.2
03,60
569.8
45,82
35.27
1,72
534.5
74,10
3.Ov
er va
lue of
the e
nter
prise
801.0
30,64
12.65
8,93
788.3
71,71
63.29
4,64
12.65
8,93
50.63
5,71
5.Ot
her I
ntan
gible
Asse
ts4.1
81.77
0,86
1.044
.170,8
83.1
37.59
9,98
1.276
.285,4
319
9.011
,731.0
77.27
3,70
---------
---------
---------
---------
---------
---------
83.32
6.100
,5560
.523.8
43,70
22.80
2.256
,8574
.923,4
64,90
49.19
4.032
,2325
.729.4
32,67
==
==
==
==
==
==
==
==
==
==
==
==
==
==
==
==
==
==
==
==
==
==
==
==
==
==
==
II.Ta
ngib
le As
sets
1.La
nd2.8
16.45
6,70
0,00
2.816
.456,7
02.2
82.53
8,78
0,00
2.282
.538,7
83.
Build
ings a
nd te
chnic
al wo
rks22
.535.3
77,58
2.825
.899,0
319
.709.4
78,55
21.62
2.994
,472.1
38.69
1,41
19.48
4.303
,064.
Mach
inery,
tech
nical
insta
llatio
ns a
ndoth
er m
echa
nical
equip
emen
t6.4
78.95
1,34
4.055
.641,1
92.4
23.31
0,15
5.124
.299,9
73.0
52.96
4,36
2.071
.335,6
15.
Tran
spor
tatio
n eq
uipme
nt5.0
51.34
7,70
2.936
.077,3
22.1
15.27
0,38
4.318
.202,9
02.2
54.55
2,08
2.063
.650,8
26.
Furn
iture
and
fixtu
res
15.95
6.927
,609.7
91.90
1,00
6.165
.026,6
012
.547.1
82,66
8.241
.381,9
34.3
05.80
0,73
7.Pr
epay
ments
and a
ssets
unde
r con
struc
tion
368.5
26,32
0,00
368.5
26,32
326.5
05,30
2.746
,8732
3.758
,43---------
---------
---------
---------
---------
---------
53.20
7.587
,2419
.609.5
18,54
33.59
8.068
,7046
.221.7
24,08
15.69
0.336
,6530
.531.3
87,43
==
==
==
==
==
==
==
==
==
==
==
==
==
==
==
==
==
==
==
==
==
==
==
==
==
==
==
Tota
l tan
gible
and
intag
ible a
ssets
( CI
+CI
I)13
6.533
.687,7
980
.133.3
62,24
56.40
0.325
,5512
1.145
.188,9
864
.884.3
68,88
56.26
0.820
,09=
==
==
==
==
==
==
==
==
==
==
==
==
==
==
==
==
==
==
==
==
==
==
==
==
==
==
==
=
III.
Finan
cial A
ssets
1.Pa
rticip
ating
inter
ests
in af
filiat
ed u
nder
t64
.877.0
68,57
66.80
8.433
,73Le
ss: I
nsta
lmen
ts du
e0,0
064
.877.0
68,57
305.7
88,05
66.50
2.645
,68---------
---------
7.Ot
her f
inanc
ial a
ssets
358.7
22,42
336.7
26,71
---------
---------
65.23
5.790
,9966
.839.3
72,39
==
==
==
==
==
==
==
==
==
TOTA
L FIXE
D AS
SETS
(CI+
CII+
CIII)
121.6
36.11
6,54
123.1
00.19
2,48
==
==
==
==
==
==
==
==
==
==
D.CU
RREN
T ASS
ETS
I.St
ocks
1.Me
rchan
dise
28.01
8.715
,7524
.837.8
37,81
2.Fin
ished
, sem
i-fini
shed
pro
ducts
, byp
rodu
cts, a
nd sc
rap
2.897
.139,3
93.7
86.40
5,54
4.Ra
w an
d auxi
liary
mater
ials,
cons
umab
les, s
pare
parts
and p
ackin
g item
s4.9
92.42
6,13
5.931
.051,7
05.
Adva
nce p
ayme
nt fo
r stoc
k1.5
19.16
6,90
1.156
.667,7
8---------
---------
37.42
7.448
,1735
.711.9
62,83
==
==
==
==
==
==
==
==
==
II.De
btor
s1.
Trad
e deb
tors
63.79
8381
,1258
.986.1
18,22
Less
: Pro
vision
s1.4
49.29
5,07
62.34
9.086
,0547
7.092
,9458
.509.0
25,28
----------
---------
2.No
tes re
ceiva
ble- I
n po
rtofol
io57
6.859
,821.0
50.55
2,56
- At b
anks
as p
ledge
226.5
22,65
254.0
13,91
- At b
anks
for c
ollec
tion
422.8
46,24
1.226
.228,7
143
2.229
,351.7
36.79
5,82
----------
---------
3.No
tes re
ceiva
ble ov
erdu
e21
8.570
,7119
8.567
,583·
.Ch
eque
s rev
eivab
le23
.084.8
10,83
22.87
0.202
,563b
.Ch
eque
s ove
rdue
1.646
.478,8
81.4
43.96
0,24
Less
: Pro
vision
s12
2.774
,481.5
23.70
4,40
68.13
1,38
1.375
.828,8
6----------
---------
3d.
Cheq
ues r
eveiv
able
as p
ledge
16.90
6,70
57.94
5,86
4.Du
e Cap
ital
0,00
658.7
61,88
5.So
rt ter
m cla
ims i
n af
filiat
ed u
nder
239.9
82,65
0,00
8.Bl
ocke
d Ba
nk A
ccou
nts
942,6
40,0
010
.Do
ubtfu
l tra
de a
nd ot
her d
ebtor
s1.0
25.96
2,26
1.054
.288,7
2Le
ss: P
rovis
ions
48.03
9,52
977.9
22,74
620.0
91,59
434.1
97,13
----------
---------
11.
Sund
ry de
btor
s17
.917.8
06,63
28.63
9.147
,6512
.Ad
vanc
es to
acc
ount
for
259.6
05,51
181.6
88,81
---------
---------
107.8
15.56
7,57
114.6
62.16
1,43
==
==
==
==
==
==
==
==
==
==
III.
Inve
stmen
ts1.
Shar
es6.1
96.56
0,09
13.18
1.429
,863.
Othe
r inv
estm
ents
244.5
84,57
1.398
.471,4
94.
Own
shar
es57
.112,0
014
7.702
,74---------
---------
6.498
.256,6
614
.727.6
04,09
Less
: Ins
talm
ents
due
985,1
86.4
97.27
1,48
985,1
814
.726.6
18,91
---------
==
==
==
==
=---------
==
==
==
==
=IV
.Ca
sh at
ban
k and
in h
and
1.Ca
sh in
han
d31
9.726
,1740
1.561
,733.
Sight
and
time
dep
osits
12.36
4.541
,947.8
87.64
9,29
---------
---------
12.68
4.268
,118.2
89.21
1,02
==
==
==
==
==
==
==
==
==
TOTA
L CUR
RENT
ASS
ETS
(DI+
DII+
DIII+
DIV)
164.4
24.55
5,33
173.3
89.95
4,19
==
==
==
==
==
==
==
==
==
==
E.PR
EPAY
MENT
S AN
D AC
CRUE
D IN
COME
1.De
ferre
d ex
pens
es61
6.000
,6638
8.235
,392.
Accru
ed
incom
e1.0
31.01
0,46
1.023
.743,4
53.
Othe
r pre
paym
ents
and
accru
ed in
come
1.150
.412,5
420
0.825
,98---------
---------
2.797
.423,6
61.6
12.80
4,82
==
==
==
==
==
==
==
==
==
GRAN
D TO
TAL A
SSET
S (B
+C+
D+E)
295.6
88.14
0,11
304.3
70.83
0,93
==
==
==
==
==
==
==
==
==
==
MEMO
ACC
OUNT
S1.
Third
par
ty as
set i
tems
0,56
0,56
2.Gu
aran
tees a
nd re
al se
curit
ies5.5
13.55
2,50
5.372
.972,8
83.
Debt
ors o
f bila
teral
cont
racts
39.35
0,00
0,00
4.Ot
her m
emo a
ccou
nts
19.57
5,63
19.57
5,62
---------
---------
5.572
.478,6
95.3
92.54
9,06
==
==
==
==
==
==
==
==
==
A.CA
PITA
L AND
RES
ERVE
SI.
Capi
tal
1.Pa
id-up
capit
al56
.441.4
08,60
55.46
5.884
,08=
==
==
==
==
==
==
==
==
=II.
Shar
e pre
mium
acco
unt
75.49
5.031
,6675
.495.0
31,66
==
==
==
==
==
==
==
==
==
III.
Reva
luatio
n Re
serv
es -
Inve
stmen
t Gra
nts
2.Re
serv
es fr
om re
valua
tion
ofoth
er a
ssets
0,00
37.10
5,45
3.Gr
ants
for in
vestm
ents
in fix
ed a
ssets
234.0
65,39
384.5
76,92
---------
---------
234.0
65,39
421.6
82,37
==
==
==
==
==
==
==
==
==
IV.
Rese
rves
1.St
atut
ory r
eser
ves
1.826
.415,1
51.6
57.17
5,21
1a. L
osse
s for
m Se
curit
ies re
valua
tion
-6.47
9.503
,27-3
.686.5
58,18
1b. L
oss f
rom
sale
of pa
rticip
ation
-794
.593,9
30,0
04.
Extra
ordin
ary r
eser
ves
68,20
62.31
4,29
5.Ta
x - fr
ee re
serv
es
unde
r spe
cial la
ws6.7
91.33
8,06
6.975
.880,0
76.
Rese
rves
for a
cquis
ition
of ow
n se
curit
ies57
.112,0
014
7.702
,74---------
---------
1.400
.836,2
15.1
56.51
4,13
==
==
==
==
==
==
==
==
==
V.Re
sults
carri
ed fo
rwar
dPr
ofil c
arrie
d for
ward
6.146
.340,6
94.8
72.59
5,18
==
==
==
==
==
==
==
==
==
Tota
l cap
ital a
nd re
serv
es(A
I+AI
I+AI
II+AI
V+AV
)13
9.717
.682,5
514
1.411
.707,4
2=
==
==
==
==
==
==
==
==
=Vπ
I.Mi
norit
y Righ
tsOn
the C
apita
l4.7
46.27
6,35
4.605
.955,7
5On
Res
erve
s and
Pro
fit9.3
04.67
3,90
3.046
.764,8
3---------
---------
14.05
0.950
,257.6
52.72
0,58
==
==
==
==
==
==
==
==
==
VIπI.
Depr
eciab
le Co
nsoli
datio
n Di
ffere
nces
-59.4
00.61
2,95
-48.9
25.35
1,66
==
==
==
==
==
==
==
==
==
B.PR
OVIS
IONS
FOR
LIAB
ILITI
ES A
ND C
HARG
ES1.
Prov
ision
s for
retir
emen
t ben
efits
548.2
45,18
298.9
98,18
2.Ot
her p
rovis
ions
3.852
.678,3
64.5
63.09
0,32
---------
---------
4.400
.923,5
44.8
62.08
8,50
==
==
==
==
==
==
==
==
==
C.CR
EDITO
RSI.
Long
-term
deb
t2.
Bank
Loan
s90
.465.4
26,87
64.96
5.426
,874.
Othe
r Lon
g Ter
m Lia
bilitie
s1.4
57.79
4,14
4.000
.000,0
0---------
---------
91.92
3.221
,0168
.965.4
26,87
==
==
==
==
==
==
==
==
==
II.Cu
rrent
liab
ilitie
s1.
Supp
liers
37.51
8.950
,0432
.492.2
83,59
2.No
tes p
ayab
le31
1.931
,6389
9.846
,092·
.Ch
ecks
pay
able
6.623
.047,2
87.6
71.17
1,93
3.Sh
ort t
erm
loans
33.85
7.858
,5666
.931.4
44,57
4.Ad
vanc
es fr
om tr
ade d
ebtor
s80
8.956
,055.4
16.45
9,56
5.Ta
xes-
dutie
s11
.541.8
01,45
5.951
.357,0
16.
Socia
l sec
urity
1.462
.996,2
11.1
43.04
8,17
7.Cu
rrent
por
tion
of lon
g-ter
m de
dt19
.235,0
019
.908,4
68.
Curre
nt Li
abilit
ies to
Par
ticipa
ting C
ompa
nies
0,00
17.38
6,37
10.
Divid
ends
3.054
.592,9
12.4
69.80
1,96
11.
Sund
ry Cr
edito
rs5.4
24.94
2,52
5.188
.451,1
5---------
---------
100.6
24.31
1,65
128.2
01.15
8,86
==
==
==
==
==
==
==
==
==
TOTA
L CRE
DITO
RS (
CI+
CII)
192.5
47.53
2,66
197.1
66.58
5,73
==
==
==
==
==
==
==
==
==
D.AC
CRUA
LS A
ND D
EFFE
RED
INCO
ME1.
Incom
es of
follo
wing
year
s1.2
58.13
0,29
3.029
,692.
Accru
ed ex
pens
es2.1
75.14
3,77
2.100
.292,2
93.
Othe
r acc
ruals
and
deff
ered
inco
me93
8.290
,0099
.758,3
8---------
---------
4.371
.664,0
62.2
03.08
0,36
==
==
==
==
==
==
==
==
==
GRAN
D TO
TAL L
IABI
LITIE
S (A
+B+
C+D)
295.6
88.14
0,11
304.3
70.83
0,93
==
==
==
==
==
==
==
==
==
MEMO
ACC
OUNT
S1.
Bene
fciar
ies of
ass
et ite
ms0,5
60,5
62.
Guar
antee
s and
real
secu
rities
5.513
.552,5
05.3
72.97
2,88
3.Lia
bilitie
s of B
ilater
al Co
ntra
cts39
.350,0
00,0
04.
Othe
r mem
o acc
ount
s19
.575,6
319
.575,6
2---------
---------
5.572
.478,6
95.3
92.54
9,06
==
==
==
==
==
==
==
==
==
LIAB
ILIT
IES
SARA
NTIS
GRO
UP O
F CO
MPA
NIES
PUBL
IC C
OMPA
NIES
Reg.
No.
130
83/0
6/B/
86/2
710
th Y
EAR
(Janu
ary
1 -
Dece
mbe
r 31,
200
2)
PROF
ITAN
D LO
SS A
CCOU
NTAt
Dec
embe
r 31,
2001
(Jan
uary
1 - D
ecem
ber 3
1, 20
01)
2002
2001
AUDI
TOR’
S REP
ORT
To th
e sha
reho
lders
of G
r. Sa
rant
is SA
Towa
rds
the S
hareh
olders
of t
he S
ociet
e An
onym
e «G
R.SA
RANT
IS A.B
.E.E.
Socie
te An
onym
e pr
oduc
tion
and
comm
ercial
Cos
metic
s, Te
xtiles
,Ho
useh
old an
d Pha
rmac
eutic
al pr
oduc
ts co
mpan
y, An
d it’s
subs
idiar
ies.
We A
udite
d, ac
cord
ing to
the c
lause
s of A
rticle
108 f
orese
en in
Law
N.21
90/1
920 c
once
rning
Limi
ted sh
areh
olders
comp
anies
the 1
0th c
onso
lidate
dBa
lance
She
et, th
e con
solid
ated
cash
state
ment
and
the re
lative
atta
chme
nts of
the c
ompa
ny «
GR.SA
RANT
IS A.B
.E.E.
Socie
te An
onym
e prod
uctio
nan
d com
merci
al Co
smeti
cs, T
extile
s, Ho
useh
old an
d Pha
rmac
eutic
al pr
oduc
ts co
mpan
y, an
d it’s
subs
idiar
ies fo
r the
fisca
l yea
r end
ing D
ecem
ber 3
1st
2002
. We a
pplie
d all p
roced
ures
we d
eeme
d suit
able
for th
e obje
ctivit
y of o
ur au
dit, w
hich i
s full
y in a
ccord
ance
to th
e acc
epted
audit
ing pr
incipl
es of
the A
udito
rs an
d Ac
coun
tants
Boar
d an
d ve
rified
the c
onten
t of t
he co
nsoli
dated
man
agem
ent r
eport
toge
ther w
ith th
e fina
ncial
state
ments
. We d
idno
t exte
nd th
e aud
it to o
pera
tions
that
are i
nclud
ed in
the c
onso
lidate
d bala
nce s
heet,
but n
ot au
dited
. This
repr
esen
ts ap
prox
imate
ly 9%
and 1
9% of
the As
set to
tal an
d res
ults o
f cur
rent p
eriod
resp
ectiv
ely. F
rom ou
r aud
it, the
follo
wing
were
foun
d : 1)
The a
lloca
ted to
C.III.
1 « Pa
rticip
ation
s in a
ffiliat
edco
mpan
ies» r
epres
ent t
he Sh
are a
cquis
ition v
alue o
f limi
ted co
mpan
ies th
at ar
e not
includ
ed in
the r
espe
ctive
cons
olida
tion.
Base
d on s
hare
value
of31
/12/
2002
, they
shou
ld ha
ve be
en ev
aluate
d les
s, ap
prox
imate
ly by
Œ47
.725.0
00 w
ith re
spec
tive s
urch
arge
of fis
cal re
sults
and o
wners
equit
y. 2)
The p
aren
t com
pany
and
subs
idiar
ies in
clude
d in
the co
nsoli
datio
n, an
d en
comp
asse
d un
der c
lause
205
/198
8 co
nsult
atory
of ad
minis
trativ
e leg
alad
visors
and
arti
cle 1
0 of
law 2
065/
1992
, did
not c
onfig
ure,
as w
as d
one i
n the
rece
nt fis
cal y
ear,
prov
ision
s for
seve
ranc
e and
retir
emen
t. If
theab
ovem
entio
ned
prov
ision
s were
mad
e, the
n thi
s wou
ld am
ount
to Œ
1.189
.350.
From
this a
moun
t, ap
prox
imate
ly Œ
238.8
10 re
lates
the p
resen
tfis
cal y
ear, a
nd th
e res
t, pas
t fisc
al ye
ars.
3)Th
e par
ent c
ompa
ny an
d its
subs
idiar
ies «P
.GIAN
NAS S
.A» an
d «SA
NITA
S-SA
NITA
S S.A.
» afte
r the
relat
ivetax
ordin
ance
, bur
dene
d the
curre
nt fis
cal y
ear w
ith Π1
.629.5
52,52
whic
h is r
elated
to 1/
5 of d
eficit
from
the s
ale an
d dev
aluati
on of
stoc
k from
the
2000
fisca
l yea
r. Th
e rem
aining
2/5 o
f defi
cit ar
e inc
luded
in th
e ass
et ite
m D.
II.11 «
Misc
ellan
eous
debto
rs» an
d amo
unts
to Π3
.259.1
11,02
. 4)T
hede
ficit
origin
ated
from
evalu
ation
and
sale
of p
artic
ipatio
n an
d sto
ck o
f the
par
ent c
ompa
ny a
nd it
s su
bsidi
ary «
P.GIAN
NAS
S.A»
and
«SAN
ITAS-
SANI
TAS
S.A.»
amou
nting
to Œ
4.517
.009,3
6 wa
s ente
red di
rectly
in re
ducti
on of
owne
rs ca
pital,
with
out t
he re
spec
tive e
ntry i
n fisc
al ye
ar re
sults
.5)
For t
he as
sume
d defi
cit fr
om ba
d deb
ts, of
paren
t com
pany
and s
ubsid
iaries
, a pr
ovisi
on of
Œ1.4
34.11
1,35
has b
een
made
, whic
h ac
cord
ing to
us, s
hould
be hi
gher
by ap
prox
imate
ly Œ
3.237
.348 w
ith th
e res
pecti
ve re
ducti
on in
fisca
l res
ults a
nd ow
ners
capit
al. 6)
The p
aren
t com
pany
and i
tssu
bsidi
ary «
P.GIAN
NAS S
.A» an
d «SA
NITA
S-SA
NITA
S S.A.
» in t
he cu
rrent
fisca
l yea
r, co
ntrar
y to l
ast y
ear,
did no
t effe
ct pr
ovisi
ons o
n firs
t insta
llatio
nex
pens
es. A
ssum
ing th
at the
se pr
ovisi
ons w
ere ef
fected
, acc
ording
to th
e fac
tor u
nder
law N
.2238
/199
4, the
n the
curre
nt fis
cal r
esult
s and
owne
rsca
pital
would
less
by a
pprox
imate
ly Œ
1.875
.089.
Moreo
ver,
the su
bsidi
aries
«PHA
RMAC
ARE
S.A»,
«P.G
IANNA
S S.A
» and
«SAN
ITAS-
SANI
TAS
S.A.»
in the
curre
nt fis
cal y
ear,
contr
ary t
o the
last,
effec
ted de
prec
iation
s on c
ertain
defin
ed ca
tegori
es of
asse
ts. A
ssum
ing de
prec
iation
was
effec
ted on
the to
tal of
asse
ts, ba
sed o
n the
facto
r und
er La
w 10
0/19
98, th
en th
ese w
ould
be gr
eater
by Π3
03.00
0, wi
th eq
ual in
amou
nt bu
rden
on Fi
scal
result
san
d own
ers ca
pital.
7)Fo
r bad
and o
bsole
te sto
ck of
the p
aren
t com
pany
and i
t’s su
bsidi
aries
«PHA
RMAC
ARE S
.A. »,
«LOB
ELIN
S.A.
», am
ounti
ng in
total
to Œ
1.650
.168,
no re
levan
t prov
ision
has
bee
n eff
ected
for a
ssum
ed lo
ss th
at co
uld re
sult
from
liquid
ation
there
of, a
nd w
ith re
lative
equa
l inam
ount
burd
en on
Fisc
al res
ults a
nd ow
ners
capit
al. 8)
On a
ccou
nt of
the to
tal of
owne
rs ca
pital
of the
subs
idiar
y «P.G
IANNA
S S.A»
being
less
er tha
nha
lf of
treas
ury s
tock,
then
there
is rea
son
for th
e ap
plica
tion
of ar
ticle
47 o
f Law
No.
2190
/192
0. 9)
Due
to th
e su
bsidi
aries
«P.G
IANNA
S S.A
»,«S
ANITA
S-SA
NITA
S S.A.
», «L
OBEL
IN S.
A.» an
d «Th
eodo
ridis
S.A.»
neve
r bein
g aud
ited b
y the
offic
ial ta
x auth
oritie
s for
the fis
cal y
ears
2001
and 2
002,
and t
he su
bsidi
ary «
PHAR
MACA
RE S
.A.» f
or the
fisca
l yea
r 200
2, the
ir tax
liabil
ities h
ave n
ot be
en fin
alise
d.
It is
our o
pinion
, and
afte
r our
obs
ervati
ons m
entio
ned
abov
e ar
e tak
en in
to ac
coun
t, the
cons
olida
ted fi
nanc
ial st
ateme
nts h
ave
been
cons
tituted
acco
rding
to or
dinan
ce of
Law
N.21
90/1
920
and
illustr
ates b
ased
on th
e rela
tive o
rdina
nce t
hat i
s in
force
, tog
ether
with
acco
untin
g prin
ciples
and
metho
ds a
pplie
d by
the
paren
t com
pany
, whic
h ar
e ge
nera
lly a
ccep
table
and
do n
ot dif
fer fr
om th
ose
appli
ed in
the
prev
ious
fisca
l yea
r, wi
th the
exce
ption
s of t
he ob
serva
tions
mad
e in
point
6. T
he a
sset
struc
ture,
finan
cial p
ositio
n, liq
uidity
, and
the r
esult
s of t
he co
mpan
y are
includ
ed in
the
31/1
2/20
02 co
nsoli
datio
n. At
hens
, May
12th,
2003
THE A
UDITO
RS –
CER
TIFIED
ACC
OUNT
ANTS
IOAN
NIS
B, K
ALOG
EROP
OULO
S RE
GIST
ER N
UMBE
R / S
OEL :
1074
1K
& V C
ERTIF
IED A
CCOU
NTAN
TS A
EEBA
KER
TILLY
INTE
RNAT
IONA
L
NOTE
S ON
THE å
GR. S
ARAN
TIS A
BEEå
CONS
OLID
ATED
BAL
ANCE
SHE
ET.1
:. Fo
r the
audit
ing of
the 3
1.12.2
002
cons
olida
ted ba
lance
shee
t, we
used
all t
he ac
cept
ed au
diting
proc
edur
es th
at w
ere fo
llowe
d in t
he co
nsoli
dated
balan
ce sh
eet o
f 31.1
2.200
1 2
. In t
he 1
2 mo
nth p
eriod
endin
g in 3
1.12.2
002,
Euro
6.489
.821,8
0 ha
ve be
eninv
ested
in fi
xed a
ssets
. 3. T
he fo
llowi
ng co
mpan
ies ha
ve be
en in
clude
d in t
he co
nsoli
dated
balan
ce sh
eet :
1) G
R. S
ARAN
TIS ∞
.µ.∂.
∂. 2)
PHA
RMAC
ARE
A.E.
3) P
. Gπ∞
¡¡∞™
∞.∂.
4) ∫
. TH∂
√DOR
πDIS
∞.∂.
5) S
ARAN
TIS B
ULGA
RIA
L.T.D
. 6) R
OMSA
R CO
SMET
ICS
S.A. 7
) SAN
ITAS
– S
ANITA
S A.
E. an
d its
affilia
te DO
MONA
TURA
A.E.
8)
LOBE
LIN A
.E. 9
) NET
WES
T SER
BIA
L.T.D
. 10)
NET
WES
T SKO
PJE
L.T.D
. 11)
PET
LEAD
ERS
A.E.
and i
ts aff
iliates
S. P
ARO™
∞.∂.
& G
RECO
VET E
.P.E.
12)
SAR
ANTIS
G.M
.B.H
. 13)
SAR
ANTIS
FRAN
CE S
.A. 1
4) S
ARAN
TIS U
.K. L
.T.D.
15)
SG
SARA
NTIS
GLO
BAL L
.T.D.
16)
PAC
K PL
AST S
.A. a
nd it
s affi
liates
LINC
O, S
ARAN
TIS P
OLAN
D, P
ACK
PLAS
T CZE
CH, 1
7) VE
NUS
S.A. a
nd it
s affi
liates
∑∂∆∞
∞.∂.
, ∑∂∆
∞ CO
SMET
ICS
L.T.D
., EL
CA S
.A.,
ESTE
E LA
UDER
HEL
LAS,
ESTE
E LA
UDER
BUL
GARI
A, E
STEE
LAUD
ER R
OMAN
IA, 1
8) B
RIAR
DALE
S.A
. and
19)
VENT
URES
A.E.
4. T
he nu
mber
of em
ploye
d pers
onne
l is 1
.568
5. La
st da
te of
fixed
asse
ts rev
aluat
ion is
31.1
2.200
0 6.
Acco
rding
to ar
ticle
2 pa
r 1 fo
resee
n in L
aw N
o. 29
92/2
002
defic
it fro
m th
e eva
luatio
n of S
ecur
ities o
f EUR
O 3.3
16.55
0 ha
ve be
en di
rectly
reall
ocat
ed to
redu
ction
of sa
me ca
pital
åres
erves
å. 7.
The a
nalys
is of
2002
sales
on a
per S
TAKO
D 91
categ
ory is
as fo
llows
:24
2.0 –
prod
uctio
n of p
estic
ides a
nd ag
roche
mica
ls EU
RO 6
6.285
,29, 2
45.1
–Pr
oduc
tion o
f soa
ps an
d dete
rgent
s, an
d oth
er cle
aning
and s
hoe p
olish
ing pr
oduc
ts 42
0.097
,6 EU
RO, 2
45.2
– pr
oduc
tion o
f fra
granc
es an
d pers
onal
care
prod
ucts
17.24
2.524
,66 E
URO
251.9
– pr
oduc
tion o
f oth
er ru
bber
prod
ucts
6.796
,42 E
URO
252.9
– pr
oduc
tion
of oth
er pla
stic i
tems 4
11.35
3,15
EURO
274
.2 –
prod
uctio
n of
alumi
nium
items
28.7
06.82
6,21
EURO
503
.0 –
trade
of ca
r par
ts an
d acc
esso
ries 1
0.474
.435,9
8 EU
RO 5
13.8
– wh
olesa
le tra
de of
othe
r foo
d item
s 10.2
90.29
3,03
EURO
514
.2 –
whole
sale
trade
of ho
siery
and c
lothin
g 88.0
50,88
EUR
O 51
4.5 –
who
lesale
trad
e of f
ragr
ance
s and
cosm
etics
92.3
85.32
9,4 E
URO
514.6
– w
holes
aletra
de of
phar
mace
utica
l prod
ucts
16.05
3.281
,07 E
URO
514.9
– w
holes
ale tr
ade o
f oth
er ho
useh
old pr
oduc
ts 43
.219.7
16,61
EUR
O.
I. Op
erat
ing re
sults
Net t
urno
ver (
sales
)21
9.362
.990,3
718
5.026
.119,2
0Le
ss:C
ost o
f sale
s10
9.024
.369,6
188
.544.1
16,12
----------
----------
Gros
s ope
ratin
g res
ults (
profi
t)11
0.338
.620,7
696
.482.0
03,08
Plus
:Oth
er op
erat
ing in
come
1.510
.067,5
35.5
87.76
4,65
----------
-----------
Tota
l11
1.848
.688,2
910
2.069
.767,7
3Le
ss:1
. Adm
inistr
ative
expe
nses
15.13
1.222
,9611
.557.7
12,13
3. Di
stribu
tion
costs
66.66
1.707
,2681
.792.9
30,22
62.94
1.458
,2374
.499.1
70,36
---------
---------
---------
---------
Sub
total
(pro
fit)
30.05
5.758
,0727
.570.5
97,37
Plus
1. Inc
ome f
rom
Parti
cipat
ing In
teres
ts0,0
090
0.889
,641·
. Inco
me fr
om Pa
rticipa
ting I
nteres
ts Aff
iliated
Com
panie
s2.2
84.46
8,30
1.313
.861,4
42.
Incom
e of
Othe
r Sec
uritie
s86
6.799
,651.9
79.59
2,43
3. Ga
ins fr
om S
ale of
Par
ticipa
ting I
nter
est
and
Othe
r Sec
uritie
s57
2.222
,3533
7.754
,054.
Cred
it Int
eres
t and
simi
lar C
harge
s27
4.337
,7735
1.841
,70---------
---------
3.997
.828,0
74.8
83.93
9,26
Less
1. Re
valua
tion
of Pa
rticip
ating
Inter
stan
d Se
curit
ies1.6
29.55
5,52
1.958
.720,8
82.
Expe
nces
from
othe
r Sec
uritie
s61
2.192
,162.2
04.61
8,22
3. De
bit In
teres
t and
Sim
ilar C
harge
s10
.417.8
72,41
12.65
9.620
,09-8
.661.7
92,02
9.944
.210,3
114
.107.5
49,41
-9.22
3.610
,15---------
---------
---------
---------
---------
---------
TOTA
L OPE
RATIN
G RE
SULT
S (P
ROFIT
)21
.393.9
66,05
18.34
6.987
,22PL
US: E
xtra O
rdina
ry re
sults
1. Ex
tra O
rdina
ry Inc
ome
883.6
59,84
695.4
62,74
2. Ex
tra O
rdina
ry Ga
ins36
.632,3
139
2.432
,313.
Prior
Year
s Exp
ence
s35
.213,0
663
.465,8
94.
Unus
ed P
rior Y
ears
Prov
ision
s28
3.600
,748.9
11,06
---------
---------
1.239
.105,9
51.1
60.27
2,00
Less
:1.
Extra
Ord
inary
Exp
ense
s3.5
54.96
7,21
2.108
.949,4
32.
Extra
Ord
inary
Loss
es36
8.359
,5368
1.717
,333.
Prior
Year
s Exp
ense
s19
0.189
,7222
3.672
,424.
Prov
ision
s for
Extr
a Or
dinar
y los
ses
404.5
23,18
4.518
.039,6
4-3
.278.9
33,69
50.81
2,54
3.065
.151,7
2-1
.904.8
79,71
---------
---------
---------
---------
---------
---------
Oper
ating
and
Extra
Ord
inary
Res
ults (
Profi
t)18
.115.0
32,36
16.44
2.107
,51Le
ss:T
otal D
epre
ciatio
n of
Fixed
Ass
ets3.8
96.69
8,84
3.946
.658,0
7Le
ss: D
eprec
iation
inclu
ded
in the
Ope
rating
Cos
t3.8
96.69
8,84
0,00
3.946
.658,0
70,0
0---------
---------
---------
---------
NET R
ESUL
TS (P
ROFI
T) B
EFOR
E TA
XES
18.11
5.032
,3616
.442.1
07,51
LESS
:Mino
rity R
ights
6.058
.483,8
33.6
58.14
1,98
---------
---------
GROU
P PR
OFIT
BEFO
RE TA
XES
12.05
6.548
,5312
.783.9
65,53
==
==
==
==
==
==
==
==
==
2002
2001
Aquis
ition
Value
Writt
en-d
own
Aquis
ition
Value
Writt
en-d
own
ASSE
TS20
0220
01
Maro
ussi,
Mar
ch 31
st, 20
03GR
. SAR
ANTIS
K. SA
RANT
ISK.
ROZA
KEAS
V.
MEIN
TANI
SCh
airma
n of
the B
oard
of D
irecto
rsMa
nagin
g Dire
ctor
Finan
ce D
irecto
rCh
ief A
ccou
ntan
t