Annals Supplementary material text only
11
Supplementary material Supplementary methods Micro‐CT Micro‐CT analyses were performed with a SCANCO Medical μCT 40 scanner using the following parameters: voltage, 40kV; X‐ray current, 250μA; exposure time, 5,000ms/projection for 720 projections; matrix, 1024×1024; voxel size in reconstructed image, 9μm. Images were analysed with SCANCO evaluation software for parameters at the metaphysis of the proximal tibiae: ratio of bone volume to total volume, trabecular number, and trabecular thickness. Immunodetection and apoptosis detection Briefly, 5μm thick sections of the joints were deparaffinised, post fixed in PFA and the antigen was retrieved by enzymatic digestion with 15mg/ml of pepsin in 0.02% HCl for 45’ at 37°C. The sections were then blocked in 20% foetal bovine serum. For WNT16 analysis, anti WNT16 antibody (BD‐Pharmingen), was diluted 1:200 in 20% FBS or isotype matched non‐immune IgG at the same concentration as negative control. After incubation with a biotinylated rabbit anti‐mouse IgG (Dako, 1:200), the sections were incubated with StreptABComplex/HRP (Dako). Liquid DAB Substrate Chromogen System (Dako) was used as peroxidase substrate for development. For Lubricin analysis, sections were incubated with a rabbit anti‐Lubricin polyclonal antibody (Abcam); for the detection of MMP‐ and Aggrecanase‐dependent aggrecan neoepitopes, the sections were respectively incubated with the mouse monoclonal Anti‐Aggrecan Antibody, MMP cleaved, against the N‐terminus FFGVG neoepitope (Novus Biologicals) (10μg/ml), and rabbit‐ polyclonal Anti‐Aggrecan Antibody, aggrecanase cleaved, against the NITEGE neoepitope (Novus Biologicals) (1μg/ml). Incubation with the primary antibodies was followed by incubation with Cy3‐ conjugated rabbit anti‐mouse and goat anti‐rabbit IgG secondary antibodies (Jackson ImmunoResearch). Mouse IgG1 (Sigma‐aldrich) and rabbit IgG (Abcam) were used at matching concentrations as negative controls. Nuclei were counterstained using DAPI.
Transcript of Annals Supplementary material text only
Supplementarymaterial
Supplementary methods
Micro‐CT
Micro‐CT analyses were performed with a SCANCO Medical μCT 40 scanner using the following
parameters: voltage, 40kV; X‐ray current, 250μA; exposure time, 5,000ms/projection for 720
projections; matrix, 1024×1024; voxel size in reconstructed image, 9μm. Images were analysed with
SCANCO evaluation software for parameters at the metaphysis of the proximal tibiae: ratio of bone
volume to total volume, trabecular number, and trabecular thickness.
Immunodetection and apoptosis detection
Briefly, 5µm thick sections of the joints were deparaffinised, post fixed in PFA and the antigen was
retrieved by enzymatic digestion with 15mg/ml of pepsin in 0.02% HCl for 45’ at 37°C. The sections
were then blocked in 20% foetal bovine serum.
For WNT16 analysis, anti WNT16 antibody (BD‐Pharmingen), was diluted 1:200 in 20% FBS or isotype
matched non‐immune IgG at the same concentration as negative control. After incubation with a
biotinylated rabbit anti‐mouse IgG (Dako, 1:200), the sections were incubated with
StreptABComplex/HRP (Dako). Liquid DAB Substrate Chromogen System (Dako) was used as
peroxidase substrate for development.
For Lubricin analysis, sections were incubated with a rabbit anti‐Lubricin polyclonal antibody
(Abcam); for the detection of MMP‐ and Aggrecanase‐dependent aggrecan neoepitopes, the
sections were respectively incubated with the mouse monoclonal Anti‐Aggrecan Antibody, MMP
cleaved, against the N‐terminus FFGVG neoepitope (Novus Biologicals) (10µg/ml), and rabbit‐
polyclonal Anti‐Aggrecan Antibody, aggrecanase cleaved, against the NITEGE neoepitope (Novus
Biologicals) (1µg/ml). Incubation with the primary antibodies was followed by incubation with Cy3‐
conjugated rabbit anti‐mouse and goat anti‐rabbit IgG secondary antibodies (Jackson
ImmunoResearch). Mouse IgG1 (Sigma‐aldrich) and rabbit IgG (Abcam) were used at matching
concentrations as negative controls. Nuclei were counterstained using DAPI.
Apoptosis was detected by terminal deoxynucleotidyl transferase dUTP nick end labelling (TUNEL)
assay (Roche) according to the manufacturer’s instruction.
Images were acquired at 22°C using an Olympus BX61 microscope with a fixed exposure using a
10x/0.4 objective lens. Images were optimised using Adobe Photoshop CS3 for better rendering
without altering any relationship between target and control images.
Quantification of lubricin staining was performed using ImageJ. Control sections stained using non‐
immune IgGs were used to set the threshold above which signal was considered positive and which
was applied to all images. Each articular cartilage compartment was then outlined using the manual
selection tool and the stained area for each compartment above the threshold was measured and
was normalised for the total selected area.
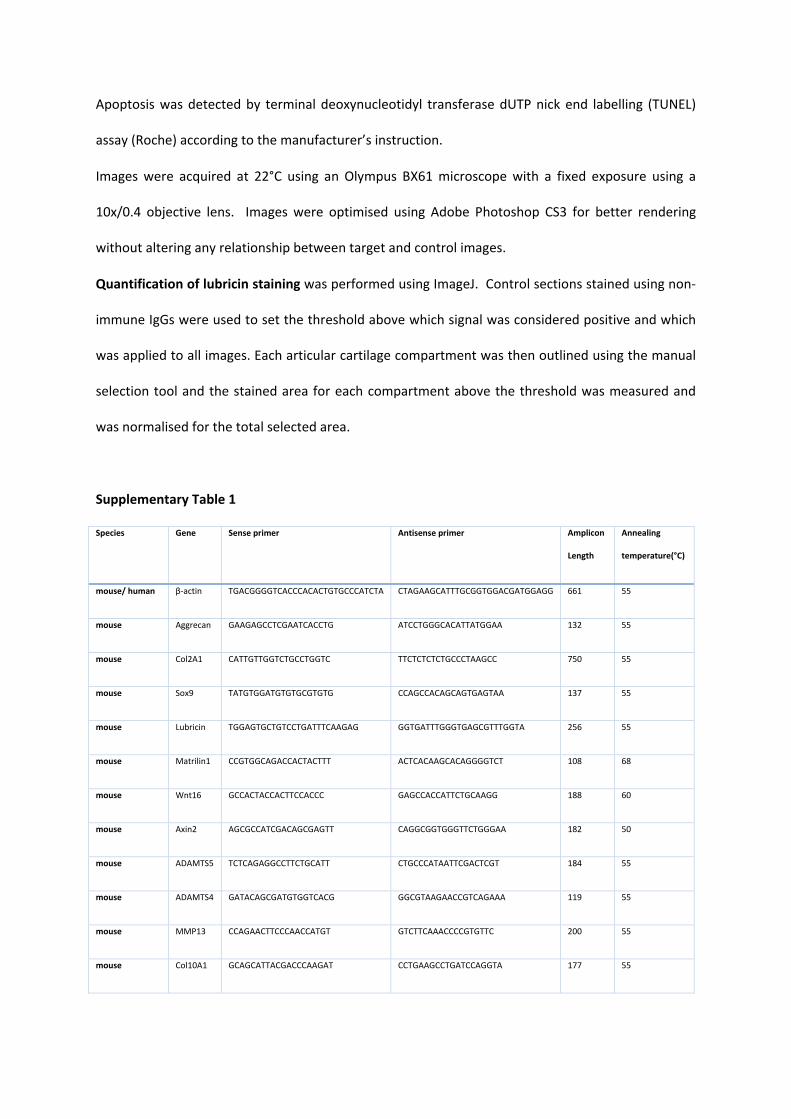
Supplementary Table 1
Species Gene Sense primer Antisense primer Amplicon
Length
Annealing
temperature(°C)
mouse/ human β‐actin TGACGGGGTCACCCACACTGTGCCCATCTA CTAGAAGCATTTGCGGTGGACGATGGAGG 661 55
mouse Aggrecan GAAGAGCCTCGAATCACCTG ATCCTGGGCACATTATGGAA 132 55
mouse Col2A1 CATTGTTGGTCTGCCTGGTC TTCTCTCTCTGCCCTAAGCC 750 55
mouse Sox9 TATGTGGATGTGTGCGTGTG CCAGCCACAGCAGTGAGTAA 137 55
mouse Lubricin TGGAGTGCTGTCCTGATTTCAAGAG GGTGATTTGGGTGAGCGTTTGGTA 256 55
mouse Matrilin1 CCGTGGCAGACCACTACTTT ACTCACAAGCACAGGGGTCT 108 68
mouse Wnt16 GCCACTACCACTTCCACCC GAGCCACCATTCTGCAAGG 188 60
mouse Axin2 AGCGCCATCGACAGCGAGTT CAGGCGGTGGGTTCTGGGAA 182 50
mouse ADAMTS5 TCTCAGAGGCCTTCTGCATT CTGCCCATAATTCGACTCGT 184 55
mouse ADAMTS4 GATACAGCGATGTGGTCACG GGCGTAAGAACCGTCAGAAA 119 55
mouse MMP13 CCAGAACTTCCCAACCATGT GTCTTCAAACCCCGTGTTC 200 55
mouse Col10A1 GCAGCATTACGACCCAAGAT CCTGAAGCCTGATCCAGGTA 177 55

mouse GDF5 CACAAACCACGCAGTCATTC TGTTGGCAGAGTCGATGAAG 122 55
human Lubricin TCACAGTTGTTATTGTTTACAGACC GGGTAAGTGAATACACTAGTTTTGA 152 60
human Axin2 TACCGGAGGATGCTGAAGGCC CCACTGGCCGATTCTTCCTT 345 55
bovine Lubricin GGAGATGTGGGGAAGGGTAA TCTGAGATGCTCCTGGAGGT 288 55
bovine Axin2 GAAATAGCGGTCCTGGTCCT GTCTTCCCAAAGCTGTCTGC 119 55
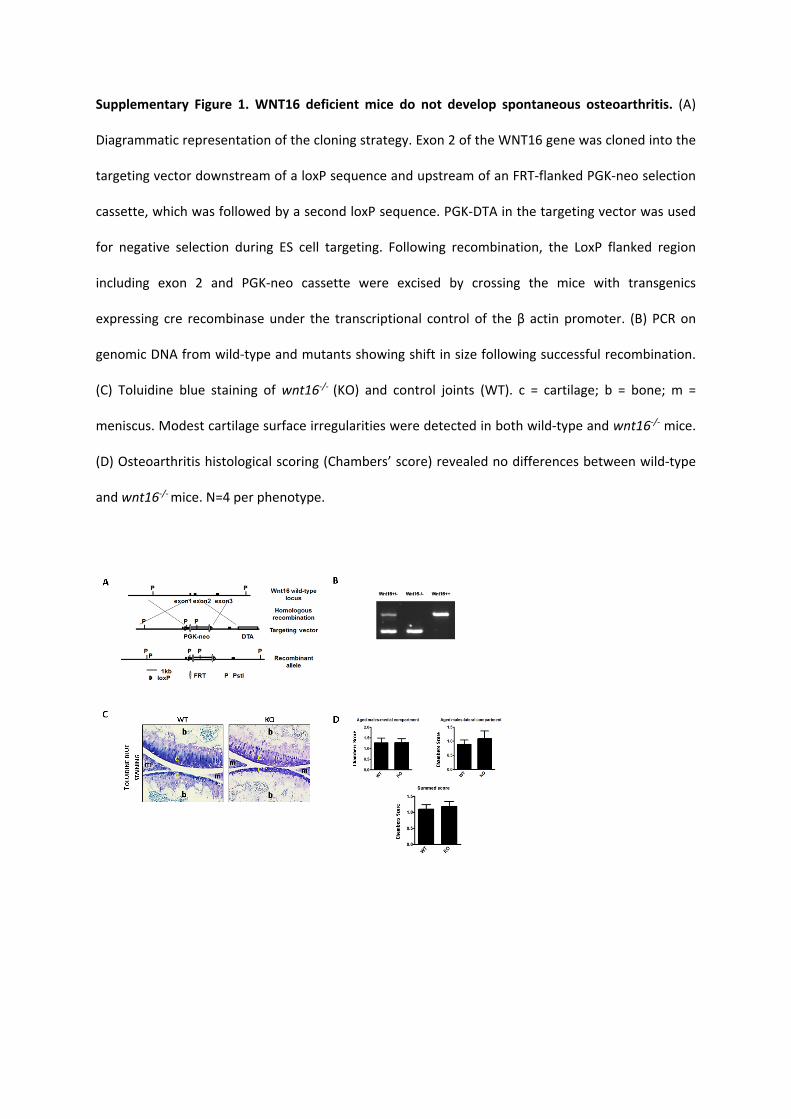
Supplementary Figure 1. WNT16 deficient mice do not develop spontaneous osteoarthritis. (A)
Diagrammatic representation of the cloning strategy. Exon 2 of the WNT16 gene was cloned into the
targeting vector downstream of a loxP sequence and upstream of an FRT‐flanked PGK‐neo selection
cassette, which was followed by a second loxP sequence. PGK‐DTA in the targeting vector was used
for negative selection during ES cell targeting. Following recombination, the LoxP flanked region
including exon 2 and PGK‐neo cassette were excised by crossing the mice with transgenics
expressing cre recombinase under the transcriptional control of the β actin promoter. (B) PCR on
genomic DNA from wild‐type and mutants showing shift in size following successful recombination.
(C) Toluidine blue staining of wnt16‐/‐ (KO) and control joints (WT). c = cartilage; b = bone; m =
meniscus. Modest cartilage surface irregularities were detected in both wild‐type and wnt16‐/‐ mice.
(D) Osteoarthritis histological scoring (Chambers’ score) revealed no differences between wild‐type
and wnt16‐/‐ mice. N=4 per phenotype.
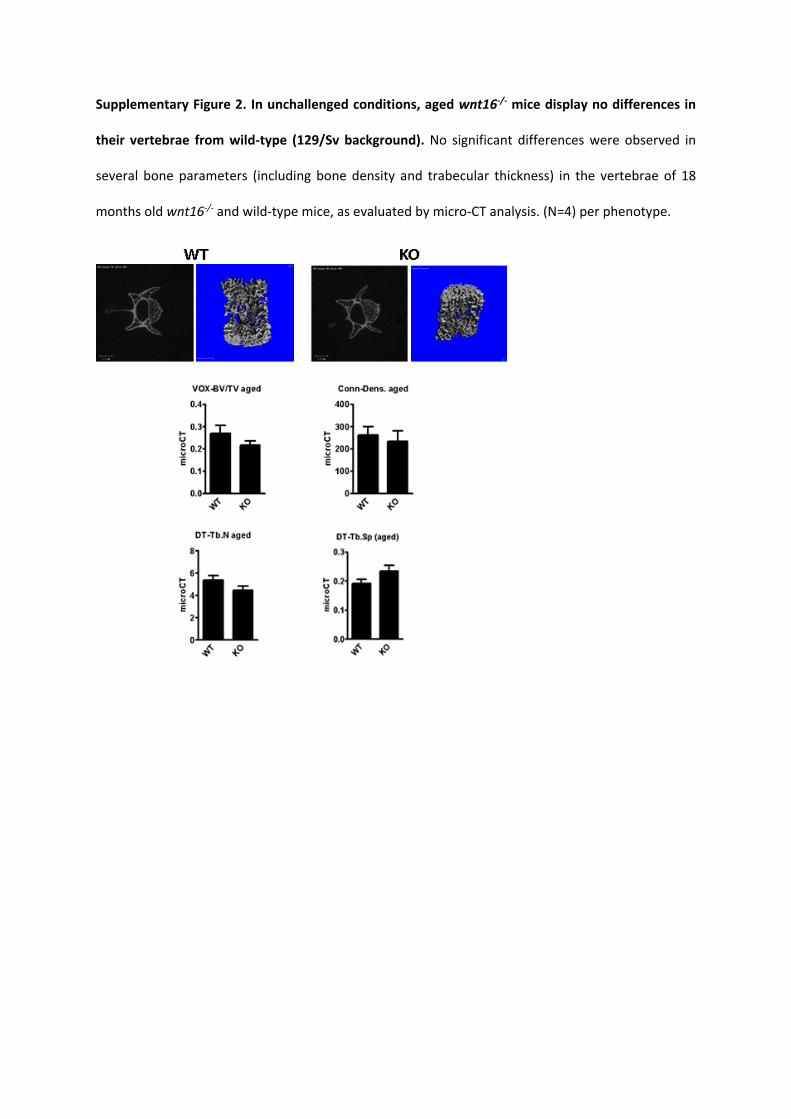
Supplementary Figure 2. In unchallenged conditions, aged wnt16‐/‐ mice display no differences in
their vertebrae from wild‐type (129/Sv background). No significant differences were observed in
several bone parameters (including bone density and trabecular thickness) in the vertebrae of 18
months old wnt16‐/‐ and wild‐type mice, as evaluated by micro‐CT analysis. (N=4) per phenotype.
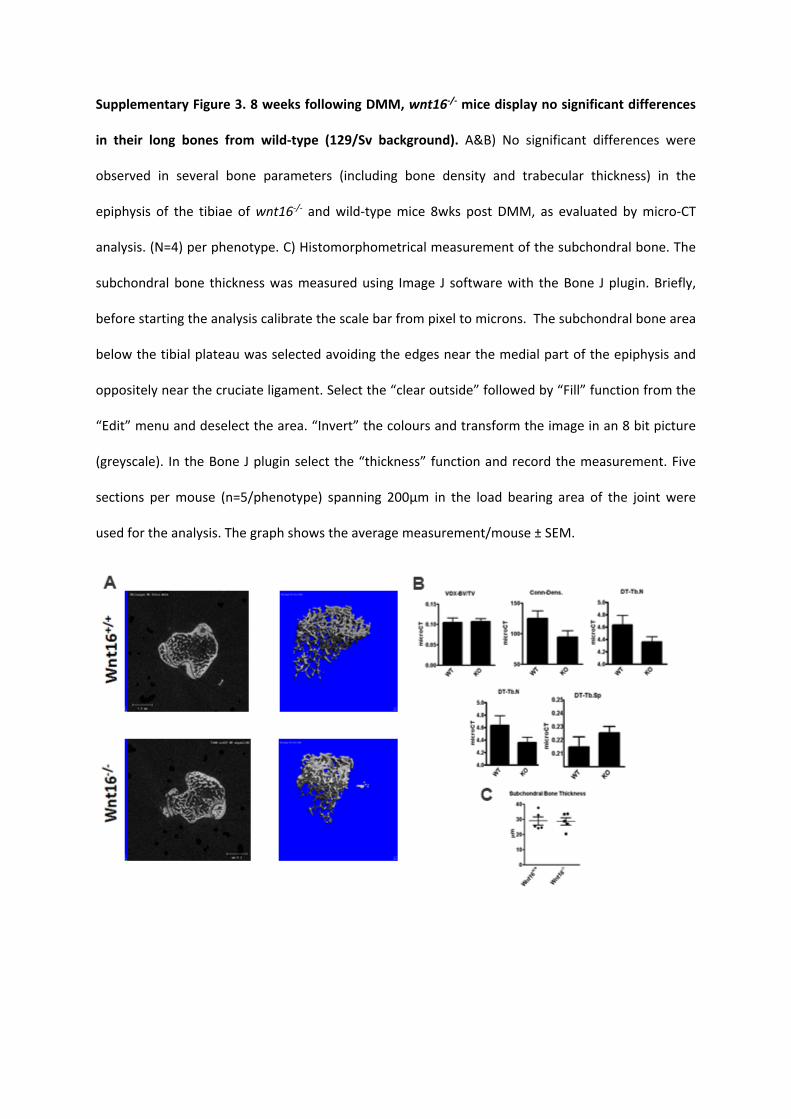
Supplementary Figure 3. 8 weeks following DMM, wnt16‐/‐ mice display no significant differences
in their long bones from wild‐type (129/Sv background). A&B) No significant differences were
observed in several bone parameters (including bone density and trabecular thickness) in the
epiphysis of the tibiae of wnt16‐/‐ and wild‐type mice 8wks post DMM, as evaluated by micro‐CT
analysis. (N=4) per phenotype. C) Histomorphometrical measurement of the subchondral bone. The
subchondral bone thickness was measured using Image J software with the Bone J plugin. Briefly,
before starting the analysis calibrate the scale bar from pixel to microns. The subchondral bone area
below the tibial plateau was selected avoiding the edges near the medial part of the epiphysis and
oppositely near the cruciate ligament. Select the “clear outside” followed by “Fill” function from the
“Edit” menu and deselect the area. “Invert” the colours and transform the image in an 8 bit picture
(greyscale). In the Bone J plugin select the “thickness” function and record the measurement. Five
sections per mouse (n=5/phenotype) spanning 200µm in the load bearing area of the joint were
used for the analysis. The graph shows the average measurement/mouse ± SEM.

Supplementary Figure 4. Procedure for histomorphometry. All stainings must be performed in one
single batch. All images must be taken on the same day using the same settings and exposure.
Discard sections with cutting or staining artefacts, and do not include knees with less than 3
sections. For optimum consistency there should be 4‐6 sections covering 200 microns around the
centre of the tibial plateau. The central section is identified as the one with the shortest cross‐
section of the medial meniscus. Digital images must be taken using identical parameters and turning
off all the auto‐enhancing features of the camera and of the acquisition program which, by
normalizing the total luminosity and contrast, or modifying the colours, might reduce the
differences and therefore lead to false‐negative results. Each image is opened in ImageJ. The tibial
plateau is segmented using a polygon or free‐hand tool (A). The region of interest is isolated using
Edit>Clear Outside (B) and rotated so that a line drawn along the cartilage‐bone junction in the
middle of the plateau is perfectly horizontal (C). This is very important so that the non‐cartilage
staining in the bone marrow spaces can be eliminated (see below). This is accomplished by drawing
a line using the line tool and noting the angle as doing so. This measurement will be used to rotate
the image. For each knee, all available images (at least 3 parallel images ~50 microns apart) are
placed on the same canvas, perfectly aligned horizontally so that all images from the same knee are
processed using the same region of interest (D). To isolate the Safranin O metachromatic staining
from the background and most of the orthochromatic staining (bone) transform the RGB image in
HSB stack (Image>Type>HSB Stack) and press right arrow until selecting the “Saturation” slice. This
will abolish background and staining of the bone (E). Setting the region of interest (E): draw a
rectangle to include the tibial plateau, making sure to exclude any osteophyte (left side in this figure)
and the “bulgy” part near the intercondylar notch. Osteophytes are best identified in the original
figure rather than in the “saturation” slice. Press Ctrl+1. Slide the rectangle laterally over the next
section and press Ctrl+2 and, when over the last section, press Ctrl+3. This will show the density
profile of each section (F). The first negative peak is the articular cartilage. Draw one horizontal line
to cut the residual background, if any, and lateral lines to limit the articular cartilage peak (G) and
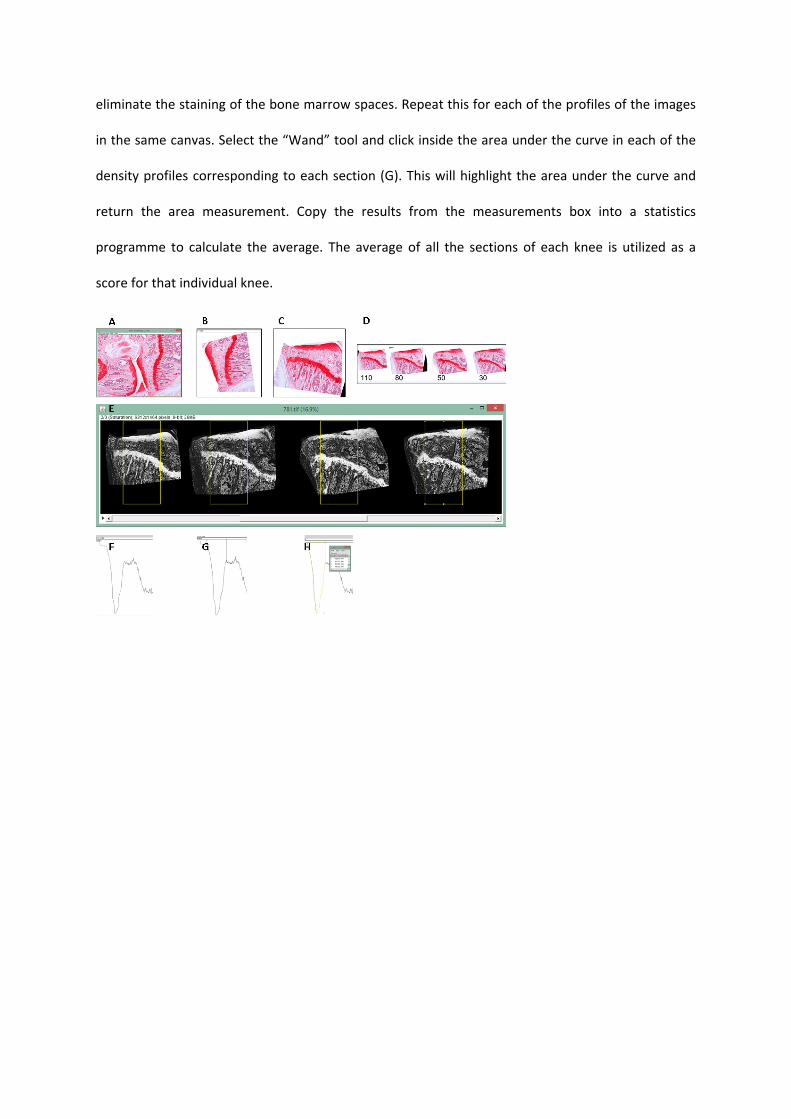
eliminate the staining of the bone marrow spaces. Repeat this for each of the profiles of the images
in the same canvas. Select the “Wand” tool and click inside the area under the curve in each of the
density profiles corresponding to each section (G). This will highlight the area under the curve and
return the area measurement. Copy the results from the measurements box into a statistics
programme to calculate the average. The average of all the sections of each knee is utilized as a
score for that individual knee.
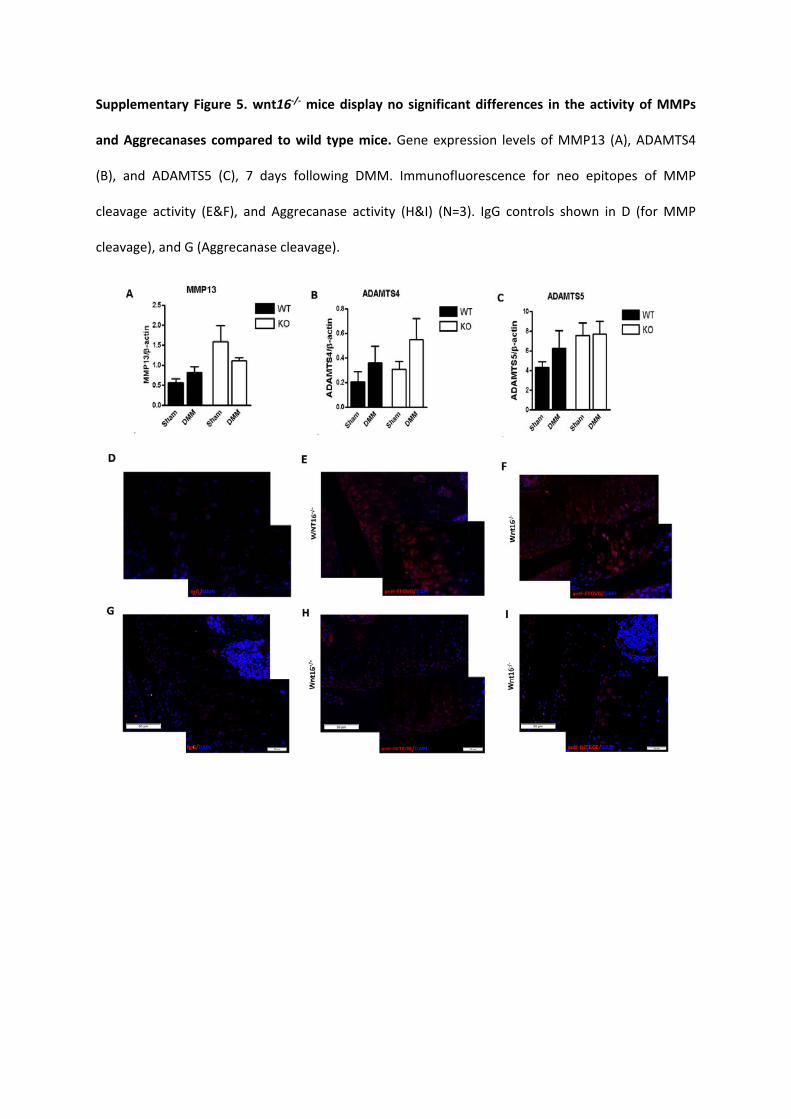
Supplementary Figure 5. wnt16‐/‐ mice display no significant differences in the activity of MMPs
and Aggrecanases compared to wild type mice. Gene expression levels of MMP13 (A), ADAMTS4
(B), and ADAMTS5 (C), 7 days following DMM. Immunofluorescence for neo epitopes of MMP
cleavage activity (E&F), and Aggrecanase activity (H&I) (N=3). IgG controls shown in D (for MMP
cleavage), and G (Aggrecanase cleavage).
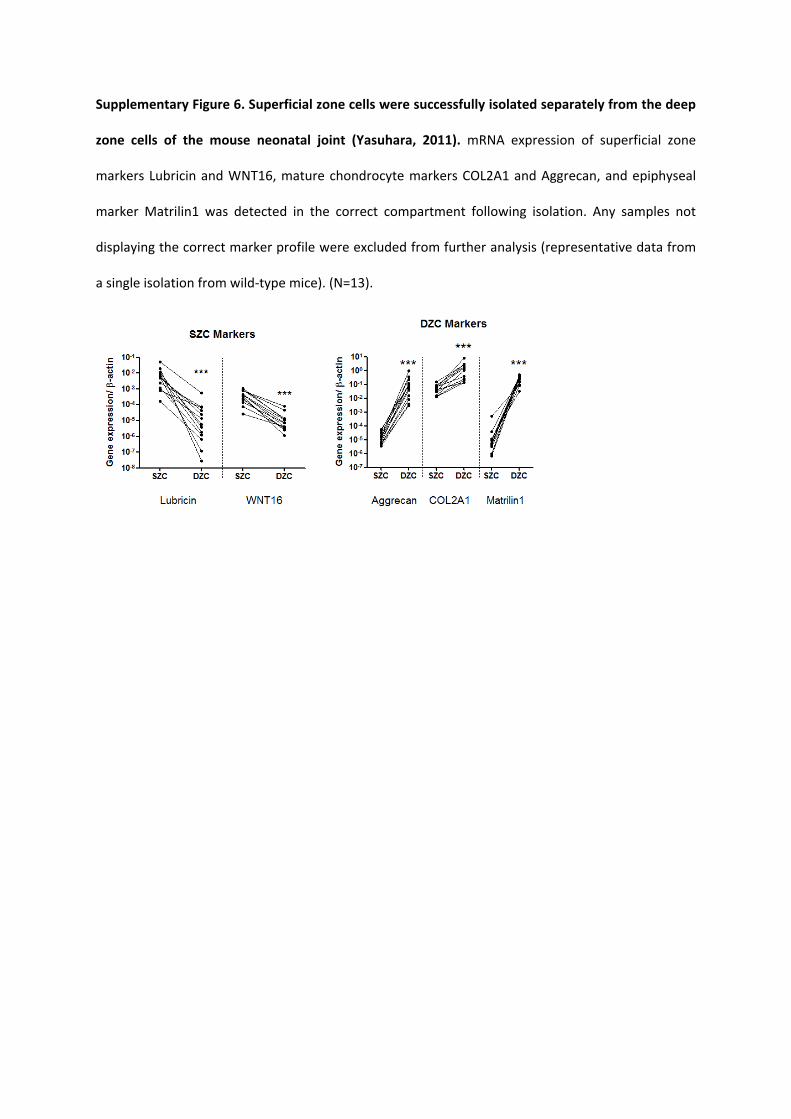
Supplementary Figure 6. Superficial zone cells were successfully isolated separately from the deep
zone cells of the mouse neonatal joint (Yasuhara, 2011). mRNA expression of superficial zone
markers Lubricin and WNT16, mature chondrocyte markers COL2A1 and Aggrecan, and epiphyseal
marker Matrilin1 was detected in the correct compartment following isolation. Any samples not
displaying the correct marker profile were excluded from further analysis (representative data from
a single isolation from wild‐type mice). (N=13).
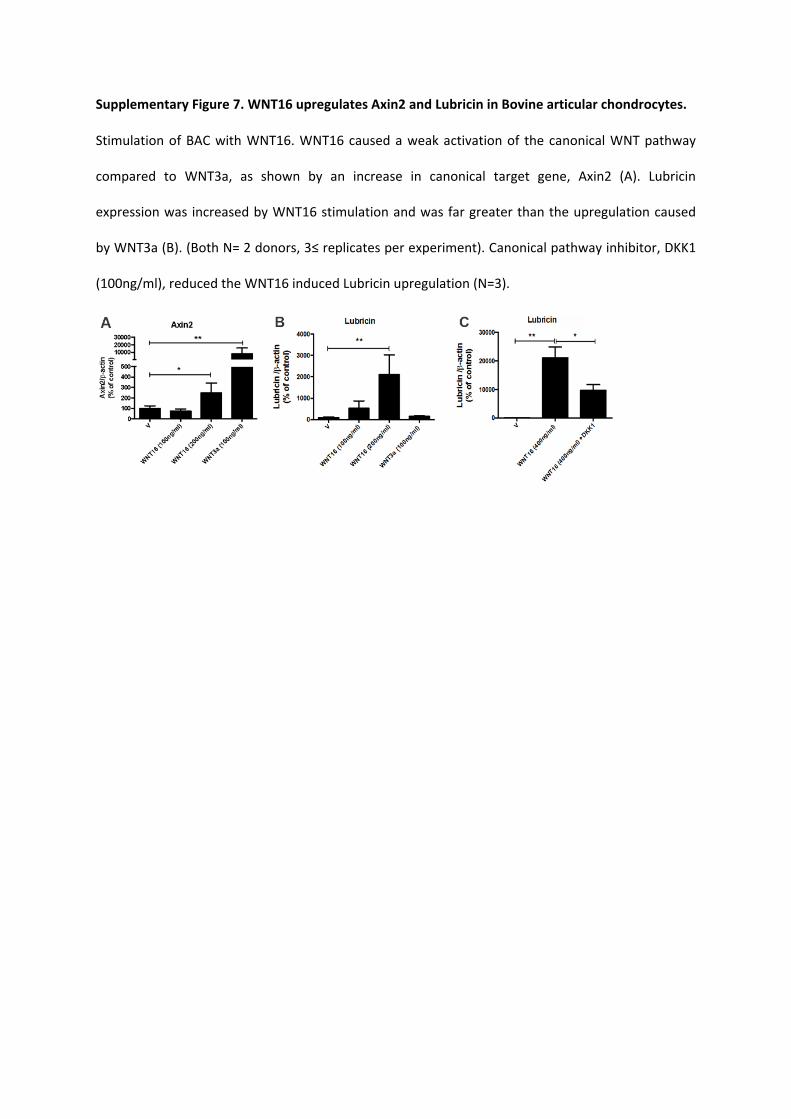
Supplementary Figure 7. WNT16 upregulates Axin2 and Lubricin in Bovine articular chondrocytes.
Stimulation of BAC with WNT16. WNT16 caused a weak activation of the canonical WNT pathway
compared to WNT3a, as shown by an increase in canonical target gene, Axin2 (A). Lubricin
expression was increased by WNT16 stimulation and was far greater than the upregulation caused
by WNT3a (B). (Both N= 2 donors, 3≤ replicates per experiment). Canonical pathway inhibitor, DKK1
(100ng/ml), reduced the WNT16 induced Lubricin upregulation (N=3).