Anisotropic Network Model: Systematic Evaluation and a New ...€¦opment of the Gaussian Network...
8
= ij ij ij ij ij ij ij ij ij ij ij ij ij ij ij ij ij ij 2 0 Z Z Y Z X Z Z Y Y Y X Y Z X Y X X X ) (R ij ij ij H = i j j ij ii | H H ) tr( ) tr( ) tr( C j i 1 jj 1 ii 1 ij ij = > • < H H H R R 2 | ) R (R ) ( 2 V 0 ij ij i j j ij = T i N i i i u u H 1 = = 6 3 1 1 Anisotropic Network Model: Systematic Evaluation and a New Web Interface Eran Eyal, Lee-Wei Yang and Ivet Bahar * Department of Computational Biology, School of Medicine, University of Pittsburgh, PA 15213, USA ABSTRACT Motivation: The Anisotropic Network Model (ANM) is a sim- ple yet powerful model for Normal Mode Analysis of proteins. Despite its broad use for exploring biomolecular collective mo- tions, ANM has not been systematically evaluated to date. A lack of a convenient interface has been an additional obstacle for easy usage. Results: ANM has been evaluated on a large set of proteins to establish the optimal model parameters that achieve the highest correlation with experimental data and its limits of accuracy and applicability. Residue fluctuations in globular proteins are shown to be more accurately predicted than those in non- globular proteins, and core residues are more accurately de- scribed than solvent-exposed ones. Significant improvement in agreement with experiments is observed with increase in the resolution of the examined structure. A new server for ANM calculations is presented, which offers flexible options for con- trolling model parameters and output formats, interactive anima- tion of collective modes and advanced graphical features. Availability: ANM server: http://www.ccbb.pitt.edu/anm Contact: [email protected] 1 INTRODUCTION 1.1 The Anisotropic Network Model (ANM) Recent years have seen a renewed interest on normal mode analysis (NMA) of equilibrium structures, with the realization of the potential utility of elastic network (EN) models for deriving functional motions from structure (Cui and Bahar, 2006; Nicholay and Sanejouand, 2006). The ANM is an EN introduced in 2000 (Atilgan et al., 2001; Doruker et al., 2000), inspired by the pioneering work of Tirion (1996), succeeded by the devel- opment of the Gaussian Network model (GNM) (Bahar et al., 1997; Haliloglu et al., 1997), and by the work of Hinsen (1998) who first demonstrated the validity of performing EN NMA at residue level. The main advantage of NMA and particularly EN models over traditional methods such as molecular dynamics is the fast computaiotional time and the ability to predict large scale fluctuations or the so-called global modes resulting from the collective participation of entire domains or substructures. In the ANM, a uniform force constant is adopted for all springs; nodes are identified by the positions of C atoms, and the overall potential of the system is a sum of harmonic potentials: (1) where is uniform spring constant; R ij and Rij 0 are the respective instantaneous and equilibrium distances between nodes i and j, ij is ij th element of the Kirchhoff matrix of inter-residue con- tacts (Bahar et al , 1997), equal to 1 if nodes i and j are within an *To whom correspondence should be addressed interaction cutoff distance r c , zero otherwise. provides a com- plete description of inter-residue contact topology in the folded state. The Hessian matrix H for a network of N nodes is a 3N x 3N matrix composed of N x N super elements, H ij (i j) of the form: (2) found from the 2 nd derivatives of V with respect to residue posi- tions. Here X ij , Y ij , and Z ij are the components of the distance vector R 0 ij. The diagonal super-elements of H are 3 x 3 subma- trices (3) Information regarding the mean-square fluctuations of indi- vidual residues and correlations between their fluctuations are conveyed by the 3Nx3N covariance matrix C of the multivariate Gaussian distribution. The covariance matrix is proportional to the inverse of H. H is not, however, invertible, by definition (eq 3). A pseudo-inverse is constructed instead, based on its 3N-6 non-zero eigenvalues i and corresponding eigenvectors u i as (4) The inverse H -1 is also organized in N x N submatrices of size 3x3, each. The ij th submatrix H -1 ij defines the covariance be- tween the fluctuations of residues i and j. The cross-correlation <R i R j > between the equilibrium fluctuations of residues i and j is expressed in terms of the trace (tr) of these submatrices as (5) Despite their simplicity, coarse-grained NMA with ANMs proved in many applications to be a promising tool for describ- ing the collective dynamics of a wide range of biomolecular systems (Cui & Bahar, 2006; Bahar & Rader, 2005; Chennub- hotla et al., 2005). Recent notable applications include the stud- ies of hemoglobin (Chunyan et al., 2003), influenza virus he- magglutinin A (Isin et al., 2002), tubulin (Keskin et al., 2002), HIV-1 reverse transcriptase complexed with different inhibitors (Temiz and Bahar, 2002), HIV-1 protease (Micheletti et al., 2004; Vincenzo et al., 2006), DNA-polymerase (Delarue and Sanejouand, 2002), motor proteins (Zheng and Brooks, 2005; Zheng and Brooks, 2005; Zheng and Doniach, 2003), membrane Ó 2006 The Author(s) This is an Open Access article distributed under the terms of the Creative Commons Attribution Non-Commercial License (http://creativecommons.org/licenses/ by-nc/2.0/uk/) which permits unrestricted non-commercial use, distribution, and reproduction in any medium, provided the original work is properly cited. Associate Editor: Anna Tramontano Bioinformatics Advance Access published August 23, 2006
Transcript of Anisotropic Network Model: Systematic Evaluation and a New ...€¦opment of the Gaussian Network...
Γ
=
ijijijijijij
ijijijijijij
ijijijijijij
20
Z ZY ZXZ
ZYYYXY
ZXYXXX
)(R ij
ijij
γH
∑≠
−=ijj
ijii|
HH
)tr()tr(
)tr(C ji 1
jj1
ii
1ij
ij −−
−
=>∆•∆≡<HH
HRR
2
|
)R(R)(2γV 0ijij
ijjij −Γ= ∑
≠
Ti
N
ii
i
uuH 1 ∑−
=
− =63
1
1
λ
Anisotropic Network Model: Systematic Evaluation and a New Web InterfaceEran Eyal, Lee-Wei Yang and Ivet Bahar*
Department of Computational Biology, School of Medicine, University of Pittsburgh, PA 15213, USA
ABSTRACTMotivation: The Anisotropic Network Model (ANM) is a sim-ple yet powerful model for Normal Mode Analysis of proteins. Despite its broad use for exploring biomolecular collective mo-tions, ANM has not been systematically evaluated to date. A lack of a convenient interface has been an additional obstacle for easy usage.Results: ANM has been evaluated on a large set of proteins to establish the optimal model parameters that achieve the highest correlation with experimental data and its limits of accuracy and applicability. Residue fluctuations in globular proteins are shown to be more accurately predicted than those in non-globular proteins, and core residues are more accurately de-scribed than solvent-exposed ones. Significant improvement in agreement with experiments is observed with increase in the resolution of the examined structure. A new server for ANM calculations is presented, which offers flexible options for con-trolling model parameters and output formats, interactive anima-tion of collective modes and advanced graphical features.Availability: ANM server: http://www.ccbb.pitt.edu/anmContact: [email protected]
1 INTRODUCTION
1.1 The Anisotropic Network Model (ANM)Recent years have seen a renewed interest on normal mode
analysis (NMA) of equilibrium structures, with the realization of the potential utility of elastic network (EN) models for deriving functional motions from structure (Cui and Bahar, 2006; Nicholay and Sanejouand, 2006). The ANM is an EN introduced in 2000 (Atilgan et al., 2001; Doruker et al., 2000), inspired by the pioneering work of Tirion (1996), succeeded by the devel-opment of the Gaussian Network model (GNM) (Bahar et al., 1997; Haliloglu et al., 1997), and by the work of Hinsen (1998)who first demonstrated the validity of performing EN NMA atresidue level. The main advantage of NMA and particularly EN models over traditional methods such as molecular dynamics is the fast computaiotional time and the ability to predict large scale fluctuations or the so-called global modes resulting from the collective participation of entire domains or substructures. In the ANM, a uniform force constant γ is adopted for all springs; nodes are identified by the positions of Cα atoms, and the overall potential of the system is a sum of harmonic potentials:
(1)where γ is uniform spring constant; Rij and Rij
0 are the respectiveinstantaneous and equilibrium distances between nodes i and j, Γij is ijth element of the Kirchhoff matrix Γ of inter-residue con-tacts (Bahar et al , 1997), equal to 1 if nodes i and j are within an
*To whom correspondence should be addressed
interaction cutoff distance rc, zero otherwise. Γ provides a com-plete description of inter-residue contact topology in the folded state. The Hessian matrix H for a network of N nodes is a 3N x3N matrix composed of N x N super elements, Hij (i ≠ j) of the form:
(2)
found from the 2nd derivatives of V with respect to residue posi-tions. Here Xij, Yij, and Zij are the components of the distance vector R0
ij. The diagonal super-elements of H are 3 x 3 subma-trices
(3)
Information regarding the mean-square fluctuations of indi-vidual residues and correlations between their fluctuations are conveyed by the 3Nx3N covariance matrix C of the multivariate Gaussian distribution. The covariance matrix is proportional tothe inverse of H. H is not, however, invertible, by definition (eq 3). A pseudo-inverse is constructed instead, based on its 3N-6 non-zero eigenvalues λi and corresponding eigenvectors ui as
(4)
The inverse H-1 is also organized in N x N submatrices of size 3x3, each. The ijth submatrix H-1
ij defines the covariance be-tween the fluctuations of residues i and j. The cross-correlation <∆Ri ● ∆Rj > between the equilibrium fluctuations of residues iand j is expressed in terms of the trace (tr) of these submatrices as
(5)
Despite their simplicity, coarse-grained NMA with ANMs proved in many applications to be a promising tool for describ-ing the collective dynamics of a wide range of biomolecular systems (Cui & Bahar, 2006; Bahar & Rader, 2005; Chennub-hotla et al., 2005). Recent notable applications include the stud-ies of hemoglobin (Chunyan et al., 2003), influenza virus he-magglutinin A (Isin et al., 2002), tubulin (Keskin et al., 2002), HIV-1 reverse transcriptase complexed with different inhibitors(Temiz and Bahar, 2002), HIV-1 protease (Micheletti et al., 2004; Vincenzo et al., 2006), DNA-polymerase (Delarue and Sanejouand, 2002), motor proteins (Zheng and Brooks, 2005; Zheng and Brooks, 2005; Zheng and Doniach, 2003), membrane
� 2006 The Author(s)This is an Open Access article distributed under the terms of the Creative Commons Attribution Non-Commercial License (http://creativecommons.org/licenses/by-nc/2.0/uk/) which permits unrestricted non-commercial use, distribution, and reproduction in any medium, provided the original work is properly cited.
Associate Editor: Anna Tramontano
Bioinformatics Advance Access published August 23, 2006
E. Eyal et al.
2
proteins including potassium channels (Shrivastava and Bahar, 2006), rhodopsin (Rader et al., 2004), nicotinic acetylcholine receptor (Hung et al., 2005; Taly et al., 2005) and mechanosen-sitive channel MscL (Valadie et al., 2003), or supramolecular structures such as the ribosomal complex (Tama et al., 2003; Wang et al., 2004) or viral capsids (Rader et al., 2005; Tama and Brooks, 2005). Other coarse-grained EN models were also introduced and successfully used in NMA: some group atoms or residues into rigid blocks (e.g. rigidly rotating/ translating blocks (RTB) method ((Durand et al., 1994; Tama et al., 2000);(Hinsen, 1998; Li and Cui, 2002; Tama et al., 2000), oth-ers take account of the positions of β-carbons in addition to α-carbons (Micheletti et al., 2004)). A distance-dependent form has been introduced by Hinsen (1998) for inter-residue force constants, the extensive use of which by Gerstein and coworkers (Alexandrov et al., 2005; Krebs et al., 2002) has provided evi-dence for the correlation between the predicted (by coarse-grained NMA) and observed (from experiments) structural tran-sitions. In the current study we examine on a database scale the performance of ANM as a function of its parameters, and pro-vide an assessment of the accuracy of prediction for different residue types and secondary structures.
1.2 Implementation of ANM serverImplementation of user friendly programs and web inter-
faces is of crucial importance to the adequate usage and applica-tion of computational models, especially by non-expert users. It is not trivial to take output data from NMA, usually in a form of a set of eigenvectors and eigenvalues, and to gain an understand-ing of the dynamics of the system. A number of web servershave indeed been implemented to permit automated NMA of biomolecules.
At atomic level, the Vibrations Evaluation Server (MoV-iES; http://ang.cz3.nus.edu.sg/cgi-bin/prog/norm.pl; (Cao et al., 2004) offers a detailed NMA. The calculations may, however,be slow and the results are sent by email. The users can obtaininformation on the free energy, kinetic and potential energies ofindividual residues, along with the frequencies and shapes ofeach mode. No graphical interface exists to assist in the analysis of the results.
NOMAD-REF is a new server for atomic NMA (Lindahl et al., 2006). Coordinate files can be saved and later viewed by other applications. Graphs of atomic fluctuations in different modes are accessible. The major strength of this site is the im-plementation of the NMA methodology as a tool for timely tasks in structural biology including refinement and optimization of docked complexes. The server can calculates the overlap of the eigenvectors and eigenvalues describing the dynamics of two different conformations.
The ProMod database (Wako et al., 2004) offers results from NMA for a fairly large collection of proteins (1,900 of them). In contrast to other servers that use Cartesian coordinates,the motions are derived in the space of dihedral angles, subject to fixed bond lengths and bond angles, which permits to reduce the number of degrees of freedom, while retaining backbone atomic structural data. Results are animated using Chime plug-in. Other graphical options for analyzing the fluctuations are available.
A server that performs NMA at residue level is WEBnm@(http://www.bioinfo.no/tools/normalmodes; (Hollup et al., 2005). WEBnm@ calculates the slowest six nonzero mode shapes
and associated deformation energies using the MMTK package(Hinsen, 2000). The visualization includes gif animated movies.AD-ENM (http://enm.lobos.nih.gov), additional simplified ENM tool, allows for calculation of up to 20 modes and permits tocalculate the contribution of each mode to the conformational change between two given structures.
ElNémo (http://igs-server.cnrs-mrs.fr/elnemo/index.html; (Suhre and Sanejouand, 2004) is another server that performsresidue level calculations. A methodology similar to ANM is adopted therein, with the major difference being the use of theRTB model. This approximation allows for analyzing relatively large proteins, although the calculations may still take up to several hours. Outputs include mean-square fluctuations, cross-correlations, degree of collectivity and an option to derive the normal modes responsible for the conformational changes be-tween known structures.
Finally, within the frame of the DB of macromolecular movements (MolMovDB; http://molmovdb.org/(Alexandrov, et al., 2005) which also uses the MMTK package (Hinsen, 2000), up to five slowest mode shapes are presented as static or ani-mated gif files and as snapshots of coordinates.
Despite the large number of online tools for NMA, the graphical options to visualize the results - the most important feature for many users, has been lacking. Most of the above listed servers offer only animated gif formats, typically very limited in resolution and smoothness of motions. The user can-not freely rotate, translate or zoom the molecule and is unable tovary the size and frequency of vibrations for visualization pur-poses. Some of the servers such as WEBnm@ and NOMAD-REFprovide the option to download files that can be interactively visualized in other applications, VMD (Humphrey et al., 1996)and PyMol (DeLano) respectively. This, however, is feasible only for one mode at a time, and requires other applications to be installed and knowledge to utilize them. ProMod offers inter-active online animation based on Chime, but this is availableonly for a limited number of structures in the DB and without the options to control the model parameters.
We have recently developed (Yang et al., 2005) a database for analyzing protein dynamics, based on the Gaussian network model (GNM;(Bahar et al., 1997), which includes GNM resultsfor all PDB structures (http://ignm.ccbb.pitt.edu/; Yang et al.,2005), as well as an on-line computation server, oGNM (Yang et al., 2006) for analyzing structural models submitted in PDB format. Both tools allow for graphical analysis of the size offluctuations and their cross-correlations. The mean-square fluc-tuations of residues and their mobilities in different modes can be color-mapped onto ribbon diagrams using either Chime or Jmol (http://jmol.sourceforge.net/). No movies are provided, inasmuch as GNM does not convey information on the direc-tions of fluctuations, but their size.
In this study we present a large scale evaluation of the per-formance of ANM in different systems and within different environments (solvent exposure, secondary structures, amino acids). We examine different interaction cutoffs and investigate the dependence of the spring constant on the interaction dis-tance. Having established the optimal model parameters and the limits of accuracy for different systems, we present a new server developed for ANM calculations, the main strengths of which are the rapid computing ability and the user-friendly graphical capabilities for analyzing and interpreting the outputs.
Anisotropic Network Model: Systematic Evaluation and a New Web Interface
3
)tr(γ3
Tk8B 1
2ANMi
−= iiB H
π
2 METHODS
2.1 Dataset for statistical analysisThe test set of proteins was extracted from the January 2006
version of the PDB (Berman et al., 2000) using PDB-REPRDB(Noguchi and Akiyama, 2003), to include all crystal structureswith resolution better than 2.5 Å, R-factor smaller than 0.3 Å and no missing coordinates. Redundancy filters were applied atboth sequence level (each protein in the final set shares less than 15% identity with all others) and structural level (structuresdiffer by at least 15 Å root-mean-square deviation in their back-bone coordinates). The list was further filtered to ensure that proteins crystallized as monomer, are indeed the functional unit based on the biological unit data reported in the PDB. The final set includes 176 proteins, the PDB codes of which are listed inhttp://ignmtest.ccbb.pitt.edu/anmdocs/anm_test_set.txt.
2.2 Solvent accessibility, globularity and assignment of secondary structures
Solvent accessibilities were calculated using the Voronoi polyhedra procedure (McConkey et al., 2002). The accessibility of residue X is defined as the ratio of its total solvent-accessible surface in the native structure to that in the peptide GGXGG with the same backbone conformation.
As a quantitative measure of the protein shape, we define aglobularity index as the fraction of residues with solvent acces-sibility smaller than 0.16. This threshold is the median value for accessibility in globular proteins. Finally, secondary structures are assigned using DSSP (Kabsch and Sander, 1983).
2.3 Evaluation of the modelThe ANM is evaluated by comparing the experimental fluc-
tuation (B-factors) reported in the PDB file to ANM predictions
(6)
where kB is the Boltzmann constant and T is the Kelvin tempera-ture. This is a standard way to evaluate ANM predictions. It should be noted that we resort to this comparison because avail-able X-ray structures in the PDB usually contain B-factors data that may be readily compared with ANM predictions. The major utility of ANM calculations, or NMAs with EN models in gen-eral, is not, however, to compute the mean-square fluctuations of amino acids, which can be obtained from experiments (or com-puted by simpler methods such as the GNM). Instead, the most useful feature of present calculations is to predict the most coop-erative and functional directions of motions (usually driven by the low frequency modes). These are not necessarily observed by direct measurements but require comparisons of two or more PDB structures if available, as performed in previous studiescoarse-grained NMAs (Cui & Bahar, 2006; Krebs et al., 2002). We anticipate the ANM server to facilitate such analyses and provide insights in the absence of experimental data.
We applied two measures to compare theoretical and ex-perimental fluctuations data. For evaluation of entire structures’ dynamics we used the correlation coefficient between the two sets of data. In this case there is no need to know the value of the spring constant γ. For integrating data from different proteins,we resorted to mean (absolute) differences between experimen-tal and scaled theoretical values. In this case the value of the per-protein spring constant γ is required and deduced from the ratio
between the observed and the theoretical values of all residues in the protein. The goal while using this measure was to compare predictions under different conditions and not to perform an objective evaluation.
3 RESULTS
3.1 Model evaluationThe ANM was evaluated by comparing the fluctuations pre-
dicted from theory and those experimentally observed (B-factorsdeposited in the PDB). All proteins tested are monomers accord-ing to their crystal arrangements and have all coordinates re-solved by X-ray crystallography. Details regarding the protein set can be found in the Methods.
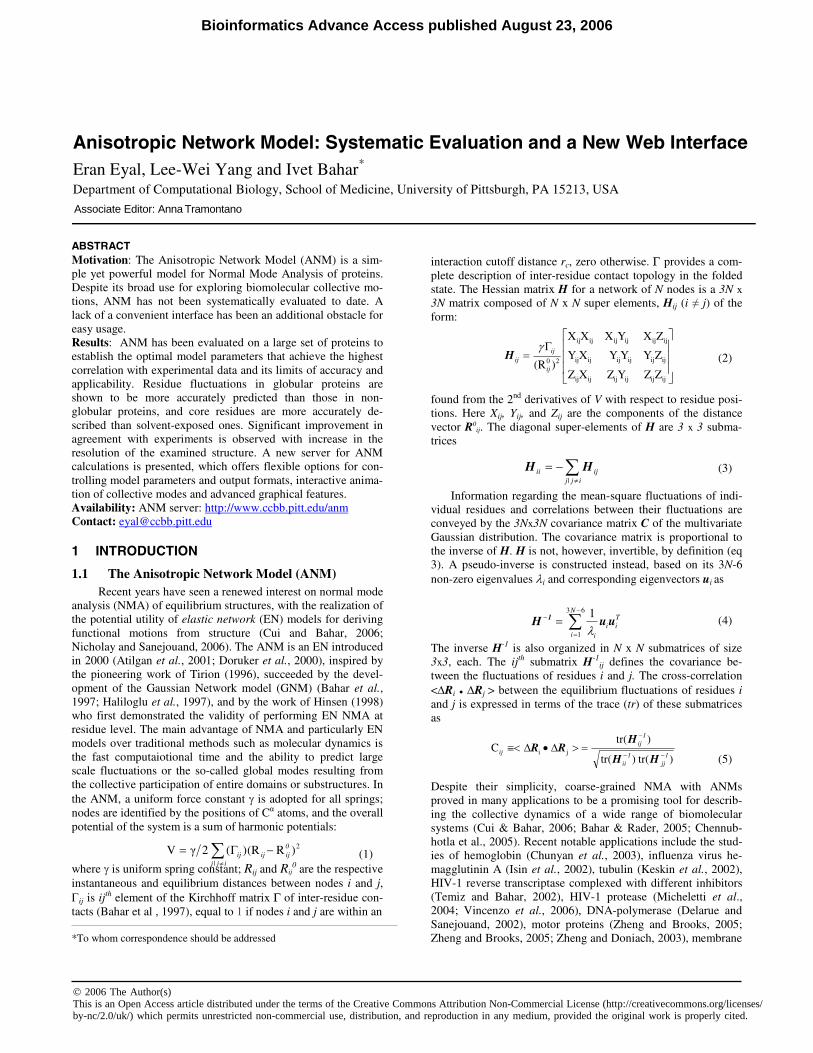
The first basic step is to examine the dependence of the per-formance of the model on its single parameter. Fig. 1a shows the model is quite robust to the cutoff distance in the range of 15-24Å, with a correlation coefficient (CC) between experiments and theory of about 0.54. The insensitivity of the GNM to the choice of cutoff distances within a certain range has been shown in previous works (Kundu et al., 2002; Yang, et al., 2006). The present results suggest that the same insensitivity is valid for ANM results too. Note that a larger cutoff distance is required in the ANM, compared to GNM, as also discussed in more detail in our previous work (Atilgan et al., 2001) where 7.3 Å cutoff for GNM was shown to be equivalent to 18.0 Å for ANM after cali-bration with experimental fluctuations. The large cutoff in ANMdoes not mask the topological differences between residues be-cause the Hessian matrix essentially depends on the orientational cosines of the inter-residue vectors rather than their absolute distances (see eq 2). For HIV protease for example (PDB 1hhp) the correlation between the fluctuations predicted using rc = 18.0 Å show a correlation coefficient of 0.89 and 0.78 with those obtained with 10.0 Å and 30.0 Å cutoffs, respectively. Neverthe-less, the ANM server (section 3.6) allows users to interactively select the cutoff over a broad range, so that the robustness of the results may be tested when detailed case studies are conducted.
It should be noted that GNM fluctuation predictions agree better with experiments than those computed with ANM. The correlation coefficient between GNM results and experimental
(b)(a)
Fig. 1. (a) Average correlation between ANM-predicted mean-square fluctuations and the experimental values (B-factors) for different cutoffdistances. The ordinate is the average correlation coefficient (CC) between the computed and measured data for the examined 176 PDB structures, and the bars indicate the standard errors for each set. (b)Dependence of the same correlation coefficient on the power p used in Eq. 8 for the distance dependence of the spring constant.
E. Eyal et al.
4
)()()-(2γV|
0ijij
0ijij
ijjij RRRR −•−Γ= ∑
≠
data averaged over a large representative set is at least 0.6 under the same evaluation conditions and reach up to 0.74 upon distin-guishing between bonded- and nonbonded-pairs and inclusion of crystal contacts (Kondrashov et al., 2006). The higher perform-ance of GNM has been attributed to its underlying potential (Chennubhotla et al., 2005):
(7)
which takes account of orientational deformations, in addition to distance changes.
3.2 Distance weight for the force constantsFrom Eq. 2 it is clear that the distance between residues
comes into play in the Hessian only through the ratios Sij/Rij0
where S = X, Y or Z, i.e H depends on the spatial orientations of inter-residue distance vectors, rather than their sizes. On the other hand, it is reasonable to assume that closer residues would be subject to stronger interactions, and thereby stiffer springs. Hinsen (Hinsen, 1998) indeed suggested a force constant which decays with the square distance. We have considered a slightly different distance weighting scheme as described by the new Hessian off-diagonal super-elements
Hij’ = Hij / (Rij0) p (8)
where p is an empirical parameter. Fig. 1b shows the average correlation coefficient between theoretical and experimental B-factors obtained using Eq. 8 with different p values. Weighting the interactions improves the correlation gradually up to 0.58 atp = 2.5, approximately. We also tried different forms of expo-nential decays but could not obtain any improvement in the cor-relation. The results presented in the following refer to a distant weight with p = 2.5, unless stated otherwise.
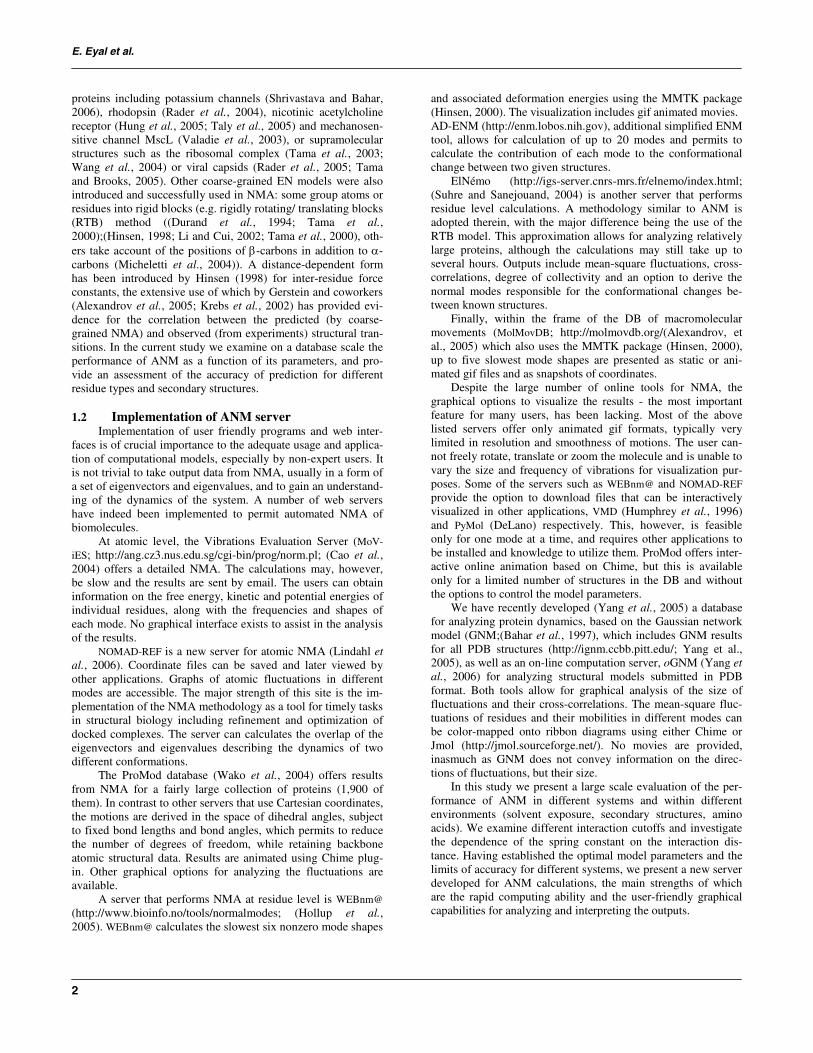
3.3 Globular proteins are easier targetsANM depends on the topology of the EN, which in turn de-
scribes the overall shape of the protein. It is therefore natural to check the influence of the protein shape on the performance of the model. As described above, we estimated the globularity of the proteins in our test set using a simple index. Fig. 3 shows the mean correlation for proteins in 4 bins of globularity. The pre-diction is clearly better for more globular proteins with a differ-ence of almost 15% between the extreme bins.
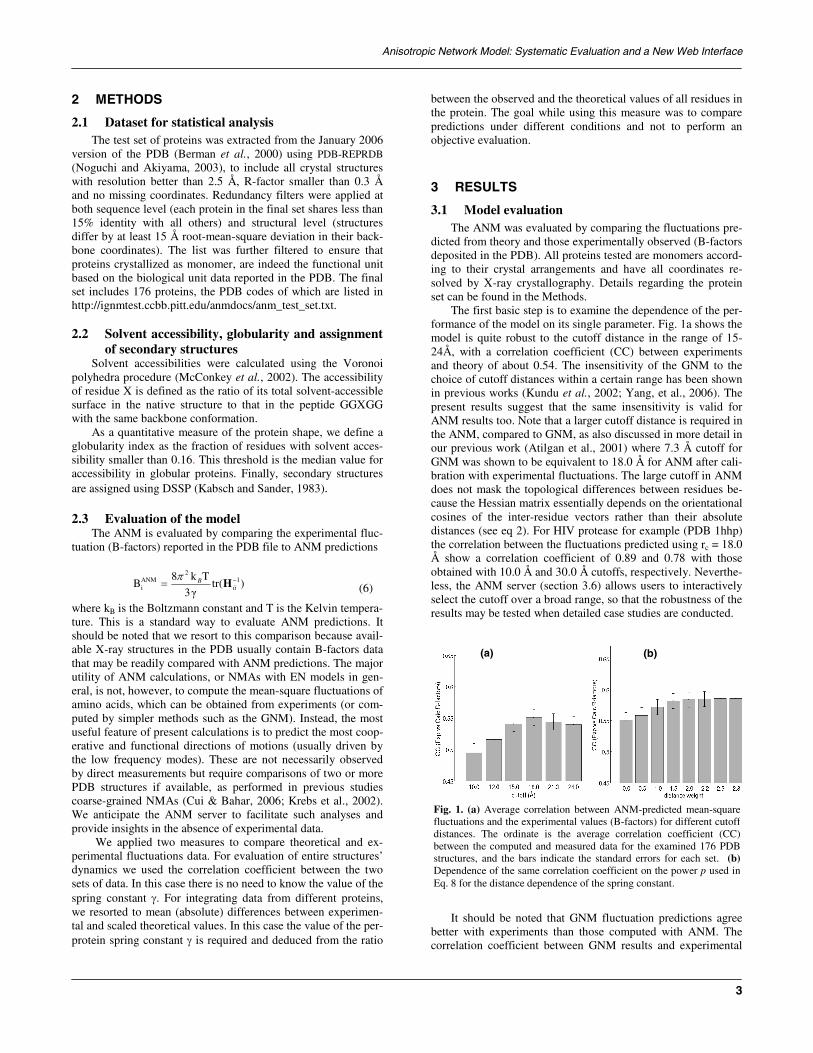
More globular proteins have, by definition, larger fraction of buried residues. The fluctuations predicted for buried residues, would, in turn, be expected to be in better agreement with ex-periments than solvent-exposed residues. This is because the fluctuation spectrum is more constrained, or well-defined, in a high coordination number environment (protein core), as op-
posed to surface regions where large amplitude fluctuations can be sampled. In addition, experimental B-factors of surface resi-dues are biased due to crystal packing, making it difficult to achieve a high correlation with theoretical calculations in vac-uum. The results shown in Fig. 2 can be understood on these grounds.
We also examined directly how the accuracy of the pre-dicted fluctuations is related to solvent accessibilities. Fig. 3demonstrates that the fluctuations of buried residues are slightlyunderestimated on average, while the theoretical fluctuations of exposed residues are larger than their experimental counterparts
at least partially because the fluctuations in the crystal do not reflect real motion in solution/vacuum. In absolute terms, the predictions for buried residues are in significantly better agree-ment with the experimental data.
3.4 Performance for different amino acids and sec-ondary structures
ANM does not consider the residue types by any means dur-ing the calculation. Yet, it is important to evaluate the theoretical fluctuations for each residue. This may provide hints with regard to the limitations or biases of the simple potential in the coarse-grained approach. Interestingly, the model is capable of produc-ing a near native fluctuation pattern for the different amino ac-ids, as demonstrated in Fig. 4a. This proves that in general, the fluctuations are a direct consequence of the architecture of the protein and not an intrinsic property of the amino acids. The overall amino acid sequence determines the architecture of the protein, but given that architecture, the local fluctuations at each site are not affected much by the identity of the residue. Fig. 4bshows that the differences in the accuracy between residue types in the protein interior are small. In general, the predictions forlarger amino acids (notably glutamine) are slightly more accu-rate than those of small amino acids. More pronounced differ-ences are observed for exposed residues (Fig. 4c). These differ-ences appear to be related to the physicochemical properties of the residues. Polar/charged residues are more accurately pre-dicted than hydrophobic ones, a possible consequence of the involvement of surface hydrophobic residues in crystal contacts. Interestingly, the theoretical fluctuations of cysteines are by far more accurate than all other residues. In the protein interior, in
Fig. 3. Influence of solvent accessibility on the difference betweenexperimental and theoretical mean-square fluctuations of residues, computed with two different methods (as labeled). Fluctuations are slightly underestimated in the protein core and overestimated on the surface.
Fig. 2. Dependence of the correlation between ANM predictions and experi-mental data (B-factors) on the globularity of the examined proteins. High-est correlation is achieved with most globular pro-teins.
Anisotropic Network Model: Systematic Evaluation and a New Web Interface
contrast, fluctuations of cysteines are the least accurate. This might have to do with properties of the disulfide bonds not con-sidered by the model. 38% of the cysteines in the database are involved in disulfide bonds.
Analysis of ANM results for different secondary structure elements reveals that the fluctuations are slightly underestimated for α-helices and β-strands (Fig. 5a) although these departures are minimal in terms of absolute sizes (Fig. 5b). For other less organized regions (turns/loops) the theoretical fluctuations are relatively less accurate and tend to be larger than those observedin X-ray structures. Note that these are regions that would be most strongly affected by crystal contacts.
Fig. 4. Fluctuations of different amino acids. (a) Experimental (whitebars) and theoretical (grey bars) fluctuations for different amino acids.(b) Level of agreement between the theoretical mean-squared fluctua-tions and the experimental ones in the protein core. (c) Level of agree-ment on the protein surface (accessibility > 0.6).
Fig. 5. (a) Difference between theoretical and experimental mean-square fluctuations for different secondary structures. (b) Mean absolute differ-ences.
We also checked if there are differences in prediction of dy-namics according to structural classes based on SCOP definitions (Murzin et al., 1995). No significant differences are found between the 4 major structural classes (α, β, α+β, α/β).
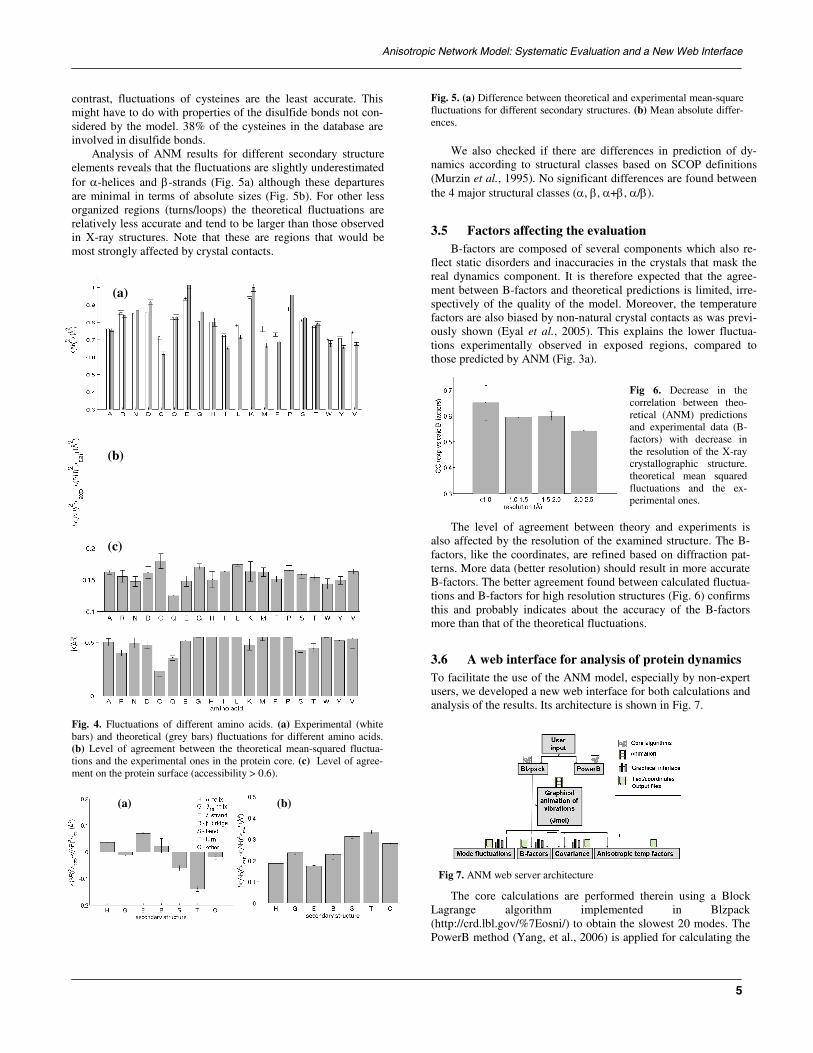
3.5 Factors affecting the evaluationB-factors are composed of several components which also re-
flect static disorders and inaccuracies in the crystals that mask the real dynamics component. It is therefore expected that the agree-ment between B-factors and theoretical predictions is limited, irre-spectively of the quality of the model. Moreover, the temperature factors are also biased by non-natural crystal contacts as was previ-ously shown (Eyal et al., 2005). This explains the lower fluctua-tions experimentally observed in exposed regions, compared tothose predicted by ANM (Fig. 3a).
The level of agreement between talso affected by the resolution of the efactors, like the coordinates, are refinedterns. More data (better resolution) shouB-factors. The better agreement found btions and B-factors for high resolution sthis and probably indicates about the more than that of the theoretical fluctuat
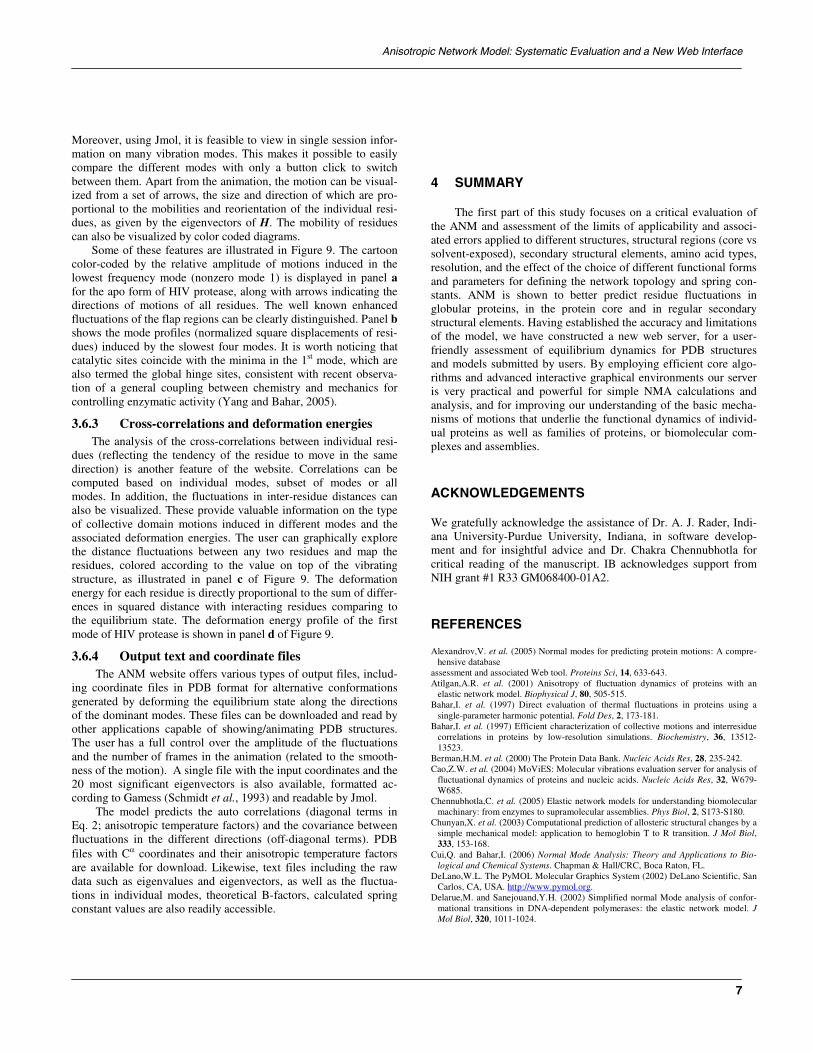
3.6 A web interface for analysisTo facilitate the use of the ANM modeusers, we developed a new web interfacanalysis of the results. Its architecture is
The core calculations are performLagrange algorithm impleme(http://crd.lbl.gov/%7Eosni/) to obtain tPowerB method (Yang, et al., 2006) is
(c)
(a) (b)
Fig 7. ANM web server architecture
Fig 6. Decrease in the correlation between theo-retical (ANM) predictions and experimental data (B-factors) with decrease inthe resolution of the X-ray crystallographic structure.theoretical mean squared fluctuations and the ex-perimental ones.
(b)
(a)
5
heory and experiments is xamined structure. The B- based on diffraction pat-ld result in more accurate etween calculated fluctua-tructures (Fig. 6) confirms accuracy of the B-factors ions.
of protein dynamicsl, especially by non-expert e for both calculations and shown in Fig. 7.
ed therein using a Block nted in Blzpack he slowest 20 modes. The applied for calculating the
E. Eyal et al.
6
entire covariance matrix (Eq. 5) based on perturbation and inver-sion of the Hessian matrix followed by subtraction of the contri-bution of the six dominant eigenmodes of the perturbed matrix.These algorithms are very efficient. Calculations for proteins with hundreds of residues are completed within seconds and for pro-teins of thousands of residues within a few minutes on a single processor, 1Ghz, 1GB machine (Yang, et al., 2006). Advanced graphical analysis options including interactive animations of the vibrations, graphs of mean-square fluctuations, 2D plots for thecorrelations <∆Ri ● ∆Rj> between the fluctuations of residue pairs as well as the fluctuations <(∆Rij)
2> in inter-residue distance vec-tors and the changes in inter-residue distances, <(Rij – Rij
0)2>.
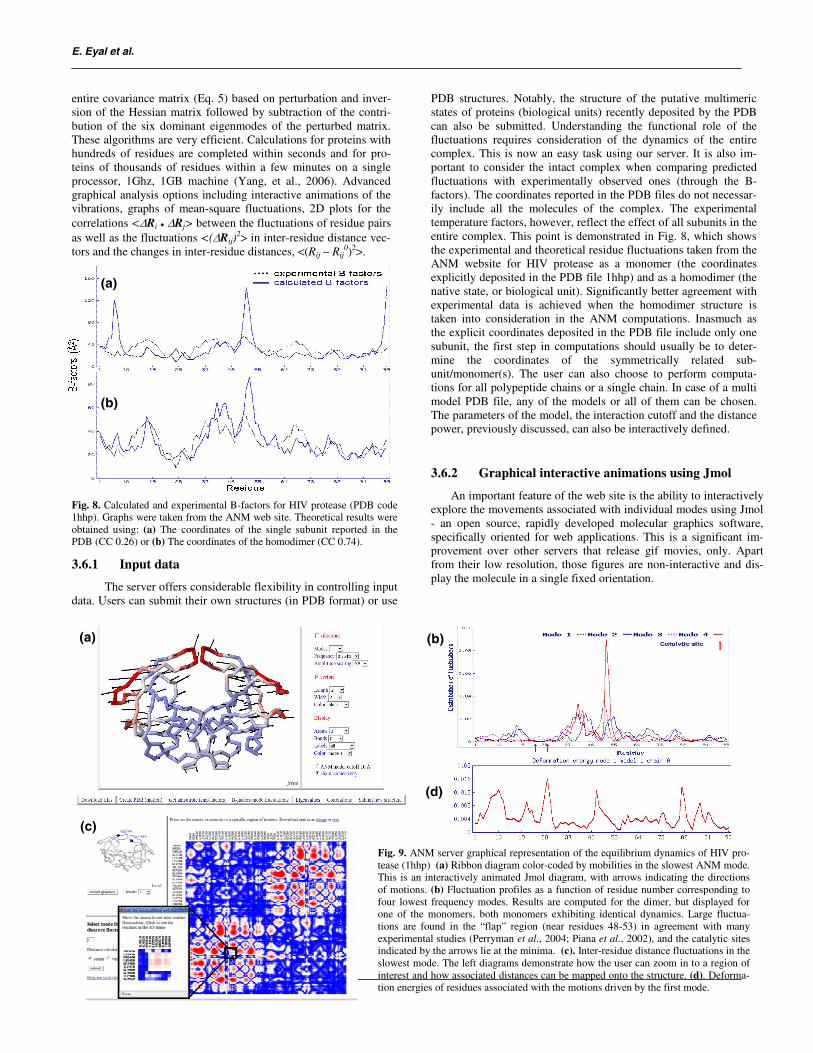
Fig. 8. Calculated and experimental B-factors for HIV protease (PDB code 1hhp). Graphs were taken from the ANM web site. Theoretical results were obtained using: (a) The coordinates of the single subunit reported in the PDB (CC 0.26) or (b) The coordinates of the homodimer (CC 0.74).
3.6.1 Input data
The server offers considerable flexibility in controlling input data. Users can submit their own structures (in PDB format) or use
PDB structures. Notably, the structure of the putative multimeric states of proteins (biological units) recently deposited by the PDB can also be submitted. Understanding the functional role of the fluctuations requires consideration of the dynamics of the entire complex. This is now an easy task using our server. It is also im-portant to consider the intact complex when comparing predicted fluctuations with experimentally observed ones (through the B-factors). The coordinates reported in the PDB files do not necessar-ily include all the molecules of the complex. The experimental temperature factors, however, reflect the effect of all subunits in the entire complex. This point is demonstrated in Fig. 8, which showsthe experimental and theoretical residue fluctuations taken from the ANM website for HIV protease as a monomer (the coordinates explicitly deposited in the PDB file 1hhp) and as a homodimer (the native state, or biological unit). Significantly better agreement withexperimental data is achieved when the homodimer structure is taken into consideration in the ANM computations. Inasmuch as the explicit coordinates deposited in the PDB file include only one subunit, the first step in computations should usually be to deter-mine the coordinates of the symmetrically related sub-unit/monomer(s). The user can also choose to perform computa-tions for all polypeptide chains or a single chain. In case of a multi model PDB file, any of the models or all of them can be chosen. The parameters of the model, the interaction cutoff and the distance power, previously discussed, can also be interactively defined.
3.6.2 Graphical interactive animations using Jmol
An important feature of the web site is the ability to interactively explore the movements associated with individual modes using Jmol - an open source, rapidly developed molecular graphics software, specifically oriented for web applications. This is a significant im-provement over other servers that release gif movies, only. Apart from their low resolution, those figures are non-interactive and dis-play the molecule in a single fixed orientation.
(a) (b)
(c)
(d)
(b)
(a)
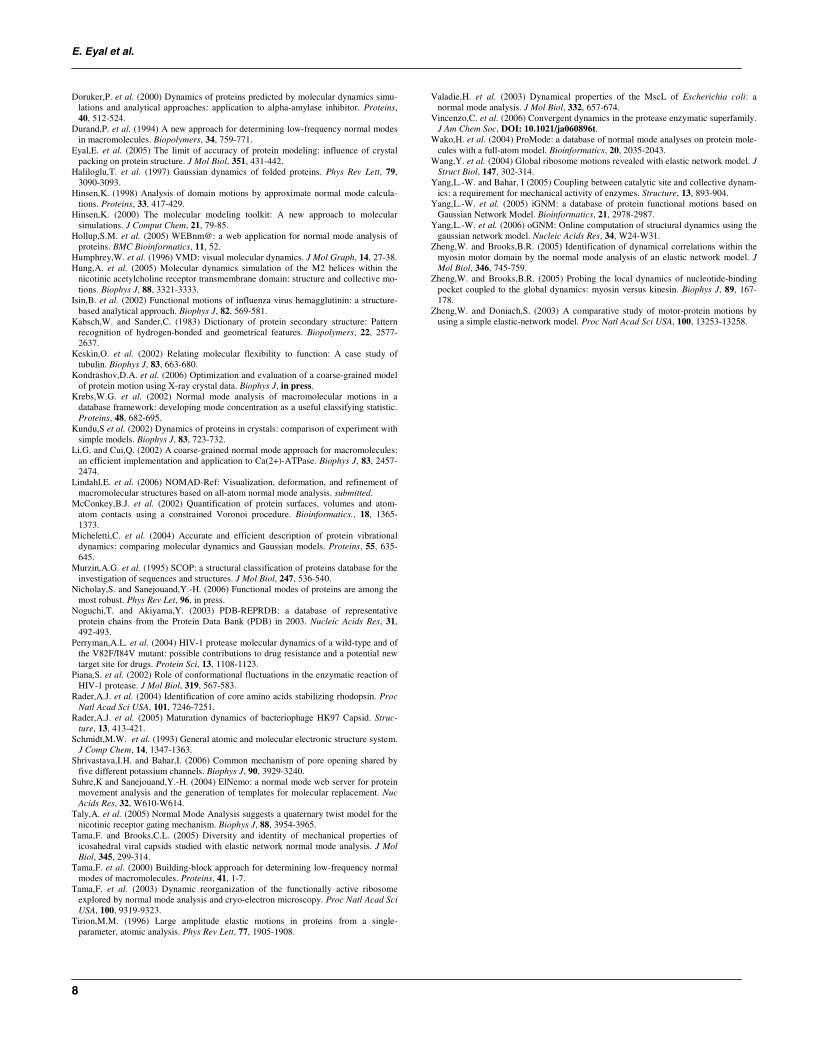
Fig. 9. ANM server graphical representation of the equilibrium dynamics of HIV pro-tease (1hhp) (a) Ribbon diagram color-coded by mobilities in the slowest ANM mode. This is an interactively animated Jmol diagram, with arrows indicating the directions of motions. (b) Fluctuation profiles as a function of residue number corresponding to four lowest frequency modes. Results are computed for the dimer, but displayed for one of the monomers, both monomers exhibiting identical dynamics. Large fluctua-tions are found in the “flap” region (near residues 48-53) in agreement with many experimental studies (Perryman et al., 2004; Piana et al., 2002), and the catalytic sites indicated by the arrows lie at the minima. (c). Inter-residue distance fluctuations in the slowest mode. The left diagrams demonstrate how the user can zoom in to a region of interest and how associated distances can be mapped onto the structure. (d). Deforma-tion energies of residues associated with the motions driven by the first mode.
Anisotropic Network Model: Systematic Evaluation and a New Web Interface
7
Moreover, using Jmol, it is feasible to view in single session infor-mation on many vibration modes. This makes it possible to easily compare the different modes with only a button click to switchbetween them. Apart from the animation, the motion can be visual-ized from a set of arrows, the size and direction of which are pro-portional to the mobilities and reorientation of the individual resi-dues, as given by the eigenvectors of H. The mobility of residues can also be visualized by color coded diagrams.
Some of these features are illustrated in Figure 9. The cartoon color-coded by the relative amplitude of motions induced in the lowest frequency mode (nonzero mode 1) is displayed in panel afor the apo form of HIV protease, along with arrows indicating the directions of motions of all residues. The well known enhancedfluctuations of the flap regions can be clearly distinguished. Panel bshows the mode profiles (normalized square displacements of resi-dues) induced by the slowest four modes. It is worth noticing that catalytic sites coincide with the minima in the 1st mode, which are also termed the global hinge sites, consistent with recent observa-tion of a general coupling between chemistry and mechanics for controlling enzymatic activity (Yang and Bahar, 2005).
3.6.3 Cross-correlations and deformation energiesThe analysis of the cross-correlations between individual resi-
dues (reflecting the tendency of the residue to move in the same direction) is another feature of the website. Correlations can be computed based on individual modes, subset of modes or all modes. In addition, the fluctuations in inter-residue distances can also be visualized. These provide valuable information on the type of collective domain motions induced in different modes and the associated deformation energies. The user can graphically explore the distance fluctuations between any two residues and map the residues, colored according to the value on top of the vibrating structure, as illustrated in panel c of Figure 9. The deformation energy for each residue is directly proportional to the sum of differ-ences in squared distance with interacting residues comparing to the equilibrium state. The deformation energy profile of the first mode of HIV protease is shown in panel d of Figure 9.
3.6.4 Output text and coordinate filesThe ANM website offers various types of output files, includ-
ing coordinate files in PDB format for alternative conformations generated by deforming the equilibrium state along the directions of the dominant modes. These files can be downloaded and read by other applications capable of showing/animating PDB structures. The user has a full control over the amplitude of the fluctuations and the number of frames in the animation (related to the smooth-ness of the motion). A single file with the input coordinates and the 20 most significant eigenvectors is also available, formatted ac-cording to Gamess (Schmidt et al., 1993) and readable by Jmol.
The model predicts the auto correlations (diagonal terms in Eq. 2; anisotropic temperature factors) and the covariance between fluctuations in the different directions (off-diagonal terms). PDB files with Cα coordinates and their anisotropic temperature factors are available for download. Likewise, text files including the raw data such as eigenvalues and eigenvectors, as well as the fluctua-tions in individual modes, theoretical B-factors, calculated spring constant values are also readily accessible.
4 SUMMARY
The first part of this study focuses on a critical evaluation of the ANM and assessment of the limits of applicability and associ-ated errors applied to different structures, structural regions (core vs solvent-exposed), secondary structural elements, amino acid types, resolution, and the effect of the choice of different functional forms and parameters for defining the network topology and spring con-stants. ANM is shown to better predict residue fluctuations in globular proteins, in the protein core and in regular secondary structural elements. Having established the accuracy and limitations of the model, we have constructed a new web server, for a user-friendly assessment of equilibrium dynamics for PDB structures and models submitted by users. By employing efficient core algo-rithms and advanced interactive graphical environments our server is very practical and powerful for simple NMA calculations and analysis, and for improving our understanding of the basic mecha-nisms of motions that underlie the functional dynamics of individ-ual proteins as well as families of proteins, or biomolecular com-plexes and assemblies.
ACKNOWLEDGEMENTS
We gratefully acknowledge the assistance of Dr. A. J. Rader, Indi-ana University-Purdue University, Indiana, in software develop-ment and for insightful advice and Dr. Chakra Chennubhotla for critical reading of the manuscript. IB acknowledges support from NIH grant #1 R33 GM068400-01A2.
REFERENCES
Alexandrov,V. et al. (2005) Normal modes for predicting protein motions: A compre-hensive database
assessment and associated Web tool. Proteins Sci, 14, 633-643.Atilgan,A.R. et al. (2001) Anisotropy of fluctuation dynamics of proteins with an
elastic network model. Biophysical J, 80, 505-515.Bahar,I. et al. (1997) Direct evaluation of thermal fluctuations in proteins using a
single-parameter harmonic potential. Fold Des, 2, 173-181.Bahar,I. et al. (1997) Efficient characterization of collective motions and interresidue
correlations in proteins by low-resolution simulations. Biochemistry, 36, 13512-13523.
Berman,H.M. et al. (2000) The Protein Data Bank. Nucleic Acids Res, 28, 235-242.Cao,Z.W. et al. (2004) MoViES: Molecular vibrations evaluation server for analysis of
fluctuational dynamics of proteins and nucleic acids. Nucleic Acids Res, 32, W679-W685.
Chennubhotla,C. et al. (2005) Elastic network models for understanding biomolecular machinary: from enzymes to supramolecular assemblies. Phys Biol, 2, S173-S180.
Chunyan,X. et al. (2003) Computational prediction of allosteric structural changes by a simple mechanical model: application to hemoglobin T to R transition. J Mol Biol, 333, 153-168.
Cui,Q. and Bahar,I. (2006) Normal Mode Analysis: Theory and Applications to Bio-logical and Chemical Systems. Chapman & Hall/CRC, Boca Raton, FL.
DeLano,W.L. The PyMOL Molecular Graphics System (2002) DeLano Scientific, San Carlos, CA, USA. http://www.pymol.org.
Delarue,M. and Sanejouand,Y.H. (2002) Simplified normal Mode analysis of confor-mational transitions in DNA-dependent polymerases: the elastic network model. J Mol Biol, 320, 1011-1024.
E. Eyal et al.
8
Doruker,P. et al. (2000) Dynamics of proteins predicted by molecular dynamics simu-lations and analytical approaches: application to alpha-amylase inhibitor. Proteins, 40, 512-524.
Durand,P. et al. (1994) A new approach for determining low-frequency normal modes in macromolecules. Biopolymers, 34, 759-771.
Eyal,E. et al. (2005) The limit of accuracy of protein modeling: influence of crystal packing on protein structure. J Mol Biol, 351, 431-442.
Haliloglu,T. et al. (1997) Gaussian dynamics of folded proteins. Phys Rev Lett, 79, 3090-3093.
Hinsen,K. (1998) Analysis of domain motions by approximate normal mode calcula-tions. Proteins, 33, 417-429.
Hinsen,K. (2000) The molecular modeling toolkit: A new approach to molecular simulations. J Comput Chem, 21, 79-85.
Hollup,S.M. et al. (2005) WEBnm@: a web application for normal mode analysis of proteins. BMC Bioinformatics, 11, 52.
Humphrey,W. et al. (1996) VMD: visual molecular dynamics. J Mol Graph, 14, 27-38.Hung,A. et al. (2005) Molecular dynamics simulation of the M2 helices within the
nicotinic acetylcholine receptor transmembrane domain: structure and collective mo-tions. Biophys J, 88, 3321-3333.
Isin,B. et al. (2002) Functional motions of influenza virus hemagglutinin: a structure-based analytical approach. Biophys J, 82, 569-581.
Kabsch,W. and Sander,C. (1983) Dictionary of protein secondary structure: Pattern recognition of hydrogen-bonded and geometrical features. Biopolymers, 22, 2577-2637.
Keskin,O. et al. (2002) Relating molecular flexibility to function: A case study of tubulin. Biophys J, 83, 663-680.
Kondrashov,D.A. et al. (2006) Optimization and evaluation of a coarse-grained model of protein motion using X-ray crystal data. Biophys J, in press.
Krebs,W.G. et al. (2002) Normal mode analysis of macromolecular motions in a database framework: developing mode concentration as a useful classifying statistic. Proteins, 48, 682-695.
Kundu,S et al. (2002) Dynamics of proteins in crystals: comparison of experiment with simple models. Biophys J, 83, 723-732.
Li,G. and Cui,Q. (2002) A coarse-grained normal mode approach for macromolecules: an efficient implementation and application to Ca(2+)-ATPase. Biophys J, 83, 2457-2474.
Lindahl,E. et al. (2006) NOMAD-Ref: Visualization, deformation, and refinement of macromolecular structures based on all-atom normal mode analysis. submitted.
McConkey,B.J. et al. (2002) Quantification of protein surfaces, volumes and atom-atom contacts using a constrained Voronoi procedure. Bioinformatics., 18, 1365-1373.
Micheletti,C. et al. (2004) Accurate and efficient description of protein vibrational dynamics: comparing molecular dynamics and Gaussian models. Proteins, 55, 635-645.
Murzin,A.G. et al. (1995) SCOP: a structural classification of proteins database for the investigation of sequences and structures. J Mol Biol, 247, 536-540.
Nicholay,S. and Sanejouand,Y.-H. (2006) Functional modes of proteins are among the most robust. Phys Rev Let, 96, in press.
Noguchi,T. and Akiyama,Y. (2003) PDB-REPRDB: a database of representative protein chains from the Protein Data Bank (PDB) in 2003. Nucleic Acids Res, 31, 492-493.
Perryman,A.L. et al. (2004) HIV-1 protease molecular dynamics of a wild-type and of the V82F/I84V mutant: possible contributions to drug resistance and a potential new target site for drugs. Protein Sci, 13, 1108-1123.
Piana,S. et al. (2002) Role of conformational fluctuations in the enzymatic reaction of HIV-1 protease. J Mol Biol, 319, 567-583.
Rader,A.J. et al. (2004) Identification of core amino acids stabilizing rhodopsin. Proc Natl Acad Sci USA, 101, 7246-7251.
Rader,A.J. et al. (2005) Maturation dynamics of bacteriophage HK97 Capsid. Struc-ture, 13, 413-421.
Schmidt,M.W. et al. (1993) General atomic and molecular electronic structure system. J Comp Chem, 14, 1347-1363.
Shrivastava,I.H. and Bahar,I. (2006) Common mechanism of pore opening shared by five different potassium channels. Biophys J, 90, 3929-3240.
Suhre,K and Sanejouand,Y.-H. (2004) ElNemo: a normal mode web server for protein movement analysis and the generation of templates for molecular replacement. Nuc Acids Res, 32, W610-W614.
Taly,A. et al. (2005) Normal Mode Analysis suggests a quaternary twist model for the nicotinic receptor gating mechanism. Biophys J, 88, 3954-3965.
Tama,F. and Brooks,C.L. (2005) Diversity and identity of mechanical properties of icosahedral viral capsids studied with elastic network normal mode analysis. J Mol Biol, 345, 299-314.
Tama,F. et al. (2000) Building-block approach for determining low-frequency normal modes of macromolecules. Proteins, 41, 1-7.
Tama,F. et al. (2003) Dynamic reorganization of the functionally active ribosome explored by normal mode analysis and cryo-electron microscopy. Proc Natl Acad Sci USA, 100, 9319-9323.
Tirion,M.M. (1996) Large amplitude elastic motions in proteins from a single-parameter, atomic analysis. Phys Rev Lett, 77, 1905-1908.
Valadie,H. et al. (2003) Dynamical properties of the MscL of Escherichia coli: a normal mode analysis. J Mol Biol, 332, 657-674.
Vincenzo,C. et al. (2006) Convergent dynamics in the protease enzymatic superfamily. J Am Chem Soc, DOI: 10.1021/ja060896t.
Wako,H. et al. (2004) ProMode: a database of normal mode analyses on protein mole-cules with a full-atom model. Bioinformatics, 20, 2035-2043.
Wang,Y. et al. (2004) Global ribosome motions revealed with elastic network model. J Struct Biol, 147, 302-314.
Yang,L.-W. and Bahar, I (2005) Coupling between catalytic site and collective dynam-ics: a requirement for mechanical activity of enzymes. Structure, 13, 893-904.
Yang,L.-W. et al. (2005) iGNM: a database of protein functional motions based on Gaussian Network Model. Bioinformatics, 21, 2978-2987.
Yang,L.-W. et al. (2006) oGNM: Online computation of structural dynamics using the gaussian network model. Nucleic Acids Res, 34, W24-W31.
Zheng,W. and Brooks,B.R. (2005) Identification of dynamical correlations within the myosin motor domain by the normal mode analysis of an elastic network model. J Mol Biol, 346, 745-759.
Zheng,W. and Brooks,B.R. (2005) Probing the local dynamics of nucleotide-binding pocket coupled to the global dynamics: myosin versus kinesin. Biophys J, 89, 167-178.
Zheng,W. and Doniach,S. (2003) A comparative study of motor-protein motions by using a simple elastic-network model. Proc Natl Acad Sci USA, 100, 13253-13258.