
A WEB-BASED INFORMATION SYSTEM FOR OPTIMAL ENERGY SOURCES
6
A WEB-BASED INFORMATION SYSTEM FOR OPTIMAL ENERGY SOURCES MANAGEMENT THROUGH ONTOLOGIES AND HYPERCUBIC CLUSTERING Vasili Loumos Professor of NTUA Multimedia Technology Laboratory, School of Electrical & Computer Engineering National Technical University of Athens tel/fax. 210-7722538 [email protected] Vassilis Nikolopoulos PhD Candidate Founder of spin-off group INTELEN Multimedia Technology Laboratory, School of Electrical & Computer Engineering National Technical University of Athens [email protected] 1. INTRDUCTION A modern Decision Support System (DSS) can be defined as computer-based tool, or a more complex Information System structure, used to support and generate decision- making and problem solving. Although this definition applies very well to decision- making in many purely technical areas, it falls short of reflecting one extremely important aspect of the decision-making process in water resource systems: the role of human factor. Energy Information Systems (EIS), which monitor and organize building energy consumption and related trend data over the Internet, have been evolving over the past decade and can be considered as a part of a specialized DSS. The above con- cept performs key energy management functions such as organizing energy use data, identifying energy consumption anomalies, managing energy costs, and automating demand response strategies and focused customer profiling. In this paper, a modern and innovative web-based intelligent Energy Information System [1], [7] is briefly de- scribed, for an optimal energy sources management and minimisation-control of home and factory-based energy consumption (EMIR system). 2. MATHEMATICAL MODELING & ARCHITECTURE As stated before, Energy Information Systems (EIS) refer to software, data acquisition hardware, and communication protocols administered by a single company, a partnership, or a collective to provide energy information to commercial building energy managers and electric utilities. In a typical EIS architecture [3], [6], the EIS server hardware and software located at the EIS service provider’s physical site record interval data via the Internet. The EIS receives these data from signals dispatched by meters installed in a customer’s building, or directly communicates with meters. The EIS users can access the server with a password, and access the archived energy data either in real-time or in hourly, or daily updates from anywhere via a web browser. This web-based functionality can be enriched with many add-on services in order to create a complete Information System that will act as the basic “ad-hoc broker” between free customers and energy providers, in the future opened Energy market.
Transcript of A WEB-BASED INFORMATION SYSTEM FOR OPTIMAL ENERGY SOURCES
A WEB-BASED INFORMATION SYSTEM FOR OPTIMAL
ENERGY SOURCES MANAGEMENT THROUGH ONTOLOGIES
AND HYPERCUBIC CLUSTERING
Vasili Loumos Professor of NTUA
Multimedia Technology Laboratory, School of Electrical & Computer Engineering
National Technical University of Athens tel/fax. 210-7722538 [email protected]
Vassilis NikolopoulosPhD Candidate
Founder of spin-off group INTELEN Multimedia Technology Laboratory,
School of Electrical & Computer Engineering National Technical University of Athens
1. INTRDUCTION A modern Decision Support System (DSS) can be defined as computer-based tool, or a more complex Information System structure, used to support and generate decision-making and problem solving. Although this definition applies very well to decision-making in many purely technical areas, it falls short of reflecting one extremely important aspect of the decision-making process in water resource systems: the role of human factor. Energy Information Systems (EIS), which monitor and organize building energy consumption and related trend data over the Internet, have been evolving over the past decade and can be considered as a part of a specialized DSS. The above con-cept performs key energy management functions such as organizing energy use data, identifying energy consumption anomalies, managing energy costs, and automating demand response strategies and focused customer profiling. In this paper, a modern and innovative web-based intelligent Energy Information System [1], [7] is briefly de-scribed, for an optimal energy sources management and minimisation-control of home and factory-based energy consumption (EMIR system). 2. MATHEMATICAL MODELING & ARCHITECTURE As stated before, Energy Information Systems (EIS) refer to software, data acquisition hardware, and communication protocols administered by a single company, a partnership, or a collective to provide energy information to commercial building energy managers and electric utilities. In a typical EIS architecture [3], [6], the EIS server hardware and software located at the EIS service provider’s physical site record interval data via the Internet. The EIS receives these data from signals dispatched by meters installed in a customer’s building, or directly communicates with meters. The EIS users can access the server with a password, and access the archived energy data either in real-time or in hourly, or daily updates from anywhere via a web browser. This web-based functionality can be enriched with many add-on services in order to create a complete Information System that will act as the basic “ad-hoc broker” between free customers and energy providers, in the future opened Energy market.

2.1 A Brief Mathematical Model for Load Consumption
A typical electricity demand model [10], [11] that we wanted to capture in our model includes four very important EPIs (Energy Performance Indicators) metrics: elasticity, seasonality, mean reversion, and stochastic growth.
• Load Elasticity: We assume electricity demand to be completely inelastic (i.e. independent of market clearing price). This may appear to be a strong assump-tion, but in the current state of deregulation, few end users actually observe real time price movements.
• Load Seasonality: Seasonality is a major driver for electricity demand. We ob-serve seasonality over the daily, weekly, and yearly cycles.
• Load Mean reversion: One can observe temporary spikes in electricity de-mand, often induced by extreme weather conditions. However, these spikes are not sustainable and demand reverts back to normal levels within a few days.
• Stochastic growth: Growth in electricity demand is driven in part by trends in the overall economy. The growth is therefore hard to predict over longer time horizons, and must be considered stochastic.
The typical load vector LD, comprised of various daily load vectors μm can be described
by using the following formula: (1) ∑=
+=j
i
Lim
Lid
LmD vwL
1
μ
where the set of principal components [10] vLi and associated weights wi is included so that the best approximation of the load vector Ld is effectuated. A monthly [24×1] vector vLm is used to describe load behaviour, reducing the load equa-tion to: (2) , where μL
mLd
LmD vwL += μ m and vm are deterministic parameters and wd
is a daily stochastic process. The choice of the number of principal components used is a trade-off between accuracy and complexity. For short-term decision, making such as day-ahead bidding, a single PC may not provide a rich enough sample space. However, when applying the price process to hedging and valuation decisions over months or years, a small basis prevents the problem from blowing up in computational complexity. Next, we must include and take into consideration the mathematical model that describes the new energy open-market. Load prediction and the above load formulas will be incorporated into the general overall function and this term will play an essential stochastic role to the overall estimation and decision process. According to Lekatsa’s model [4], the main Energy Equilibrium Function (EEF) is described by:
(3), where Load L( ) ( )∑ ∑= =
Δ =∗−+∗−−n
j
m
i
ai
aiEj SMPLQSMPLLQ
1 1
0 Δ and LE can be
modeled and estimated by equations (1) and (2) and represent the load consumption and Qi represent the generated or imported load from the potential Energy producers or En-ergy Sellers and SMP is the System’s Marginal Price. The difference is a very important metric that can represent and describe the gain margin of any potential Energy provider. Thus, energy estimation and prediction is very crucial and it is one of the main functions that this web-based Energy Information System can perform, by grouping and clustering various energy customers and consumers in order to form
ii LQ −

dynamic customer-based energy profiles and clusters. Those energy clusters are combined with a semantic network to produce realistic statistical predictions, based on equations (1), (2) and (3). As the main objective function [4] for the on-line optimisa-tion procedure taking place inside the EIS, equation (3) was used.
2.2 Multidimensional Hypercubic Clusters
Grouping the electricity customers into centroids generally requires the definition of sets of indices derived from the daily load curve pattern and/or from the utility database. The definitions may vary from region to region. A carefully designed systems of daily load curve indices has been proposed in [12] and include the non-uniformity coefficient a= Pmin/Pmax the fill-up coefficient p = Pav/Pmax the modulation coefficient at peak hours MCph = Pav.,ph/Pav where Pmin is the minimum power demand of the representative day, Pmax is the maximum power demand, Pav, is the average power demand, based on the ratio of the electricity consumption to the monthly hours, Pav.ph is the average power demand during daily peak hours. Several categories of electricity customers have been established according to the experience reported in [12] taking into account the values of the modulation coefficients at peak hours and off-peak-hours, which are readily available for most of the customers. The Euclidean metric used in the original algo-rithm. The clustering procedure is composed of several cycles. All the load patterns are sequentially presented; if the minimum weighted Euclidean distance from the centre of an existing cluster is lower than a set value, each pattern is assigned to the closest clus-ter and the associated cluster centre is updated. The basic computational topology was an isomorphic hypercube [2] with interconnect-ing vertices. The hypercubic structure was successfully simulated in the lab and can be shown below. The current topology will be used for a future distributed EI system:
Fig. 2 - 4th dim routed isomorphic hypercube Fig. 3 - 64th dim hypercube used in simulation
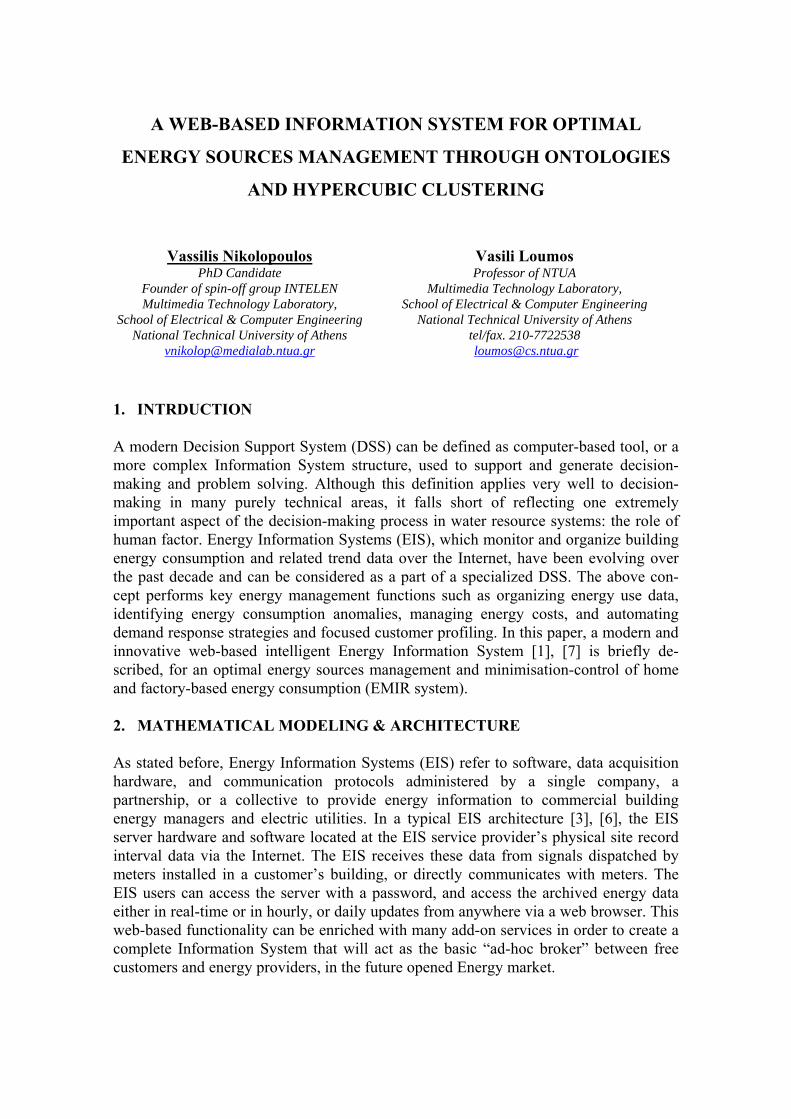
2.3 Ontology Diagram and EIS Semantic flows A complete ontological model was used [8], [9] and enriched, in order to capture the semantics of the above Energy consumption model, with all energy customers included. The various services were also incorporated into the model, giving a different business view. A brief semantic-data flow diagram, with all services as flows, can be seen below:
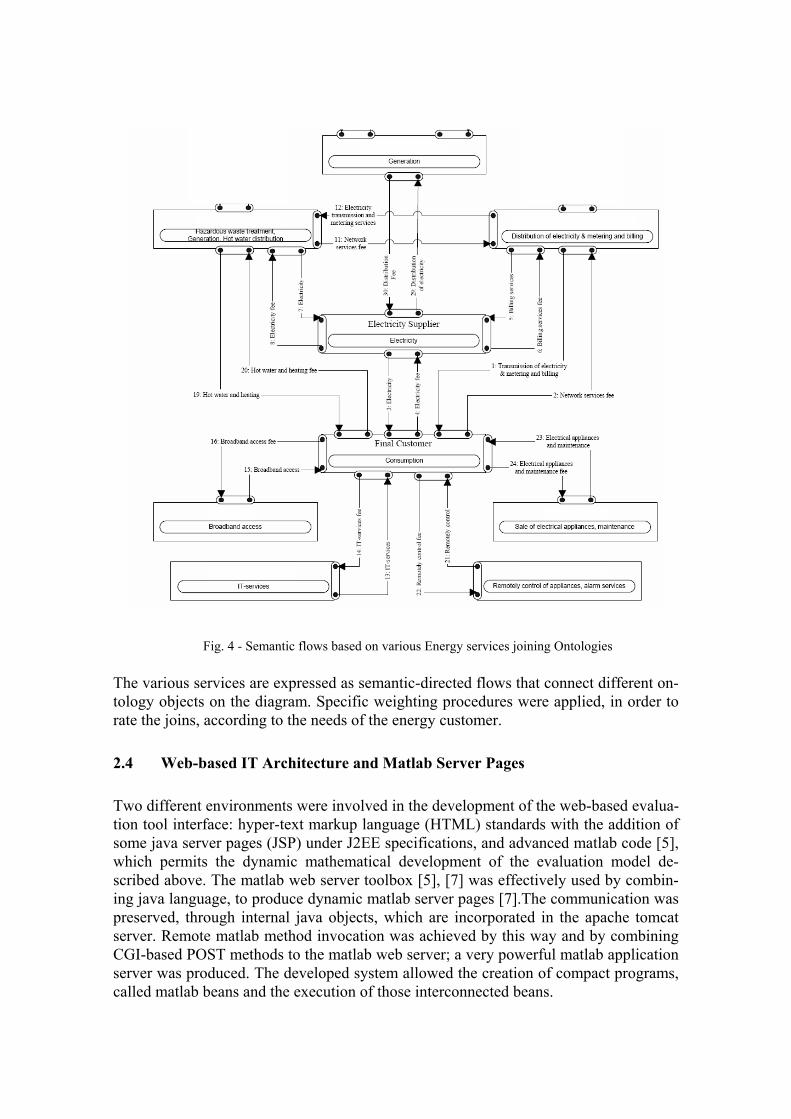
Fig. 4 - Semantic flows based on various Energy services joining Ontologies
The various services are expressed as semantic-directed flows that connect different on-tology objects on the diagram. Specific weighting procedures were applied, in order to rate the joins, according to the needs of the energy customer.
2.4 Web-based IT Architecture and Matlab Server Pages
Two different environments were involved in the development of the web-based evalua-tion tool interface: hyper-text markup language (HTML) standards with the addition of some java server pages (JSP) under J2EE specifications, and advanced matlab code [5], which permits the dynamic mathematical development of the evaluation model de-scribed above. The matlab web server toolbox [5], [7] was effectively used by combin-ing java language, to produce dynamic matlab server pages [7].The communication was preserved, through internal java objects, which are incorporated in the apache tomcat server. Remote matlab method invocation was achieved by this way and by combining CGI-based POST methods to the matlab web server; a very powerful matlab application server was produced. The developed system allowed the creation of compact programs, called matlab beans and the execution of those interconnected beans.
Energy Data Warehouse(DESMIE)
Energy DB Cluster
Energy DBCluster
GPRS
Telemetry
Application Server ClusterEMIR System
Matlab Clusters / J2EE Tomcat/JBoss
IIS/Tomcat
IIS/Tomcat
Load Balanced Tomcat/Matlab Web Servers
Central Storage
SSH/Internet
Matlab Server Pages (MSP.
JSP)
Fail-over
User
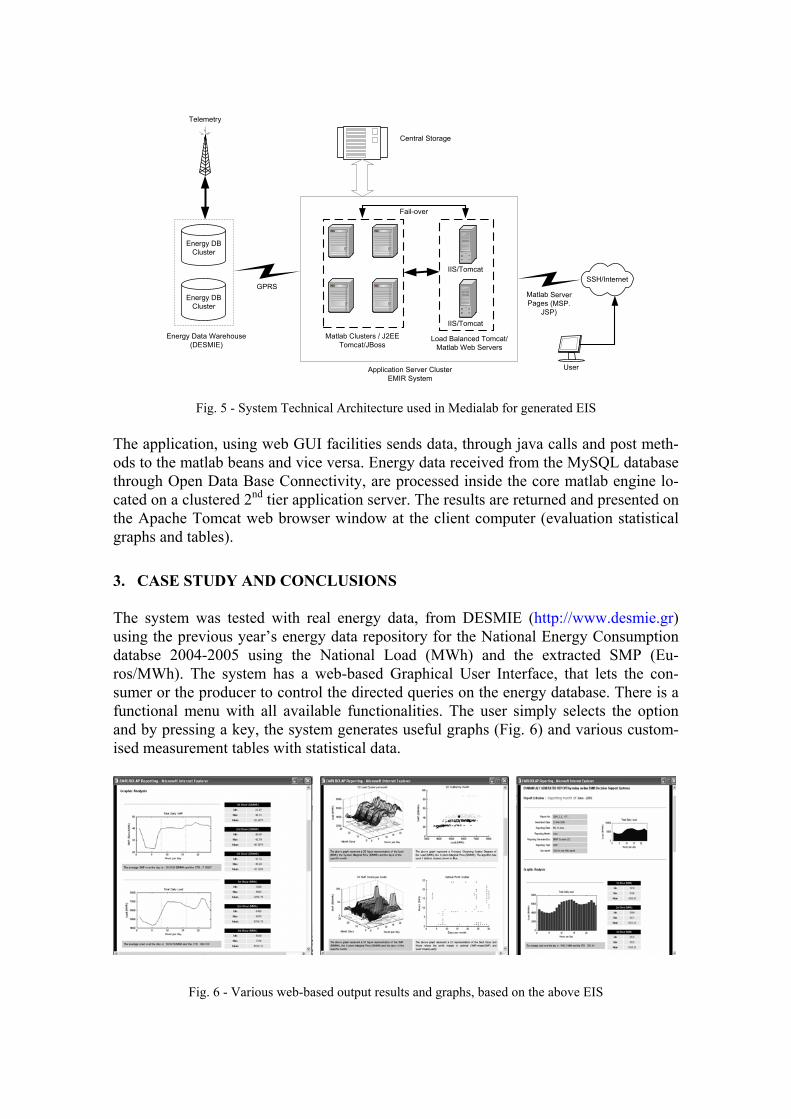
Fig. 5 - System Technical Architecture used in Medialab for generated EIS The application, using web GUI facilities sends data, through java calls and post meth-ods to the matlab beans and vice versa. Energy data received from the MySQL database through Open Data Base Connectivity, are processed inside the core matlab engine lo-cated on a clustered 2nd tier application server. The results are returned and presented on the Apache Tomcat web browser window at the client computer (evaluation statistical graphs and tables). 3. CASE STUDY AND CONCLUSIONS The system was tested with real energy data, from DESMIE (http://www.desmie.gr) using the previous year’s energy data repository for the National Energy Consumption databse 2004-2005 using the National Load (MWh) and the extracted SMP (Eu-ros/MWh). The system has a web-based Graphical User Interface, that lets the con-sumer or the producer to control the directed queries on the energy database. There is a functional menu with all available functionalities. The user simply selects the option and by pressing a key, the system generates useful graphs (Fig. 6) and various custom-ised measurement tables with statistical data.
Fig. 6 - Various web-based output results and graphs, based on the above EIS

So it can be said that traditionally most utility companies classified their customers ac-cording to a few electrical parameters and some commercial codes. In the liberalised electricity market, there is a strong need for classifying the electricity customers on the basis of indicators able to characterise their true electrical behaviour. A possible sce-nario of the interactions among customer and supplier could be the following:
• the customer comes to the supplier, states its type of activity and is assigned/free to choose a starting tariff; the supplier monitors the customer for a specified pe-riod (e.g., 3-6 months) and establishes a reference pattern for its load diagram;
• the supplier fits the reference pattern to one of the customer classes already de-fined and identifies the appropriate tariff;
Hence, the supplier performs a continuous monitoring of the daily load curves of all customers, periodically updates the reference patterns and the composition of the cus-tomer classes by automatic clustering and adjusts the tariffs applied to each customer class such as to maximise its foreseeable profits in the respect of possible price caps.
4. REFERENCES [1] E.M.I.R. Project (Energy Management & Intelligent Reporting) : http://fermat.medialab.ntua.gr/emir
[2] ‘Analyse et Simulation des méthodes de routage dans la topologie d’hypercube’,
Vassilis Nikolopoulos, mémoire, Ecole Polytechnique, promotion X99, 2002
[3] ‘Responsable d’équilibre - Règles et contractualisation’, RTE, France
[4] ‘Financial Analysis of Energy Systems’, Ε.Lekatsas, Chap.4 Pupl. ΤΕΕ 2000
[5] MATLAB Web Server. Natick, MA: The Mathworks Inc., 1999.
[6] ‘Code of Commerce’, MAVIR website http://www.mavir.hu
[7] ‘A web-based Energy Decision Support System for dynamic knowledge energy management and automatic intelligent
reporting (EMIR)’ paper under preparation for ELSEVIER Decision Support Systems, V.Nikolopoulos,, V.Loumos, 2006
[8] Newman MEJ. The structure and function of complex networks. Siam Rev 2003;45(2):167-256.
[9] Steyvers M, Tenenbaum JB. The large-scale structure of semantic networks: Statistical analyses and a model of
semantic growth. Cognitive Sci 2005;29(1):41-78.
[10] M.Emoult and F.Meslier, “Analysis and forecast of electrical energy demand”. RCE, No.4, 1982.
[11] Skantze, P., Chapman, J., Ilic, M.D., “Stochastic Modelling of Electric Power Prices in a Multi-Market Environ
ment”, Transactions of IEEE PES Winter Meeting, Singapore, January 2000.
[12] S.V.Allera and A.G.Horsburgh, “Load profiling for the energy trading and settlements in the UK electricity markets”,
Proc. DistribuTECH Europe DA/DSM Conference, London, 27-29 October 1998