Optimal Control Theory
20
Optimal Control Theory Batch Beer Fermentation
description
Optimal Control Theory. Batch Beer Fermentation. General Case. Min/max. General Case. Min Φ = Endpoint cost L =Lagrangian u = Control X= State. General Case. Min Φ = Endpoint cost- final product L =Lagrangian u = Control X= State. General Case. Min - PowerPoint PPT Presentation
Transcript of Optimal Control Theory
Optimal Control Theory
Batch Beer Fermentation
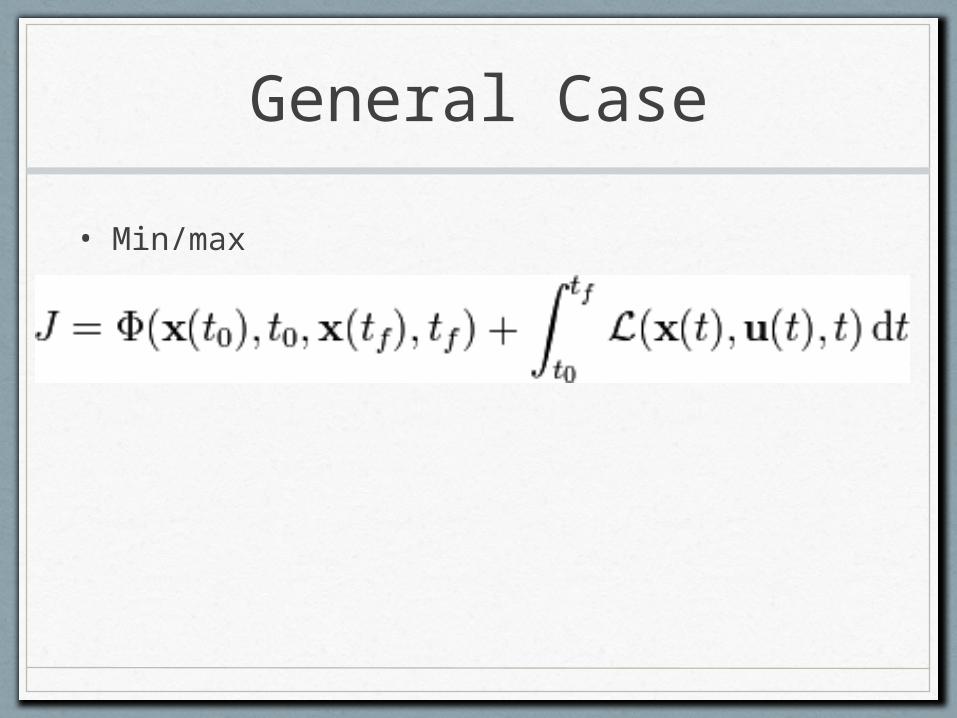
General Case
• Min/max
General Case
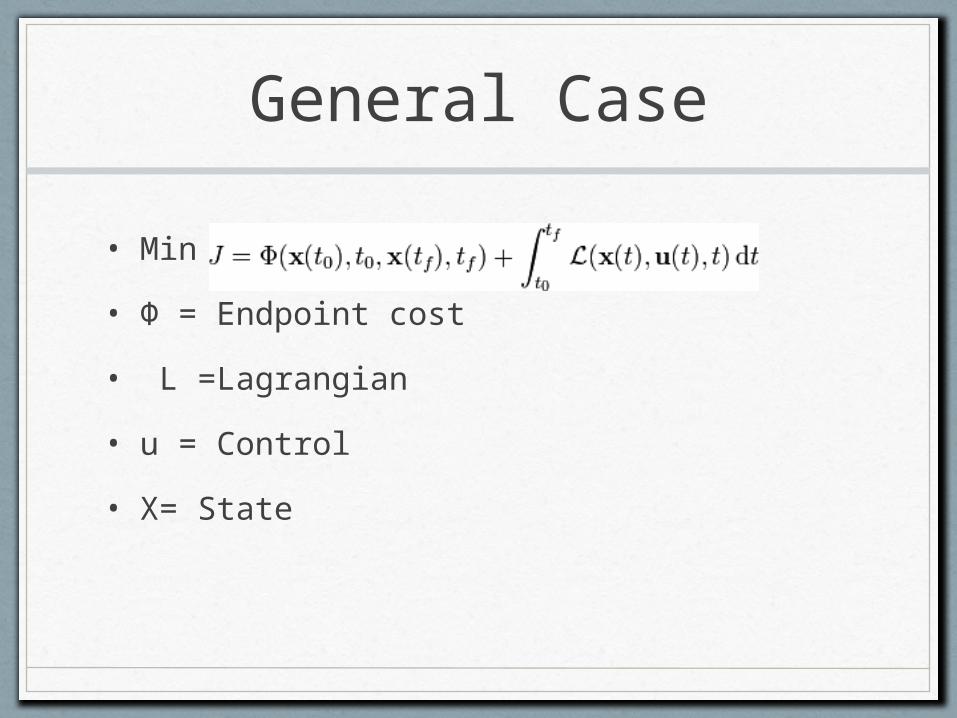
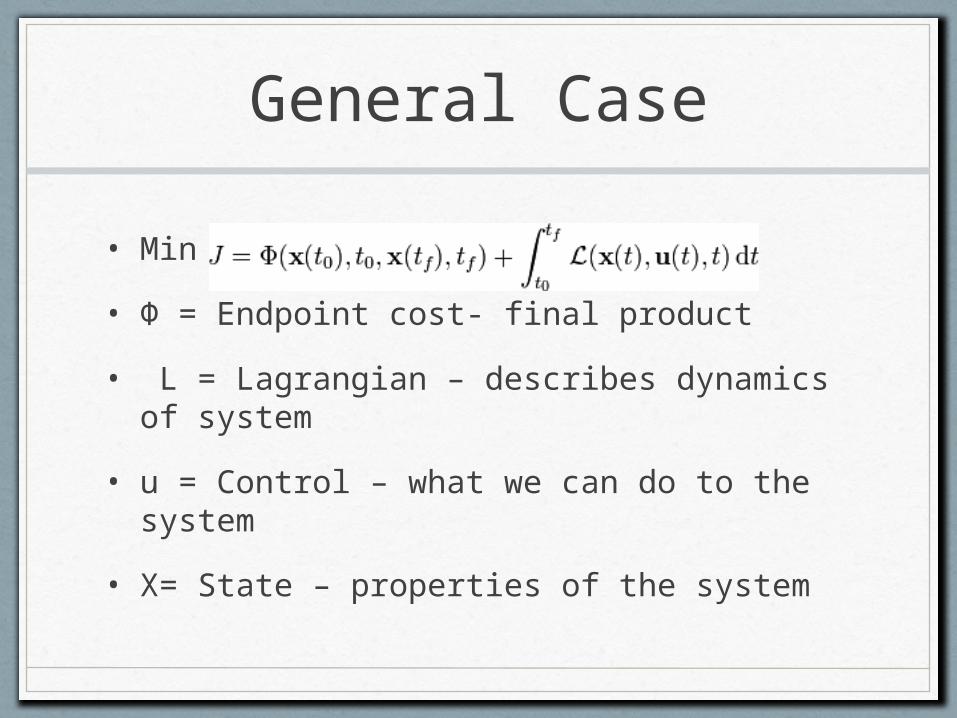
• Min
• Φ = Endpoint cost
• L =Lagrangian
• u = Control
• X= State
General Case
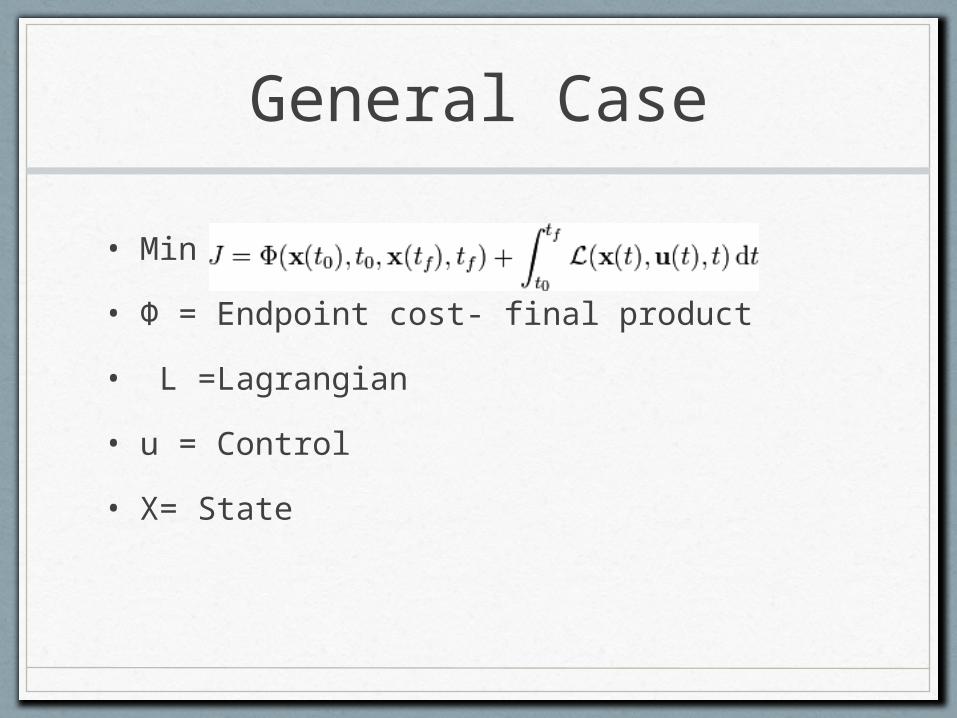
• Min
• Φ = Endpoint cost- final product
• L =Lagrangian
• u = Control
• X= State
General Case
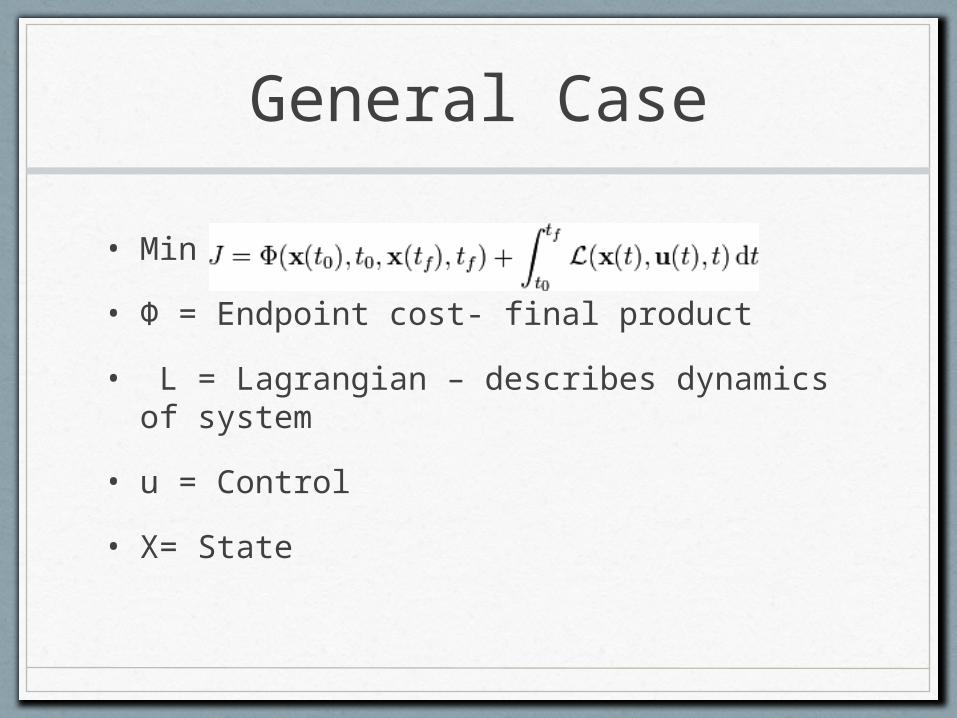
• Min
• Φ = Endpoint cost- final product
• L = Lagrangian – describes dynamics of system
• u = Control
• X= State
General Case
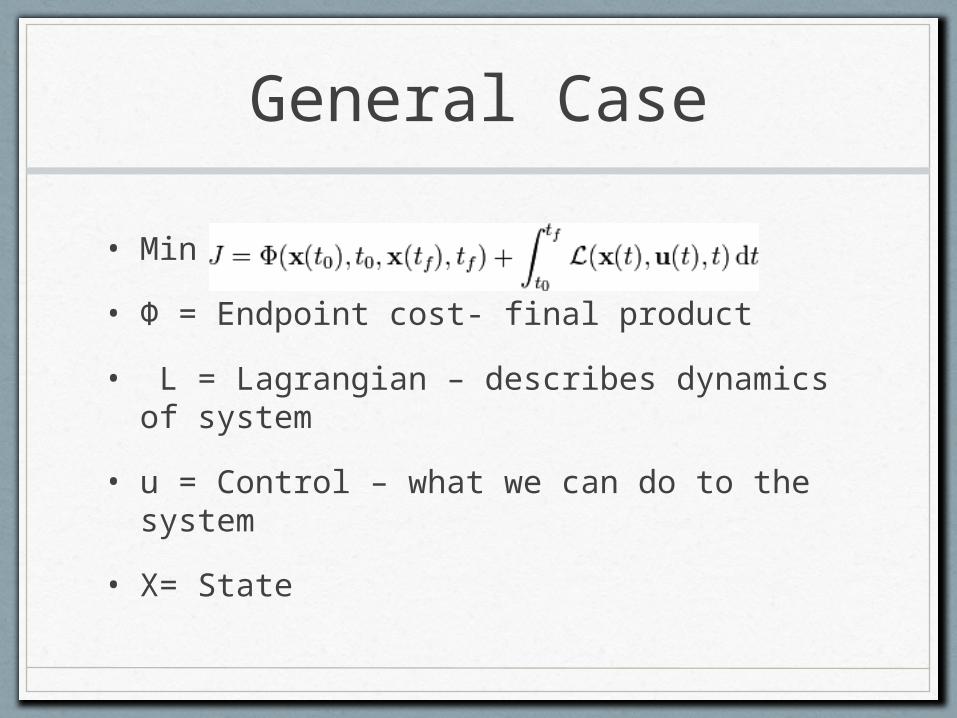
• Min
• Φ = Endpoint cost- final product
• L = Lagrangian – describes dynamics of system
• u = Control – what we can do to the system
• X= State
General Case
• Min
• Φ = Endpoint cost- final product
• L = Lagrangian – describes dynamics of system
• u = Control – what we can do to the system
• X= State – properties of the system
Case of Beer
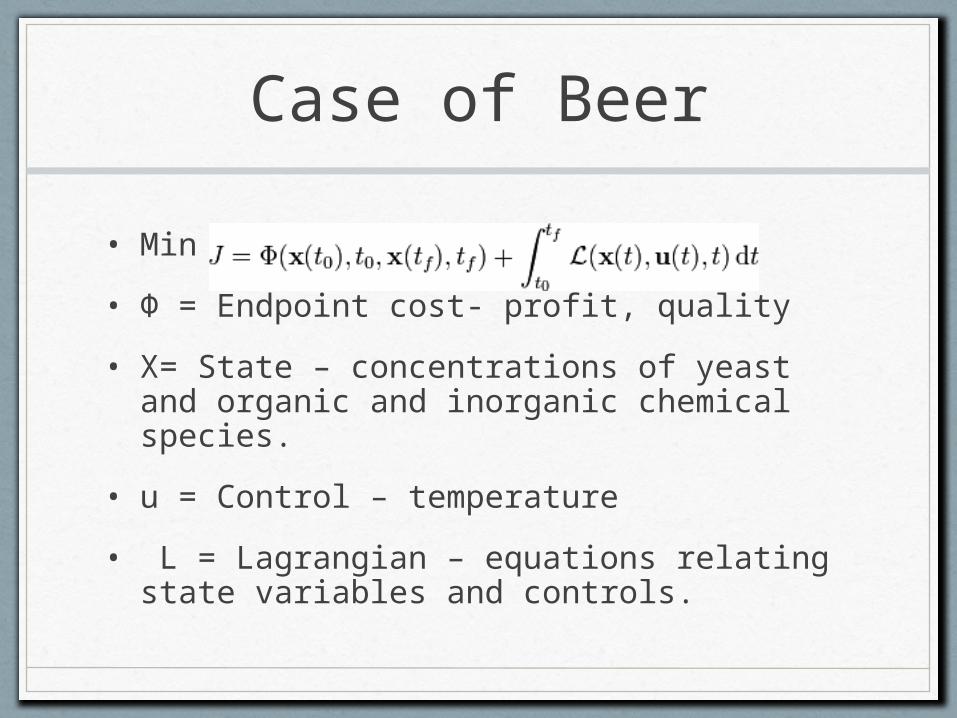
• Min
• Φ = Endpoint cost- profit, quality
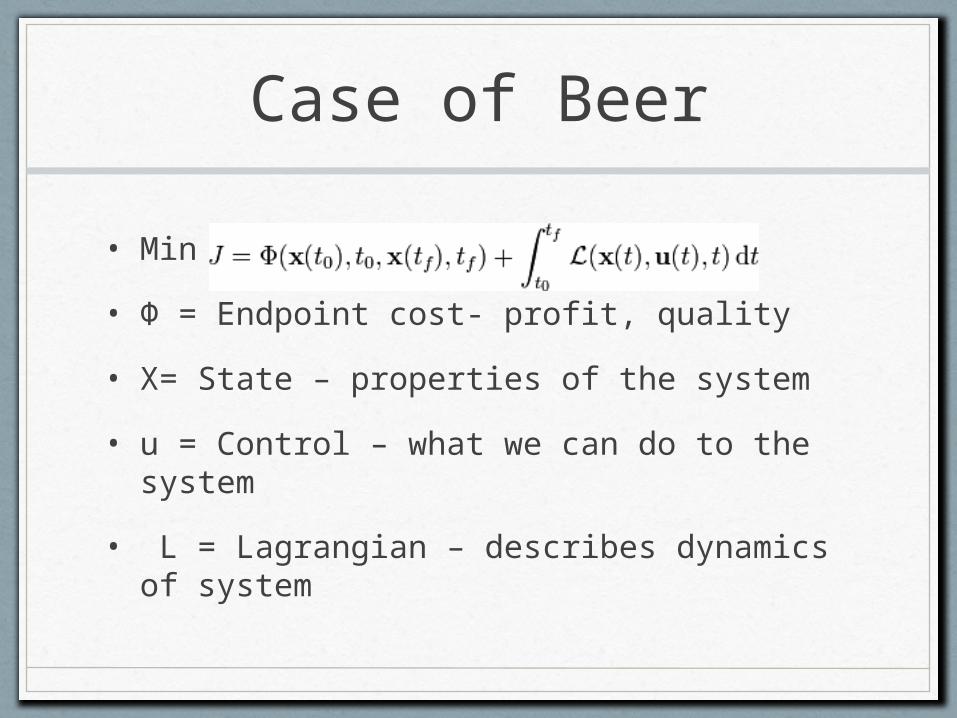
• X= State – properties of the system
• u = Control – what we can do to the system
• L = Lagrangian – describes dynamics of system
Case of Beer
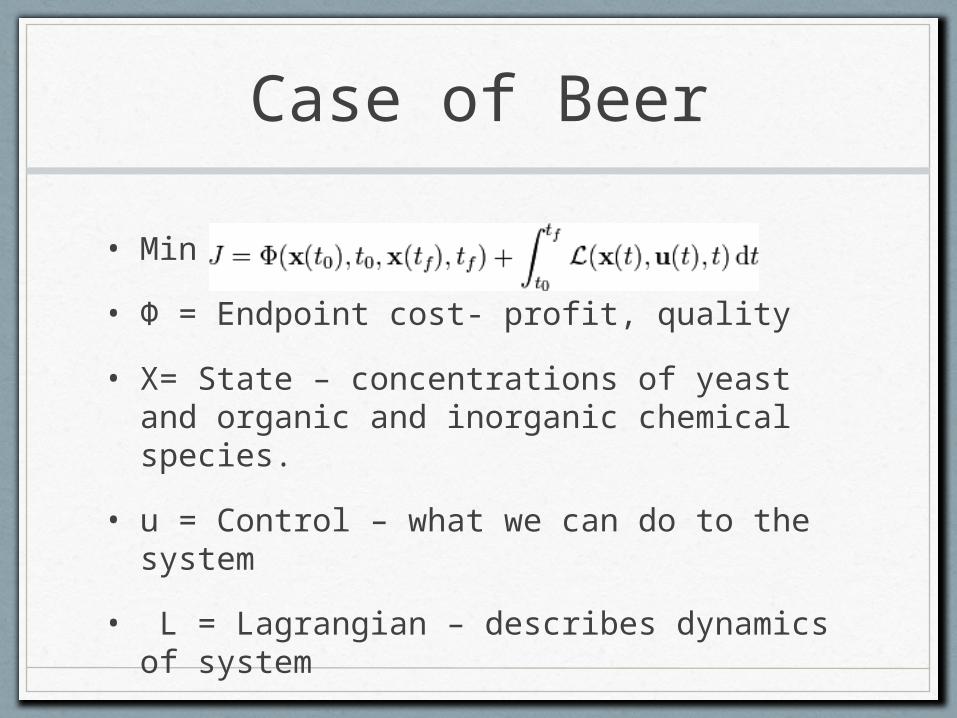
• Min
• Φ = Endpoint cost- profit, quality
• X= State – concentrations of yeast and organic and inorganic chemical species.
• u = Control – what we can do to the system
• L = Lagrangian – describes dynamics of system
Case of Beer
• Min
• Φ = Endpoint cost- profit, quality
• X= State – concentrations of yeast and organic and inorganic chemical species.
• u = Control – temperature
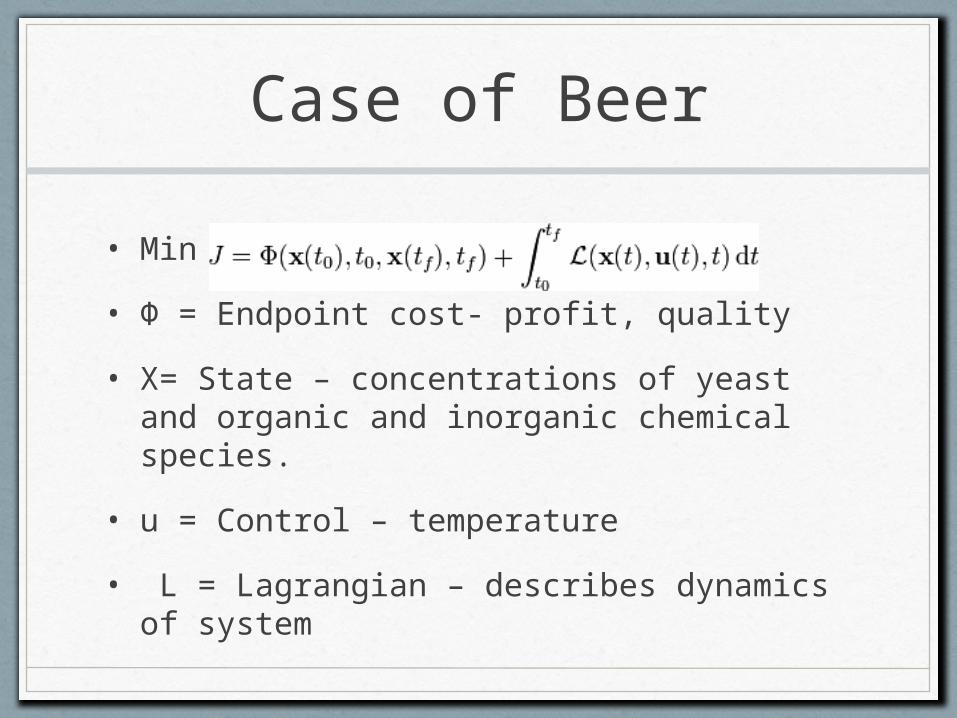
• L = Lagrangian – describes dynamics of system
Case of Beer
• Min
• Φ = Endpoint cost- profit, quality
• X= State – concentrations of yeast and organic and inorganic chemical species.
• u = Control – temperature
• L = Lagrangian – equations relating state variables and controls.
Quadratic Case
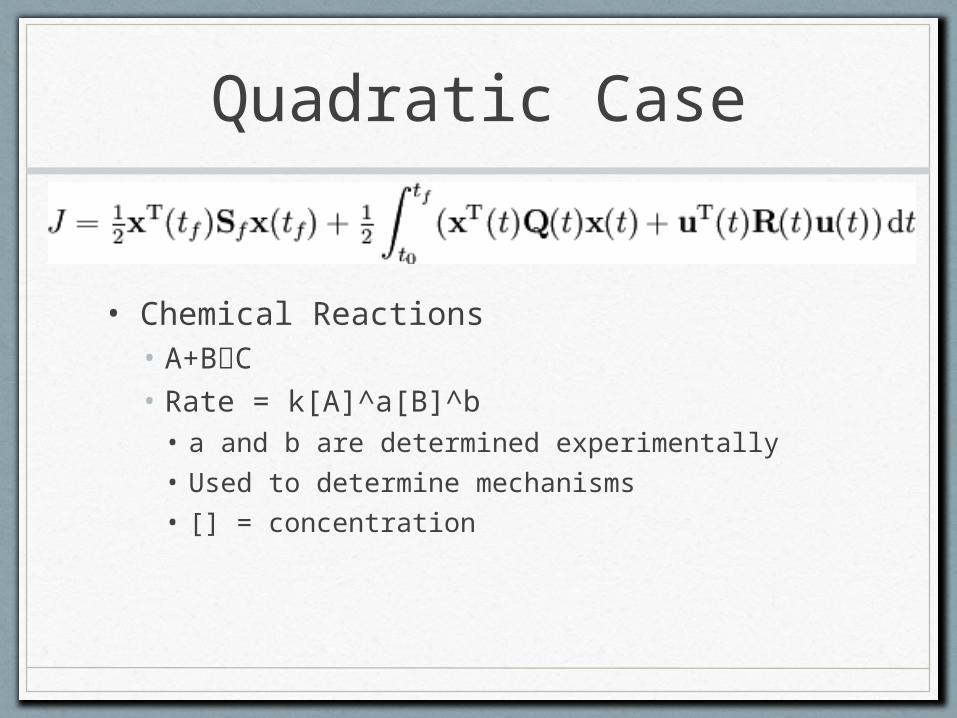
• Chemical Reactions• A+BC• Rate = k[A]^a[B]^b• a and b are determined experimentally• Used to determine mechanisms• [] = concentration
Beer Basics
Fermentation
• Yeast consume sugars and produce CO2 and ethanol.
• The yeast also produce other chemicals.
• Most side products are bad: ketones, aldehydes, sulfur compounds, other alcohols; however, esters are good.
• Main factors influencing side products are temperature, amino acids, and pH levels.
Controls
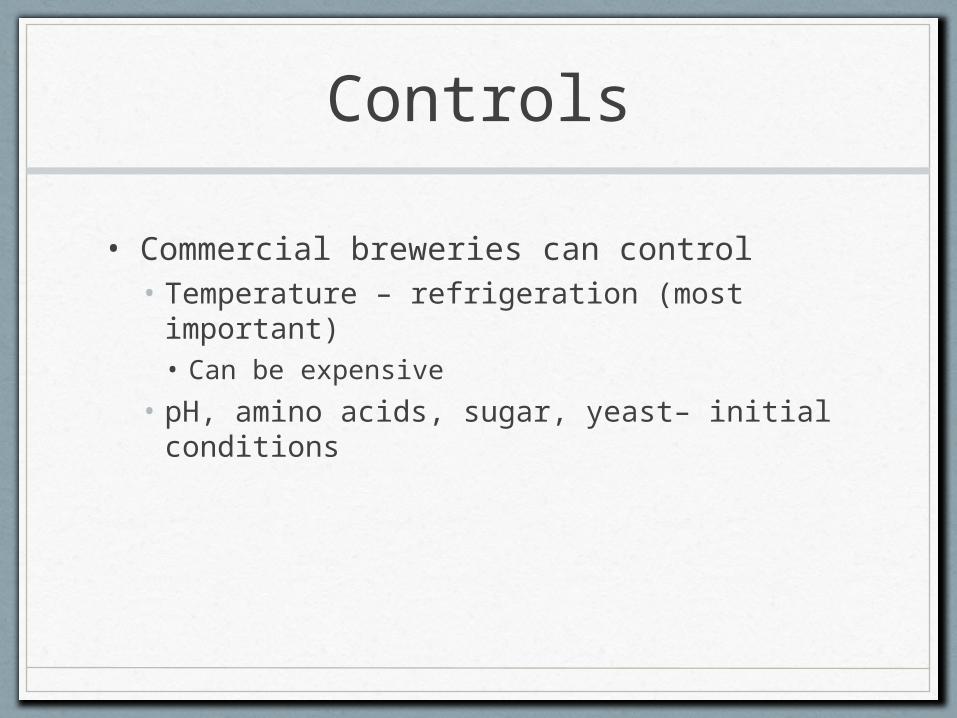
• Commercial breweries can control• Temperature – refrigeration (most important)• Can be expensive
• pH, amino acids, sugar, yeast– initial conditions
Optimization
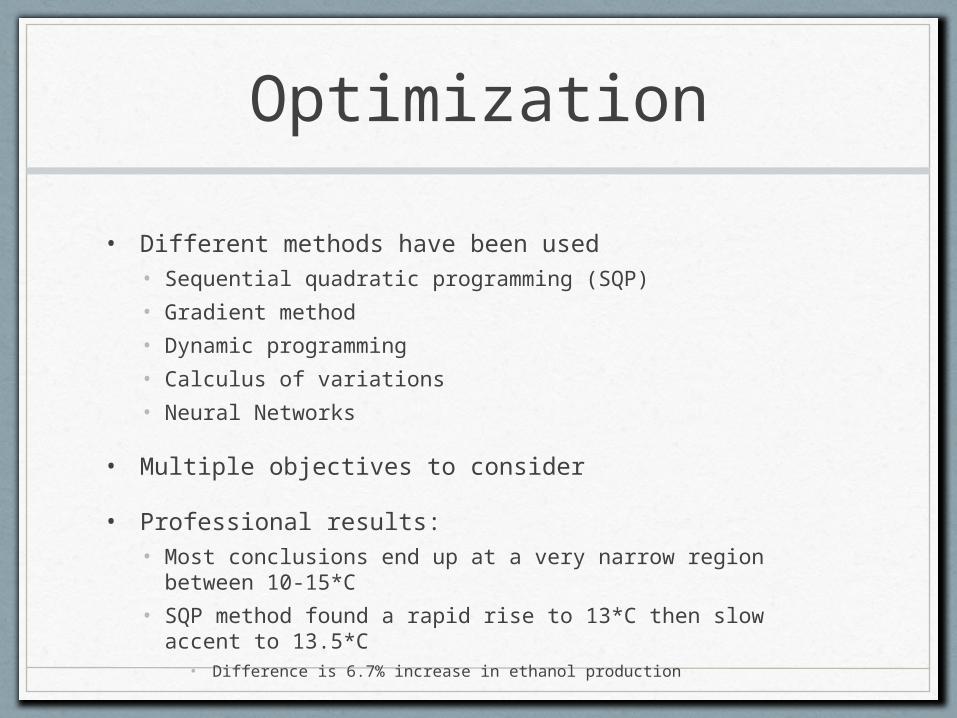
• Different methods have been used• Sequential quadratic programming (SQP)
• Gradient method
• Dynamic programming
• Calculus of variations
• Neural Networks
• Multiple objectives to consider
• Professional results:• Most conclusions end up at a very narrow region between 10-
15*C
• SQP method found a rapid rise to 13*C then slow accent to 13.5*C
• Difference is 6.7% increase in ethanol production
Simple Model
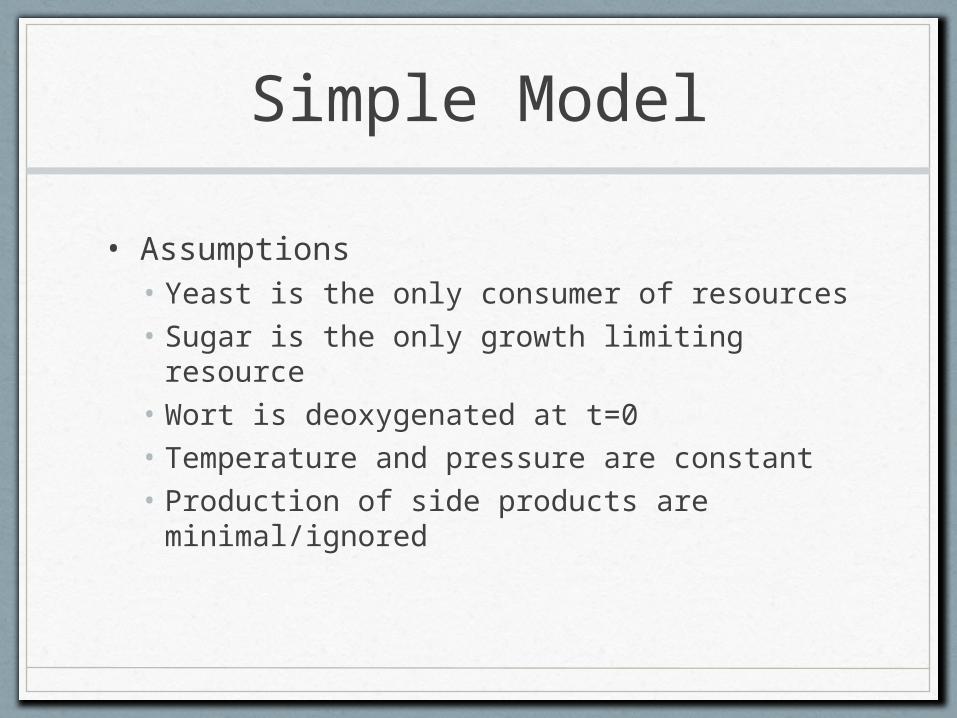
• Assumptions• Yeast is the only consumer of resources• Sugar is the only growth limiting resource• Wort is deoxygenated at t=0• Temperature and pressure are constant • Production of side products are
minimal/ignored
Simple model
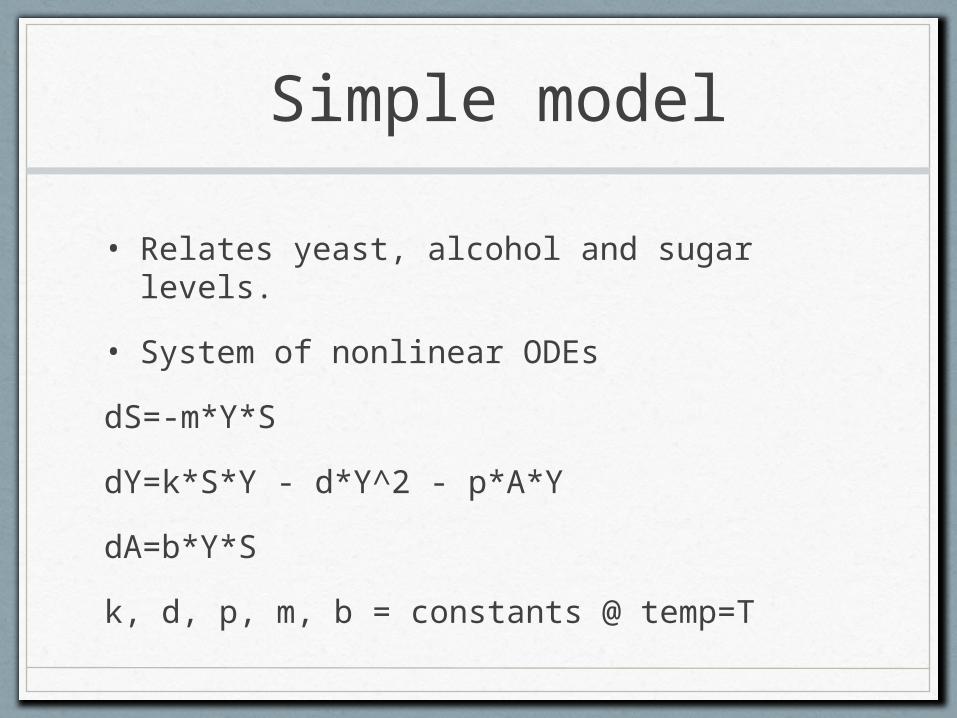
• Relates yeast, alcohol and sugar levels.
• System of nonlinear ODEs
dS=-m*Y*S
dY=k*S*Y - d*Y^2 - p*A*Y
dA=b*Y*S
k, d, p, m, b = constants @ temp=T
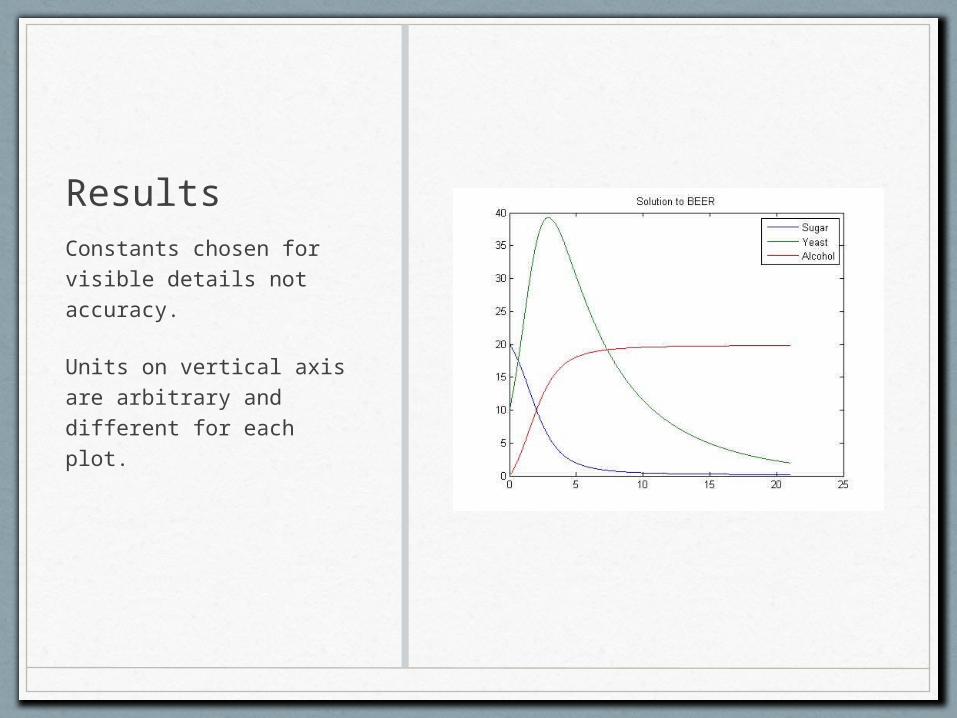
ResultsConstants chosen for visible details not accuracy.
Units on vertical axis are arbitrary and different for each plot.
Sources
• G.E. Carrillo-Ureta, P.D. Roberts, V.M. Becerra, Optimal Control of a Fermentation Process
• W. Fred Rameriz, Jan Maciejowski, Optimal Beer Fermentation
• Pascale B. Dengis, L.R. Ne´Lissen, Paul G. Rouxhet, mechanisms of yeast flocculation: comparison of top and bottom-fermenting strains, applied and environmental microbiology, Feb. 1995, p. 718-728, Vol. 61,No. 2
• http://en.wikipedia.org/wiki/Optimal_control
• Anatoly Zlotnik