4 Souvik Modi, Swetha M.G, Debanjan Goswami, Gagan D · PDF file48 addition of 3 μL of 0.5...
27
NATURE NANOTECHNOLOGY | www.nature.com/naturenanotechnology 1 SUPPLEMENTARY INFORMATION DOI: 10.1038/NNANO.2009.83 A DNA nanomachine that maps spatial and temporal 2 pH changes inside living cells 3 Souvik Modi, Swetha M.G, Debanjan Goswami, Gagan D Gupta, Satyajit Mayor, 4 Yamuna Krishnan * 5 Methods. 6 Materials. HPLC purified DNA oligonucleotides were used without further 7 purification whereas fluorescently modified oligonucleotides were ethanol 8 precipitated prior to further use. Nigericin, biotin labelled human holo-Transferrin and 9 Streptavidin were obtained from Sigma. FITC labelled dextran, Lysotracker™ red, 10 Mitotracker® Green were obtained from Molecular probes, Invitrogen. All other 11 reagents were purchased from Sigma-Aldrich unless otherwise specified. 12 Sample Preparation. Stock DNA solutions were prepared by dissolving lyophilized 13 DNA in Milli-Q water and stored at -20 o C until further use. 5 μM of O1, O2 and O3 14 were mixed in equimolar ratios in 20 mM potassium phosphate buffer of desired pH 15 containing 100 mM KCl. The resultant solution was heated to 90 o C for 5 minutes, 16 cooled to the room temperature over 3 hr at 5 o C/15 min and equilibrated at 4 o C 17 overnight. Prior to experiment, the solution was diluted to 80 nM in appropriate buffer 18 containing 100 mM KCl unless otherwise mentioned. 19 Circular Dichroism spectroscopy. All CD scans were performed on a JASCO J-815 20 spectrophotometer equipped with a temperature controller. A 5 μM stock of the I- 21 switch was annealed as described previously. Samples at pH 5 and 7.3 were prepared 22 at 20 mM potassium phosphate in 100 mM KCl as stated earlier. Samples were then 23 © 2009 Macmillan Publishers Limited. All rights reserved.
Transcript of 4 Souvik Modi, Swetha M.G, Debanjan Goswami, Gagan D · PDF file48 addition of 3 μL of 0.5...
nature nanotechnology | www.nature.com/naturenanotechnology 1
supplementary informationdoi: 10.1038/nnano.2009.83
NNANO-08101037 1
Supplementary Information for the paper 1
A DNA nanomachine that maps spatial and temporal 2
pH changes inside living cells 3
Souvik Modi, Swetha M.G, Debanjan Goswami, Gagan D Gupta, Satyajit Mayor, 4
Yamuna Krishnan* 5
Methods. 6
Materials. HPLC purified DNA oligonucleotides were used without further 7
purification whereas fluorescently modified oligonucleotides were ethanol 8
precipitated prior to further use. Nigericin, biotin labelled human holo-Transferrin and 9
Streptavidin were obtained from Sigma. FITC labelled dextran, Lysotracker™ red, 10
Mitotracker® Green were obtained from Molecular probes, Invitrogen. All other 11
reagents were purchased from Sigma-Aldrich unless otherwise specified. 12
Sample Preparation. Stock DNA solutions were prepared by dissolving lyophilized 13
DNA in Milli-Q water and stored at -20oC until further use. 5 μM of O1, O2 and O3 14
were mixed in equimolar ratios in 20 mM potassium phosphate buffer of desired pH 15
containing 100 mM KCl. The resultant solution was heated to 90oC for 5 minutes, 16
cooled to the room temperature over 3 hr at 5oC/15 min and equilibrated at 4oC 17
overnight. Prior to experiment, the solution was diluted to 80 nM in appropriate buffer 18
containing 100 mM KCl unless otherwise mentioned. 19
Circular Dichroism spectroscopy. All CD scans were performed on a JASCO J-815 20
spectrophotometer equipped with a temperature controller. A 5 μM stock of the I-21
switch was annealed as described previously. Samples at pH 5 and 7.3 were prepared 22
at 20 mM potassium phosphate in 100 mM KCl as stated earlier. Samples were then 23
© 2009 Macmillan Publishers Limited. All rights reserved.
2 nature nanotechnology | www.nature.com/naturenanotechnology
supplementary information doi: 10.1038/nnano.2009.83
NNANO-08101037 2
diluted to 1 μM in the appropriate buffer and equilibrated for an hour and are 24
presented as an average of 5 successive scans. 25
Steady state fluorescence measurements. All fluorescence spectra were measured 26
on a Jasco-815 CD spectrometer with an inbuilt fluorimeter. Fluorescently labelled I-27
switch containing O1 labelled with Alexa 488 (O1-488) and O2 labelled with Alexa 28
647 (O2-647) were prepared as stock solution of 5 μM stock in 20 mM pH 5.5 29
potassium phosphate, 100 mM KCl. Samples were diluted to 80 nM in appropriate 30
buffer for all fluorescence experiments. The samples were excited at 488 nm and 31
emission collected between 505 nm-750 nm. FRET efficiencies were calculated using 32
the formula, E = 1 – IDA/ID = 1/[1+(R/Ro)6], where ID is the intensity of the donor in 33
the absence of the acceptor, IDA is the intensity of the donor in the presence of the 34
acceptor, Ro is the Förster’s distance and R is the interfluorophore distance. Ro for 35
Alexa 488 and Alexa 647 was taken as 50 Å. 36
FRET pair used in the study: We have used three different FRET pairs in this study. 37
Alexa 546-Alexa 647 was used to characterize the closing and opening of I-switch by 38
pH cycling as well as to confirm the conformation of the closed state. Bodipy TMR-39
Alexa 647 was used in the following cases only (i) a distinct FRET pair to confirm 40
that the pH profile of the I-switch is not due to dye sensitivity, but due to i-motif 41
formation (ii) colocalization studies of I-switch with FITC dextran, (iii) colocalization 42
studies of I-switch in Rab 5-GFP expressing hemocytes and (iv) to prove integrity of 43
the I-switch scaffold under the conditions used. For all other studies, Alexa 488-Alexa 44
647 labeled I-switch was used. 45
pH cycling. pH cycling experiments were performed on a Fluorolog-Spex 46
spectrophotometer. I-switch (5 nM) was cycled between pH 5 to pH by the alternate 47
addition of 3 μL of 0.5 N HCl and 4 μL of 0.5 N KOH respectively. 48
© 2009 Macmillan Publishers Limited. All rights reserved.
nature nanotechnology | www.nature.com/naturenanotechnology 3
supplementary informationdoi: 10.1038/nnano.2009.83
NNANO-08101037 2
diluted to 1 μM in the appropriate buffer and equilibrated for an hour and are 24
presented as an average of 5 successive scans. 25
Steady state fluorescence measurements. All fluorescence spectra were measured 26
on a Jasco-815 CD spectrometer with an inbuilt fluorimeter. Fluorescently labelled I-27
switch containing O1 labelled with Alexa 488 (O1-488) and O2 labelled with Alexa 28
647 (O2-647) were prepared as stock solution of 5 μM stock in 20 mM pH 5.5 29
potassium phosphate, 100 mM KCl. Samples were diluted to 80 nM in appropriate 30
buffer for all fluorescence experiments. The samples were excited at 488 nm and 31
emission collected between 505 nm-750 nm. FRET efficiencies were calculated using 32
the formula, E = 1 – IDA/ID = 1/[1+(R/Ro)6], where ID is the intensity of the donor in 33
the absence of the acceptor, IDA is the intensity of the donor in the presence of the 34
acceptor, Ro is the Förster’s distance and R is the interfluorophore distance. Ro for 35
Alexa 488 and Alexa 647 was taken as 50 Å. 36
FRET pair used in the study: We have used three different FRET pairs in this study. 37
Alexa 546-Alexa 647 was used to characterize the closing and opening of I-switch by 38
pH cycling as well as to confirm the conformation of the closed state. Bodipy TMR-39
Alexa 647 was used in the following cases only (i) a distinct FRET pair to confirm 40
that the pH profile of the I-switch is not due to dye sensitivity, but due to i-motif 41
formation (ii) colocalization studies of I-switch with FITC dextran, (iii) colocalization 42
studies of I-switch in Rab 5-GFP expressing hemocytes and (iv) to prove integrity of 43
the I-switch scaffold under the conditions used. For all other studies, Alexa 488-Alexa 44
647 labeled I-switch was used. 45
pH cycling. pH cycling experiments were performed on a Fluorolog-Spex 46
spectrophotometer. I-switch (5 nM) was cycled between pH 5 to pH by the alternate 47
addition of 3 μL of 0.5 N HCl and 4 μL of 0.5 N KOH respectively. 48
NNANO-08101037 3
Time resolved Fluorescence measurement. Time resolved experiments were 49
measured in Zeiss LSM 5 Meta multiphoton set up. Briefly, fluorophores excited by 50
multiphoton excitation were built on a Zeiss LSM 510 Meta microscope (Carl Zeiss, 51
http://www.zeiss.com) with 63× 1.4 numerical aperture (NA) objective coupled to the 52
femtosecond-pulsed Tsunami Titanium:Sapphire tunable pulsed laser. Fluorescence 53
was collected in Hamamatsu R3809U multi-channel plate photomultiplier tubes 54
(PMTs; Hamamatsu Photonics, http://www.hamamatsu.com) while TCSPC was 55
accomplished using a Becker & Hickl 830 card (Becker and Hickl, 56
http://www.becker-hickl). For multiphoton excitation of Alexa 488, 720 nm excitation 57
wavelength was used. The repetition rate of the pulsed laser is 80.09 MHz (12 ns). 58
The instrument response function (IRF) was calculated from 10–16-nm gold particles 59
dried on a coverslip as a second harmonic generator; full width at half maximum 60
(FWHM) of IRF is approximately 60 ps. Experimentally measured fluorescence 61
decay is a convolution of the IRF with the intensity decay function. Average lifetimes 62
at different pH were obtained from the intensity decay data were fit to the appropriate 63
equations by an iterative reconvolution procedure using a Levenberg-Marquardt 64
minimization algorithm34. 65
Cell culture and labelling. Hemocytes were obtained from wandering third instar 66
Drosophila larvae as described previously. Briefly, larvae were surface sterilized and 67
then punctured to release the hemolymph into complete insect medium that is 68
composed of Schneider’s insect medium supplemented with 10% non-heat inactivated 69
FBS, 1 �g/ml bovine pancreatic insulin, 150 �g/ml penicillin, 250 �g/ml 70
streptomycin, 750 �g/ml glutamine. The medium is then plated onto 35 mm coverslip 71
dishes. Labeling of cells with fluorophores was performed 1.5 hours after dissection. 72
Cells were washed with Medium 1 prior to labeling. For pH measurement 73
experiments, cells were imaged live, after chasing the probes for the stated timepoints. 74
© 2009 Macmillan Publishers Limited. All rights reserved.
4 nature nanotechnology | www.nature.com/naturenanotechnology
supplementary information doi: 10.1038/nnano.2009.83
NNANO-08101037 4
The pH standard curve was generated in cells by briefly fixing cells (for 1minute) 75
with 2.5% paraformaldehyde (PF) and then adding the ionophore, nigericin along 76
with medium 1 buffered to appropriate pH (ranging from 5-7). For colocalization 77
experiments cells were fixed with 2.5% Pf for 20 minutes. For colocalization of Rab5 78
with the sensor, transgenic flies expressing Rab5GFP were crossed to flies expressing 79
Heme-Gal4 and GFP positive progeny were used for hemocyte cell culture. Stable 80
line of Drosophila SR+ cells expressing the human Transferrin receptor (Gupta et al, 81
unpublished) were used for labeling experiments. Cells were labeled on ice with the 82
switch conjugated to biotinylated Transferrin (Sigma), and then pulsed at room 83
temperature for 15 minutes. Cells were then moved to ice and the treated with low pH 84
ascorbate buffer to remove the remaining receptor-bound ligands. The Transferrin 85
conjugated with the switch was imaged after fixation with 2.5% formaldehyde. 86
Fluorescence microscopy and image analysis. All the wide-field images were 87
collected using a Nikon inverted microscope equipped with 60×, 1.4 NA objectives, a 88
mercury arc illuminator (Nikon, Japan), and a cooled CCD camera (Andor, USA) 89
controlled by Metamorph software (Universal Imaging, PA). Three sets of images 90
were taken corresponding to (I) image at donor emission wavelength upon donor 91
excitation (donor image), (II) image at acceptor emission wavelength (acceptor 92
FRET) upon donor excitation and and (III) image at acceptor emission wavelength 93
(Acceptor image) acceptor excitation. Confocal imaging was carried out on an 94
Olympus Fluoview 1000 confocal microscope (Olympus, Japan) using an Argon ion 95
laser for 488 nm excitation and He-Ne laser for 543 excitation with a set dichroics, 96
excitation, and emission filters suitable for each fluorophore. Cross talk and bleed-97
through were measured with donor only and acceptor only species and found to be 98
negligible for Alexa 488-647 pair. Autofluorescence was measured on unlabelled 99
cells. All the images were then background subtracted taking mean intensity over a 100
large cell free area. Donor and acceptor images were colocalized and endosomes 101
© 2009 Macmillan Publishers Limited. All rights reserved.
nature nanotechnology | www.nature.com/naturenanotechnology 5
supplementary informationdoi: 10.1038/nnano.2009.83
NNANO-08101037 4
The pH standard curve was generated in cells by briefly fixing cells (for 1minute) 75
with 2.5% paraformaldehyde (PF) and then adding the ionophore, nigericin along 76
with medium 1 buffered to appropriate pH (ranging from 5-7). For colocalization 77
experiments cells were fixed with 2.5% Pf for 20 minutes. For colocalization of Rab5 78
with the sensor, transgenic flies expressing Rab5GFP were crossed to flies expressing 79
Heme-Gal4 and GFP positive progeny were used for hemocyte cell culture. Stable 80
line of Drosophila SR+ cells expressing the human Transferrin receptor (Gupta et al, 81
unpublished) were used for labeling experiments. Cells were labeled on ice with the 82
switch conjugated to biotinylated Transferrin (Sigma), and then pulsed at room 83
temperature for 15 minutes. Cells were then moved to ice and the treated with low pH 84
ascorbate buffer to remove the remaining receptor-bound ligands. The Transferrin 85
conjugated with the switch was imaged after fixation with 2.5% formaldehyde. 86
Fluorescence microscopy and image analysis. All the wide-field images were 87
collected using a Nikon inverted microscope equipped with 60×, 1.4 NA objectives, a 88
mercury arc illuminator (Nikon, Japan), and a cooled CCD camera (Andor, USA) 89
controlled by Metamorph software (Universal Imaging, PA). Three sets of images 90
were taken corresponding to (I) image at donor emission wavelength upon donor 91
excitation (donor image), (II) image at acceptor emission wavelength (acceptor 92
FRET) upon donor excitation and and (III) image at acceptor emission wavelength 93
(Acceptor image) acceptor excitation. Confocal imaging was carried out on an 94
Olympus Fluoview 1000 confocal microscope (Olympus, Japan) using an Argon ion 95
laser for 488 nm excitation and He-Ne laser for 543 excitation with a set dichroics, 96
excitation, and emission filters suitable for each fluorophore. Cross talk and bleed-97
through were measured with donor only and acceptor only species and found to be 98
negligible for Alexa 488-647 pair. Autofluorescence was measured on unlabelled 99
cells. All the images were then background subtracted taking mean intensity over a 100
large cell free area. Donor and acceptor images were colocalized and endosomes 101
NNANO-08101037 5
showing good colocalization were analysed using ImageJ and total intensity as well as 102
mean intensity in each endosome was measured in donor and acceptor channels. A 103
ratio of donor to acceptor intensities (D/A) was obtained from. Five independent 104
measurements were presented as the mean± standard error (s.e.m). 105
Ratiometric pH measurements. The in vitro pH calibration profile was obtained on 106
A JASCO-815 CD spectrometer. I-switch at 80 nM was prepared in buffers of 107
different pH values from 4 to 7.3. Measurements from two independent samples were 108
taken at given pH and the mean donor intensity (D) at 520 nm and mean acceptor 109
intensity (A) at 665 nm were recorded. D/A values at each pH were plotted as a 110
function of pH to give the in vitro calibration curve. Error bars were representative of 111
the standard error between five independent measurements. For the intracellular pH 112
calibration curve, cells were pulsed, chased for 5 min, washed, incubated with 10 μM 113
Nigericin in buffers at a given pH and then mildly fixed. Donor and acceptor FRET 114
images were acquired as described earlier from which D/A ratios were obtained. The 115
mean D/A of individual endosomes with associated s.e.m at each pH were plotted as a 116
function of pH for the intracellular pH calibration curve. Spatiotemporal pH changes 117
were followed by comparing the spread in D/A values of ~ 80 endosomes for 5 118
independent experiments at the specified chase time to the calibration curve. 119
Time dependent pH measurement data was generated by imaging different portions 120
on a single coverslip over 2 h with a time interval of 5 minutes each, such that each 121
time frame has five images covering five different places in the coverslip. From those 122
five fields of view, 40 endosomes at each time point were quantified and mean D/A 123
(for two independent experiment) ± s.e.m was calculated and plotted over time. 124
Protein Conjugation of I-switch. For conjugation to Transferrin, I-switch 125
incorporated with a biotin label was used.O1-488 and O2-647 was hybridized with 5’-126
Biotinylated O3 in pH 5.5 phosphate buffer. 5 μL of 5 μM biotinylated switch (IB) 127
© 2009 Macmillan Publishers Limited. All rights reserved.
6 nature nanotechnology | www.nature.com/naturenanotechnology
supplementary information doi: 10.1038/nnano.2009.83
NNANO-08101037 6
was diluted 2 fold with PBS pH 7.4 and to it 5 μL of Streptavidin (1 mg/ml) was 128
added slowly and incubated at room temperature for 1 hr. Conjugation (IB-SA) was 129
confirmed by agarose gel electrophoresis (3%). This conjugate (IB-SA) was further 130
conjugated with biotinylated holo-Transferrin (TfB) similarly in a 1:2 ratio. Excess 131
Biocytin (1 nanomole) was added after 1 h to the solution to prevent aggregation. 132
Formation of Transferrin conjugated I-switch (IB-SA-TfB) was confirmed by gel 133
electrophoresis. The presence of Transferrin with the sensor was confirmed by 134
colocalization experiments and by competing out the sensor with Alexa-568 labeled 135
as well as unlabeled Transferrin. 136
137
138
© 2009 Macmillan Publishers Limited. All rights reserved.
nature nanotechnology | www.nature.com/naturenanotechnology 7
supplementary informationdoi: 10.1038/nnano.2009.83
NNANO-08101037 6
was diluted 2 fold with PBS pH 7.4 and to it 5 μL of Streptavidin (1 mg/ml) was 128
added slowly and incubated at room temperature for 1 hr. Conjugation (IB-SA) was 129
confirmed by agarose gel electrophoresis (3%). This conjugate (IB-SA) was further 130
conjugated with biotinylated holo-Transferrin (TfB) similarly in a 1:2 ratio. Excess 131
Biocytin (1 nanomole) was added after 1 h to the solution to prevent aggregation. 132
Formation of Transferrin conjugated I-switch (IB-SA-TfB) was confirmed by gel 133
electrophoresis. The presence of Transferrin with the sensor was confirmed by 134
colocalization experiments and by competing out the sensor with Alexa-568 labeled 135
as well as unlabeled Transferrin. 136
137
138
NNANO-08101037 7
139
140
141
142
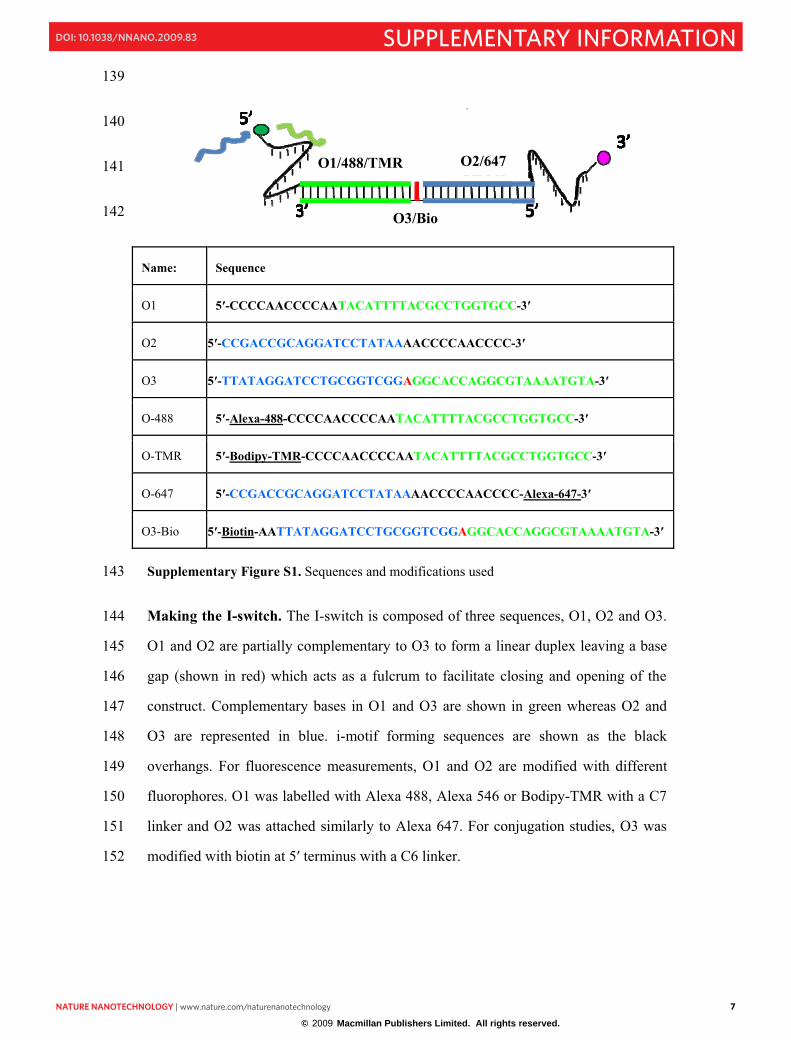
Supplementary Figure S1. Sequences and modifications used 143
Making the I-switch. The I-switch is composed of three sequences, O1, O2 and O3. 144
O1 and O2 are partially complementary to O3 to form a linear duplex leaving a base 145
gap (shown in red) which acts as a fulcrum to facilitate closing and opening of the 146
construct. Complementary bases in O1 and O3 are shown in green whereas O2 and 147
O3 are represented in blue. i-motif forming sequences are shown as the black 148
overhangs. For fluorescence measurements, O1 and O2 are modified with different 149
fluorophores. O1 was labelled with Alexa 488, Alexa 546 or Bodipy-TMR with a C7 150
linker and O2 was attached similarly to Alexa 647. For conjugation studies, O3 was 151
modified with biotin at 5� terminus with a C6 linker. 152
Name: Sequence
O1 5�-CCCCAACCCCAATACATTTTACGCCTGGTGCC-3�
O2 5�-CCGACCGCAGGATCCTATAAAACCCCAACCCC-3�
O3 5�-TTATAGGATCCTGCGGTCGGAGGCACCAGGCGTAAAATGTA-3�
O-488 5�-Alexa-488-CCCCAACCCCAATACATTTTACGCCTGGTGCC-3�
O-TMR 5�-Bodipy-TMR-CCCCAACCCCAATACATTTTACGCCTGGTGCC-3�
O-647 5�-CCGACCGCAGGATCCTATAAAACCCCAACCCC-Alexa-647-3�
O3-Bio 5�-Biotin-AATTATAGGATCCTGCGGTCGGAGGCACCAGGCGTAAAATGTA-3�
O2/647 O1/488/TMR
O3/Bio
© 2009 Macmillan Publishers Limited. All rights reserved.
8 nature nanotechnology | www.nature.com/naturenanotechnology
supplementary information doi: 10.1038/nnano.2009.83
NNANO-08101037 8
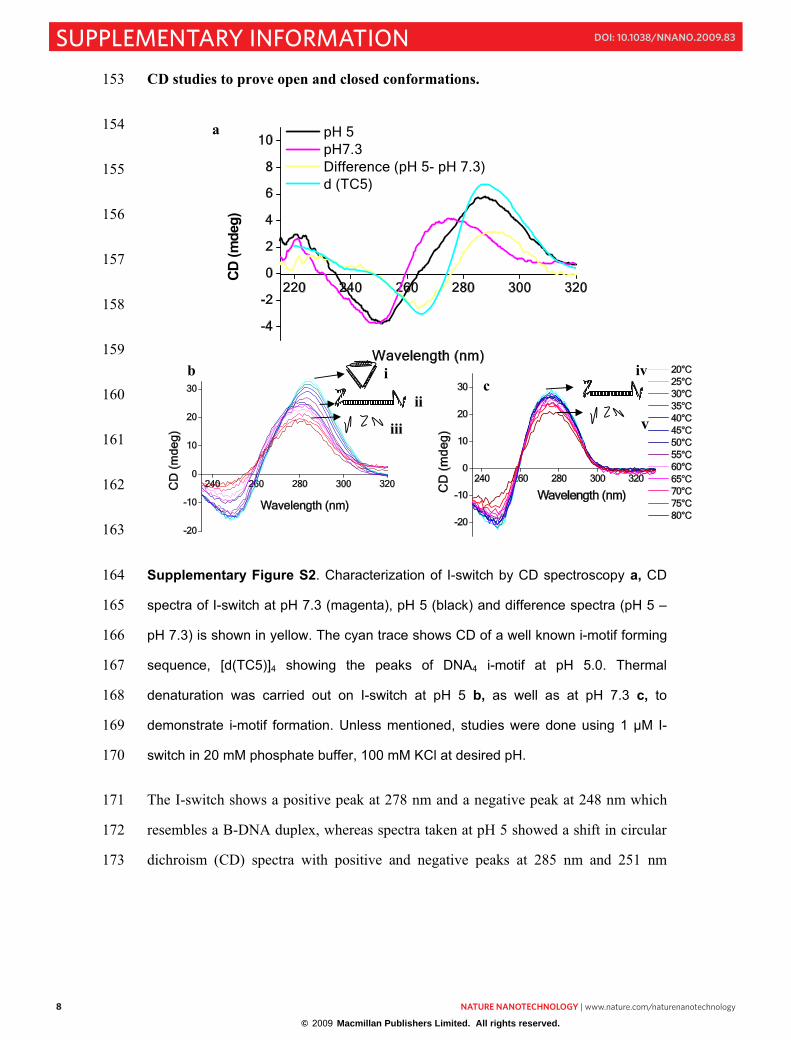
CD studies to prove open and closed conformations. 153
154
155
156
157
158
159
160
161
162
163
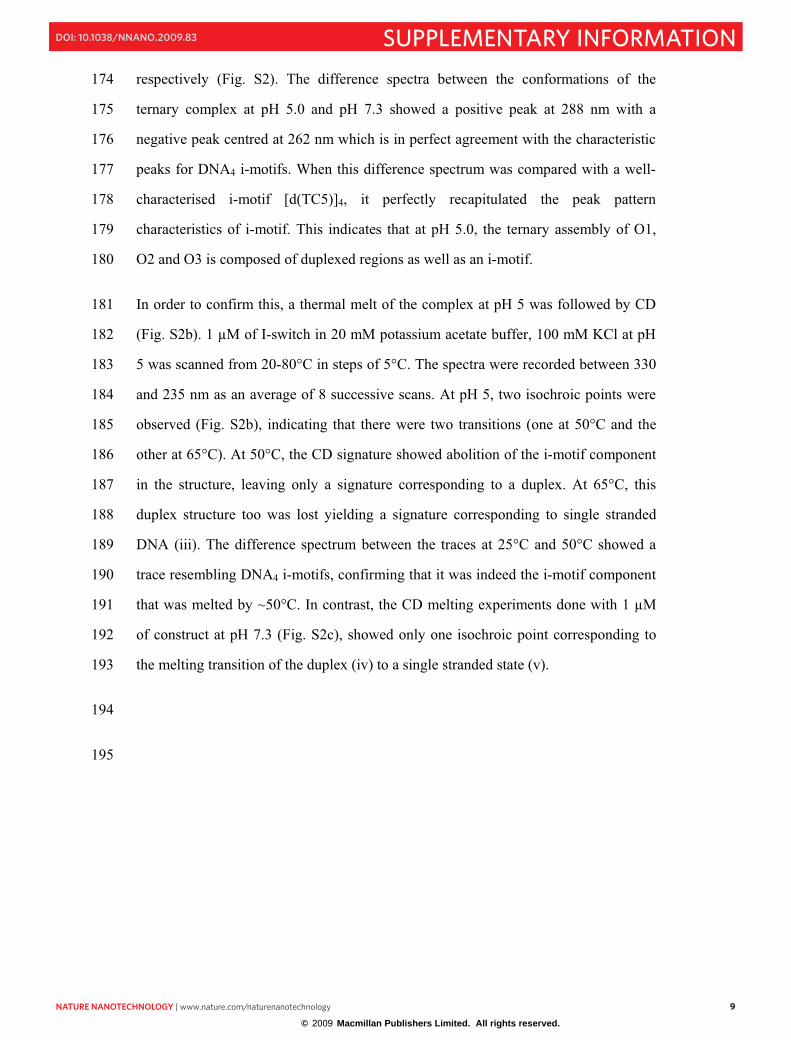
Supplementary Figure S2. Characterization of I-switch by CD spectroscopy a, CD 164
spectra of I-switch at pH 7.3 (magenta), pH 5 (black) and difference spectra (pH 5 – 165
pH 7.3) is shown in yellow. The cyan trace shows CD of a well known i-motif forming 166
sequence, [d(TC5)]4 showing the peaks of DNA4 i-motif at pH 5.0. Thermal 167
denaturation was carried out on I-switch at pH 5 b, as well as at pH 7.3 c, to 168
demonstrate i-motif formation. Unless mentioned, studies were done using 1 µM I-169
switch in 20 mM phosphate buffer, 100 mM KCl at desired pH. 170
The I-switch shows a positive peak at 278 nm and a negative peak at 248 nm which 171
resembles a B-DNA duplex, whereas spectra taken at pH 5 showed a shift in circular 172
dichroism (CD) spectra with positive and negative peaks at 285 nm and 251 nm 173
A
220 240 260 280 300 320
-4
-2
0
2
4
6
8
10
CD (m
deg)
Wavelength (nm)
pH 5 pH7.3 Difference (pH 5- pH 7.3) d (TC5)
240 260 280 300 320
-20
-10
0
10
20
30
CD
(m
deg)
20°C 25°C 30°C 35°C 40°C 45°C 50°C 55°C 60°C 65°C 70°C 75°C 80°C
IncreasingTemperature
Wavelength (nm)240 260 280 300 320
-20
-10
0
10
20
30
IncreasingTemperature
CD
(m
deg
)
Wavelength (nm)
b
i
ii
iii
a
civ
v
NNANO-08101037 9
respectively (Fig. S2). The difference spectra between the conformations of the 174
ternary complex at pH 5.0 and pH 7.3 showed a positive peak at 288 nm with a 175
negative peak centred at 262 nm which is in perfect agreement with the characteristic 176
peaks for DNA4 i-motifs. When this difference spectrum was compared with a well-177
characterised i-motif [d(TC5)]4, it perfectly recapitulated the peak pattern 178
characteristics of i-motif. This indicates that at pH 5.0, the ternary assembly of O1, 179
O2 and O3 is composed of duplexed regions as well as an i-motif. 180
In order to confirm this, a thermal melt of the complex at pH 5 was followed by CD 181
(Fig. S2b). 1 μM of I-switch in 20 mM potassium acetate buffer, 100 mM KCl at pH 182
5 was scanned from 20-80°C in steps of 5°C. The spectra were recorded between 330 183
and 235 nm as an average of 8 successive scans. At pH 5, two isochroic points were 184
observed (Fig. S2b), indicating that there were two transitions (one at 50°C and the 185
other at 65°C). At 50°C, the CD signature showed abolition of the i-motif component 186
in the structure, leaving only a signature corresponding to a duplex. At 65°C, this 187
duplex structure too was lost yielding a signature corresponding to single stranded 188
DNA (iii). The difference spectrum between the traces at 25°C and 50°C showed a 189
trace resembling DNA4 i-motifs, confirming that it was indeed the i-motif component 190
that was melted by ~50°C. In contrast, the CD melting experiments done with 1 μM 191
of construct at pH 7.3 (Fig. S2c), showed only one isochroic point corresponding to 192
the melting transition of the duplex (iv) to a single stranded state (v). 193
194
195
© 2009 Macmillan Publishers Limited. All rights reserved.
nature nanotechnology | www.nature.com/naturenanotechnology 9
supplementary informationdoi: 10.1038/nnano.2009.83
NNANO-08101037 8
CD studies to prove open and closed conformations. 153
154
155
156
157
158
159
160
161
162
163
Supplementary Figure S2. Characterization of I-switch by CD spectroscopy a, CD 164
spectra of I-switch at pH 7.3 (magenta), pH 5 (black) and difference spectra (pH 5 – 165
pH 7.3) is shown in yellow. The cyan trace shows CD of a well known i-motif forming 166
sequence, [d(TC5)]4 showing the peaks of DNA4 i-motif at pH 5.0. Thermal 167
denaturation was carried out on I-switch at pH 5 b, as well as at pH 7.3 c, to 168
demonstrate i-motif formation. Unless mentioned, studies were done using 1 µM I-169
switch in 20 mM phosphate buffer, 100 mM KCl at desired pH. 170
The I-switch shows a positive peak at 278 nm and a negative peak at 248 nm which 171
resembles a B-DNA duplex, whereas spectra taken at pH 5 showed a shift in circular 172
dichroism (CD) spectra with positive and negative peaks at 285 nm and 251 nm 173
A
220 240 260 280 300 320
-4
-2
0
2
4
6
8
10
CD (m
deg)
Wavelength (nm)
pH 5 pH7.3 Difference (pH 5- pH 7.3) d (TC5)
240 260 280 300 320
-20
-10
0
10
20
30
CD
(m
deg)
20°C 25°C 30°C 35°C 40°C 45°C 50°C 55°C 60°C 65°C 70°C 75°C 80°C
IncreasingTemperature
Wavelength (nm)240 260 280 300 320
-20
-10
0
10
20
30
IncreasingTemperature
CD
(m
deg
)
Wavelength (nm)
b
i
ii
iii
a
civ
v
NNANO-08101037 9
respectively (Fig. S2). The difference spectra between the conformations of the 174
ternary complex at pH 5.0 and pH 7.3 showed a positive peak at 288 nm with a 175
negative peak centred at 262 nm which is in perfect agreement with the characteristic 176
peaks for DNA4 i-motifs. When this difference spectrum was compared with a well-177
characterised i-motif [d(TC5)]4, it perfectly recapitulated the peak pattern 178
characteristics of i-motif. This indicates that at pH 5.0, the ternary assembly of O1, 179
O2 and O3 is composed of duplexed regions as well as an i-motif. 180
In order to confirm this, a thermal melt of the complex at pH 5 was followed by CD 181
(Fig. S2b). 1 μM of I-switch in 20 mM potassium acetate buffer, 100 mM KCl at pH 182
5 was scanned from 20-80°C in steps of 5°C. The spectra were recorded between 330 183
and 235 nm as an average of 8 successive scans. At pH 5, two isochroic points were 184
observed (Fig. S2b), indicating that there were two transitions (one at 50°C and the 185
other at 65°C). At 50°C, the CD signature showed abolition of the i-motif component 186
in the structure, leaving only a signature corresponding to a duplex. At 65°C, this 187
duplex structure too was lost yielding a signature corresponding to single stranded 188
DNA (iii). The difference spectrum between the traces at 25°C and 50°C showed a 189
trace resembling DNA4 i-motifs, confirming that it was indeed the i-motif component 190
that was melted by ~50°C. In contrast, the CD melting experiments done with 1 μM 191
of construct at pH 7.3 (Fig. S2c), showed only one isochroic point corresponding to 192
the melting transition of the duplex (iv) to a single stranded state (v). 193
194
195
© 2009 Macmillan Publishers Limited. All rights reserved.
10 nature nanotechnology | www.nature.com/naturenanotechnology
supplementary information doi: 10.1038/nnano.2009.83
NNANO-08101037 10
196
197
198
199
200
201
202
203
204
205
206
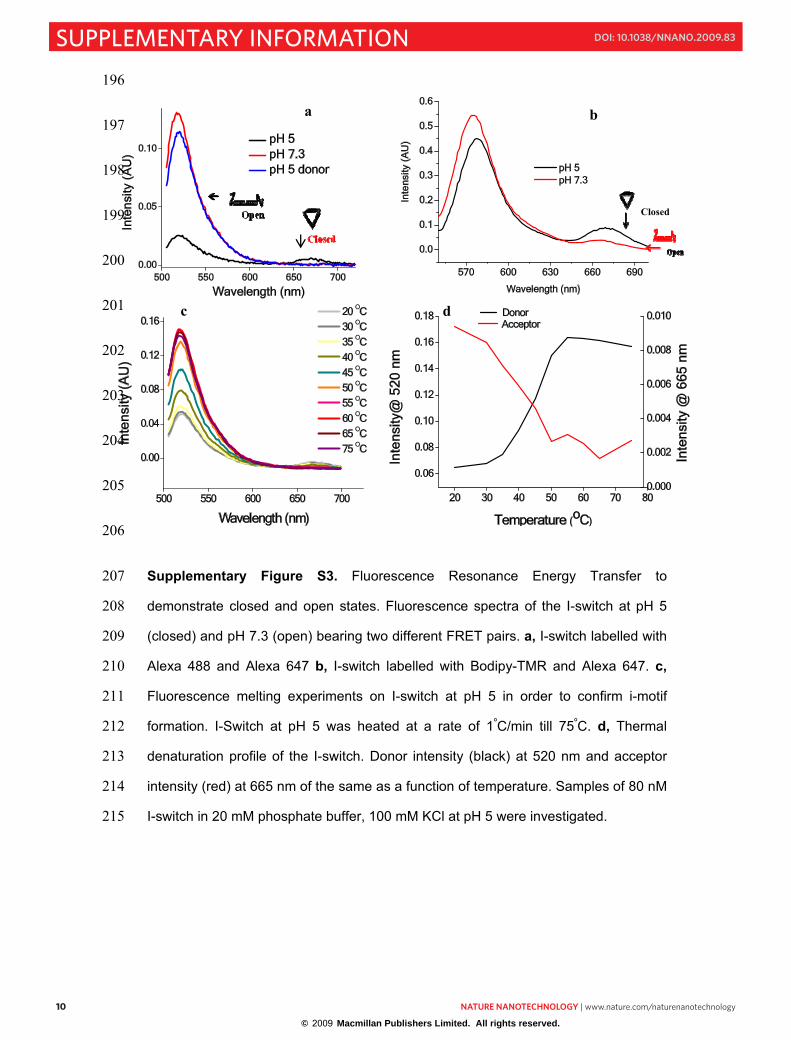
Supplementary Figure S3. Fluorescence Resonance Energy Transfer to 207
demonstrate closed and open states. Fluorescence spectra of the I-switch at pH 5 208
(closed) and pH 7.3 (open) bearing two different FRET pairs. a, I-switch labelled with 209
Alexa 488 and Alexa 647 b, I-switch labelled with Bodipy-TMR and Alexa 647. c,210
Fluorescence melting experiments on I-switch at pH 5 in order to confirm i-motif 211
formation. I-Switch at pH 5 was heated at a rate of 1ºC/min till 75ºC. d, Thermal 212
denaturation profile of the I-switch. Donor intensity (black) at 520 nm and acceptor 213
intensity (red) at 665 nm of the same as a function of temperature. Samples of 80 nM 214
I-switch in 20 mM phosphate buffer, 100 mM KCl at pH 5 were investigated. 215
570 600 630 660 690
0.0
0.1
0.2
0.3
0.4
0.5
0.6
Inte
nsity
(A
U)
Wavelength (nm)
pH 5 pH 7.3
Closed
b
20 30 40 50 60 70 80
0.06
0.08
0.10
0.12
0.14
0.16
0.18
0.000
0.002
0.004
0.006
0.008
0.010
Inte
nsi
ty@
520
nm
Temperature (oC)
DonorAcceptor
Inte
nsi
ty @
665
nm
d c
500 550 600 650 700
0.00
0.04
0.08
0.12
0.16
Inte
nsity
(A
U)
Wavelength (nm)
20 OC
30 OC
35 OC
40 OC
45 OC
50 OC
55 OC
60 OC
65 OC
75 OC
500 550 600 650 7000.00
0.05
0.10
Inte
nsi
ty (
AU
)
Wavelength (nm)
pH 5 pH 7.3 pH 5 donor
a
© 2009 Macmillan Publishers Limited. All rights reserved.
nature nanotechnology | www.nature.com/naturenanotechnology 11
supplementary informationdoi: 10.1038/nnano.2009.83
NNANO-08101037 10
196
197
198
199
200
201
202
203
204
205
206
Supplementary Figure S3. Fluorescence Resonance Energy Transfer to 207
demonstrate closed and open states. Fluorescence spectra of the I-switch at pH 5 208
(closed) and pH 7.3 (open) bearing two different FRET pairs. a, I-switch labelled with 209
Alexa 488 and Alexa 647 b, I-switch labelled with Bodipy-TMR and Alexa 647. c,210
Fluorescence melting experiments on I-switch at pH 5 in order to confirm i-motif 211
formation. I-Switch at pH 5 was heated at a rate of 1ºC/min till 75ºC. d, Thermal 212
denaturation profile of the I-switch. Donor intensity (black) at 520 nm and acceptor 213
intensity (red) at 665 nm of the same as a function of temperature. Samples of 80 nM 214
I-switch in 20 mM phosphate buffer, 100 mM KCl at pH 5 were investigated. 215
570 600 630 660 690
0.0
0.1
0.2
0.3
0.4
0.5
0.6
Inte
nsity
(A
U)
Wavelength (nm)
pH 5 pH 7.3
Closed
b
20 30 40 50 60 70 80
0.06
0.08
0.10
0.12
0.14
0.16
0.18
0.000
0.002
0.004
0.006
0.008
0.010
Inte
nsi
ty@
520
nm
Temperature (oC)
DonorAcceptor
Inte
nsi
ty @
665
nm
d c
500 550 600 650 700
0.00
0.04
0.08
0.12
0.16
Inte
nsity
(A
U)
Wavelength (nm)
20 OC
30 OC
35 OC
40 OC
45 OC
50 OC
55 OC
60 OC
65 OC
75 OC
500 550 600 650 7000.00
0.05
0.10
Inte
nsi
ty (
AU
)
Wavelength (nm)
pH 5 pH 7.3 pH 5 donor
a
NNANO-08101037 11
FRET and distance measurements. FRET measurements were carried out on I-216
switch composed of labelled DNA strands with Alexa 488 as a donor and Alexa 647 217
as acceptor. This FRET pair has a Förster distance of 5.0 nm.1 Fluorescence spectra 218
were taken at pH 5 and pH 7.3 in phosphate buffer having 100 mM KCl. 54-60% 219
quenching was observed from the closed state to open state giving an interfluorophore 220
distance of 4.6±0.5 nm, which is in good agreement from a coarse grained model 221
taking NMR parameters from d(CCCCAA) i-motif. In order to ensure that the 222
observed FRET was fluorophore independent, another FRET pair was chosen by 223
labelling O1 with Bodipy-TMR and O2 with Alexa-647, which also showed similar 224
energy transfer. When the I-switch incorporated fluorescent labels at a different 225
location, i.e., 5� and 3� termini of O3 with Alexa 546 and Alexa 647 we observed 226
FRET that incorporated the thickness of the duplex arms as well that led to a distance 227
of 7.8±0.5 nm (theoretically predicted distance 7.3 nm). This confirms that in the 228
closed state, the I-switch comprise two duplex arms that are united via their C-rich 229
single stranded overhangs by forming an intramolecular i-motif. 230
CD melts (see earlier section) revealed a lower melting species at 45-50ºC. To 231
confirm that this is due to the melting of an intramolecular i-motif, fluorescence melts 232
were carried out with the sample in which both the overhangs were labelled with 233
dyes. In the closed state via intramolecular i-motif formation, the two dyes come into 234
close proximity (4.6 nm) leading to high FRET. As a function of increasing 235
temperature, thermal denaturation of the i-motif should abolish FRET and therefore 236
donor intensity of the I-switch should increase with a concomitant decrease in 237
acceptor intensity. Figure 3Sd shows the expected sigmoidal increase in donor and 238
concomitant decrease in acceptor fluorescence with a melting temperature of 45ºC 239
consistent with CD data and confirming intramolecular i-motif formation. 240
© 2009 Macmillan Publishers Limited. All rights reserved.
12 nature nanotechnology | www.nature.com/naturenanotechnology
supplementary information doi: 10.1038/nnano.2009.83
NNANO-08101037 12
1. Majumdar, D. S., Smirnova, I., Kasho, V, Nir., E., Kong, X., Weiss, S., and 241
Kaback, H. R., Single-molecule FRET reveals sugar-induced conformational 242
dynamics in LacY. Proc. Natl. Acad. Sci. USA. 104, 12640–12645, 2007. 243
Fluorescence Lifetime experiments confirms FRET 244
Donor fluorescence intensity decays for donor-only (D) labelled (Alexa 488) and 245
donor-acceptor (DA) labelled (Alexa 488 as donor and Alexa 647 as acceptor) 246
construct were obtained from TCSPC experimental setup. To quantify donor 247
fluorescent lifetime, intensity decays were fitted to a bi-exponential decay model 248
1 2( ) ( / )0 1 2
t tI I A e A e� �� �� �� �� � by an iterative reconvolution procedure using a 249
Levenberg-Marquardt minimization algorithm, where 0I is initial fluorescence 250
intensity; 1 2,A A are the normalized amplitude of individual components; and 1 2,� � are 251
the lifetimes of each components. Fluorescence decays were considered well fit when 252
three criteria were met: a) reduced 2� was less than 1.2, b) residuals were evenly 253
distributed across the full extent of the data, and c) visual inspection ensured that the 254
fit accurately described the decay profile. A representative time resolved fluorescence 255
intensity decay and fit from donor-only sample is shown in Figure S4a. 256
Parameters such as amplitude 1 2( , )A A and decay time constants 1 2( , )� � were 257
obtained after satisfying above criteria of fitting and the average lifetime was 258
calculated using the formula 1 1 2 2
1 2
( ) ( )av
A AA A� �� � � �
��
(Where ��+�� was normalized 259
to 1) and listed in the table below. Although, at pH 7.3 D-labelled construct showed 260
an average lifetime of 3.77 ns which marginally decreased to 3.5 ns at pH 6, at pH 5 it 261
dropped to 3.0 ns that can be explained by donor quenching due to i-motif 262
© 2009 Macmillan Publishers Limited. All rights reserved.
nature nanotechnology | www.nature.com/naturenanotechnology 13
supplementary informationdoi: 10.1038/nnano.2009.83
NNANO-08101037 12
1. Majumdar, D. S., Smirnova, I., Kasho, V, Nir., E., Kong, X., Weiss, S., and 241
Kaback, H. R., Single-molecule FRET reveals sugar-induced conformational 242
dynamics in LacY. Proc. Natl. Acad. Sci. USA. 104, 12640–12645, 2007. 243
Fluorescence Lifetime experiments confirms FRET 244
Donor fluorescence intensity decays for donor-only (D) labelled (Alexa 488) and 245
donor-acceptor (DA) labelled (Alexa 488 as donor and Alexa 647 as acceptor) 246
construct were obtained from TCSPC experimental setup. To quantify donor 247
fluorescent lifetime, intensity decays were fitted to a bi-exponential decay model 248
1 2( ) ( / )0 1 2
t tI I A e A e� �� �� �� �� � by an iterative reconvolution procedure using a 249
Levenberg-Marquardt minimization algorithm, where 0I is initial fluorescence 250
intensity; 1 2,A A are the normalized amplitude of individual components; and 1 2,� � are 251
the lifetimes of each components. Fluorescence decays were considered well fit when 252
three criteria were met: a) reduced 2� was less than 1.2, b) residuals were evenly 253
distributed across the full extent of the data, and c) visual inspection ensured that the 254
fit accurately described the decay profile. A representative time resolved fluorescence 255
intensity decay and fit from donor-only sample is shown in Figure S4a. 256
Parameters such as amplitude 1 2( , )A A and decay time constants 1 2( , )� � were 257
obtained after satisfying above criteria of fitting and the average lifetime was 258
calculated using the formula 1 1 2 2
1 2
( ) ( )av
A AA A� �� � � �
��
(Where ��+�� was normalized 259
to 1) and listed in the table below. Although, at pH 7.3 D-labelled construct showed 260
an average lifetime of 3.77 ns which marginally decreased to 3.5 ns at pH 6, at pH 5 it 261
dropped to 3.0 ns that can be explained by donor quenching due to i-motif 262
NNANO-08101037 13
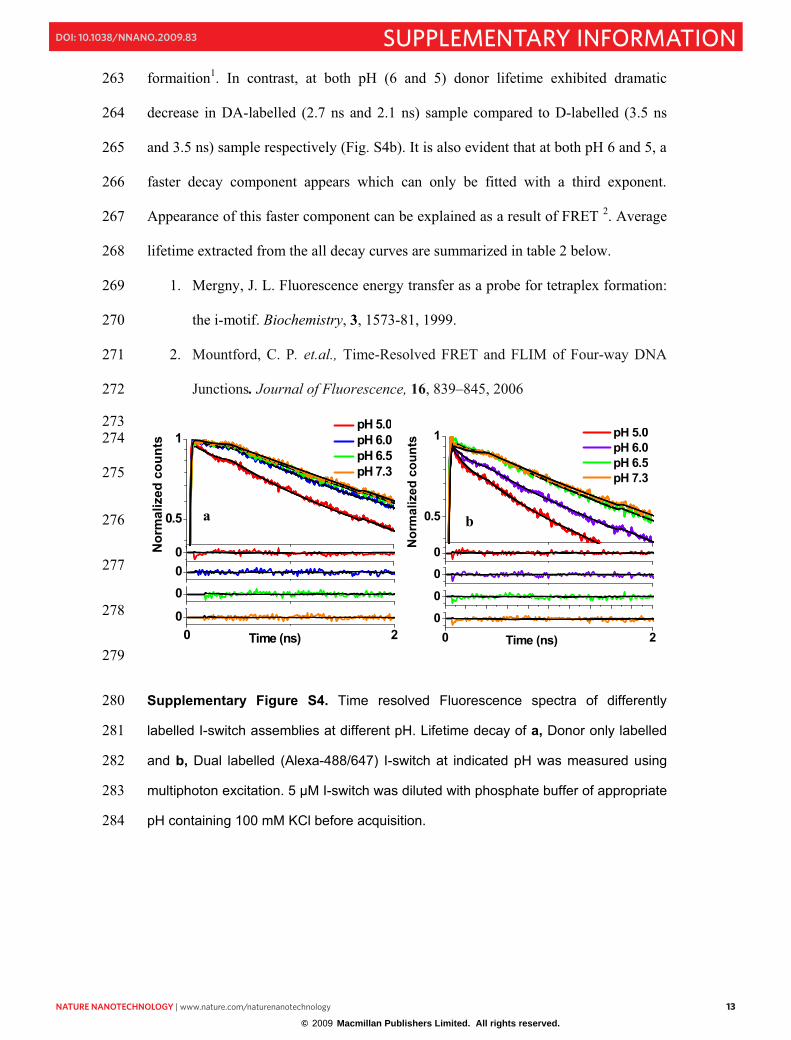
formaition1. In contrast, at both pH (6 and 5) donor lifetime exhibited dramatic 263
decrease in DA-labelled (2.7 ns and 2.1 ns) sample compared to D-labelled (3.5 ns 264
and 3.5 ns) sample respectively (Fig. S4b). It is also evident that at both pH 6 and 5, a 265
faster decay component appears which can only be fitted with a third exponent. 266
Appearance of this faster component can be explained as a result of FRET 2. Average 267
lifetime extracted from the all decay curves are summarized in table 2 below. 268
1. Mergny, J. L. Fluorescence energy transfer as a probe for tetraplex formation: 269
the i-motif. Biochemistry, 3, 1573-81, 1999. 270
2. Mountford, C. P. et.al., Time-Resolved FRET and FLIM of Four-way DNA 271
Junctions. Journal of Fluorescence, 16, 839–845, 2006 272
273 274
275
276
277
278
279
Supplementary Figure S4. Time resolved Fluorescence spectra of differently 280
labelled I-switch assemblies at different pH. Lifetime decay of a, Donor only labelled 281
and b, Dual labelled (Alexa-488/647) I-switch at indicated pH was measured using 282
multiphoton excitation. 5 µM I-switch was diluted with phosphate buffer of appropriate 283
pH containing 100 mM KCl before acquisition. 284
0.5
1
0
0
0
0 20
Nor
mal
ized
cou
nts pH 5.0
pH 6.0 pH 6.5 pH 7.3
Time (ns)
0.5
1
00
0 20
0Nor
mal
ized
cou
nts
pH 5.0 pH 6.0 pH 6.5 pH 7.3
Time (ns)
a b
© 2009 Macmillan Publishers Limited. All rights reserved.
14 nature nanotechnology | www.nature.com/naturenanotechnology
supplementary information doi: 10.1038/nnano.2009.83
NNANO-08101037 14
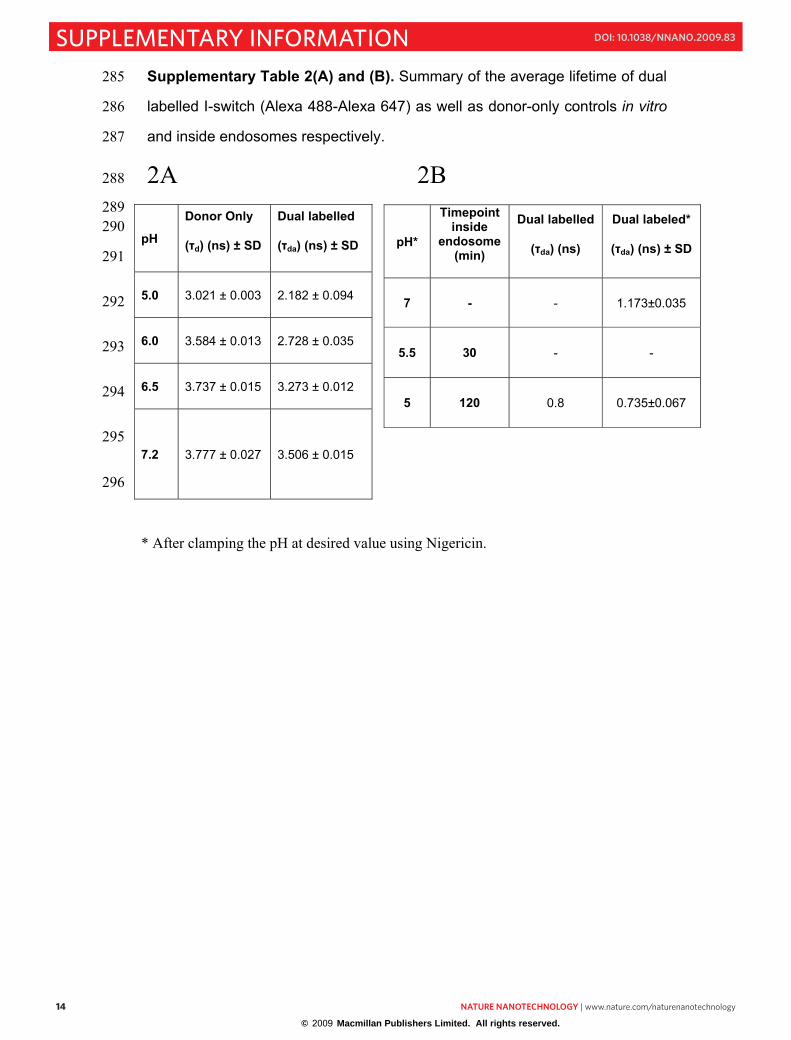
Supplementary Table 2(A) and (B). Summary of the average lifetime of dual 285
labelled I-switch (Alexa 488-Alexa 647) as well as donor-only controls in vitro286
and inside endosomes respectively.287
2A 2B 288
289 290
291
292
293
294
295
296
pH
Donor Only
(�d) (ns) ± SD
Dual labelled
(�da) (ns) ± SD
5.0 3.021 ± 0.003 2.182 ± 0.094
6.0 3.584 ± 0.013 2.728 ± 0.035
6.5 3.737 ± 0.015 3.273 ± 0.012
7.2 3.777 ± 0.027 3.506 ± 0.015
* After clamping the pH at desired value using Nigericin.
pH*
Timepoint inside
endosome (min)
Dual labelled
(�da) (ns)
Dual labeled*
(�da) (ns) ± SD
7 - - 1.173±0.035
5.5 30 - -
5 120 0.8 0.735±0.067
© 2009 Macmillan Publishers Limited. All rights reserved.
nature nanotechnology | www.nature.com/naturenanotechnology 15
supplementary informationdoi: 10.1038/nnano.2009.83
NNANO-08101037 14
Supplementary Table 2(A) and (B). Summary of the average lifetime of dual 285
labelled I-switch (Alexa 488-Alexa 647) as well as donor-only controls in vitro286
and inside endosomes respectively.287
2A 2B 288
289 290
291
292
293
294
295
296
pH
Donor Only
(�d) (ns) ± SD
Dual labelled
(�da) (ns) ± SD
5.0 3.021 ± 0.003 2.182 ± 0.094
6.0 3.584 ± 0.013 2.728 ± 0.035
6.5 3.737 ± 0.015 3.273 ± 0.012
7.2 3.777 ± 0.027 3.506 ± 0.015
* After clamping the pH at desired value using Nigericin.
pH*
Timepoint inside
endosome (min)
Dual labelled
(�da) (ns)
Dual labeled*
(�da) (ns) ± SD
7 - - 1.173±0.035
5.5 30 - -
5 120 0.8 0.735±0.067
NNANO-08101037 15
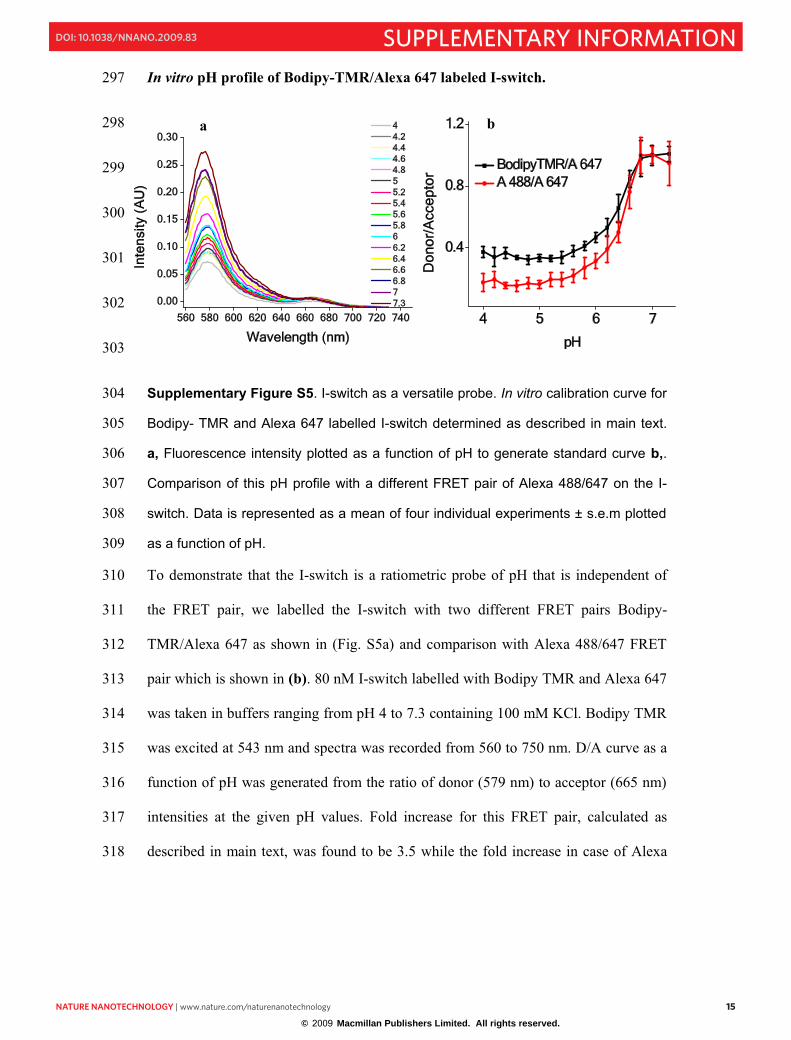
In vitro pH profile of Bodipy-TMR/Alexa 647 labeled I-switch. 297
298
299
300
301
302
303
Supplementary Figure S5. I-switch as a versatile probe. In vitro calibration curve for 304
Bodipy- TMR and Alexa 647 labelled I-switch determined as described in main text. 305
a, Fluorescence intensity plotted as a function of pH to generate standard curve b,.306
Comparison of this pH profile with a different FRET pair of Alexa 488/647 on the I-307
switch. Data is represented as a mean of four individual experiments ± s.e.m plotted 308
as a function of pH. 309
To demonstrate that the I-switch is a ratiometric probe of pH that is independent of 310
the FRET pair, we labelled the I-switch with two different FRET pairs Bodipy-311
TMR/Alexa 647 as shown in (Fig. S5a) and comparison with Alexa 488/647 FRET 312
pair which is shown in (b). 80 nM I-switch labelled with Bodipy TMR and Alexa 647 313
was taken in buffers ranging from pH 4 to 7.3 containing 100 mM KCl. Bodipy TMR 314
was excited at 543 nm and spectra was recorded from 560 to 750 nm. D/A curve as a 315
function of pH was generated from the ratio of donor (579 nm) to acceptor (665 nm) 316
intensities at the given pH values. Fold increase for this FRET pair, calculated as 317
described in main text, was found to be 3.5 while the fold increase in case of Alexa 318
4 5 6 7
0.4
0.8
1.2
Don
or/A
ccep
tor
pH
BodipyTMR/A 647 A 488/A 647
a b
560 580 600 620 640 660 680 700 720 740
0.00
0.05
0.10
0.15
0.20
0.25
0.30In
tens
ity (
AU
)
Wavelength (nm)
4 4.2 4.4 4.6 4.8 5 5.2 5.4 5.6 5.8 6 6.2 6.4 6.6 6.8 7 7.3
© 2009 Macmillan Publishers Limited. All rights reserved.
16 nature nanotechnology | www.nature.com/naturenanotechnology
supplementary information doi: 10.1038/nnano.2009.83
NNANO-08101037 16
488/Alexa-647 pair was found to be 5.5. Due to higher dynamic range, Alexa- 319
488/647 was used for further studies unless otherwise specified. Importantly the 320
regime of pH sensitivity in both cases is identical indicating that the transition is 321
completely fluorophore independent. 322
323
© 2009 Macmillan Publishers Limited. All rights reserved.
nature nanotechnology | www.nature.com/naturenanotechnology 17
supplementary informationdoi: 10.1038/nnano.2009.83
NNANO-08101037 16
488/Alexa-647 pair was found to be 5.5. Due to higher dynamic range, Alexa- 319
488/647 was used for further studies unless otherwise specified. Importantly the 320
regime of pH sensitivity in both cases is identical indicating that the transition is 321
completely fluorophore independent. 322
323
NNANO-08101037 17
Spatiotemporal pH mapping during endocytosis 324
325
326
327
328
329
330
331
332
333
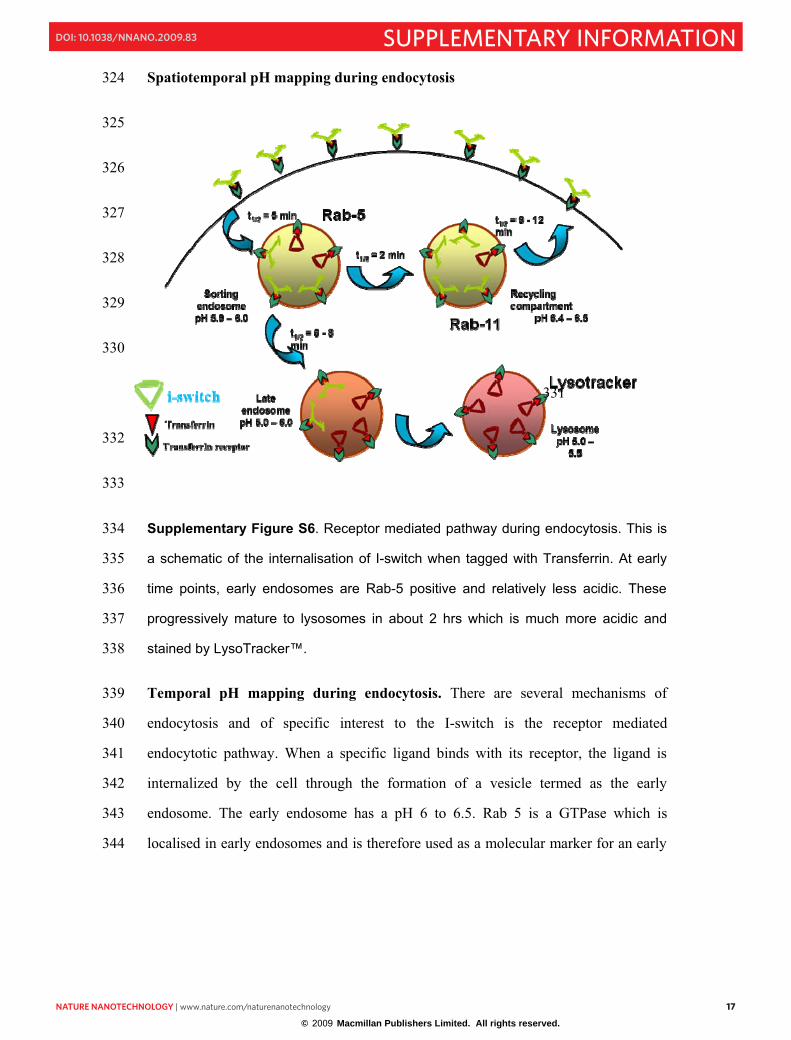
Supplementary Figure S6. Receptor mediated pathway during endocytosis. This is 334
a schematic of the internalisation of I-switch when tagged with Transferrin. At early 335
time points, early endosomes are Rab-5 positive and relatively less acidic. These 336
progressively mature to lysosomes in about 2 hrs which is much more acidic and 337
stained by LysoTracker™. 338
Temporal pH mapping during endocytosis. There are several mechanisms of 339
endocytosis and of specific interest to the I-switch is the receptor mediated 340
endocytotic pathway. When a specific ligand binds with its receptor, the ligand is 341
internalized by the cell through the formation of a vesicle termed as the early 342
endosome. The early endosome has a pH 6 to 6.5. Rab 5 is a GTPase which is 343
localised in early endosomes and is therefore used as a molecular marker for an early 344
© 2009 Macmillan Publishers Limited. All rights reserved.
18 nature nanotechnology | www.nature.com/naturenanotechnology
supplementary information doi: 10.1038/nnano.2009.83
NNANO-08101037 18
endosome. The early endosome gradually matures to late endosome and lysosome 345
which is identified by LysoTracker ™ red staining. 346
347
The I-switch specifically marks the ALBR endocytic pathway 348
It is known that cargo entering cells via endocytic pathways such as the anionic 349
ligand binding receptor (ALBR) pathway fuse with FITC dextran labelled endosomes 350
at the indicated chase times. Competition experiments with maleylated BSA (mBSA) 351
that is known to adopt the ALBR mediated endocytic route in hemocytes indicated 352
that the I-switch exclusively marks out endosomes along this pathway. Cells were 353
pulsed with a mixture of I-switch (Alexa 647) (80 nM) and mBSA (0.8 mg/ml), 354
chased for 5 min and fixed. Total fluorescence of the cells was measured and 355
normalized with respect to the fluorescence in untreated cells and is presented as 356
fraction of I-switch internalised. Figure S7b shows that the I-switch is clearly 357
competed out in the presence of excess mBSA. Till the 2 h time point, the I-switch is 358
in punctate endosomal structures indicating that it is stable inside cells on these time 359
scales (Fig. S7a). This was further confirmed by fluorescence lifetime measurements 360
of the donor on doubly-labelled I-switch (See Table 2B) inside endosomes. When the 361
lifetime of donor in dual labelled I-switch was measured inside endosomes at t = 2h, 362
these showed characteristic low donor lifetimes (0.8 ns). Upon pH clamping of these 363
endosomes at pH 5, similar donor lifetimes were observed (0.74 ns) indicating that at t 364
= 2h, both fluorophores on the I-switch were within FRETting distance. Upon 365
clamping endosomes at pH 7, when the donor was out of FRETting distance, 366
distinctly higher lifetime of 1.2 ns was observed. 367
368
© 2009 Macmillan Publishers Limited. All rights reserved.
nature nanotechnology | www.nature.com/naturenanotechnology 19
supplementary informationdoi: 10.1038/nnano.2009.83
NNANO-08101037 18
endosome. The early endosome gradually matures to late endosome and lysosome 345
which is identified by LysoTracker ™ red staining. 346
347
The I-switch specifically marks the ALBR endocytic pathway 348
It is known that cargo entering cells via endocytic pathways such as the anionic 349
ligand binding receptor (ALBR) pathway fuse with FITC dextran labelled endosomes 350
at the indicated chase times. Competition experiments with maleylated BSA (mBSA) 351
that is known to adopt the ALBR mediated endocytic route in hemocytes indicated 352
that the I-switch exclusively marks out endosomes along this pathway. Cells were 353
pulsed with a mixture of I-switch (Alexa 647) (80 nM) and mBSA (0.8 mg/ml), 354
chased for 5 min and fixed. Total fluorescence of the cells was measured and 355
normalized with respect to the fluorescence in untreated cells and is presented as 356
fraction of I-switch internalised. Figure S7b shows that the I-switch is clearly 357
competed out in the presence of excess mBSA. Till the 2 h time point, the I-switch is 358
in punctate endosomal structures indicating that it is stable inside cells on these time 359
scales (Fig. S7a). This was further confirmed by fluorescence lifetime measurements 360
of the donor on doubly-labelled I-switch (See Table 2B) inside endosomes. When the 361
lifetime of donor in dual labelled I-switch was measured inside endosomes at t = 2h, 362
these showed characteristic low donor lifetimes (0.8 ns). Upon pH clamping of these 363
endosomes at pH 5, similar donor lifetimes were observed (0.74 ns) indicating that at t 364
= 2h, both fluorophores on the I-switch were within FRETting distance. Upon 365
clamping endosomes at pH 7, when the donor was out of FRETting distance, 366
distinctly higher lifetime of 1.2 ns was observed. 367
368
NNANO-08101037 19
*
a
369
370
371
372
373
374
375
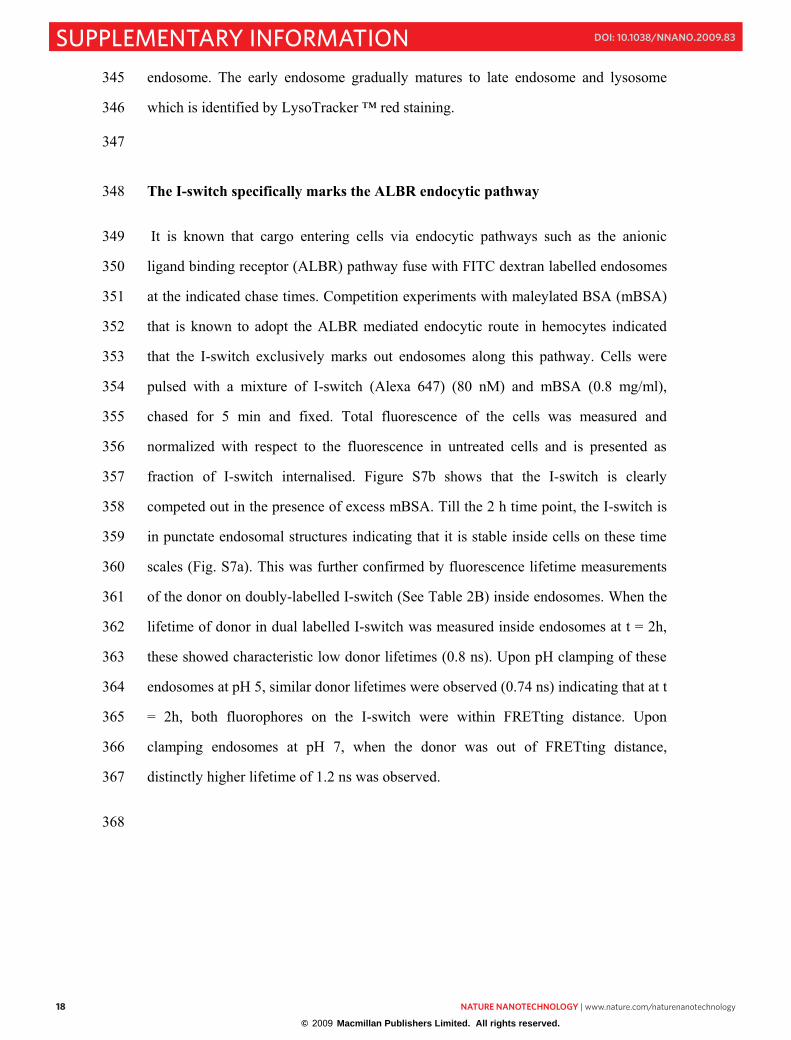
Supplementary Figure S7. I-switch is endocytosed via the anionic ligand binding 376
receptor (ALBR) pathway. a, Alexa 488-647 labelled I-switch pulsed for 5 min, 377
chased for 2 h and imaged shown colocalization of two colours in distinct punctate 378
endosomes. b, Quantification of I-switch internalization by Drosophila hemocytes in 379
the presence and absence of excess of maleylated BSA (mBSA, 100µg/ml) that 380
saturates ALB receptors. I-switch internalization was quantified in terms of the total 381
fluorescence intensity (at Alexa-647 channel) of cells pulsed with I-switch in the 382
presence and absence of excess unlabeled mBSA. The contribution from 383
autofluorescence is also shown. Scale Bar: 5 µm, inset: 1 µm. 384
385
386
387
0.0
0.2
0.4
0.6
0.8
1.0
Fra
ctio
n of
i-sw
itch
i nte
rnal
ized
No mBSA + mBSA Autofluorescence
b
© 2009 Macmillan Publishers Limited. All rights reserved.
20 nature nanotechnology | www.nature.com/naturenanotechnology
supplementary information doi: 10.1038/nnano.2009.83
NNANO-08101037 20
388
Spatiotemporal pH mapping during endocytosis. 389
390
391
392
393
394
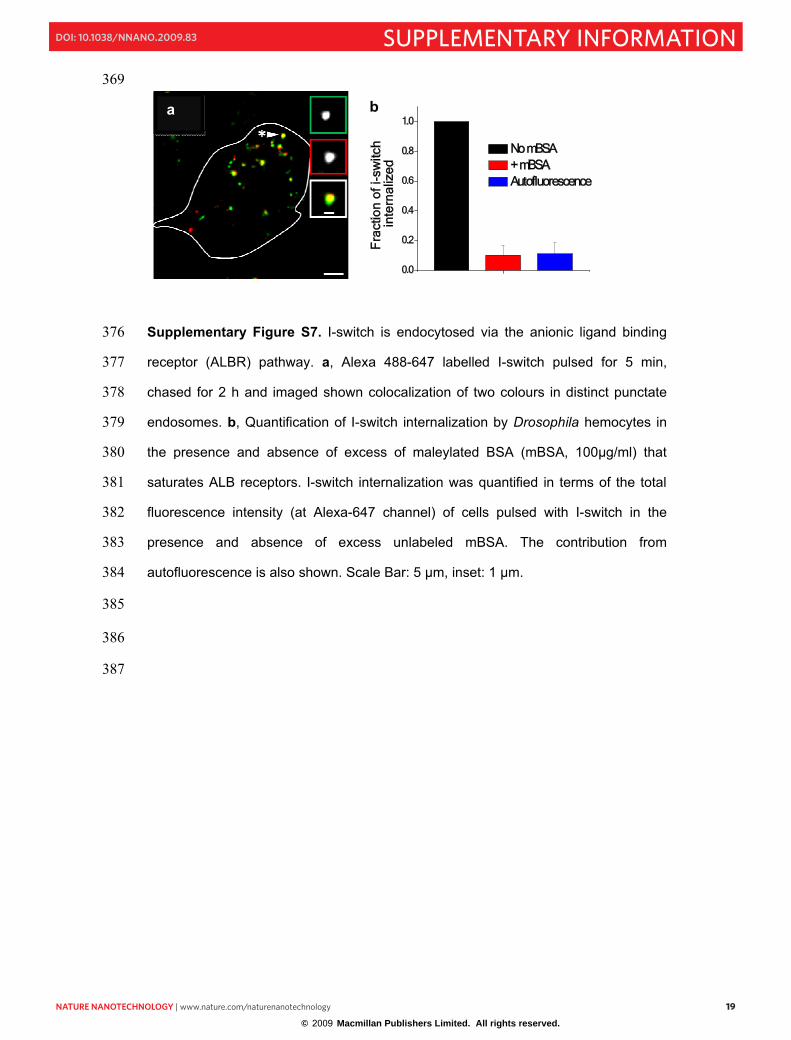
Supplementary Figure S8. Temporal pH mapping during endocytosis. a, Enlarged 395
view of intracellular standard curve to show measured pH during endocytosis. Blue 396
curve represents calibration curve obtained by adding Nigericin and red squares are 397
mean D/A (± s.e.m) values of endosomes after a 5 min pulse, with a chase of 5 min, 398
1h and 2 h. b, Mean D/A of endosomes at different chase times (t= 5, 60 and 120 399
min) were converted to their respective mean pH values and plotted as a function of 400
chase time (t). Error bar: Mean ± s.e.m 401
Nigericin is a potassium-H+ antiporter which exchanges protons and depletes pH 402
gradients inside cells, making endosomal pH the same as the pH of the external buffer 403
added to the cells. D/A ratio of endosomes in Drosophila hemocytes at desired pH 404
were measured and plotted with respect to pH. Intracellularly, a sigmoidal increase in 405
D/A ratio curve was obtained with a 5 fold increase from closed to open states (Fig. 406
2a, maintext). When this D/A curve was overlayed (2A) with the in vitro curve it 407
recapitulated qualitatively and quantitatively its closing and opening characteristics 408
inside cells. D/A value of each endosome was collected and presented in a histogram 409
(Fig. 3b, main text) and from that mean D/A was calculated at 5 min,1 h and 2 h, 410
0 20 40 60 80 100 120
4.8
5.0
5.2
5.4
5.6
5.8
6.0
6.2
pH
Time (min)
Mean D/A
b
Mean pH
5.0 5.5 6.0
1.0
1.5
Don
or/
Acc
epto
r
pH
Measured pH clamping
a
© 2009 Macmillan Publishers Limited. All rights reserved.
nature nanotechnology | www.nature.com/naturenanotechnology 21
supplementary informationdoi: 10.1038/nnano.2009.83
NNANO-08101037 20
388
Spatiotemporal pH mapping during endocytosis. 389
390
391
392
393
394
Supplementary Figure S8. Temporal pH mapping during endocytosis. a, Enlarged 395
view of intracellular standard curve to show measured pH during endocytosis. Blue 396
curve represents calibration curve obtained by adding Nigericin and red squares are 397
mean D/A (± s.e.m) values of endosomes after a 5 min pulse, with a chase of 5 min, 398
1h and 2 h. b, Mean D/A of endosomes at different chase times (t= 5, 60 and 120 399
min) were converted to their respective mean pH values and plotted as a function of 400
chase time (t). Error bar: Mean ± s.e.m 401
Nigericin is a potassium-H+ antiporter which exchanges protons and depletes pH 402
gradients inside cells, making endosomal pH the same as the pH of the external buffer 403
added to the cells. D/A ratio of endosomes in Drosophila hemocytes at desired pH 404
were measured and plotted with respect to pH. Intracellularly, a sigmoidal increase in 405
D/A ratio curve was obtained with a 5 fold increase from closed to open states (Fig. 406
2a, maintext). When this D/A curve was overlayed (2A) with the in vitro curve it 407
recapitulated qualitatively and quantitatively its closing and opening characteristics 408
inside cells. D/A value of each endosome was collected and presented in a histogram 409
(Fig. 3b, main text) and from that mean D/A was calculated at 5 min,1 h and 2 h, 410
0 20 40 60 80 100 120
4.8
5.0
5.2
5.4
5.6
5.8
6.0
6.2
pH
Time (min)
Mean D/A
b
Mean pH
5.0 5.5 6.0
1.0
1.5
Don
or/
Acc
epto
r
pH
Measured pH clamping
a
NNANO-08101037 21
compared with the standard curve in order to obtain pH at early, late and lysosomes 411
respectively (Fig. S8b). 412
413
414
415
416
© 2009 Macmillan Publishers Limited. All rights reserved.
22 nature nanotechnology | www.nature.com/naturenanotechnology
supplementary information doi: 10.1038/nnano.2009.83
NNANO-08101037 22
Conjugation of I-switch with a protein of interest. 417
418
419
420
421
422
423
424
425
426
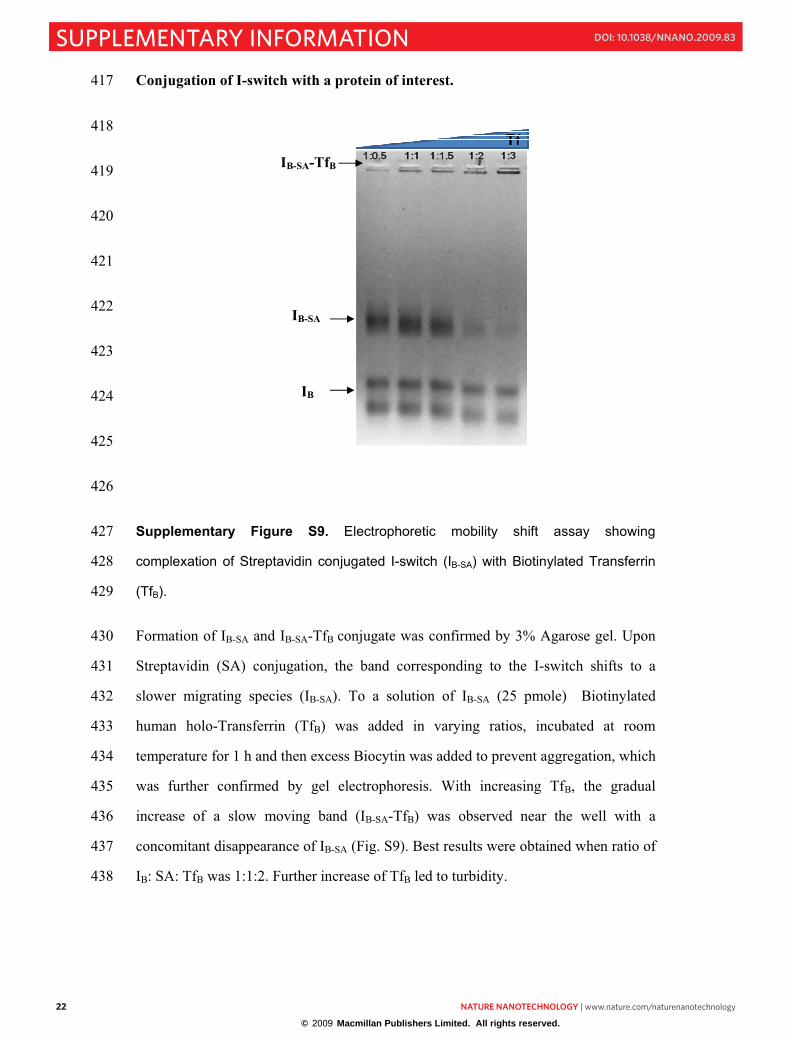
Supplementary Figure S9. Electrophoretic mobility shift assay showing 427
complexation of Streptavidin conjugated I-switch (IB-SA) with Biotinylated Transferrin 428
(TfB).429
Formation of IB-SA and IB-SA-TfB conjugate was confirmed by 3% Agarose gel. Upon 430
Streptavidin (SA) conjugation, the band corresponding to the I-switch shifts to a 431
slower migrating species (IB-SA). To a solution of IB-SA (25 pmole) Biotinylated 432
human holo-Transferrin (TfB) was added in varying ratios, incubated at room 433
temperature for 1 h and then excess Biocytin was added to prevent aggregation, which 434
was further confirmed by gel electrophoresis. With increasing TfB, the gradual 435
increase of a slow moving band (IB-SA-TfB) was observed near the well with a 436
concomitant disappearance of IB-SA (Fig. S9). Best results were obtained when ratio of 437
IB: SA: TfB was 1:1:2. Further increase of TfB led to turbidity. 438
A
IB-SA-TfB
IB-SA
IB
© 2009 Macmillan Publishers Limited. All rights reserved.
nature nanotechnology | www.nature.com/naturenanotechnology 23
supplementary informationdoi: 10.1038/nnano.2009.83
NNANO-08101037 22
Conjugation of I-switch with a protein of interest. 417
418
419
420
421
422
423
424
425
426
Supplementary Figure S9. Electrophoretic mobility shift assay showing 427
complexation of Streptavidin conjugated I-switch (IB-SA) with Biotinylated Transferrin 428
(TfB).429
Formation of IB-SA and IB-SA-TfB conjugate was confirmed by 3% Agarose gel. Upon 430
Streptavidin (SA) conjugation, the band corresponding to the I-switch shifts to a 431
slower migrating species (IB-SA). To a solution of IB-SA (25 pmole) Biotinylated 432
human holo-Transferrin (TfB) was added in varying ratios, incubated at room 433
temperature for 1 h and then excess Biocytin was added to prevent aggregation, which 434
was further confirmed by gel electrophoresis. With increasing TfB, the gradual 435
increase of a slow moving band (IB-SA-TfB) was observed near the well with a 436
concomitant disappearance of IB-SA (Fig. S9). Best results were obtained when ratio of 437
IB: SA: TfB was 1:1:2. Further increase of TfB led to turbidity. 438
A
IB-SA-TfB
IB-SA
IB
NNANO-08101037 23
Size exclusion chromatography (SEC) to assess homogeneity in TfB conjugated I-439
switch. 440
Size exclusion chromatography was performed on a Shimadzu HPLC system using an 441
SEC column BioSep-SEC-S3000 (Phenomenex, with 5 μm beads, column 442
dimensions: 300mm � 4.6 mm, total column volume (Vc) = 4.98mL, measured void 443
volume (Vo) = 1.9 mL). It is a hydrophilic bonded Silica based column with a pore 444
size of 29 nm, and has exclusion limits of 15 kDa - 700 kDa. IB, IB-SA and IB-SA-TfB 445
was prepared as described earlier, diluted to 1μM concentration with PBS prior to 446
injection and eluted with an isocratic flow of PBS over 30 mins. For IB, SA and IB-SA 447
absorbance at 260 nm was followed whereas Transferrin and its conjugates were 448
followed with at the 475 nm absorbance characteristic of transferrin to determine 449
heterogeneity in the IB-SA-TfB conjugate. 450
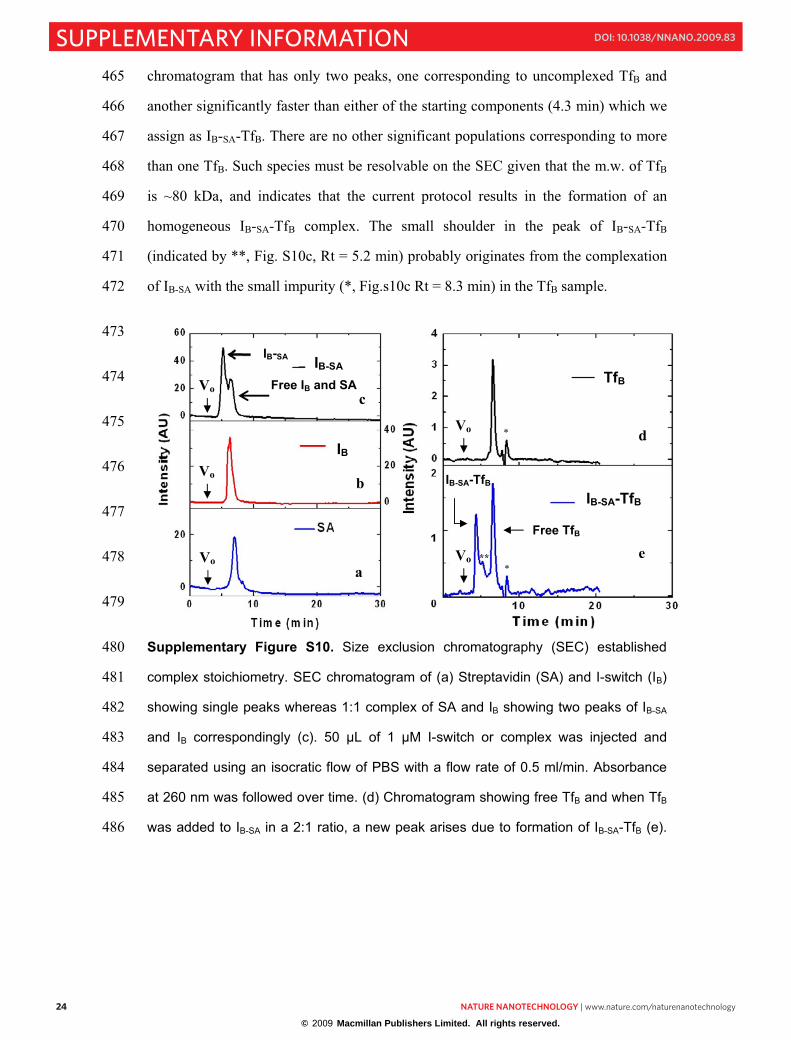
Pure IB and pure SA showed single peaks with a retention time (Rt) of 6.2 min and 7 451
min respectively (Fig. S10a,b). In contrast, a mixture of 1:1 IB:SA showed the 452
appearance of a new peak (Rt: 5.2 min) that is assigned to 1:1 IB-SA. In addition, peaks 453
corresponding to free IB and free SA respectively are also seen (Fig. S10c). Notably 454
there were no other peaks with a low Rt indicating that the complex formed between 455
IB-SA is 1:1. This is consistent with gel electrophoresis data where only a single SA-456
complexed band was observed. 457
Pure TfB showed a predominant single peak around 6.6 min with a very minor peak 458
near 8.3 min (indicated by *) that could correspond to some impurity in the procured 459
sample (Fig. S10d). When IB-SA is added to TfB in a 1:2 ratio it could result in 460
multiple TfB per IB-SA. However, the SEC chromatogram at 475 nm (a wavelength 461
where only TfB is active) shows predominantly only a uniquely-sized species of IB-SA 462
complexed TfB. If a heterogeneous population of more than one TfB resulted, one 463
would expect multiple peaks for this wavelength. However, Figure S10d shows a 464
© 2009 Macmillan Publishers Limited. All rights reserved.
24 nature nanotechnology | www.nature.com/naturenanotechnology
supplementary information doi: 10.1038/nnano.2009.83
NNANO-08101037 24
chromatogram that has only two peaks, one corresponding to uncomplexed TfB and 465
another significantly faster than either of the starting components (4.3 min) which we 466
assign as IB-SA-TfB. There are no other significant populations corresponding to more 467
than one TfB. Such species must be resolvable on the SEC given that the m.w. of TfB 468
is ~80 kDa, and indicates that the current protocol results in the formation of an 469
homogeneous IB-SA-TfB complex. The small shoulder in the peak of IB-SA-TfB 470
(indicated by **, Fig. S10c, Rt = 5.2 min) probably originates from the complexation 471
of IB-SA with the small impurity (*, Fig.s10c Rt = 8.3 min) in the TfB sample. 472
473
474
475
476
477
478
479
Supplementary Figure S10. Size exclusion chromatography (SEC) established 480
complex stoichiometry. SEC chromatogram of (a) Streptavidin (SA) and I-switch (IB)481
showing single peaks whereas 1:1 complex of SA and IB showing two peaks of IB-SA482
and IB correspondingly (c). 50 µL of 1 µM I-switch or complex was injected and 483
separated using an isocratic flow of PBS with a flow rate of 0.5 ml/min. Absorbance 484
at 260 nm was followed over time. (d) Chromatogram showing free TfB and when TfB485
was added to IB-SA in a 2:1 ratio, a new peak arises due to formation of IB-SA-TfB (e). 486
Free TfB
IB
TfB
IB-SA-TfB
IB-SA IB-SA
Free IB and SA
d
e
c
b
a
IB-SA-TfB
IB
Vo
Vo
Vo
Vo
Vo
*
***
© 2009 Macmillan Publishers Limited. All rights reserved.
nature nanotechnology | www.nature.com/naturenanotechnology 25
supplementary informationdoi: 10.1038/nnano.2009.83
NNANO-08101037 24
chromatogram that has only two peaks, one corresponding to uncomplexed TfB and 465
another significantly faster than either of the starting components (4.3 min) which we 466
assign as IB-SA-TfB. There are no other significant populations corresponding to more 467
than one TfB. Such species must be resolvable on the SEC given that the m.w. of TfB 468
is ~80 kDa, and indicates that the current protocol results in the formation of an 469
homogeneous IB-SA-TfB complex. The small shoulder in the peak of IB-SA-TfB 470
(indicated by **, Fig. S10c, Rt = 5.2 min) probably originates from the complexation 471
of IB-SA with the small impurity (*, Fig.s10c Rt = 8.3 min) in the TfB sample. 472
473
474
475
476
477
478
479
Supplementary Figure S10. Size exclusion chromatography (SEC) established 480
complex stoichiometry. SEC chromatogram of (a) Streptavidin (SA) and I-switch (IB)481
showing single peaks whereas 1:1 complex of SA and IB showing two peaks of IB-SA482
and IB correspondingly (c). 50 µL of 1 µM I-switch or complex was injected and 483
separated using an isocratic flow of PBS with a flow rate of 0.5 ml/min. Absorbance 484
at 260 nm was followed over time. (d) Chromatogram showing free TfB and when TfB485
was added to IB-SA in a 2:1 ratio, a new peak arises due to formation of IB-SA-TfB (e). 486
Free TfB
IB
TfB
IB-SA-TfB
IB-SA IB-SA
Free IB and SA
d
e
c
b
a
IB-SA-TfB
IB
Vo
Vo
Vo
Vo
Vo
*
***
NNANO-08101037 25
Transferrin has a 475 nm absorbance peaks and was followed to probe number of 487
bound transferrins on a single IB-SA complex. 488
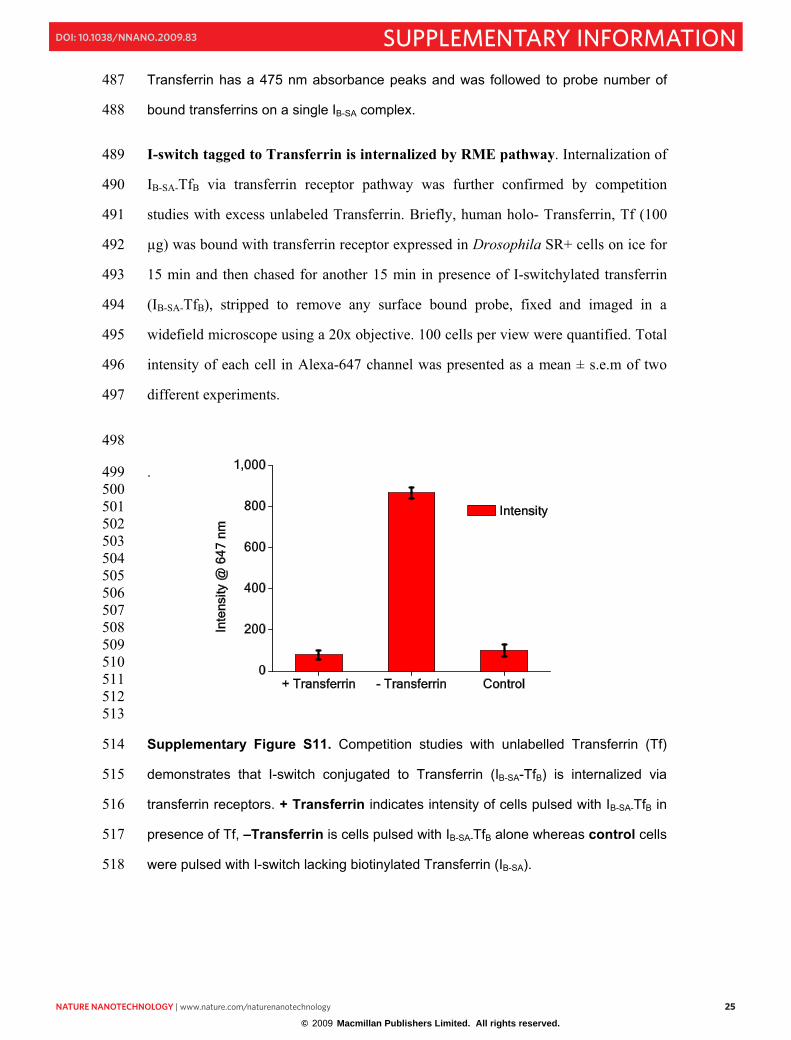
I-switch tagged to Transferrin is internalized by RME pathway. Internalization of 489
IB-SA-TfB via transferrin receptor pathway was further confirmed by competition 490
studies with excess unlabeled Transferrin. Briefly, human holo- Transferrin, Tf (100 491
μg) was bound with transferrin receptor expressed in Drosophila SR+ cells on ice for 492
15 min and then chased for another 15 min in presence of I-switchylated transferrin 493
(IB-SA-TfB), stripped to remove any surface bound probe, fixed and imaged in a 494
widefield microscope using a 20x objective. 100 cells per view were quantified. Total 495
intensity of each cell in Alexa-647 channel was presented as a mean ± s.e.m of two 496
different experiments. 497
498
. 499 500 501 502 503 504 505 506 507 508 509 510 511 512 513
Supplementary Figure S11. Competition studies with unlabelled Transferrin (Tf) 514
demonstrates that I-switch conjugated to Transferrin (IB-SA-TfB) is internalized via 515
transferrin receptors. + Transferrin indicates intensity of cells pulsed with IB-SA-TfB in 516
presence of Tf, –Transferrin is cells pulsed with IB-SA-TfB alone whereas control cells 517
were pulsed with I-switch lacking biotinylated Transferrin (IB-SA). 518
+ Transferrin - Transferrin Control0
200
400
600
800
1,000
Inte
nsity
@ 6
47
nm
Intensity
© 2009 Macmillan Publishers Limited. All rights reserved.
26 nature nanotechnology | www.nature.com/naturenanotechnology
supplementary information doi: 10.1038/nnano.2009.83NNANO-08101037 26
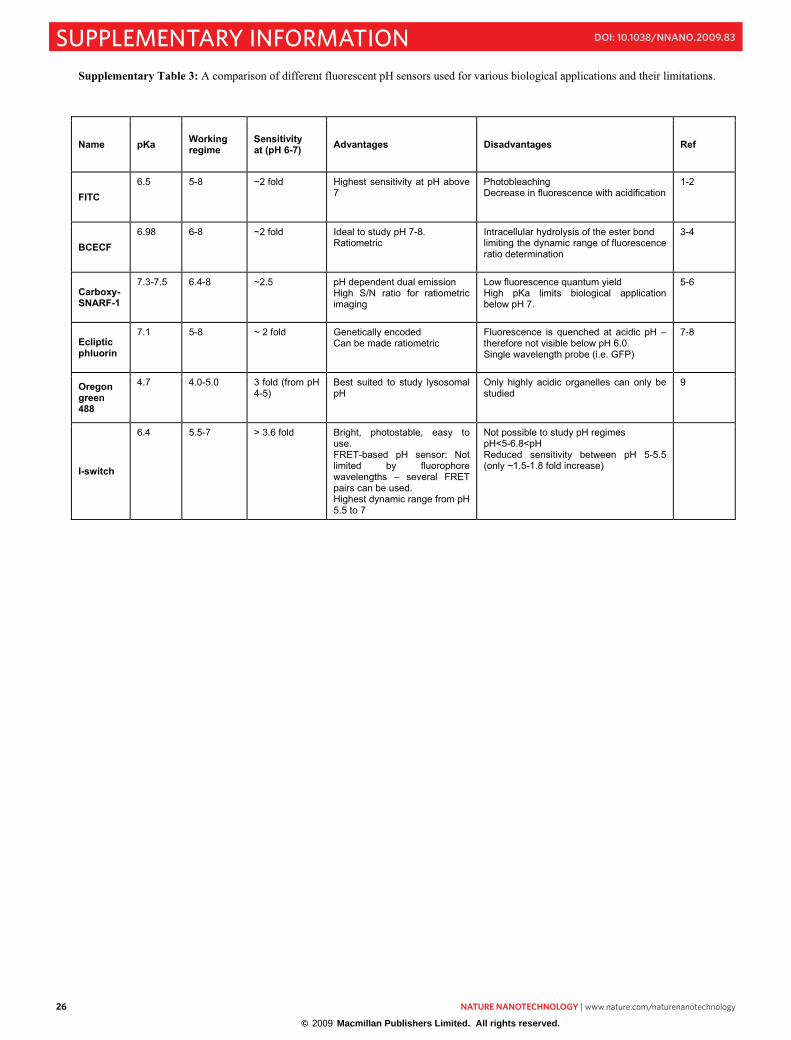
Supplementary Table 3: A comparison of different fluorescent pH sensors used for various biological applications and their limitations.
Name pKa Working regime
Sensitivity at (pH 6-7) Advantages Disadvantages Ref
FITC 6.5 5-8 ~2 fold Highest sensitivity at pH above
7Photobleaching Decrease in fluorescence with acidification
1-2
BCECF 6.98 6-8 ~2 fold Ideal to study pH 7-8.
Ratiometric Intracellular hydrolysis of the ester bond limiting the dynamic range of fluorescence ratio determination
3-4
Carboxy-SNARF-1
7.3-7.5 6.4-8 ~2.5 pH dependent dual emission High S/N ratio for ratiometric imaging
Low fluorescence quantum yield High pKa limits biological application below pH 7.
5-6
Ecliptic phluorin
7.1 5-8 ~ 2 fold Genetically encoded Can be made ratiometric
Fluorescence is quenched at acidic pH – therefore not visible below pH 6.0.Single wavelength probe (i.e. GFP)
7-8
Oregon green 488
4.7 4.0-5.0 3 fold (from pH 4-5)
Best suited to study lysosomal pH
Only highly acidic organelles can only be studied
9
I-switch
6.4 5.5-7 > 3.6 fold Bright, photostable, easy to use. FRET-based pH sensor: Not limited by fluorophore wavelengths – several FRET pairs can be used. Highest dynamic range from pH 5.5 to 7
Not possible to study pH regimes pH<5-6.8<pH Reduced sensitivity between pH 5-5.5 (only ~1.5-1.8 fold increase)
© 2009 Macmillan Publishers Limited. All rights reserved.
nature nanotechnology | www.nature.com/naturenanotechnology 27
supplementary informationdoi: 10.1038/nnano.2009.83NNANO-08101037 26
Supplementary Table 3: A comparison of different fluorescent pH sensors used for various biological applications and their limitations.
Name pKa Working regime
Sensitivity at (pH 6-7) Advantages Disadvantages Ref
FITC 6.5 5-8 ~2 fold Highest sensitivity at pH above
7Photobleaching Decrease in fluorescence with acidification
1-2
BCECF 6.98 6-8 ~2 fold Ideal to study pH 7-8.
Ratiometric Intracellular hydrolysis of the ester bond limiting the dynamic range of fluorescence ratio determination
3-4
Carboxy-SNARF-1
7.3-7.5 6.4-8 ~2.5 pH dependent dual emission High S/N ratio for ratiometric imaging
Low fluorescence quantum yield High pKa limits biological application below pH 7.
5-6
Ecliptic phluorin
7.1 5-8 ~ 2 fold Genetically encoded Can be made ratiometric
Fluorescence is quenched at acidic pH – therefore not visible below pH 6.0.Single wavelength probe (i.e. GFP)
7-8
Oregon green 488
4.7 4.0-5.0 3 fold (from pH 4-5)
Best suited to study lysosomal pH
Only highly acidic organelles can only be studied
9
I-switch
6.4 5.5-7 > 3.6 fold Bright, photostable, easy to use. FRET-based pH sensor: Not limited by fluorophore wavelengths – several FRET pairs can be used. Highest dynamic range from pH 5.5 to 7
Not possible to study pH regimes pH<5-6.8<pH Reduced sensitivity between pH 5-5.5 (only ~1.5-1.8 fold increase)
NNANO-08101037 27
Supplementary References:
1. Ohkuma, S. & Poole, B. Fluorescence probe measurement of the intralysosomal
pH in living cells and the perturbation of pH by various agents. Proc. Natl.
Acad. Sci. USA. 75, 3327-3331 (1978).
2. Lanz, E., Gregor, M., Slavík, J., & Kotyk, A. Use of FITC as a Fluorescent
Probe for Intracellular pH Measurement. Journal of Fluorescence 7, 317-
319,(1997).
3. Gan, B. S., Krump, E., Shrode, L. D., & Grinstein, S. Loading pyranine via
purinergic receptors or hypotonic stress for measurement of cytosolic pH by
imaging. Am J Physiol Cell Physiol 275, 1158-1166, (1998).
4. Grant, R. & Acosta, D. Ratiometric measurement of intracellular pH of cultured
cells with BCECF in a fluorescence multi-well plate reader. In Vitro Cell Dev.
Biol.--Animal 33, 256-260, (1997).
5. Buckler, J. & Vaughan-Jones, R. D. Application of a new pH-sensitive
fluorophore Carboxy-SNARF-1 for intracellular pH measurement in small,
isolated cells. European Journal of Physiology 417, 234- 239, (1990).
6. Seksek. O., & Bolard, J. Nuclear pH gradient in mammalian cells revealed by
Laser microspectrofluorimetry. Journal of Cell Science 109, 257-262 (1996).
7. Miesenböck, G., De Angelis, D., & Rothman, J. E. Visualizing secretion and
synaptic transmission with pH-sensitive green fluorescent proteins. Nature 394,
192-195, (1998).
8. Sankaranarayanan, S., De Angelis, D., Rothman, J. E., & Ryan, T. A. The Use
of pHluorins for Optical Measurements of Presynaptic Activity. Biophys J 79,
2199-2208, (2000).
9. Porte, F., Liautard, J-P & Köhler, S., Early acidification of phagosomes
containing Brucella suis is essential for intracellular survival in murine
macrophages. Infect Immun. 67, 4041–4047, (1999).
© 2009 Macmillan Publishers Limited. All rights reserved.

![Bhupal Dev - Physics Department at UMass Amherst ’15; Bambhaniya, BD, Goswami, Khan, Rodejohann ’16] Bhupal Dev (Washington U.) Leptogenesis and Colliders ACFI Workshop 13 / 45](https://static.fdocument.org/doc/165x107/5af7528b7f8b9a5f588b5a95/bhupal-dev-physics-department-at-umass-15-bambhaniya-bd-goswami-khan-rodejohann.jpg)