3 LabVIEW Math Functions -...
12
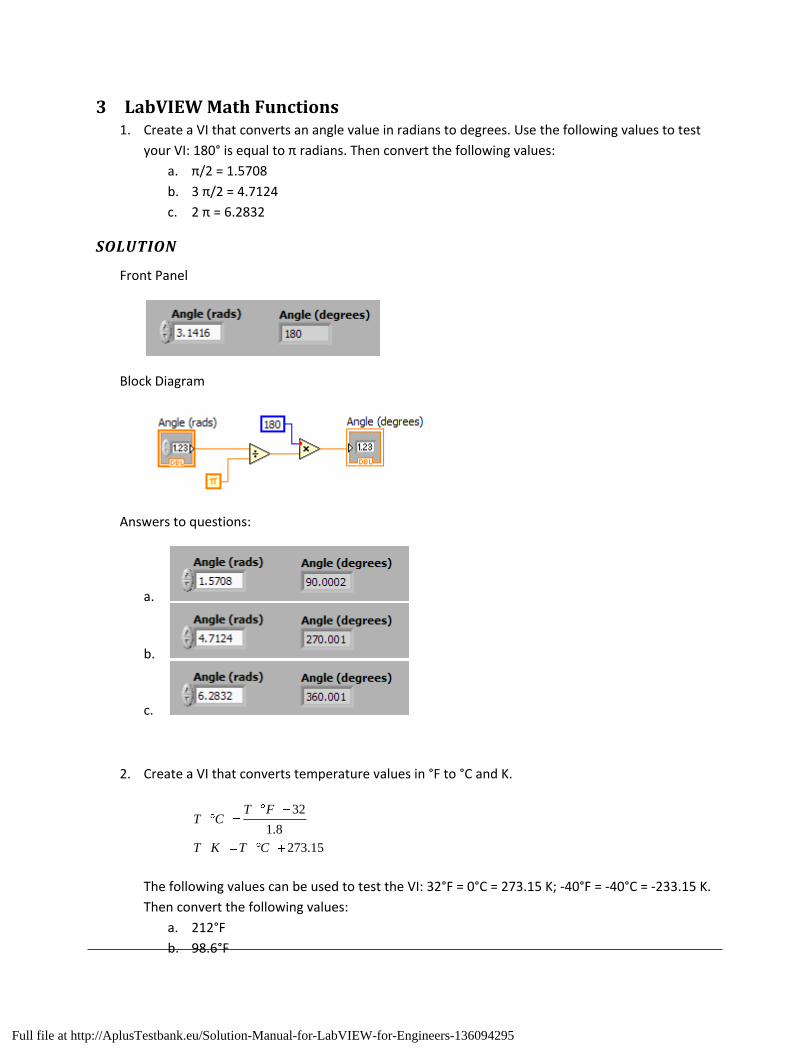
3 LabVIEW Math Functions 1. Create a VI that converts an angle value in radians to degrees. Use the following values to test your VI: 180° is equal to π radians. Then convert the following values: a. π/2 = 1.5708 b. 3 π/2 = 4.7124 c. 2 π = 6.2832 SOLUTION Front Panel Block Diagram Answers to questions: a. b. c. 2. Create a VI that converts temperature values in °F to °C and K. 32 1.8 273.15 T F T C T K T C The following values can be used to test the VI: 32°F = 0°C = 273.15 K; -40°F = -40°C = -233.15 K. Then convert the following values: a. 212°F b. 98.6°F © 2011 Pearson Education, Inc., Upper Saddle River, NJ. All rights reserved. This publication is protected by Copyright and written permission should be Full file at http://AplusTestbank.eu/Solution-Manual-for-LabVIEW-for-Engineers-136094295
Transcript of 3 LabVIEW Math Functions -...
- 12 -
3 LabVIEW Math Functions 1. Create a VI that converts an angle value in radians to degrees. Use the following values to test
your VI: 180° is equal to π radians. Then convert the following values:
a. π/2 = 1.5708
b. 3 π/2 = 4.7124
c. 2 π = 6.2832
SOLUTION
Front Panel
Block Diagram
Answers to questions:
a.
b.
c.
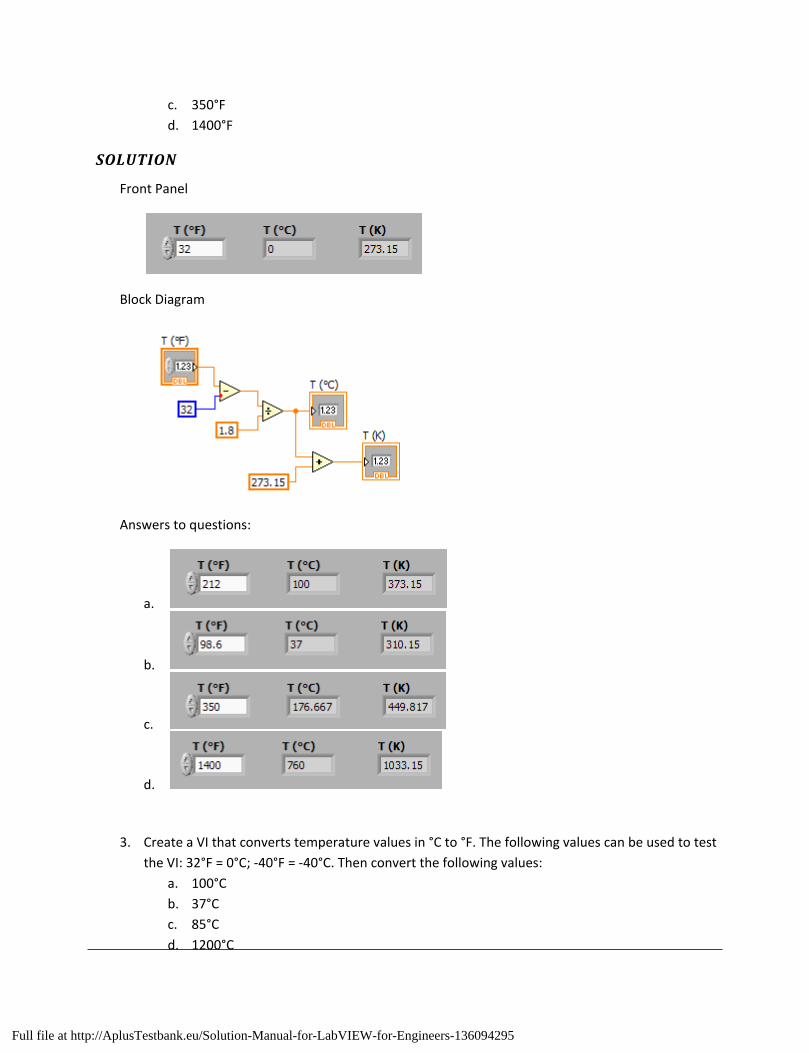
2. Create a VI that converts temperature values in °F to °C and K.
32
1.8
273.15
T FT C
T K T C
The following values can be used to test the VI: 32°F = 0°C = 273.15 K; -40°F = -40°C = -233.15 K.
Then convert the following values:
a. 212°F
b. 98.6°F
© 2011 Pearson Education, Inc., Upper Saddle River, NJ. All rights reserved. This publication is protected by Copyright and written permission should be obtained from the publisher prior to any prohibited reproduction, storage in a retrieval system, or transmission in any form or by any means, electronic, mechanical, photocopying, recording, or likewise. For information regarding permission(s), write to: Rights and Permissions Department, Pearson Education, Inc., Upper Saddle River, NJ 07458.
Full file at http://AplusTestbank.eu/Solution-Manual-for-LabVIEW-for-Engineers-136094295
- 13 -
c. 350°F
d. 1400°F
SOLUTION
Front Panel
Block Diagram
Answers to questions:
a.
b.
c.
d.
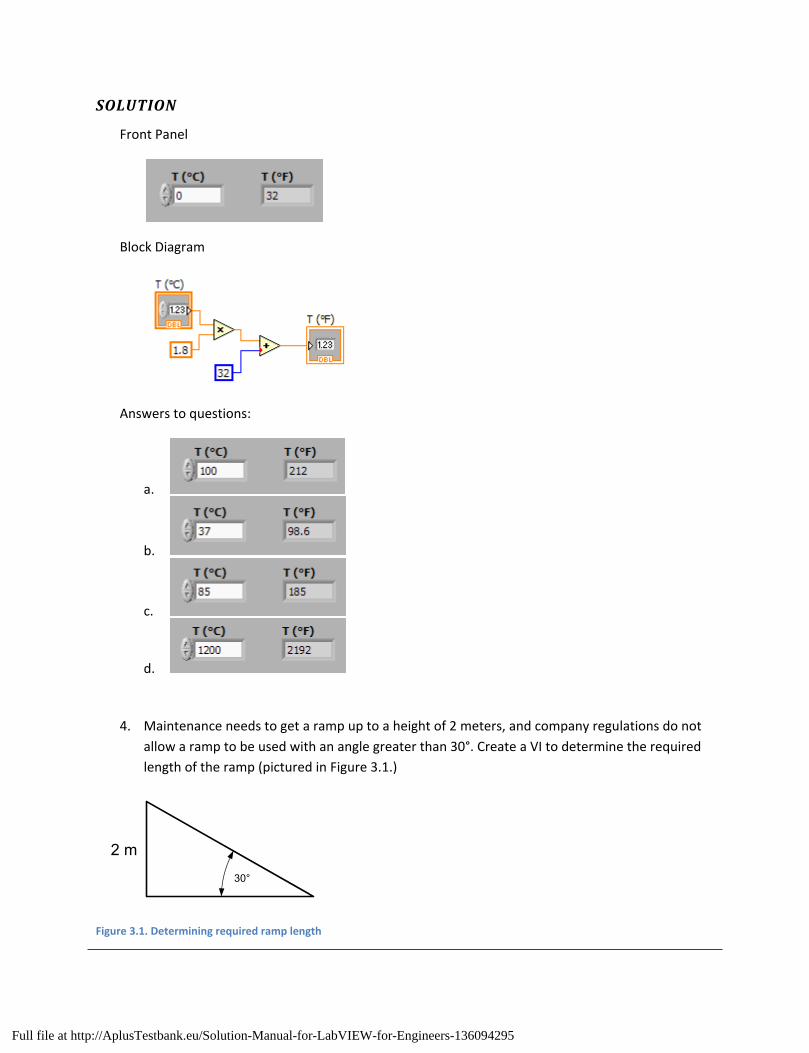
3. Create a VI that converts temperature values in °C to °F. The following values can be used to test
the VI: 32°F = 0°C; -40°F = -40°C. Then convert the following values:
a. 100°C
b. 37°C
c. 85°C
d. 1200°C
© 2011 Pearson Education, Inc., Upper Saddle River, NJ. All rights reserved. This publication is protected by Copyright and written permission should be obtained from the publisher prior to any prohibited reproduction, storage in a retrieval system, or transmission in any form or by any means, electronic, mechanical, photocopying, recording, or likewise. For information regarding permission(s), write to: Rights and Permissions Department, Pearson Education, Inc., Upper Saddle River, NJ 07458.
Full file at http://AplusTestbank.eu/Solution-Manual-for-LabVIEW-for-Engineers-136094295
- 14 -
SOLUTION
Front Panel
Block Diagram
Answers to questions:
a.
b.
c.
d.
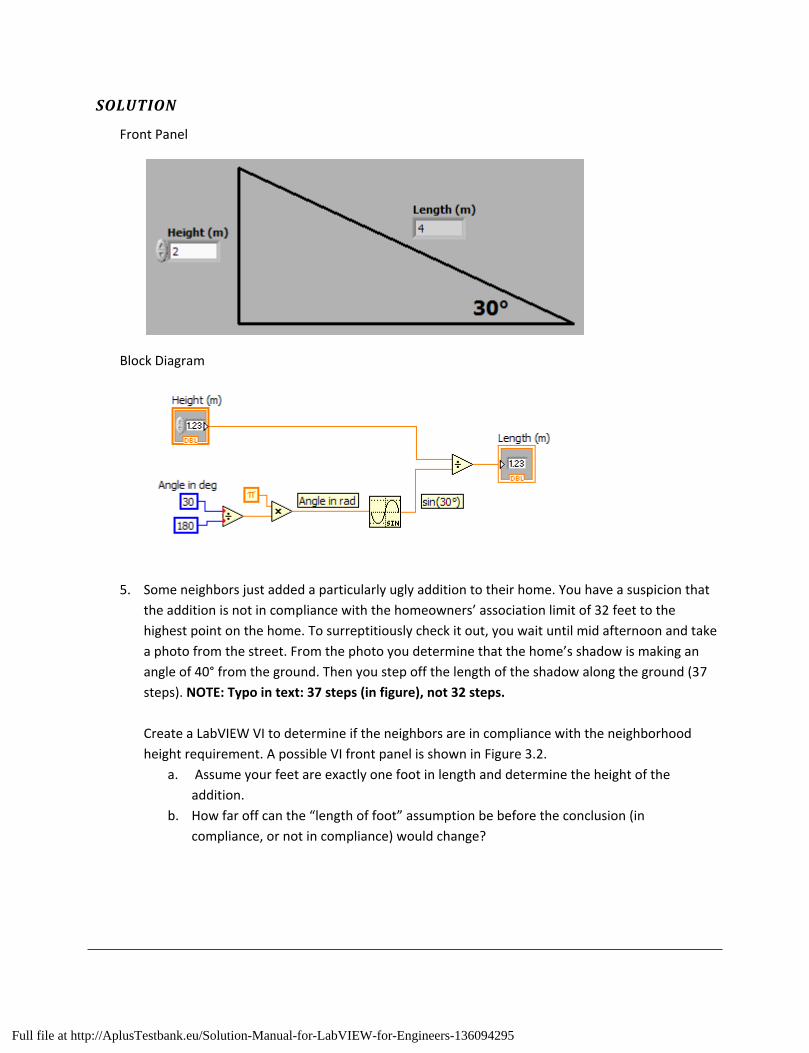
4. Maintenance needs to get a ramp up to a height of 2 meters, and company regulations do not
allow a ramp to be used with an angle greater than 30°. Create a VI to determine the required
length of the ramp (pictured in Figure 3.1.)
30°
2 m
Figure 3.1. Determining required ramp length
© 2011 Pearson Education, Inc., Upper Saddle River, NJ. All rights reserved. This publication is protected by Copyright and written permission should be obtained from the publisher prior to any prohibited reproduction, storage in a retrieval system, or transmission in any form or by any means, electronic, mechanical, photocopying, recording, or likewise. For information regarding permission(s), write to: Rights and Permissions Department, Pearson Education, Inc., Upper Saddle River, NJ 07458.
Full file at http://AplusTestbank.eu/Solution-Manual-for-LabVIEW-for-Engineers-136094295
- 15 -
SOLUTION
Front Panel
Block Diagram
5. Some neighbors just added a particularly ugly addition to their home. You have a suspicion that
the addition is not in compliance with the homeowners’ association limit of 32 feet to the
highest point on the home. To surreptitiously check it out, you wait until mid afternoon and take
a photo from the street. From the photo you determine that the home’s shadow is making an
angle of 40° from the ground. Then you step off the length of the shadow along the ground (37
steps). NOTE: Typo in text: 37 steps (in figure), not 32 steps.
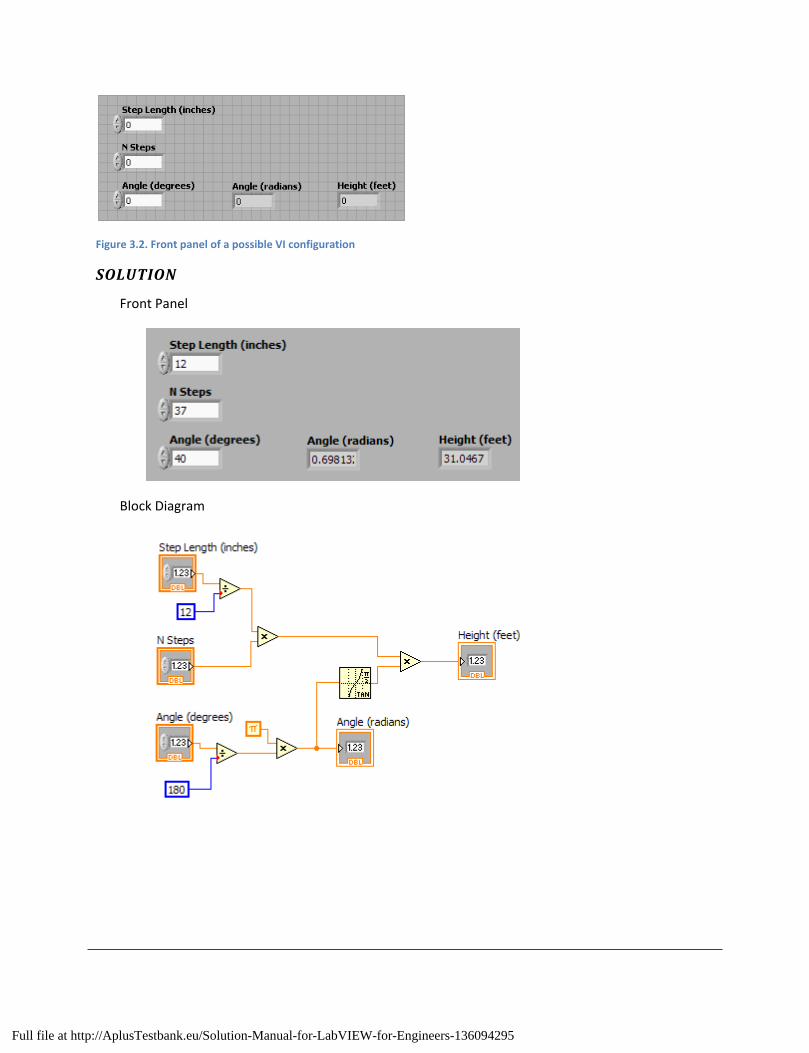
Create a LabVIEW VI to determine if the neighbors are in compliance with the neighborhood
height requirement. A possible VI front panel is shown in Figure 3.2.
a. Assume your feet are exactly one foot in length and determine the height of the
addition.
b. How far off can the “length of foot” assumption be before the conclusion (in
compliance, or not in compliance) would change?
© 2011 Pearson Education, Inc., Upper Saddle River, NJ. All rights reserved. This publication is protected by Copyright and written permission should be obtained from the publisher prior to any prohibited reproduction, storage in a retrieval system, or transmission in any form or by any means, electronic, mechanical, photocopying, recording, or likewise. For information regarding permission(s), write to: Rights and Permissions Department, Pearson Education, Inc., Upper Saddle River, NJ 07458.
Full file at http://AplusTestbank.eu/Solution-Manual-for-LabVIEW-for-Engineers-136094295
- 16 -
Figure 3.2. Front panel of a possible VI configuration
SOLUTION
Front Panel
Block Diagram
© 2011 Pearson Education, Inc., Upper Saddle River, NJ. All rights reserved. This publication is protected by Copyright and written permission should be obtained from the publisher prior to any prohibited reproduction, storage in a retrieval system, or transmission in any form or by any means, electronic, mechanical, photocopying, recording, or likewise. For information regarding permission(s), write to: Rights and Permissions Department, Pearson Education, Inc., Upper Saddle River, NJ 07458.
Full file at http://AplusTestbank.eu/Solution-Manual-for-LabVIEW-for-Engineers-136094295
- 17 -
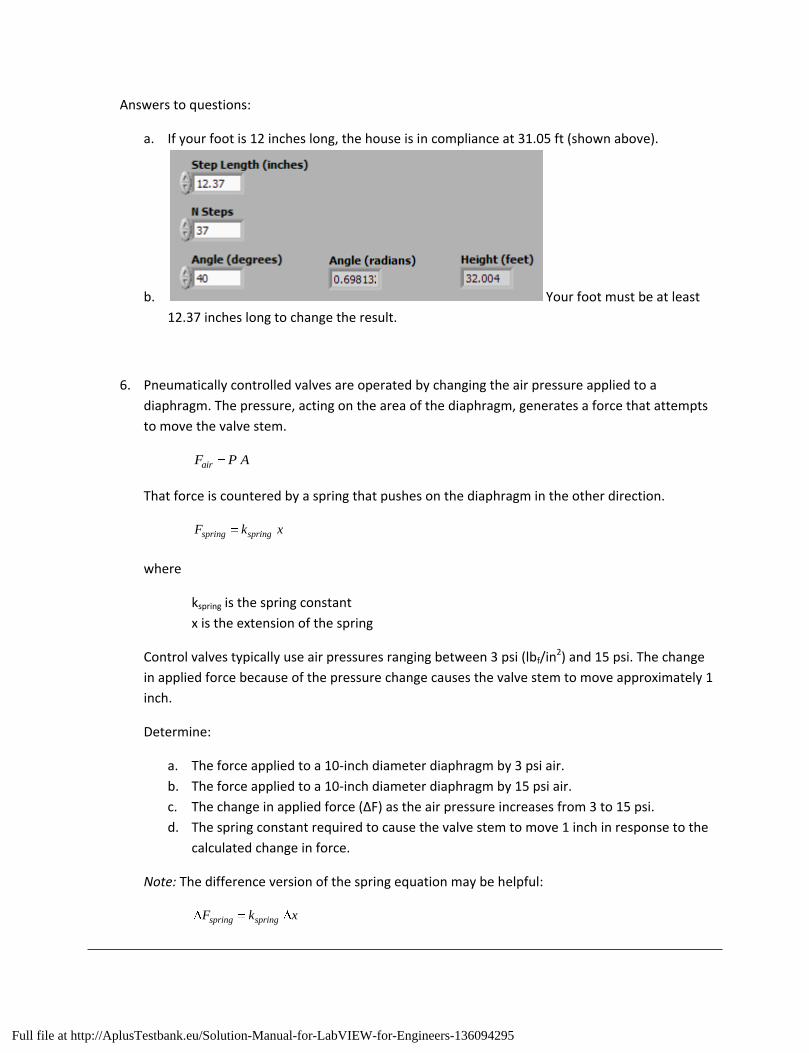
Answers to questions:
a. If your foot is 12 inches long, the house is in compliance at 31.05 ft (shown above).
b. Your foot must be at least
12.37 inches long to change the result.
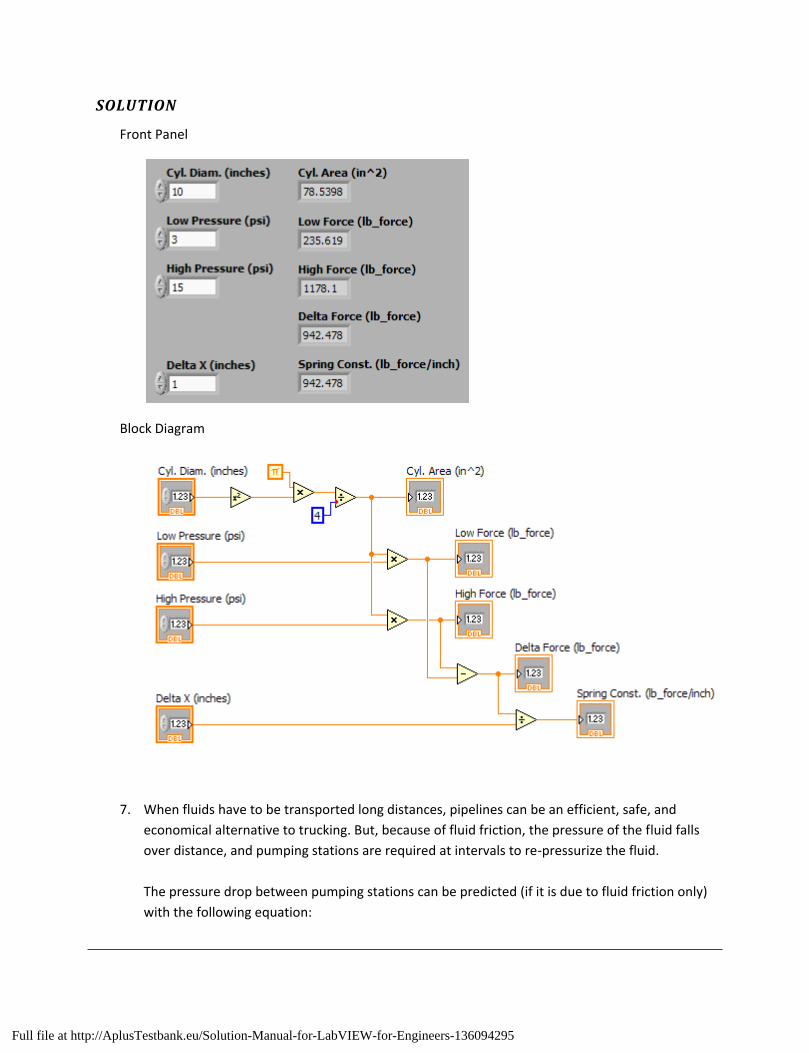
6. Pneumatically controlled valves are operated by changing the air pressure applied to a
diaphragm. The pressure, acting on the area of the diaphragm, generates a force that attempts
to move the valve stem.
airF P A
That force is countered by a spring that pushes on the diaphragm in the other direction.
spring springF k x
where
kspring is the spring constant
x is the extension of the spring
Control valves typically use air pressures ranging between 3 psi (lbf/in2) and 15 psi. The change
in applied force because of the pressure change causes the valve stem to move approximately 1
inch.
Determine:
a. The force applied to a 10-inch diameter diaphragm by 3 psi air.
b. The force applied to a 10-inch diameter diaphragm by 15 psi air.
c. The change in applied force (ΔF) as the air pressure increases from 3 to 15 psi.
d. The spring constant required to cause the valve stem to move 1 inch in response to the
calculated change in force.
Note: The difference version of the spring equation may be helpful:
spring springF k x
© 2011 Pearson Education, Inc., Upper Saddle River, NJ. All rights reserved. This publication is protected by Copyright and written permission should be obtained from the publisher prior to any prohibited reproduction, storage in a retrieval system, or transmission in any form or by any means, electronic, mechanical, photocopying, recording, or likewise. For information regarding permission(s), write to: Rights and Permissions Department, Pearson Education, Inc., Upper Saddle River, NJ 07458.
Full file at http://AplusTestbank.eu/Solution-Manual-for-LabVIEW-for-Engineers-136094295
- 18 -
SOLUTION
Front Panel
Block Diagram
7. When fluids have to be transported long distances, pipelines can be an efficient, safe, and
economical alternative to trucking. But, because of fluid friction, the pressure of the fluid falls
over distance, and pumping stations are required at intervals to re-pressurize the fluid.
The pressure drop between pumping stations can be predicted (if it is due to fluid friction only)
with the following equation:
© 2011 Pearson Education, Inc., Upper Saddle River, NJ. All rights reserved. This publication is protected by Copyright and written permission should be obtained from the publisher prior to any prohibited reproduction, storage in a retrieval system, or transmission in any form or by any means, electronic, mechanical, photocopying, recording, or likewise. For information regarding permission(s), write to: Rights and Permissions Department, Pearson Education, Inc., Upper Saddle River, NJ 07458.
Full file at http://AplusTestbank.eu/Solution-Manual-for-LabVIEW-for-Engineers-136094295
- 19 -
21
2avg
LP f V
D
where
f is the Moody (or Darcy) friction factor (no units)
ρ is the fluid density (kg/m3)
L is the distance between pumping stations (m)
D is the pipe diameter (m)
Vavg is the average fluid velocity (m/s)
The friction factor depends in a complicated fashion on fluid, flow rate, and pipe surface
conditions. For this problem, assume that f = 0.008.
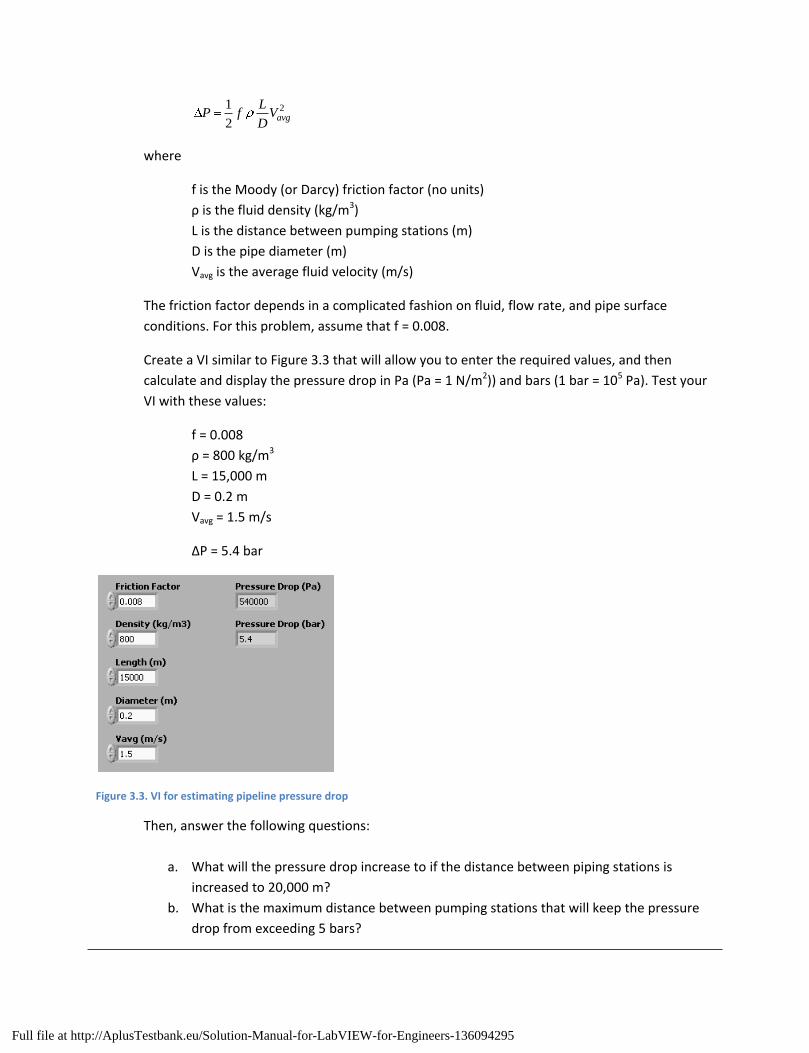
Create a VI similar to Figure 3.3 that will allow you to enter the required values, and then
calculate and display the pressure drop in Pa (Pa = 1 N/m2)) and bars (1 bar = 105 Pa). Test your
VI with these values:
f = 0.008
ρ = 800 kg/m3
L = 15,000 m
D = 0.2 m
Vavg = 1.5 m/s
ΔP = 5.4 bar
Figure 3.3. VI for estimating pipeline pressure drop
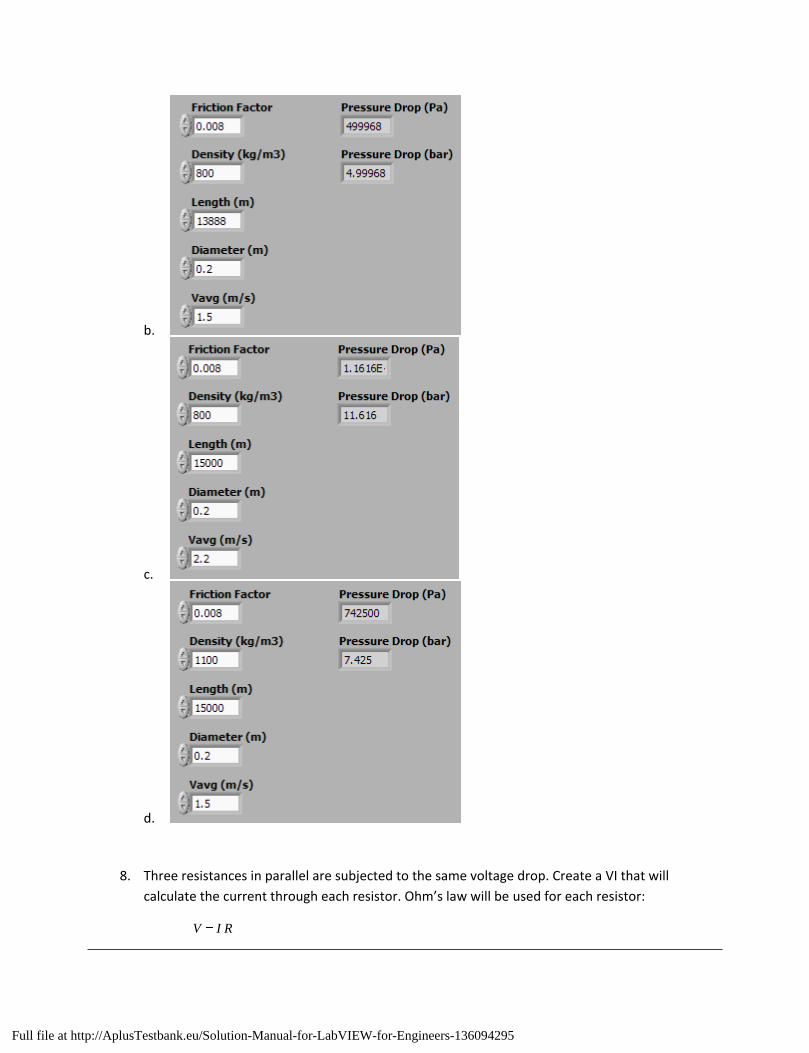
Then, answer the following questions:
a. What will the pressure drop increase to if the distance between piping stations is
increased to 20,000 m?
b. What is the maximum distance between pumping stations that will keep the pressure
drop from exceeding 5 bars?
© 2011 Pearson Education, Inc., Upper Saddle River, NJ. All rights reserved. This publication is protected by Copyright and written permission should be obtained from the publisher prior to any prohibited reproduction, storage in a retrieval system, or transmission in any form or by any means, electronic, mechanical, photocopying, recording, or likewise. For information regarding permission(s), write to: Rights and Permissions Department, Pearson Education, Inc., Upper Saddle River, NJ 07458.
Full file at http://AplusTestbank.eu/Solution-Manual-for-LabVIEW-for-Engineers-136094295
- 20 -
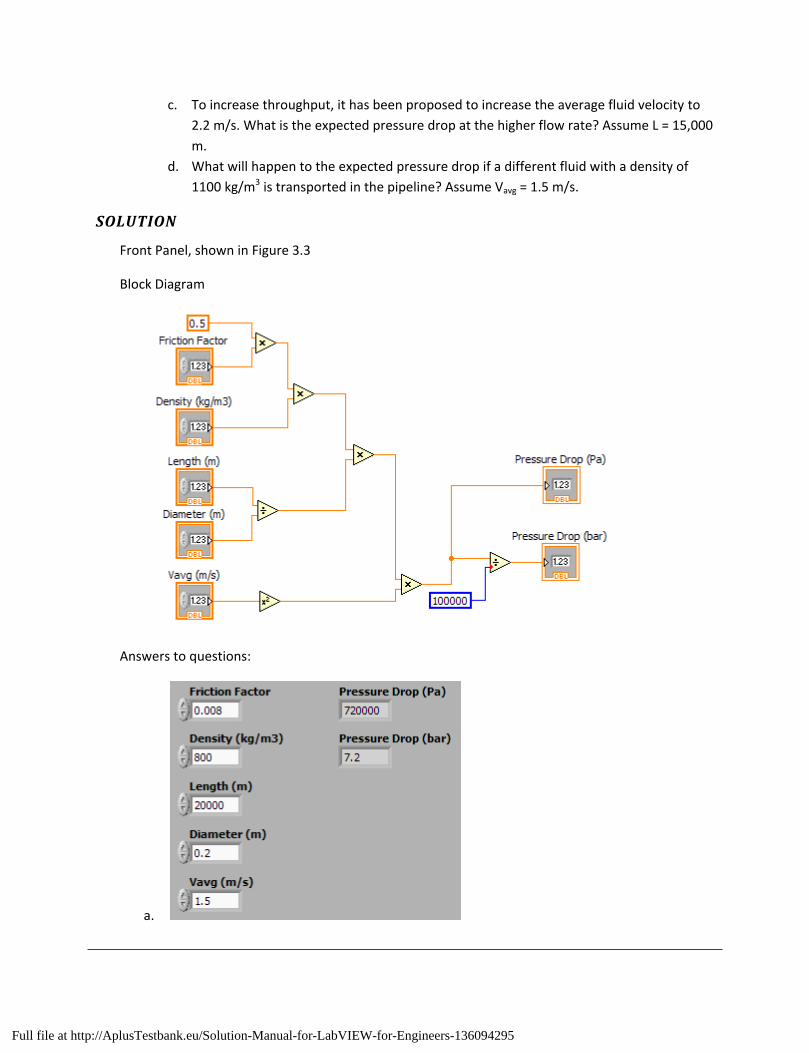
c. To increase throughput, it has been proposed to increase the average fluid velocity to
2.2 m/s. What is the expected pressure drop at the higher flow rate? Assume L = 15,000
m.
d. What will happen to the expected pressure drop if a different fluid with a density of
1100 kg/m3 is transported in the pipeline? Assume Vavg = 1.5 m/s.
SOLUTION
Front Panel, shown in Figure 3.3
Block Diagram
Answers to questions:
a.
© 2011 Pearson Education, Inc., Upper Saddle River, NJ. All rights reserved. This publication is protected by Copyright and written permission should be obtained from the publisher prior to any prohibited reproduction, storage in a retrieval system, or transmission in any form or by any means, electronic, mechanical, photocopying, recording, or likewise. For information regarding permission(s), write to: Rights and Permissions Department, Pearson Education, Inc., Upper Saddle River, NJ 07458.
Full file at http://AplusTestbank.eu/Solution-Manual-for-LabVIEW-for-Engineers-136094295
- 21 -
b.
c.
d.
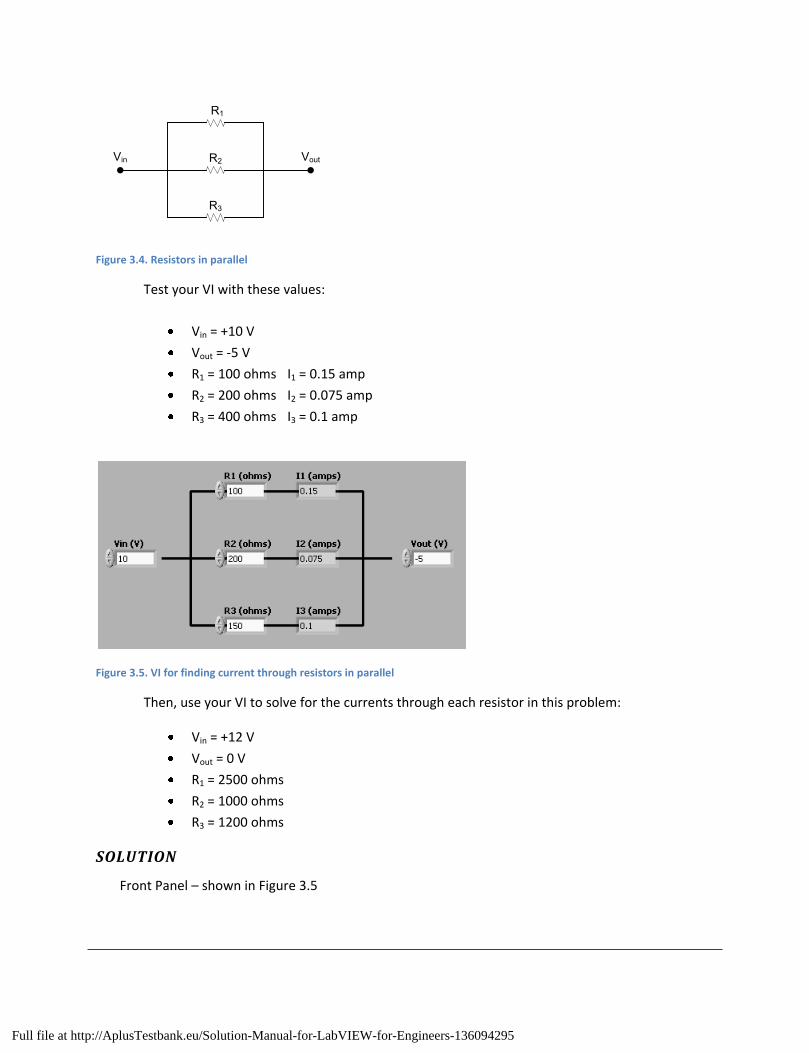
8. Three resistances in parallel are subjected to the same voltage drop. Create a VI that will
calculate the current through each resistor. Ohm’s law will be used for each resistor:
V I R
© 2011 Pearson Education, Inc., Upper Saddle River, NJ. All rights reserved. This publication is protected by Copyright and written permission should be obtained from the publisher prior to any prohibited reproduction, storage in a retrieval system, or transmission in any form or by any means, electronic, mechanical, photocopying, recording, or likewise. For information regarding permission(s), write to: Rights and Permissions Department, Pearson Education, Inc., Upper Saddle River, NJ 07458.
Full file at http://AplusTestbank.eu/Solution-Manual-for-LabVIEW-for-Engineers-136094295
- 22 -
R1
R2
R3
Vin Vout
Figure 3.4. Resistors in parallel
Test your VI with these values:
Vin = +10 V
Vout = -5 V
R1 = 100 ohms I1 = 0.15 amp
R2 = 200 ohms I2 = 0.075 amp
R3 = 400 ohms I3 = 0.1 amp
Figure 3.5. VI for finding current through resistors in parallel
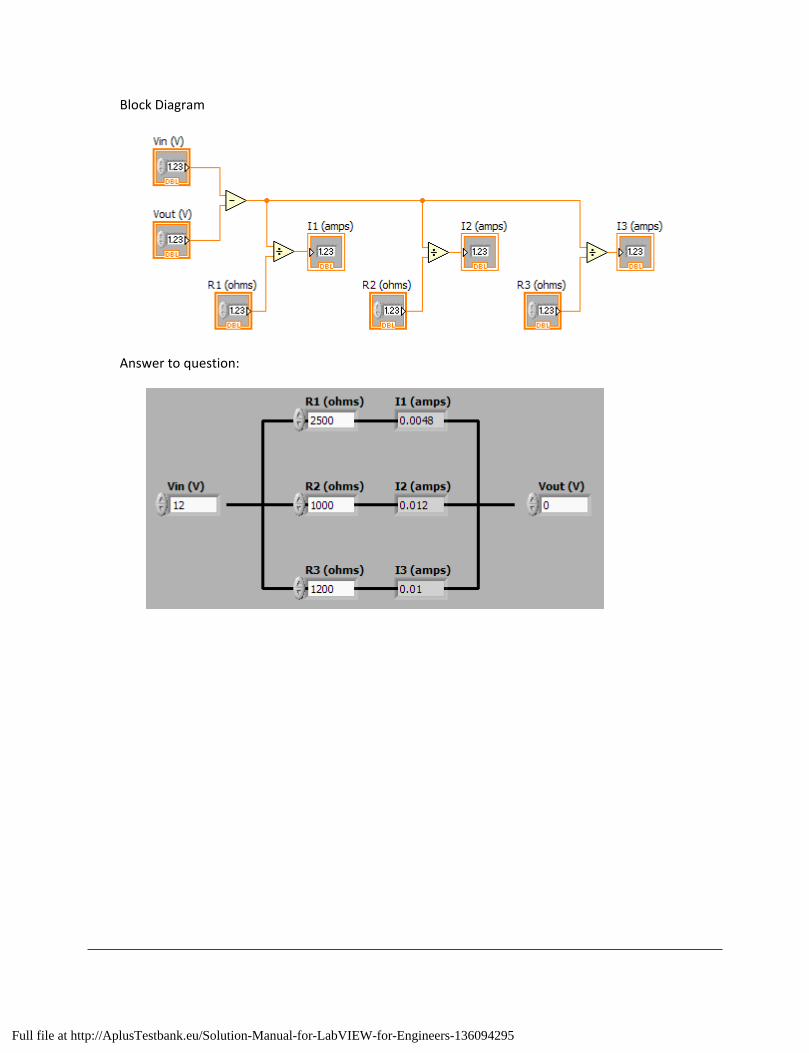
Then, use your VI to solve for the currents through each resistor in this problem:
Vin = +12 V
Vout = 0 V
R1 = 2500 ohms
R2 = 1000 ohms
R3 = 1200 ohms
SOLUTION
Front Panel – shown in Figure 3.5
© 2011 Pearson Education, Inc., Upper Saddle River, NJ. All rights reserved. This publication is protected by Copyright and written permission should be obtained from the publisher prior to any prohibited reproduction, storage in a retrieval system, or transmission in any form or by any means, electronic, mechanical, photocopying, recording, or likewise. For information regarding permission(s), write to: Rights and Permissions Department, Pearson Education, Inc., Upper Saddle River, NJ 07458.
Full file at http://AplusTestbank.eu/Solution-Manual-for-LabVIEW-for-Engineers-136094295
- 23 -
Block Diagram
Answer to question:
© 2011 Pearson Education, Inc., Upper Saddle River, NJ. All rights reserved. This publication is protected by Copyright and written permission should be obtained from the publisher prior to any prohibited reproduction, storage in a retrieval system, or transmission in any form or by any means, electronic, mechanical, photocopying, recording, or likewise. For information regarding permission(s), write to: Rights and Permissions Department, Pearson Education, Inc., Upper Saddle River, NJ 07458.
Full file at http://AplusTestbank.eu/Solution-Manual-for-LabVIEW-for-Engineers-136094295