Lean Six Sigma, Kaizen and Kata for Chemical Engineers · PDF fileLean Six Sigma, Kaizen and...
57
Lean Six Sigma, Kaizen and Kata for Chemical Engineers Ms. Janet L. Hammill Leadership Career with Dow Chemical, GE Plastics and Alcoa Six Sigma Master Black Belt (6σ MBB) Director, J L Hammill Consulting, [email protected] AIChE and ABEQ Oct 2016
Transcript of Lean Six Sigma, Kaizen and Kata for Chemical Engineers · PDF fileLean Six Sigma, Kaizen and...
Lean Six Sigma, Kaizen and Kata for Chemical Engineers
Ms. Janet L. Hammill Leadership Career with Dow Chemical, GE Plastics and Alcoa Six Sigma Master Black Belt (6σ MBB) Director, J L Hammill Consulting, [email protected]
AIChE and ABEQ Oct 2016
Agenda
2
Observation: This Document contains 5 Messages from Mars
Focus Lean Sigma, Kaizen and Kata Getting Started in 2016 Proven Success Take Aways
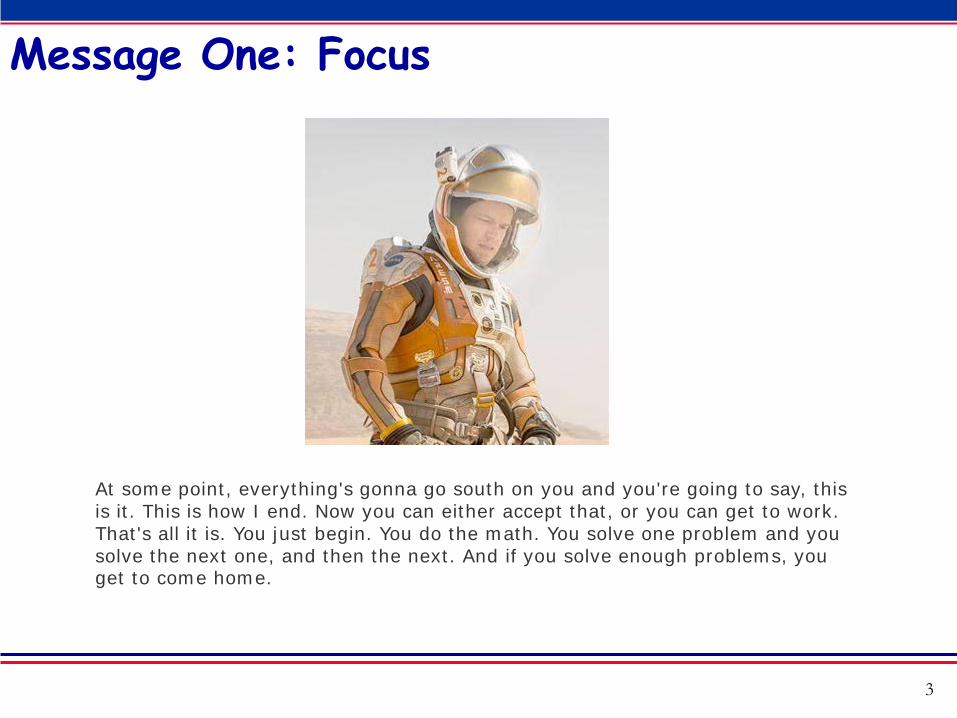
Message One: Focus
3
At some point, everything's gonna go south on you and you're going to say, this is it. This is how I end. Now you can either accept that, or you can get to work. That's all it is. You just begin. You do the math. You solve one problem and you solve the next one, and then the next. And if you solve enough problems, you get to come home.
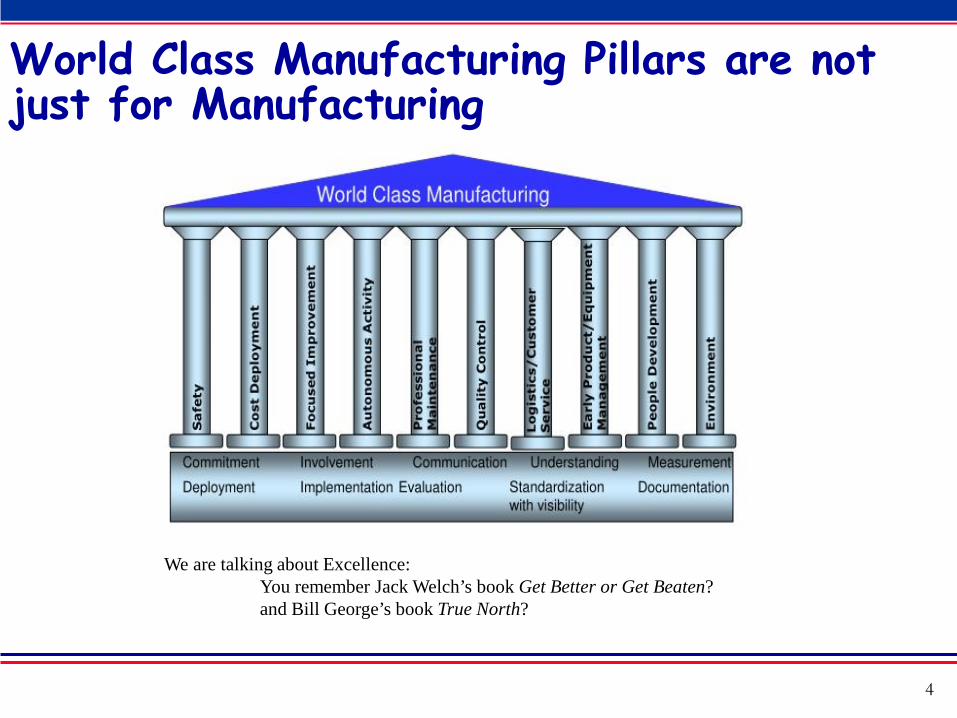
World Class Manufacturing Pillars are not just for Manufacturing
4
We are talking about Excellence: You remember Jack Welch’s book Get Better or Get Beaten? and Bill George’s book True North?
5
Process Vision
(To Be)
Benefits Realized
Gap Analysis
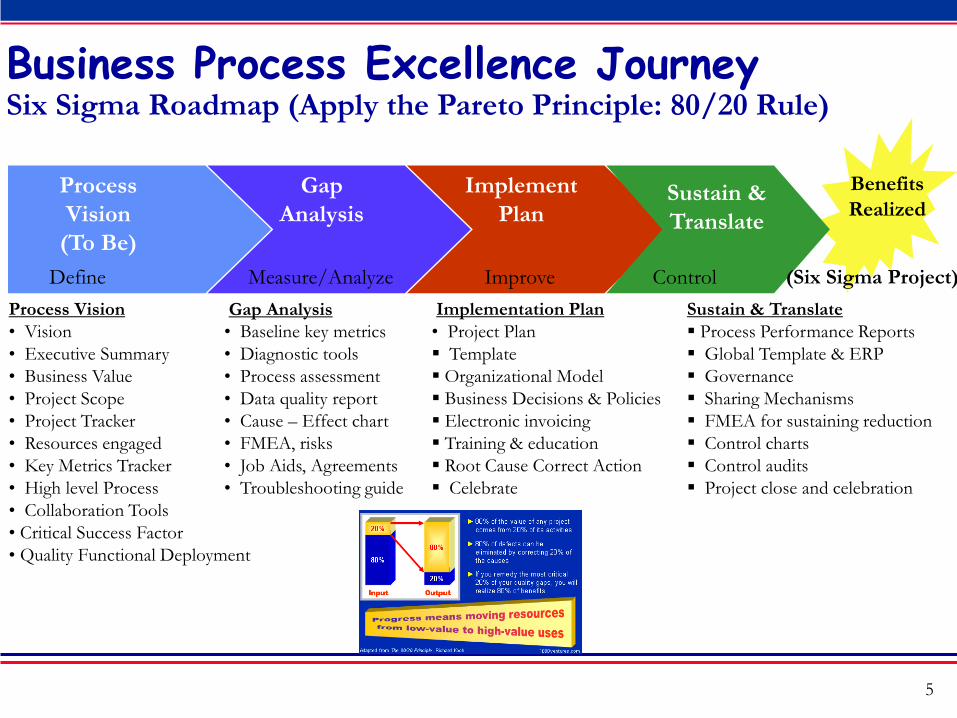
Process Vision • Vision • Executive Summary • Business Value • Project Scope • Project Tracker • Resources engaged • Key Metrics Tracker • High level Process • Collaboration Tools • Critical Success Factor • Quality Functional Deployment
Gap Analysis • Baseline key metrics • Diagnostic tools • Process assessment • Data quality report • Cause – Effect chart • FMEA, risks • Job Aids, Agreements • Troubleshooting guide
Implementation Plan • Project Plan Template Organizational Model Business Decisions & Policies Electronic invoicing Training & education Root Cause Correct Action Celebrate
Sustain & Translate Process Performance Reports Global Template & ERP Governance Sharing Mechanisms FMEA for sustaining reduction Control charts Control audits Project close and celebration
Implement Plan
Sustain & Translate
Define Measure/Analyze Improve Control (Six Sigma Project)
Business Process Excellence Journey Six Sigma Roadmap (Apply the Pareto Principle: 80/20 Rule)

Know Your Performance Capability
6
Six Sigma improvement strives for precision and accuracy by reducing the deviation or spread and meeting the target.
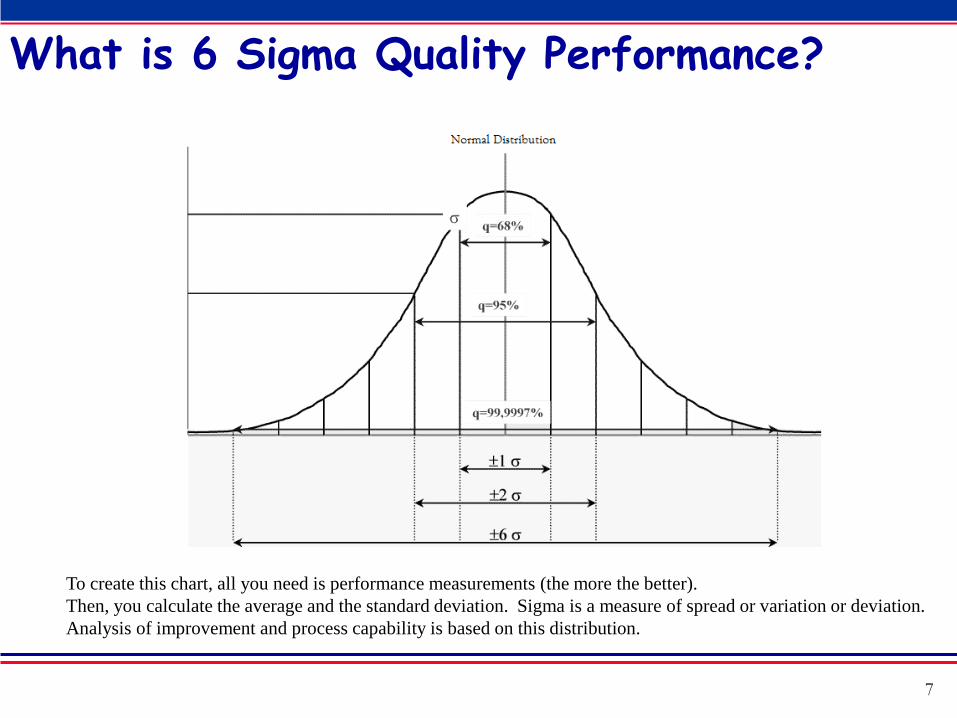
What is 6 Sigma Quality Performance?
7
To create this chart, all you need is performance measurements (the more the better). Then, you calculate the average and the standard deviation. Sigma is a measure of spread or variation or deviation. Analysis of improvement and process capability is based on this distribution.
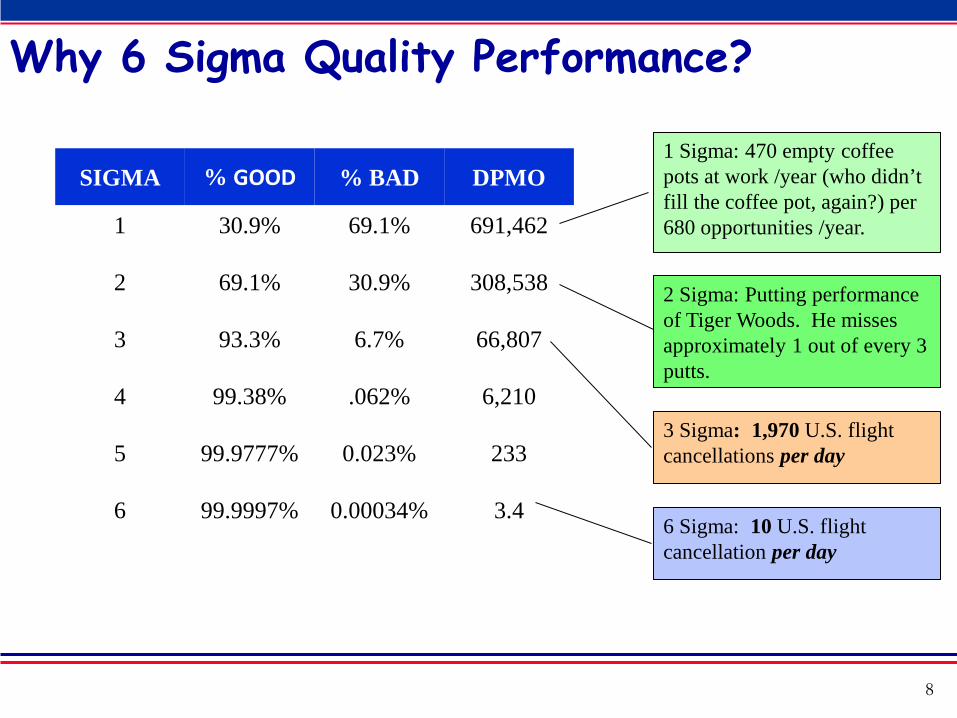
Why 6 Sigma Quality Performance?
8
SIGMA % GOOD % BAD DPMO
1 30.9% 69.1% 691,462
2 69.1% 30.9% 308,538
3 93.3% 6.7% 66,807
4 99.38% .062% 6,210
5 99.9777% 0.023% 233
6 99.9997% 0.00034% 3.4
2 Sigma: Putting performance of Tiger Woods. He misses approximately 1 out of every 3 putts.
1 Sigma: 470 empty coffee pots at work /year (who didn’t fill the coffee pot, again?) per 680 opportunities /year.
3 Sigma: 1,970 U.S. flight cancellations per day
6 Sigma: 10 U.S. flight cancellation per day
9
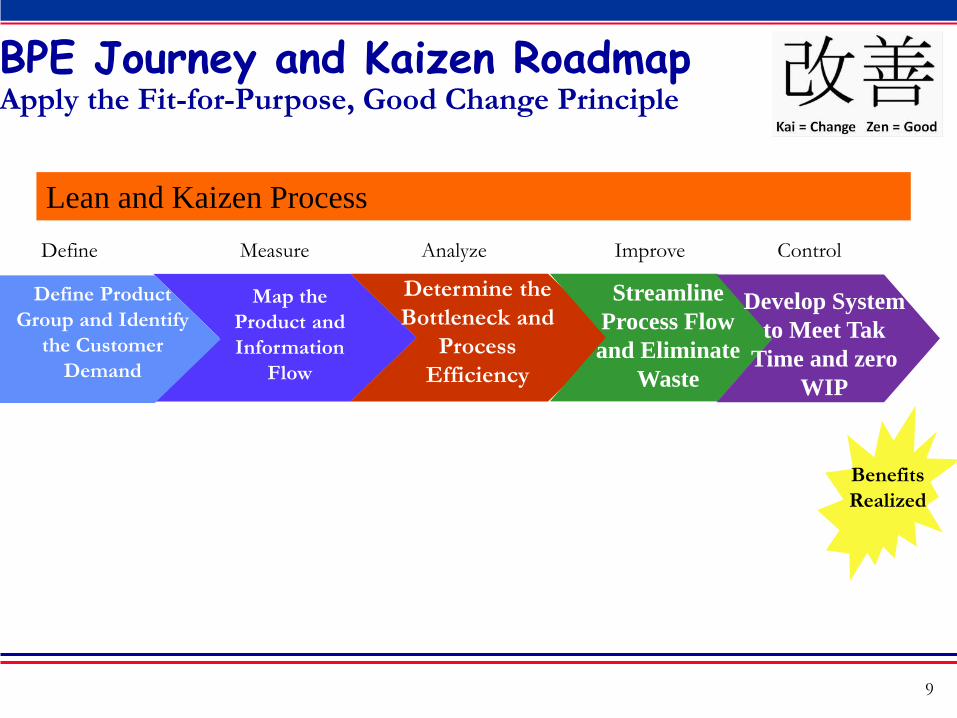
Benefits Realized
Define Measure Analyze Improve Control
BPE Journey and Kaizen Roadmap Apply the Fit-for-Purpose, Good Change Principle
Define Product Group and Identify
the Customer Demand
Map the Product and Information
Flow
Determine the Bottleneck and
Process Efficiency
Streamline Process Flow and Eliminate
Waste
Develop System to Meet Tak
Time and zero WIP
Lean and Kaizen Process
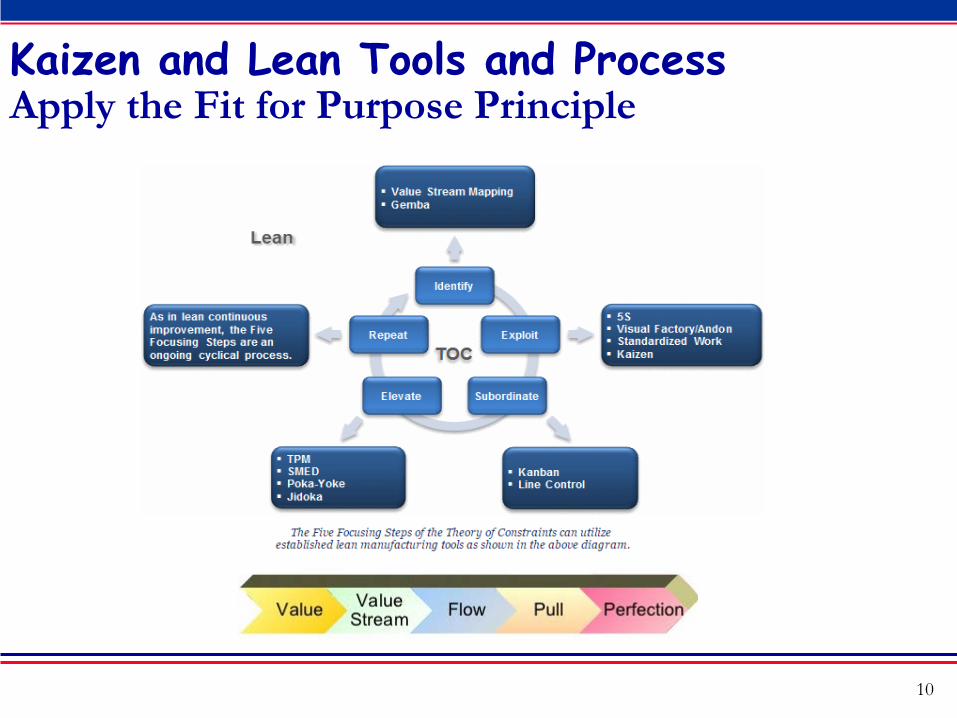
Kaizen and Lean Tools and Process Apply the Fit for Purpose Principle
10
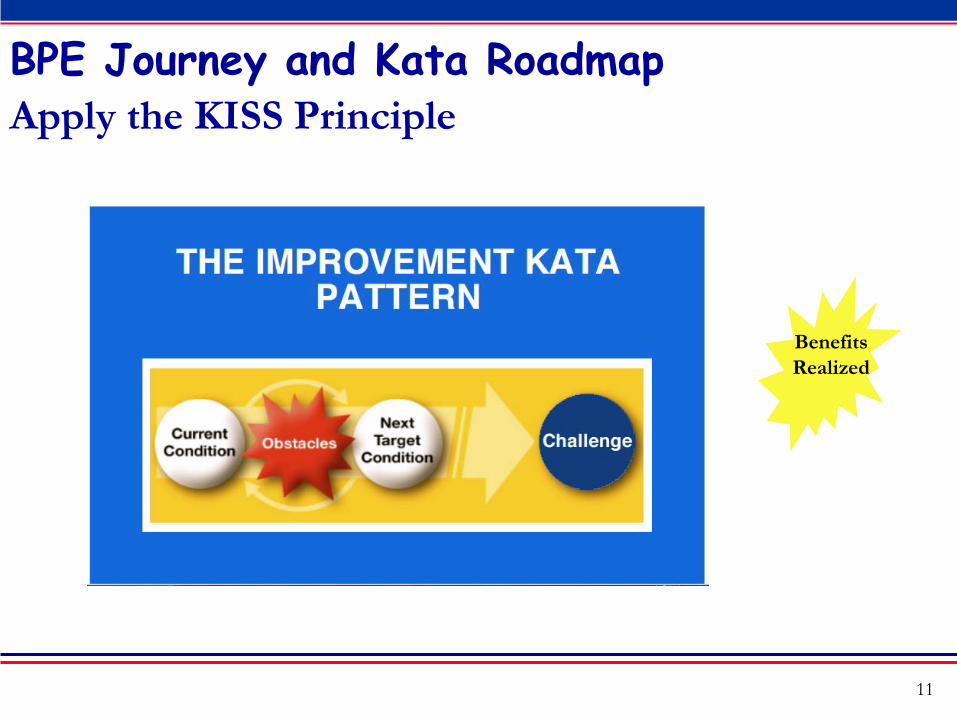
11
Benefits Realized
BPE Journey and Kata Roadmap Apply the KISS Principle
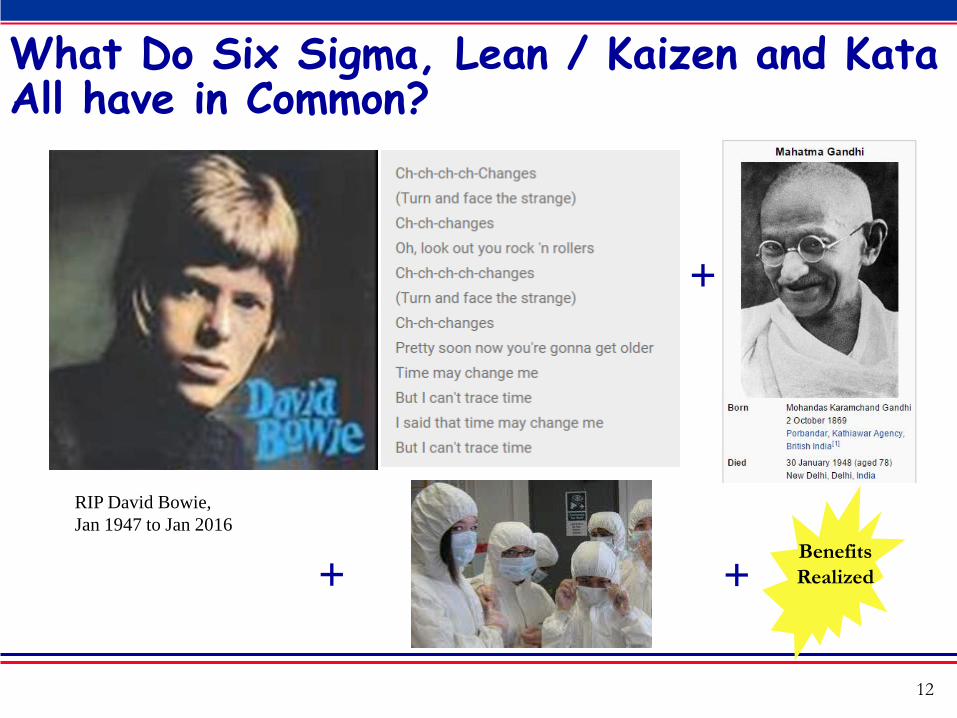
What Do Six Sigma, Lean / Kaizen and Kata All have in Common?
12
RIP David Bowie, Jan 1947 to Jan 2016
Benefits Realized
+
+ +
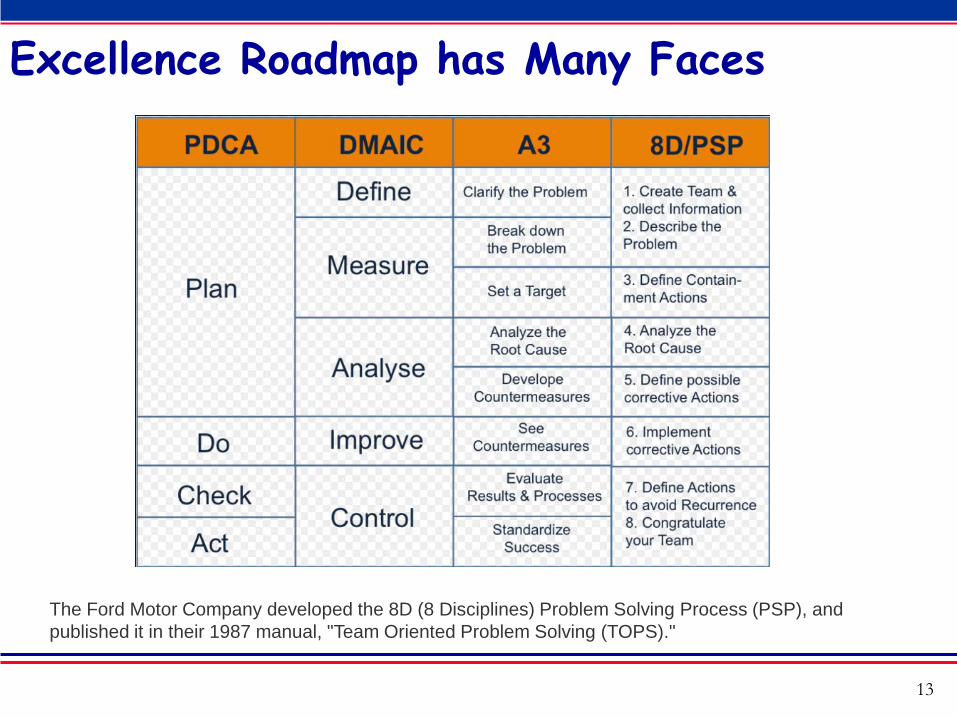
Excellence Roadmap has Many Faces
13
The Ford Motor Company developed the 8D (8 Disciplines) Problem Solving Process (PSP), and published it in their 1987 manual, "Team Oriented Problem Solving (TOPS)."
14
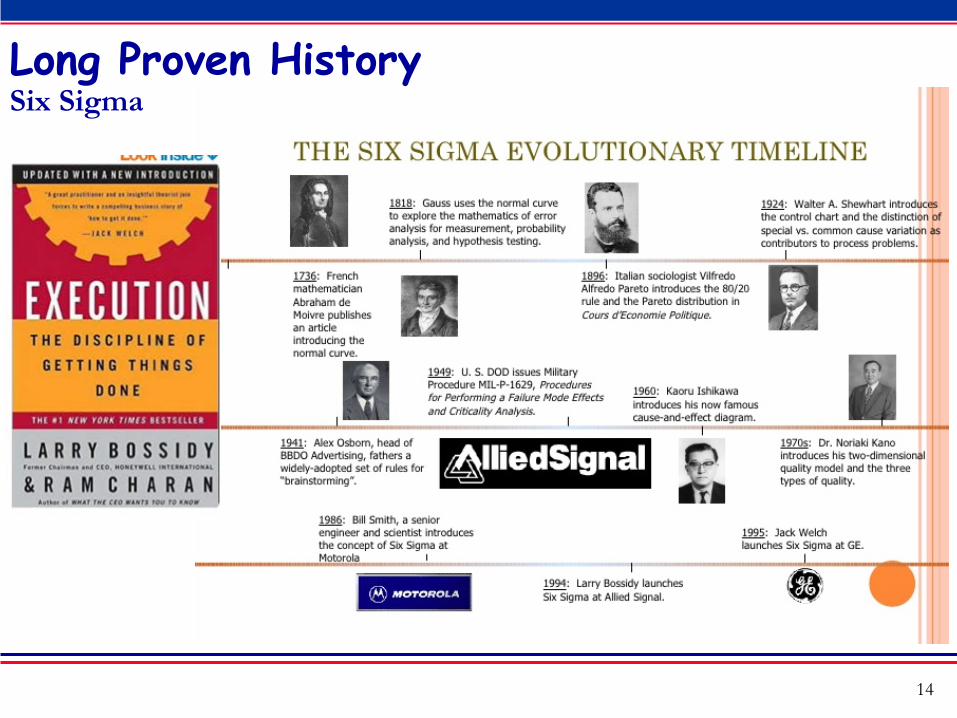
Long Proven History Six Sigma
15
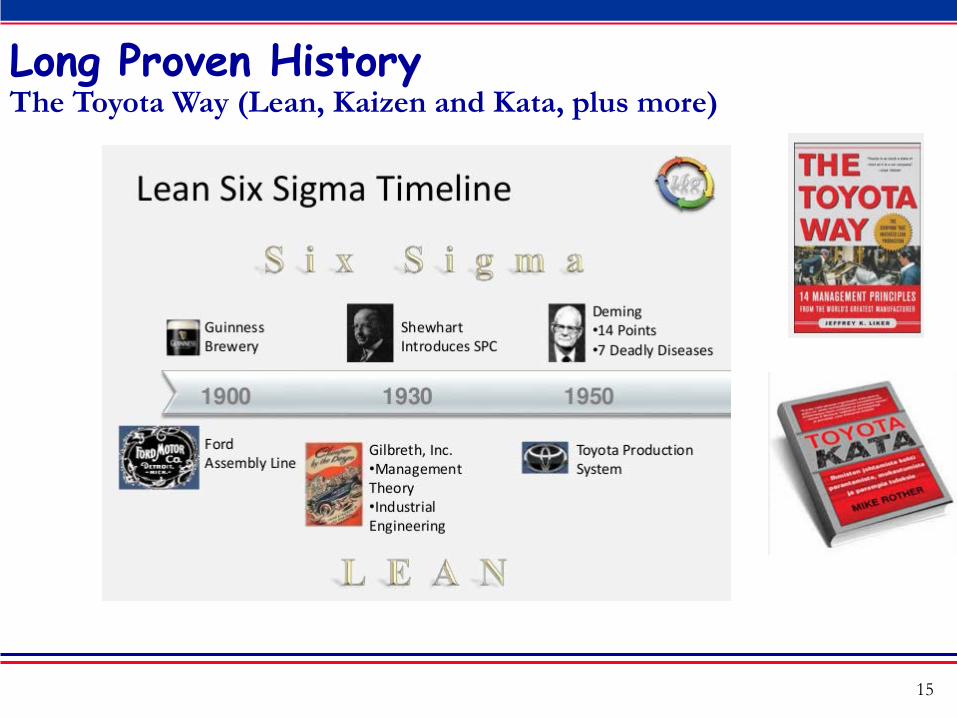
Long Proven History The Toyota Way (Lean, Kaizen and Kata, plus more)
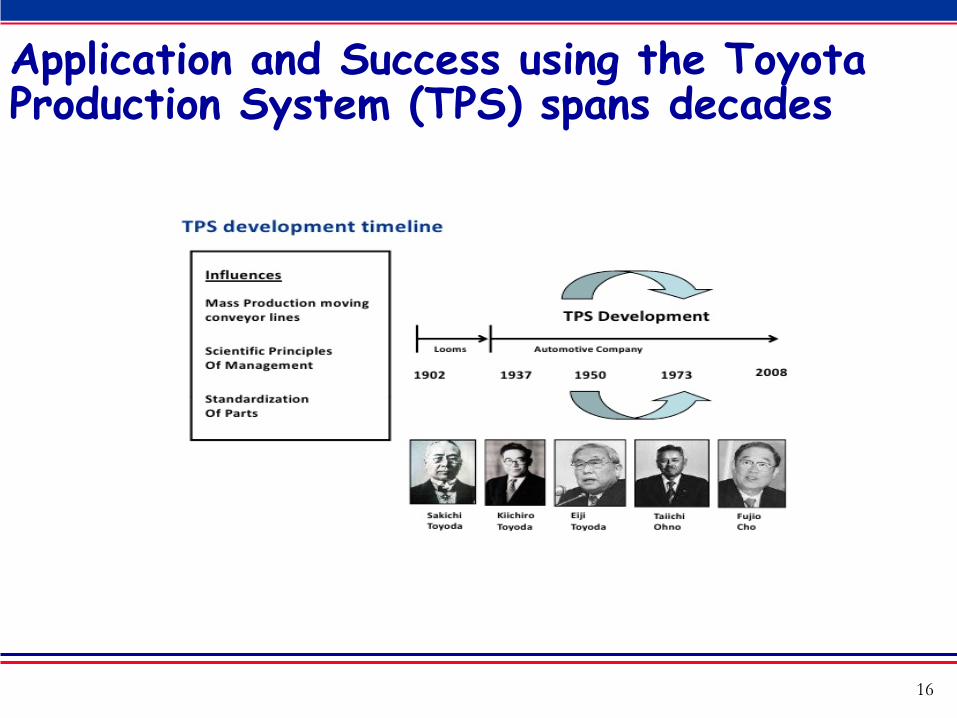
Application and Success using the Toyota Production System (TPS) spans decades
16
17
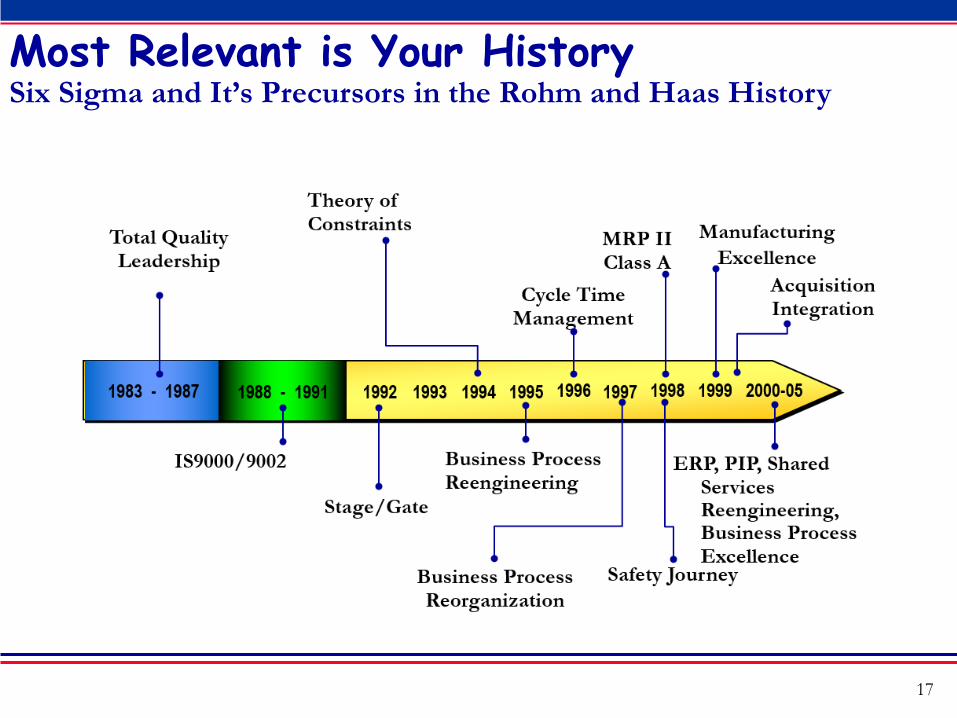
Most Relevant is Your History Six Sigma and It’s Precursors in the Rohm and Haas History
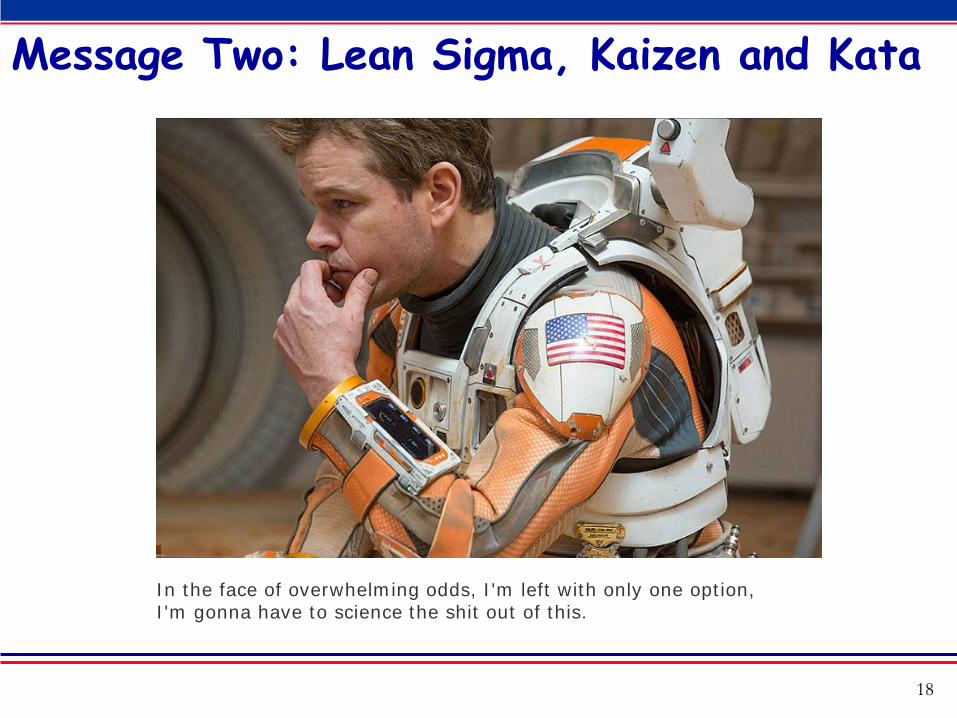
Message Two: Lean Sigma, Kaizen and Kata
18
In the face of overwhelming odds, I'm left with only one option, I'm gonna have to science the shit out of this.

19
Six Sigma and Voice of the Customer How to Know What to Work on at the Enterprise Level
Surveys, interviews and data collection was completed to gather the Voice of the Customer (Chief Finance Officer). He wanted the working capital reduced, including the time to get paid by customers (Days Sales Outstanding).
He also told us the factors that define success, the Critical to Quality (and Success Factors) or CTQ’s as shown here in this house of quality.
20
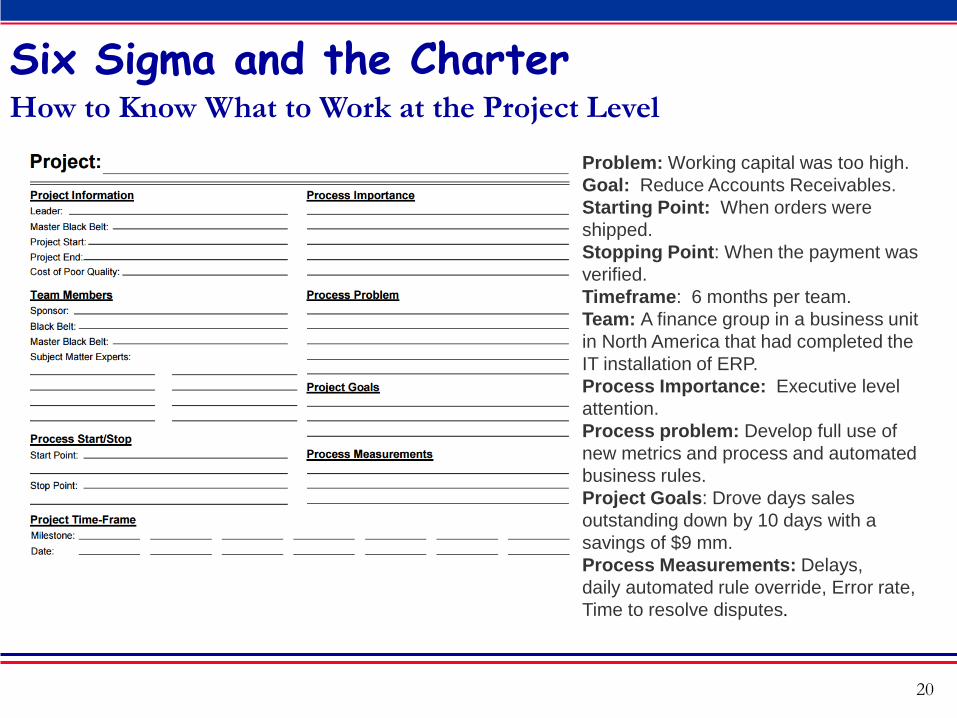
Six Sigma and the Charter How to Know What to Work at the Project Level
Problem: Working capital was too high. Goal: Reduce Accounts Receivables. Starting Point: When orders were shipped. Stopping Point: When the payment was verified. Timeframe: 6 months per team. Team: A finance group in a business unit in North America that had completed the IT installation of ERP. Process Importance: Executive level attention. Process problem: Develop full use of new metrics and process and automated business rules. Project Goals: Drove days sales outstanding down by 10 days with a savings of $9 mm. Process Measurements: Delays, daily automated rule override, Error rate, Time to resolve disputes.
21
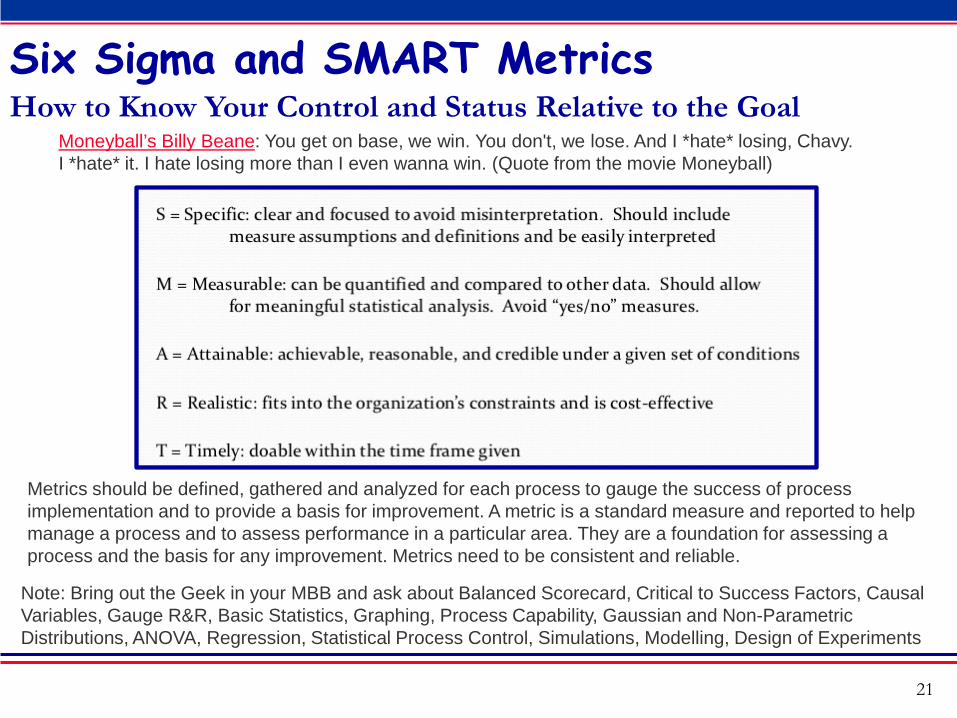
Six Sigma and SMART Metrics How to Know Your Control and Status Relative to the Goal
Metrics should be defined, gathered and analyzed for each process to gauge the success of process implementation and to provide a basis for improvement. A metric is a standard measure and reported to help manage a process and to assess performance in a particular area. They are a foundation for assessing a process and the basis for any improvement. Metrics need to be consistent and reliable.
Note: Bring out the Geek in your MBB and ask about Balanced Scorecard, Critical to Success Factors, Causal Variables, Gauge R&R, Basic Statistics, Graphing, Process Capability, Gaussian and Non-Parametric Distributions, ANOVA, Regression, Statistical Process Control, Simulations, Modelling, Design of Experiments
Moneyball’s Billy Beane: You get on base, we win. You don't, we lose. And I *hate* losing, Chavy. I *hate* it. I hate losing more than I even wanna win. (Quote from the movie Moneyball)
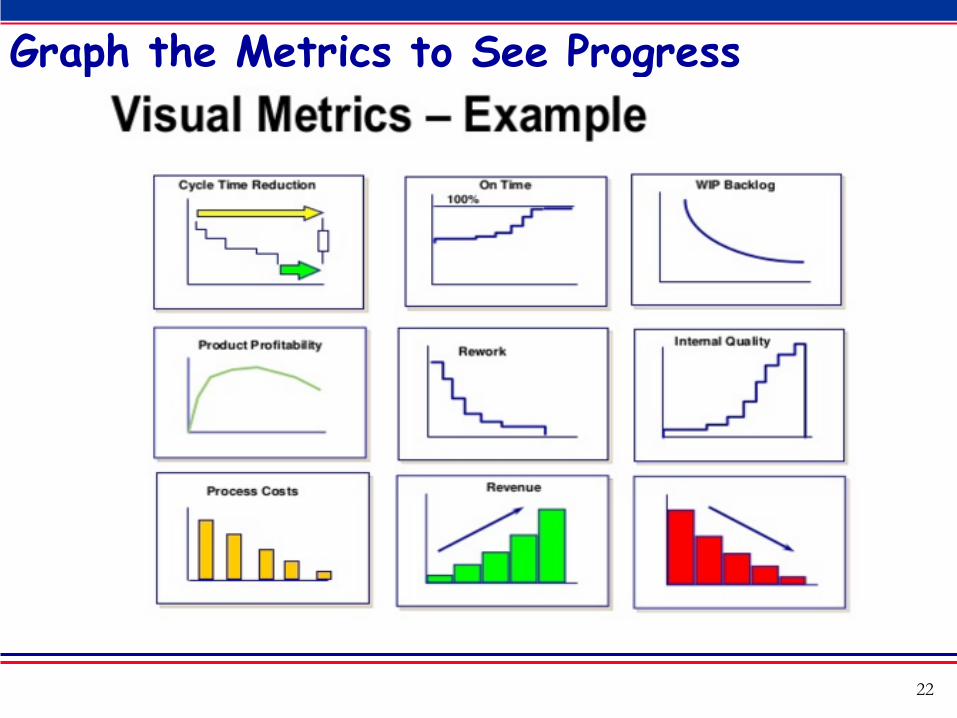
Graph the Metrics to See Progress
22
23
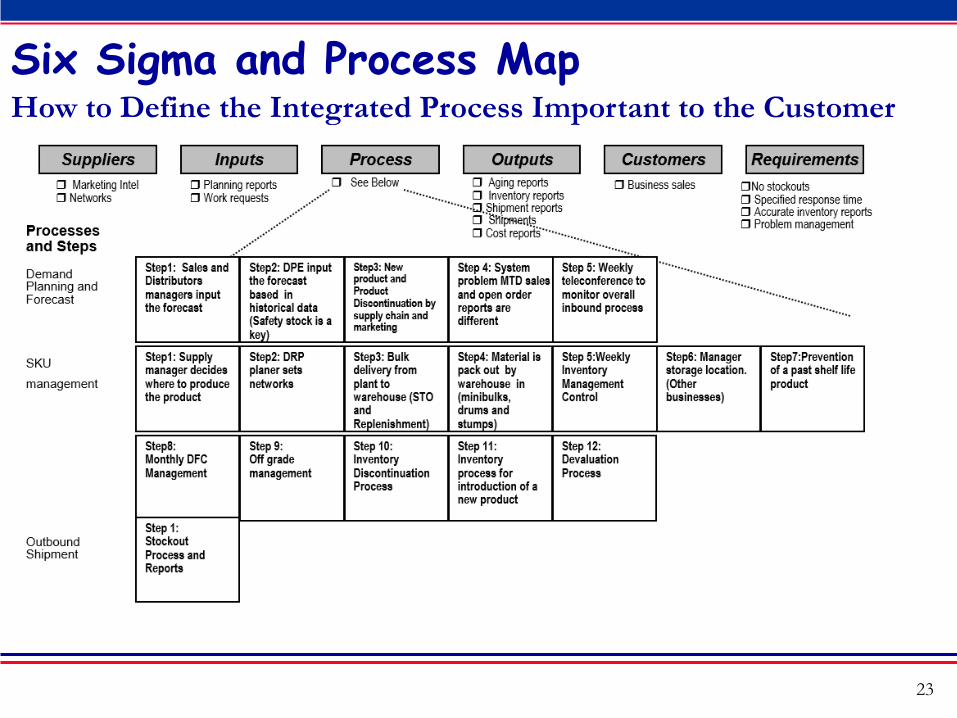
Six Sigma and Process Map How to Define the Integrated Process Important to the Customer
24
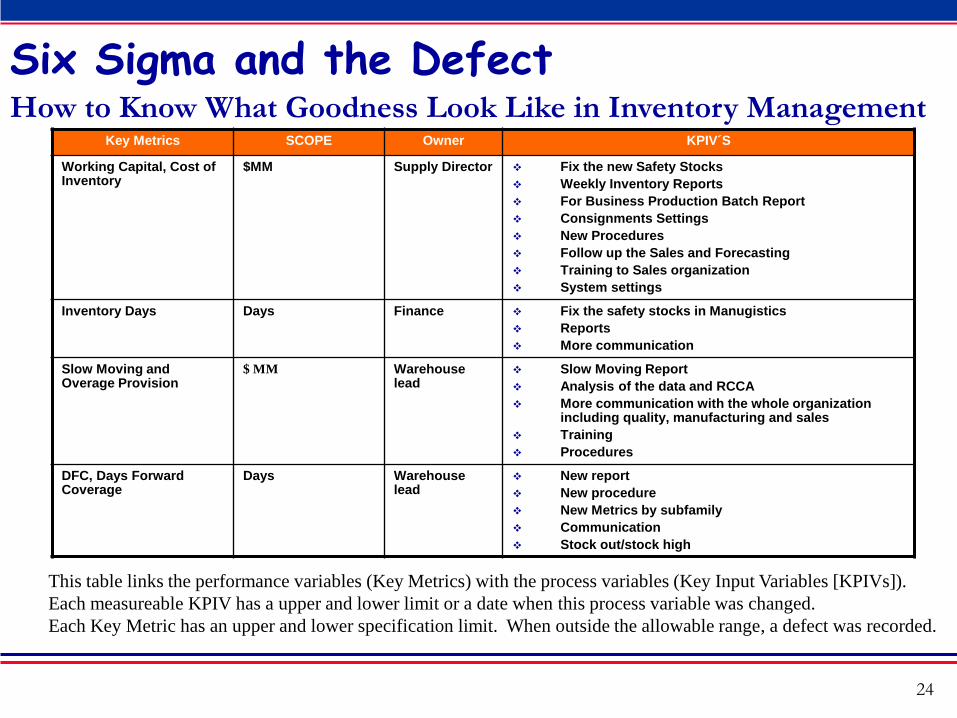
Six Sigma and the Defect How to Know What Goodness Look Like in Inventory Management
Key Metrics SCOPE Owner KPIV´S
Working Capital, Cost of Inventory
$MM Supply Director Fix the new Safety Stocks Weekly Inventory Reports For Business Production Batch Report Consignments Settings New Procedures Follow up the Sales and Forecasting Training to Sales organization System settings
Inventory Days Days Finance Fix the safety stocks in Manugistics Reports More communication
Slow Moving and Overage Provision
$ MM
Warehouse lead
Slow Moving Report Analysis of the data and RCCA More communication with the whole organization
including quality, manufacturing and sales Training Procedures
DFC, Days Forward Coverage
Days Warehouse lead
New report New procedure New Metrics by subfamily Communication Stock out/stock high
This table links the performance variables (Key Metrics) with the process variables (Key Input Variables [KPIVs]). Each measureable KPIV has a upper and lower limit or a date when this process variable was changed. Each Key Metric has an upper and lower specification limit. When outside the allowable range, a defect was recorded.
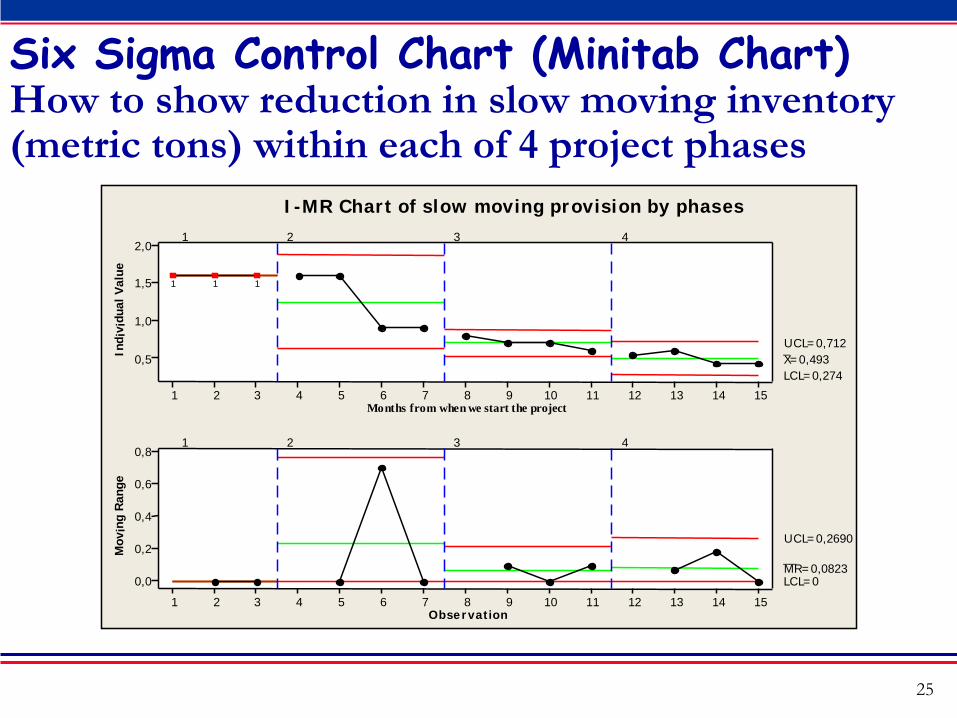
Six Sigma Control Chart (Minitab Chart) How to show reduction in slow moving inventory (metric tons) within each of 4 project phases
25
M o n t h s f r o m w h e n w e s t a r t t h e p r o j e c t
I n d i
v i d u
a l V
a l u e
1 5 1 4 1 3 1 2 1 1 1 0 9 8 7 6 5 4 3 2 1
2 , 0
1 , 5
1 , 0
0 , 5 _ X = 0 , 4 9 3 U C L = 0 , 7 1 2
L C L = 0 , 2 7 4
1 2 3 4
O b s e r v a t i o n
M o v
i n g
R a n
g e
1 5 1 4 1 3 1 2 1 1 1 0 9 8 7 6 5 4 3 2 1
0 , 8
0 , 6
0 , 4
0 , 2
0 , 0
_ _ M R = 0 , 0 8 2 3
U C L = 0 , 2 6 9 0
L C L = 0
1 2 3 4
1 1 1
I - M R C h a r t o f s l o w m o v i n g p r o v i s i o n b y p h a s e s
26
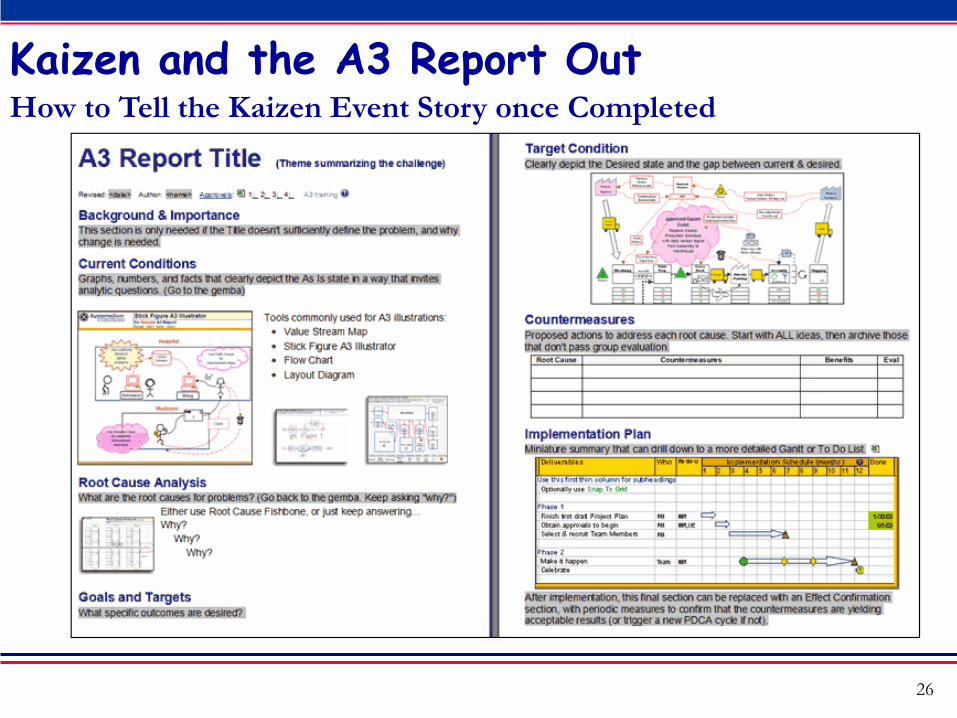
Kaizen and the A3 Report Out How to Tell the Kaizen Event Story once Completed
27
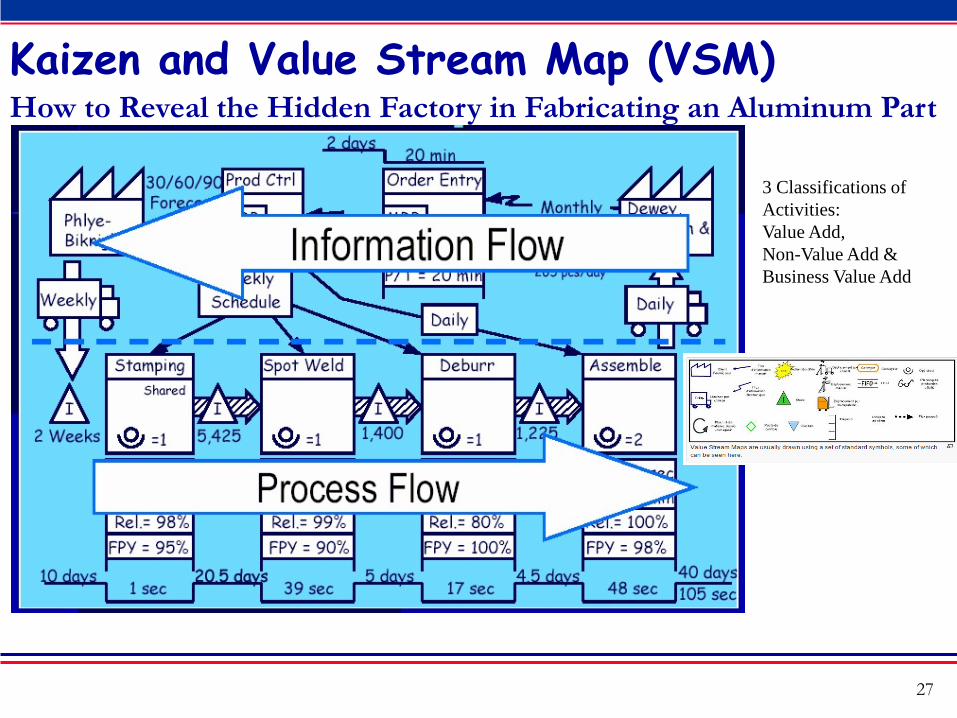
Kaizen and Value Stream Map (VSM) How to Reveal the Hidden Factory in Fabricating an Aluminum Part
3 Classifications of Activities: Value Add, Non-Value Add & Business Value Add
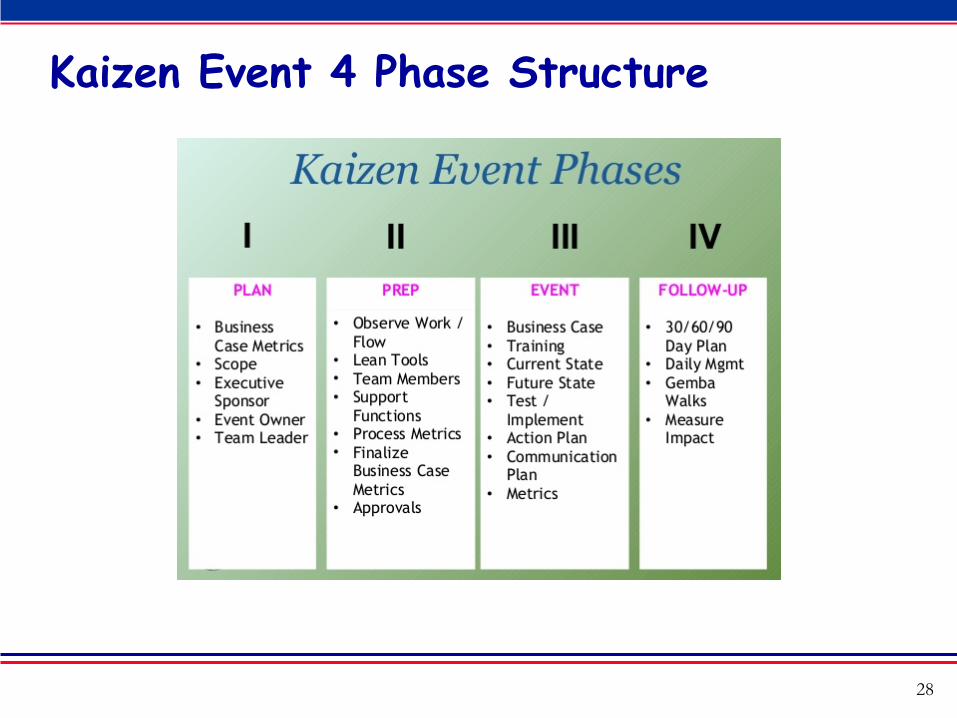
Kaizen Event 4 Phase Structure
28
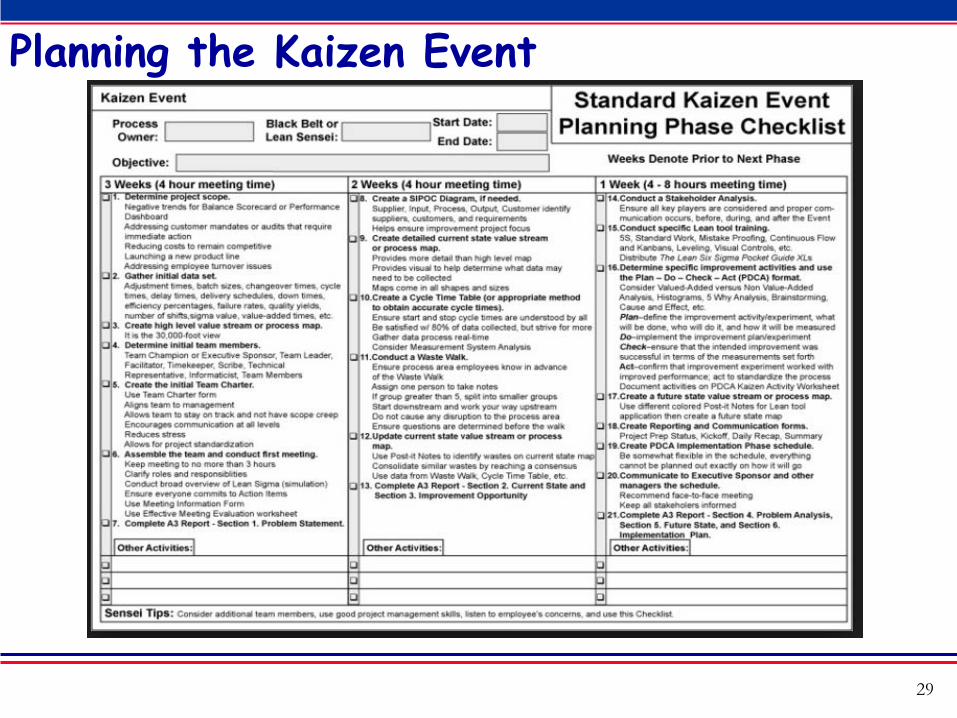
Planning the Kaizen Event
29

30
Kaizen Conducting the Event How to Conduct a Kaizen Event
31
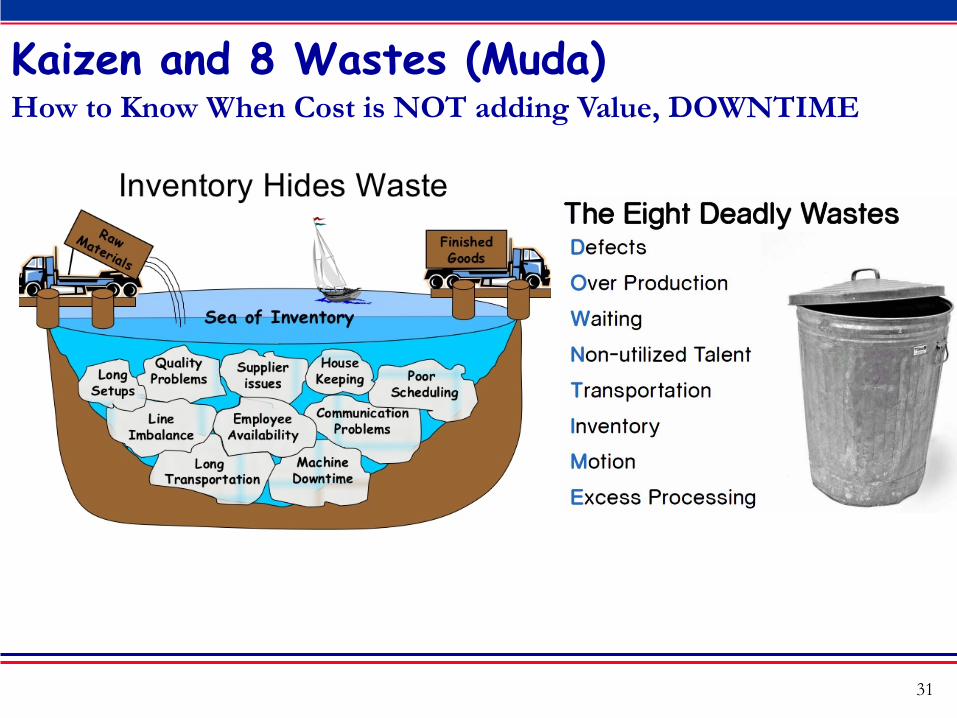
Kaizen and 8 Wastes (Muda) How to Know When Cost is NOT adding Value, DOWNTIME
32
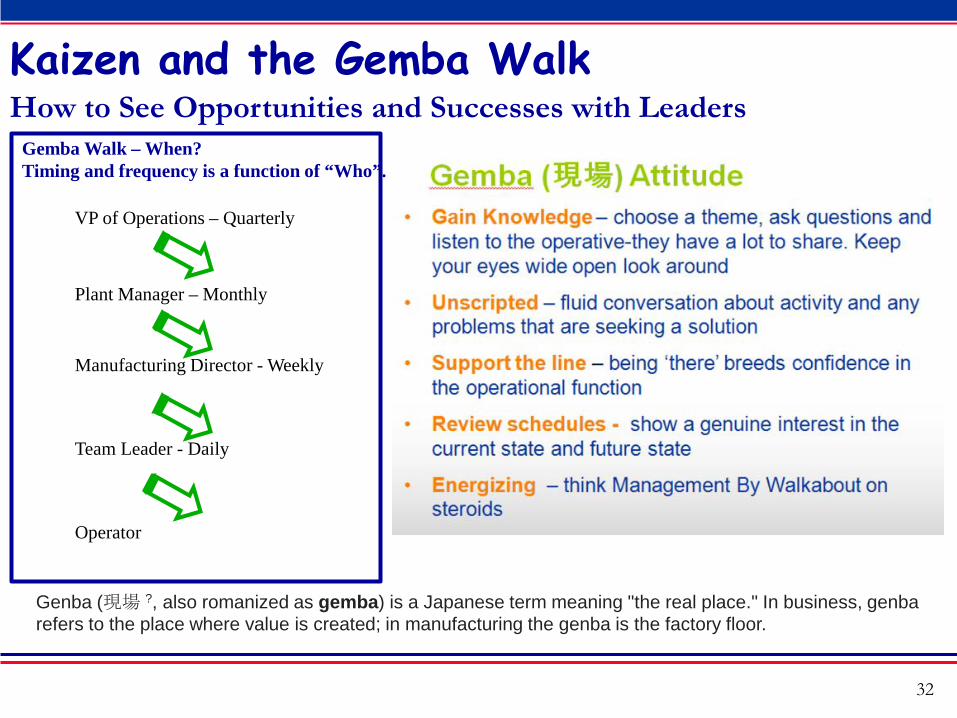
Kaizen and the Gemba Walk How to See Opportunities and Successes with Leaders
Genba (現場 ?, also romanized as gemba) is a Japanese term meaning "the real place." In business, genba refers to the place where value is created; in manufacturing the genba is the factory floor.
Gemba Walk – When? Timing and frequency is a function of “Who”.
VP of Operations – Quarterly
Plant Manager – Monthly
Manufacturing Director - Weekly
Team Leader - Daily
Operator
33
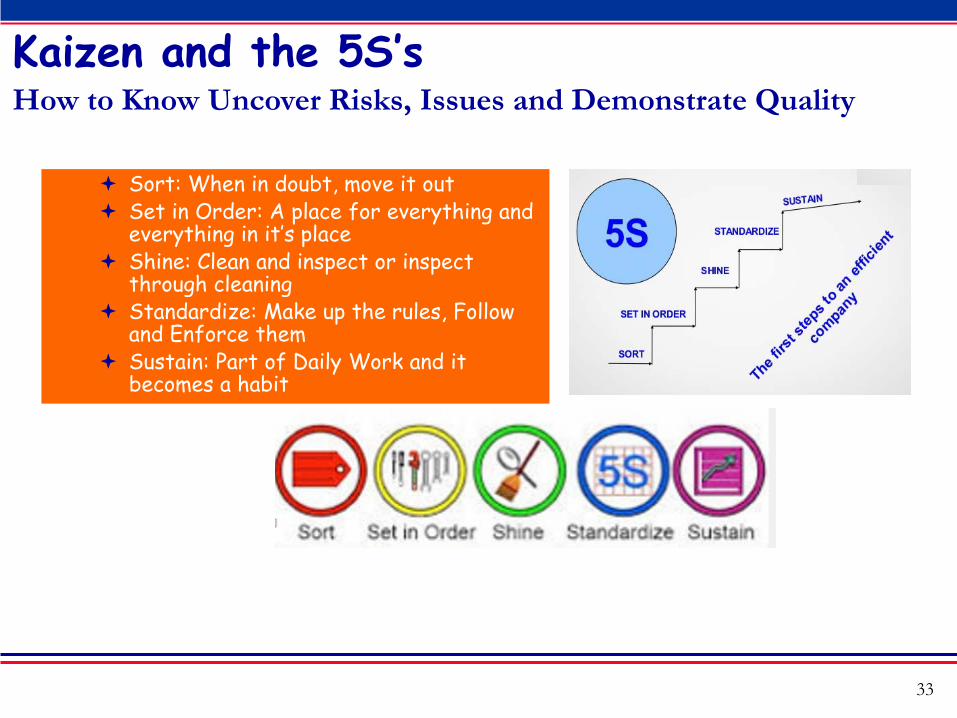
Kaizen and the 5S’s How to Know Uncover Risks, Issues and Demonstrate Quality
Sort: When in doubt, move it out Set in Order: A place for everything and
everything in it’s place Shine: Clean and inspect or inspect
through cleaning Standardize: Make up the rules, Follow
and Enforce them Sustain: Part of Daily Work and it
becomes a habit
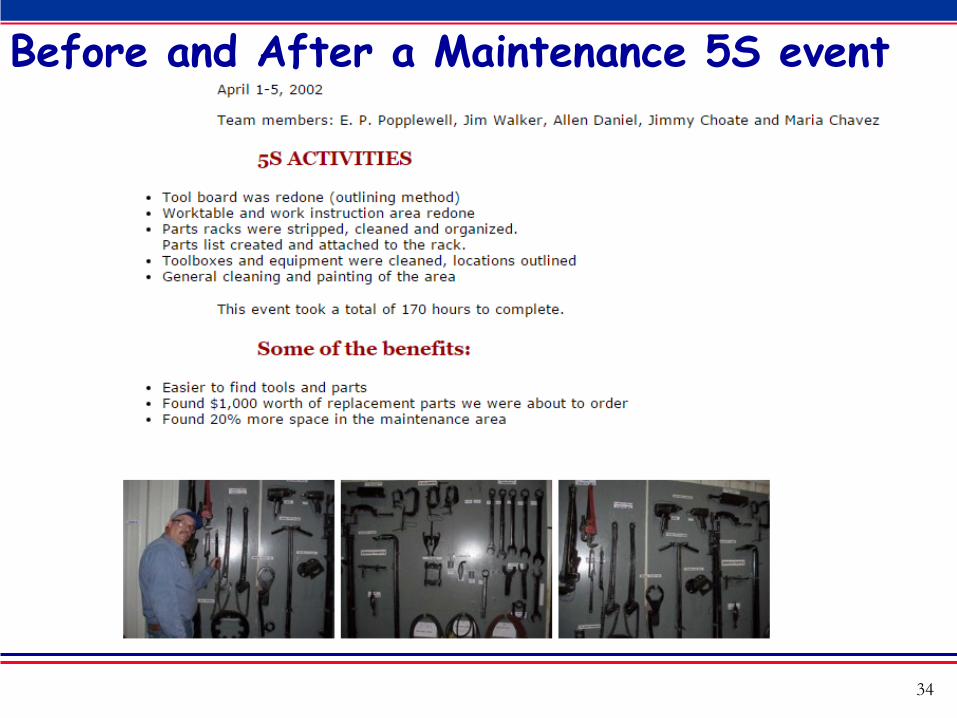
Before and After a Maintenance 5S event
34
35
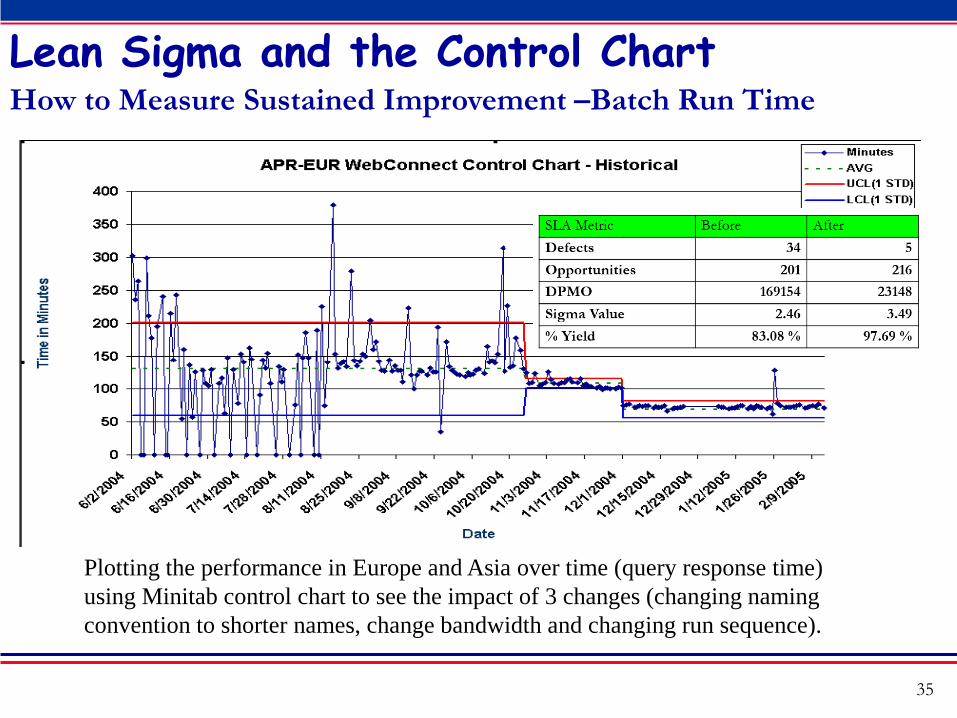
Lean Sigma and the Control Chart How to Measure Sustained Improvement –Batch Run Time
Plotting the performance in Europe and Asia over time (query response time) using Minitab control chart to see the impact of 3 changes (changing naming convention to shorter names, change bandwidth and changing run sequence).
36
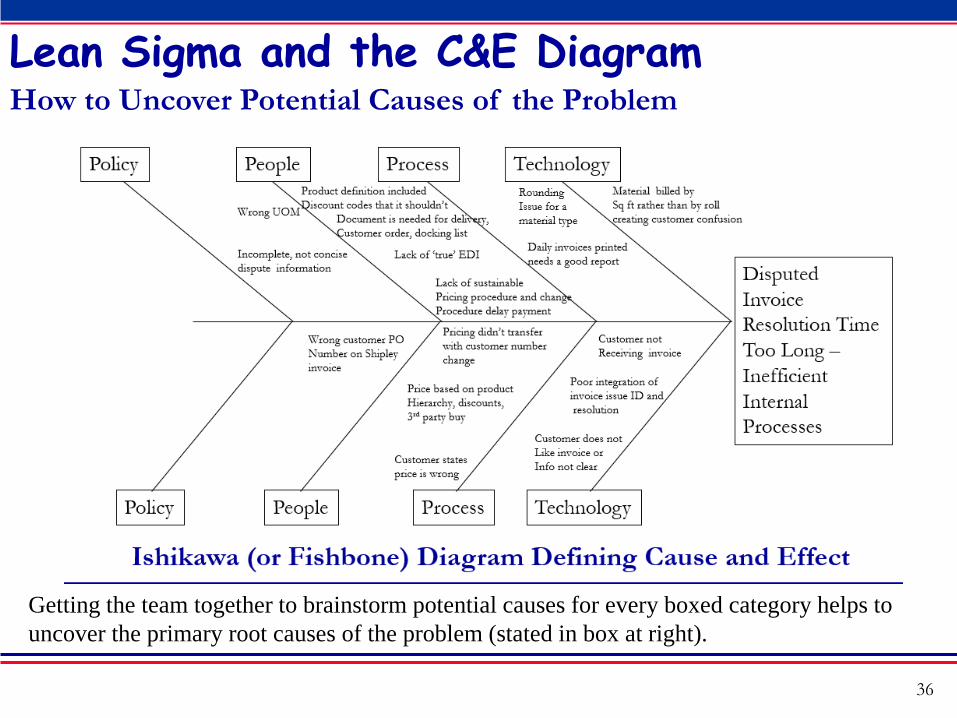
Lean Sigma and the C&E Diagram How to Uncover Potential Causes of the Problem
Getting the team together to brainstorm potential causes for every boxed category helps to uncover the primary root causes of the problem (stated in box at right).
37
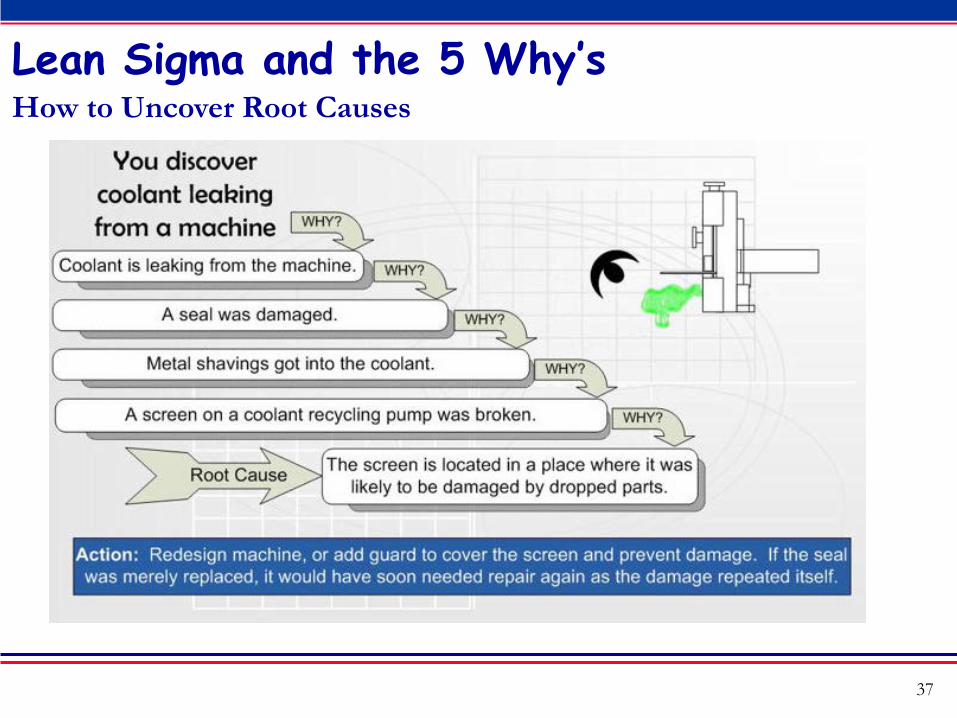
Lean Sigma and the 5 Why’s How to Uncover Root Causes
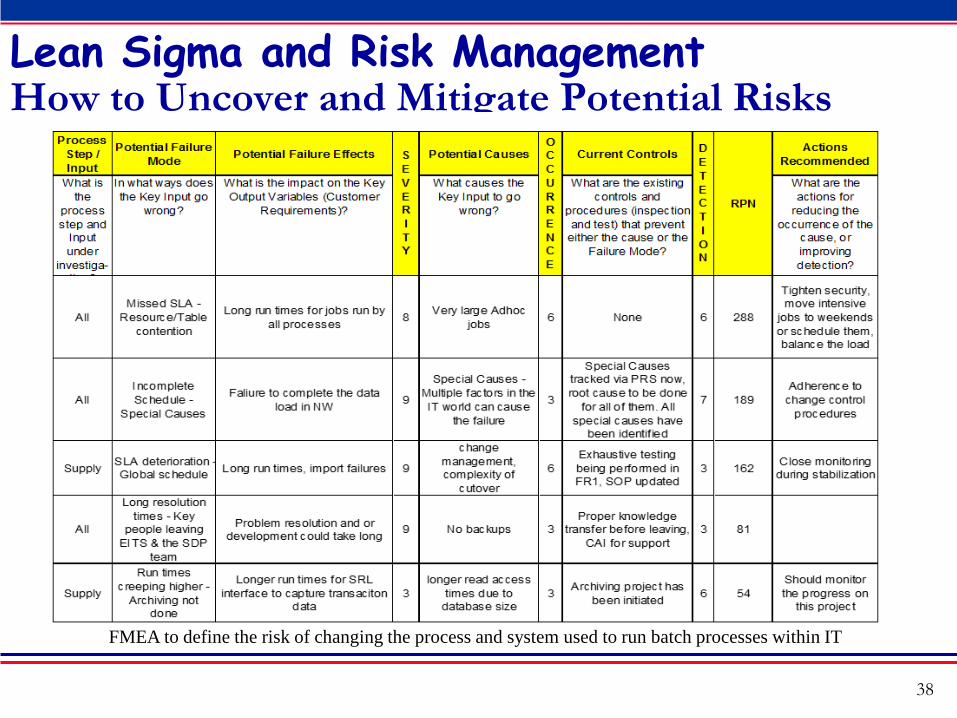
Lean Sigma and Risk Management How to Uncover and Mitigate Potential Risks
38
FMEA to define the risk of changing the process and system used to run batch processes within IT
39
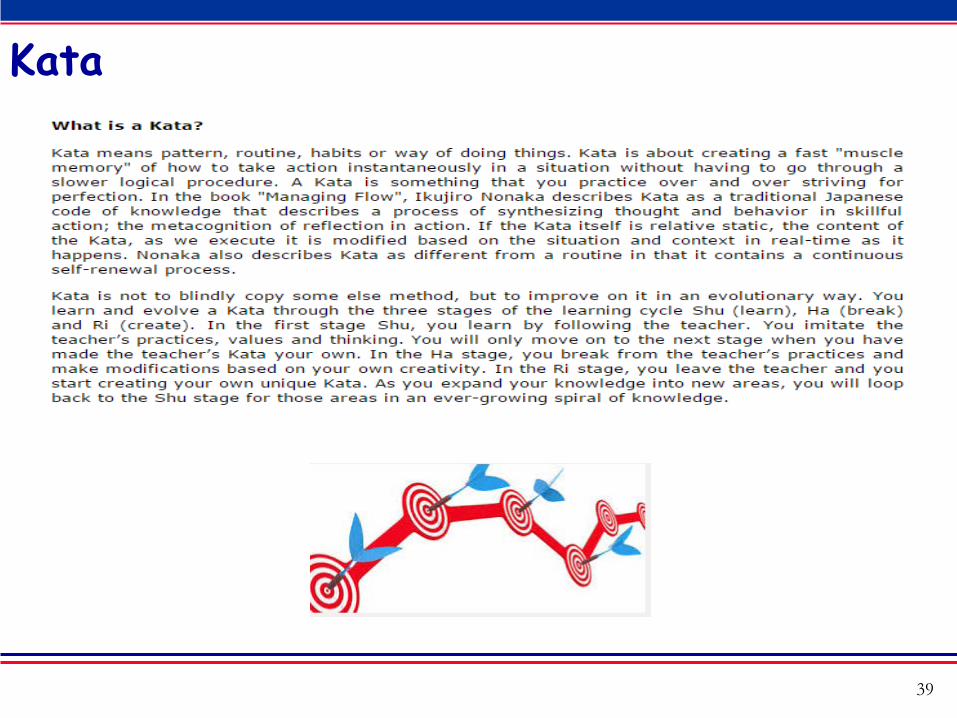
Kata
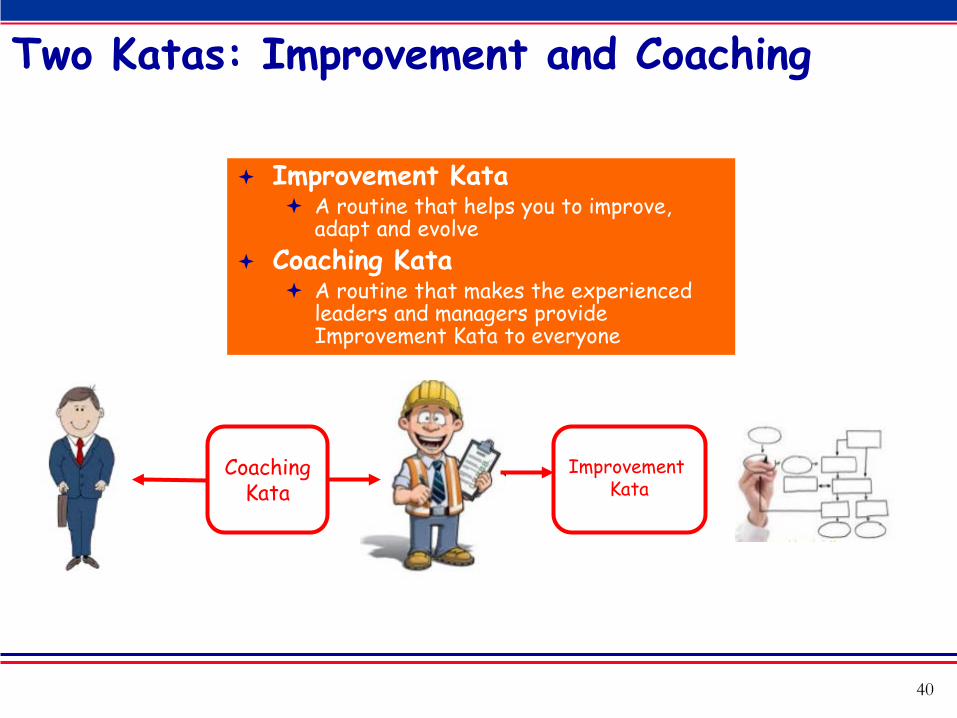
Two Katas: Improvement and Coaching
40
Improvement Kata A routine that helps you to improve,
adapt and evolve Coaching Kata
A routine that makes the experienced leaders and managers provide Improvement Kata to everyone
Coaching Kata
Improvement Kata
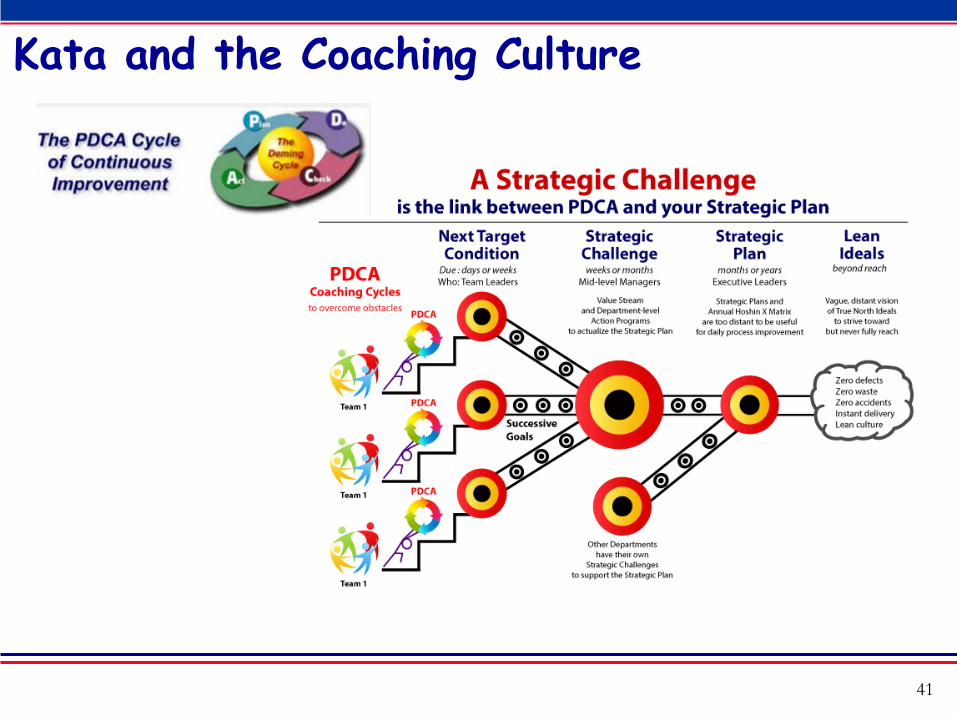
Kata and the Coaching Culture
41
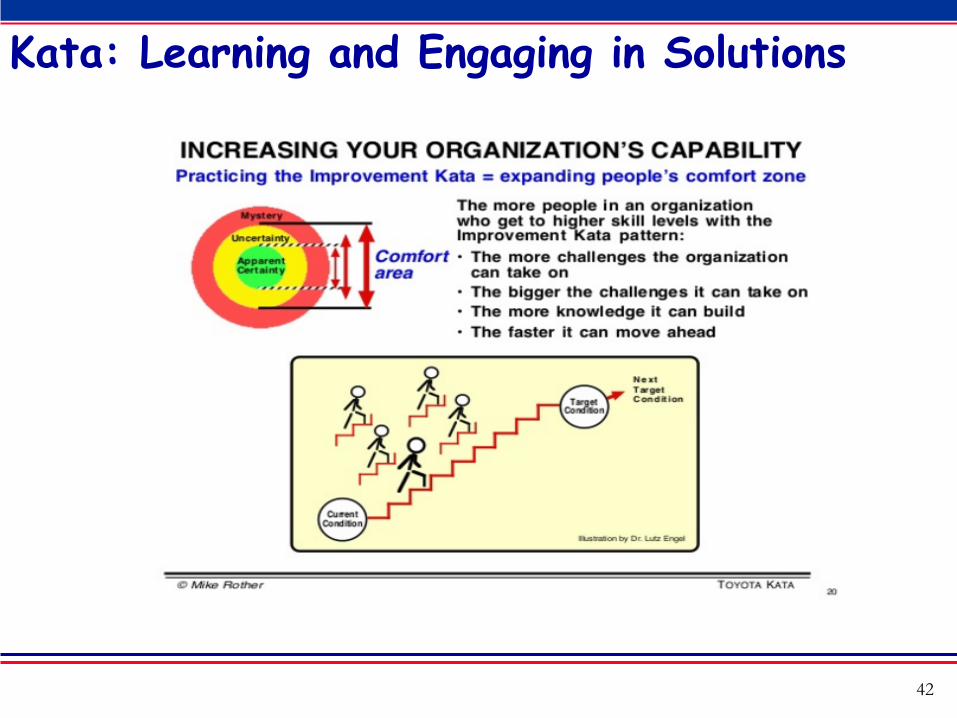
Kata: Learning and Engaging in Solutions
42
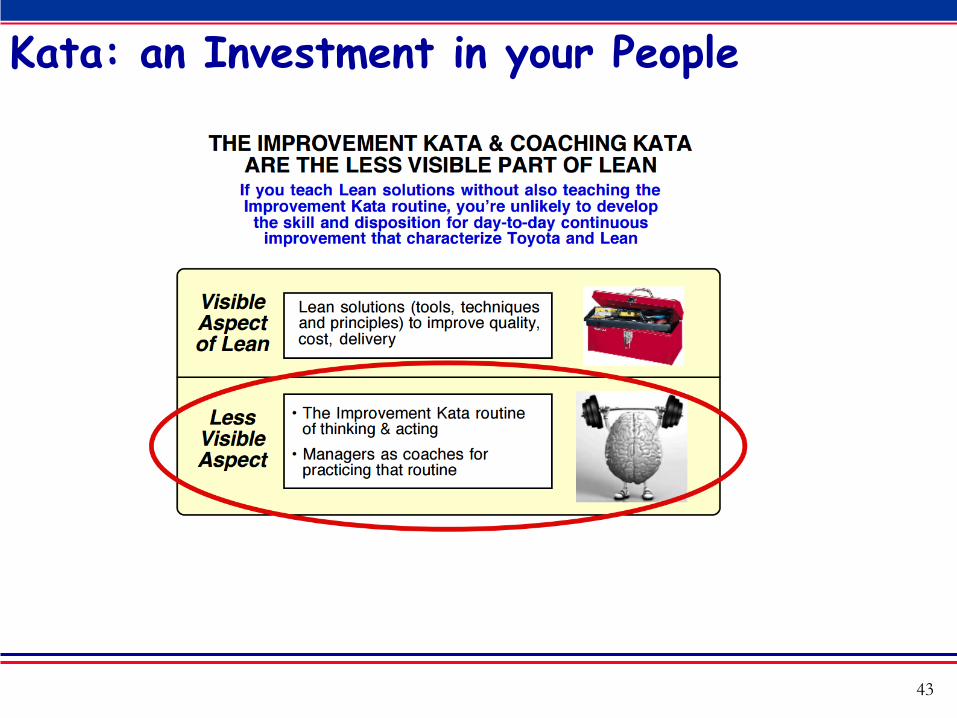
Kata: an Investment in your People
43
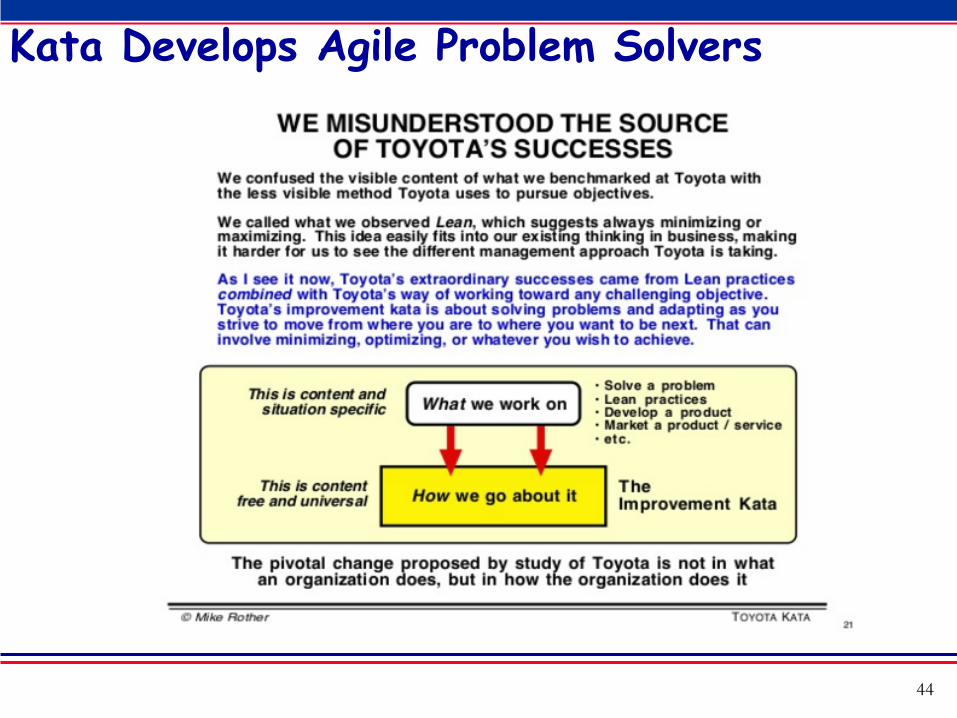
Kata Develops Agile Problem Solvers
44

Kata and the Manager’s Role
45
What is Management’s Role ?
Traditional Management Focus on the solutions
Establish targets Describe solutions Provide incentives Get out of the way and
periodically check results
Toyota Kata Management Focus on how solutions are developed
Establish targets Develop, via practice with
coaches, the capability in people to develop new solutions…
By having people practice a common way of working, like the improvement Kata
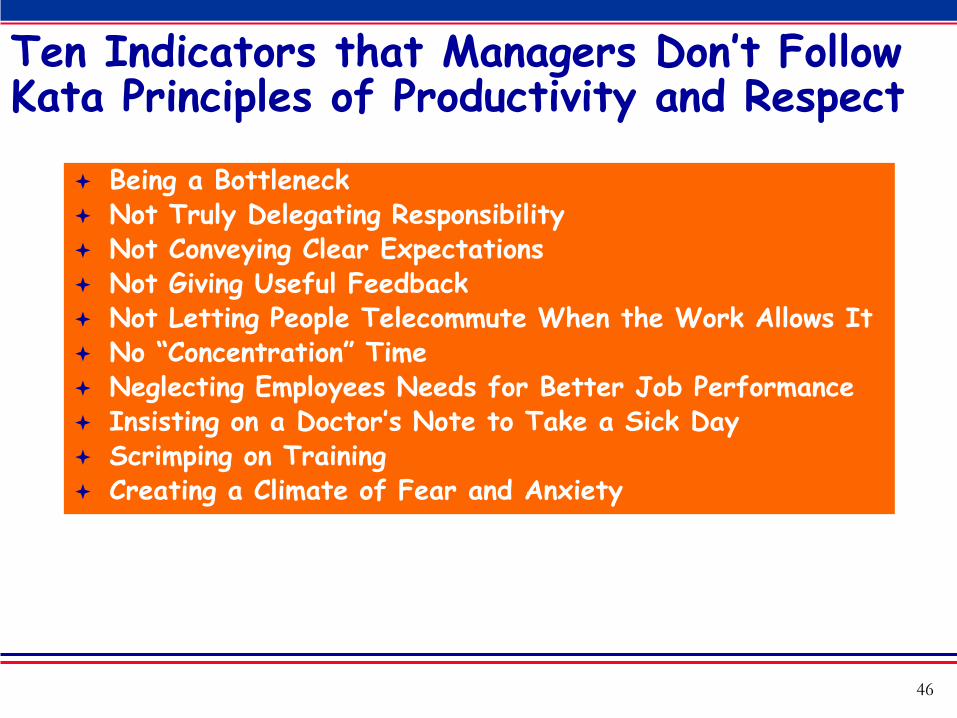
Ten Indicators that Managers Don’t Follow Kata Principles of Productivity and Respect
46
Being a Bottleneck Not Truly Delegating Responsibility Not Conveying Clear Expectations Not Giving Useful Feedback Not Letting People Telecommute When the Work Allows It No “Concentration” Time Neglecting Employees Needs for Better Job Performance Insisting on a Doctor’s Note to Take a Sick Day Scrimping on Training Creating a Climate of Fear and Anxiety
47
Message 3: Getting Started Igniting the Journey
Every human being has a basic instinct: to help each other out. If a hiker gets lost in the mountains, people will coordinate a search. If a train crashes, people will line up to give blood. If an earthquake levels a city, people all over the world will send emergency supplies. This is so fundamentally human that it's found in every culture without exception. Yes, there are assholes who just don't care, but they're massively outnumbered by the people who do.
48
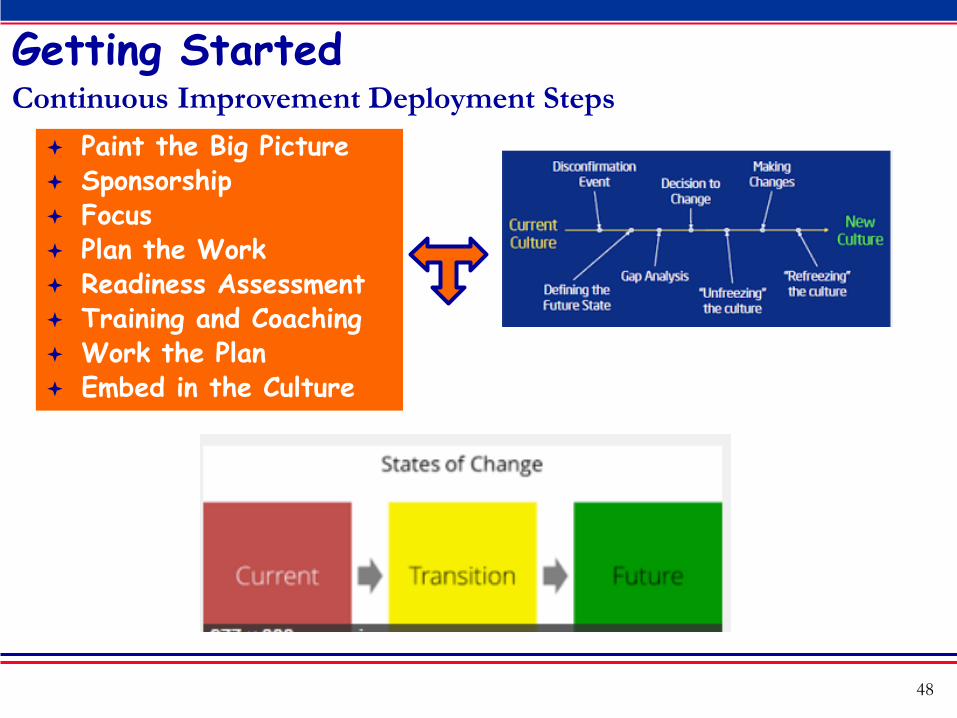
Getting Started Continuous Improvement Deployment Steps Paint the Big Picture Sponsorship Focus Plan the Work Readiness Assessment Training and Coaching Work the Plan Embed in the Culture
49
Message 4: Proven Success
Improving Annual Report Figures in Working Capital Stopping Price Erosion Reducing Legal Claims Increasing Compliance and Safety
Mars will come to fear my botany powers.
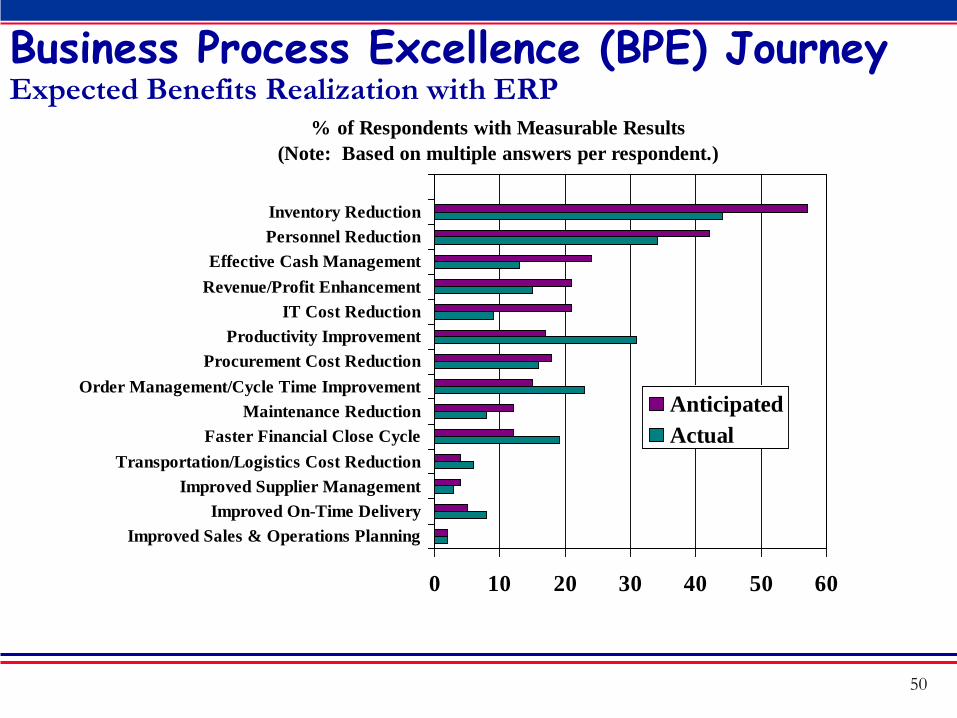
Business Process Excellence (BPE) Journey Expected Benefits Realization with ERP
% of Respondents with Measurable Results(Note: Based on multiple answers per respondent.)
0 10 20 30 40 50 60
Improved Sales & Operations PlanningImproved On-Time Delivery
Improved Supplier ManagementTransportation/Logistics Cost Reduction
Faster Financial Close CycleMaintenance Reduction
Order Management/Cycle Time ImprovementProcurement Cost Reduction
Productivity ImprovementIT Cost Reduction
Revenue/Profit EnhancementEffective Cash Management
Personnel ReductionInventory Reduction
AnticipatedActual
50
51
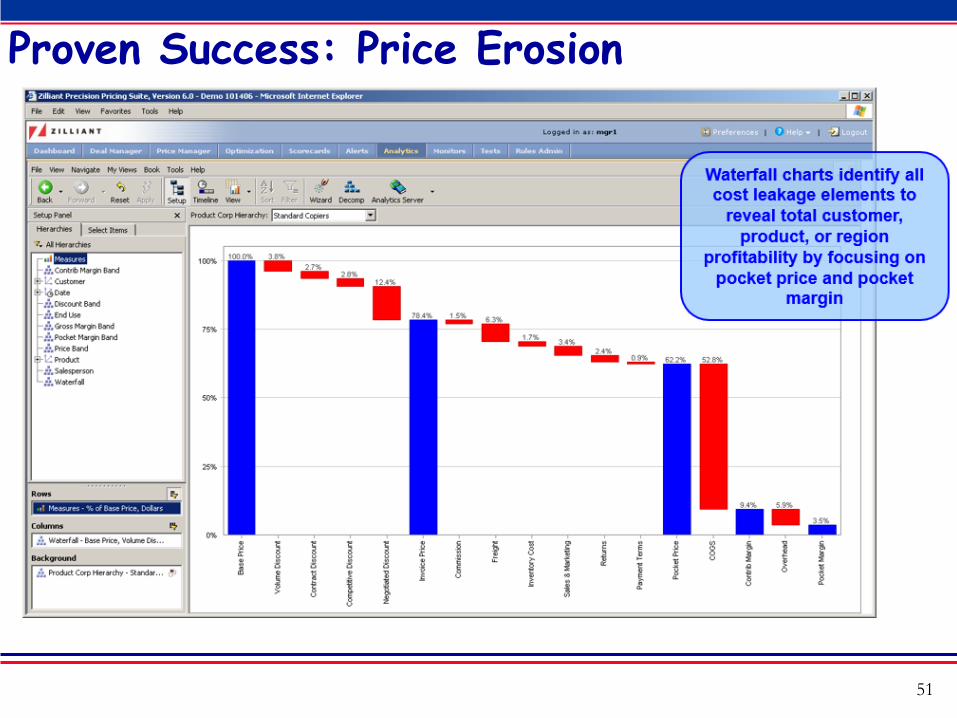
Proven Success: Price Erosion
52
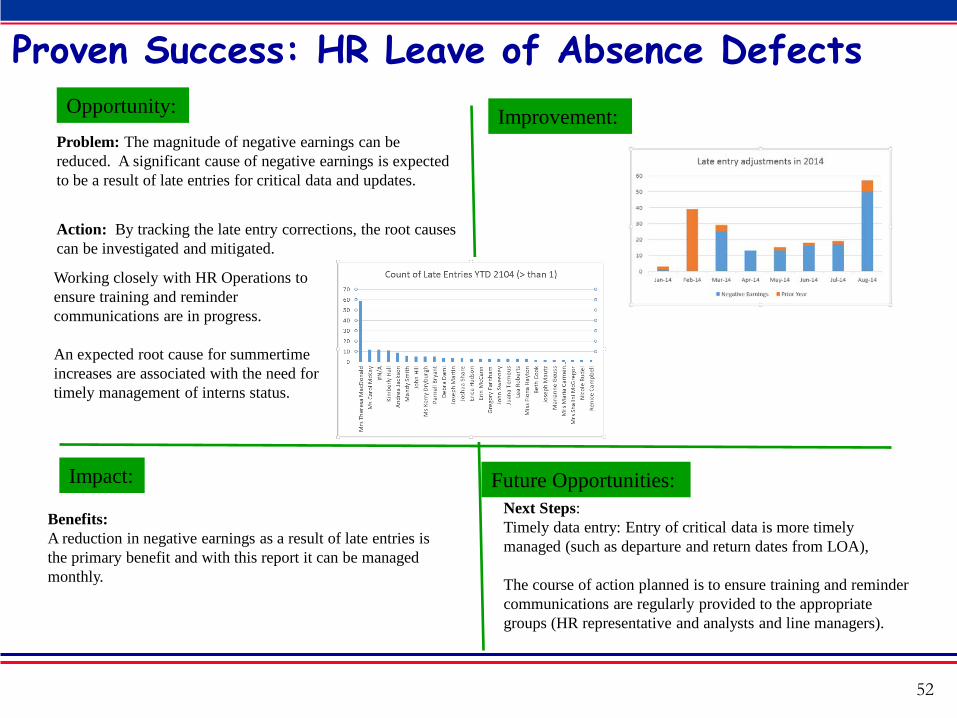
Proven Success: HR Leave of Absence Defects Opportunity: Improvement:
Impact: Future Opportunities:
Problem: The magnitude of negative earnings can be reduced. A significant cause of negative earnings is expected to be a result of late entries for critical data and updates.
Action: By tracking the late entry corrections, the root causes can be investigated and mitigated.
Benefits: A reduction in negative earnings as a result of late entries is the primary benefit and with this report it can be managed monthly.
Working closely with HR Operations to ensure training and reminder communications are in progress. An expected root cause for summertime increases are associated with the need for timely management of interns status.
Next Steps: Timely data entry: Entry of critical data is more timely managed (such as departure and return dates from LOA), The course of action planned is to ensure training and reminder communications are regularly provided to the appropriate groups (HR representative and analysts and line managers).
53
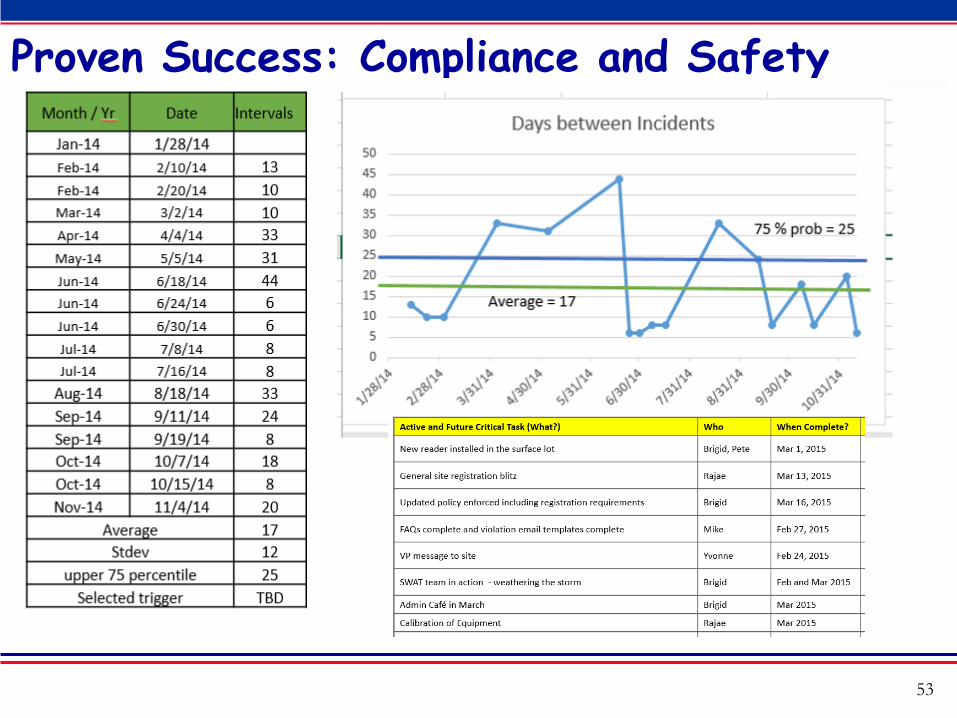
Proven Success: Compliance and Safety
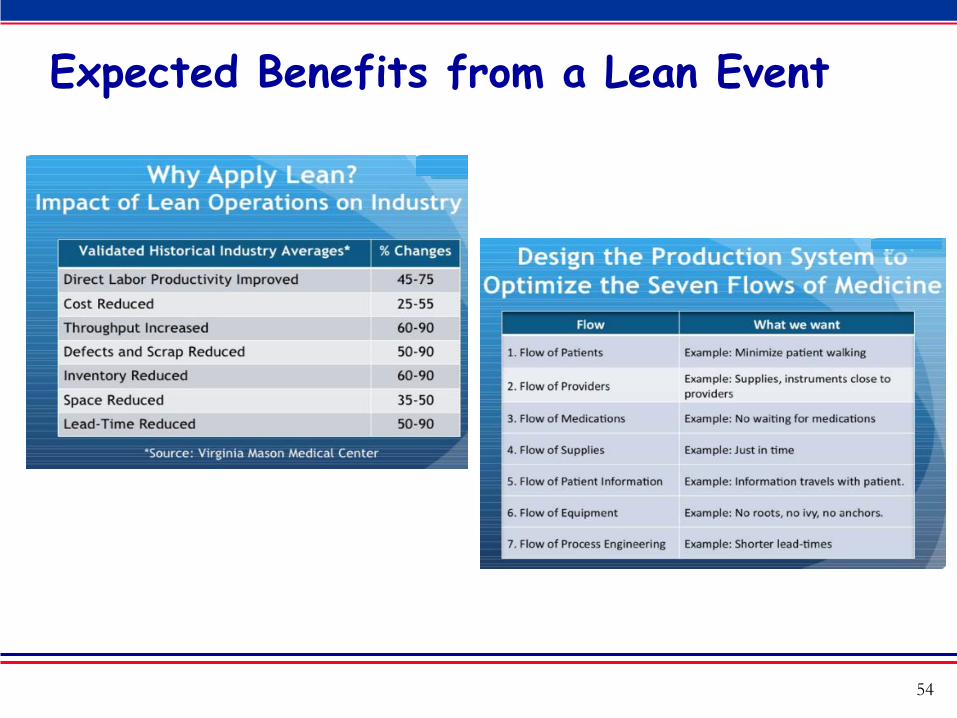
Expected Benefits from a Lean Event
54
55
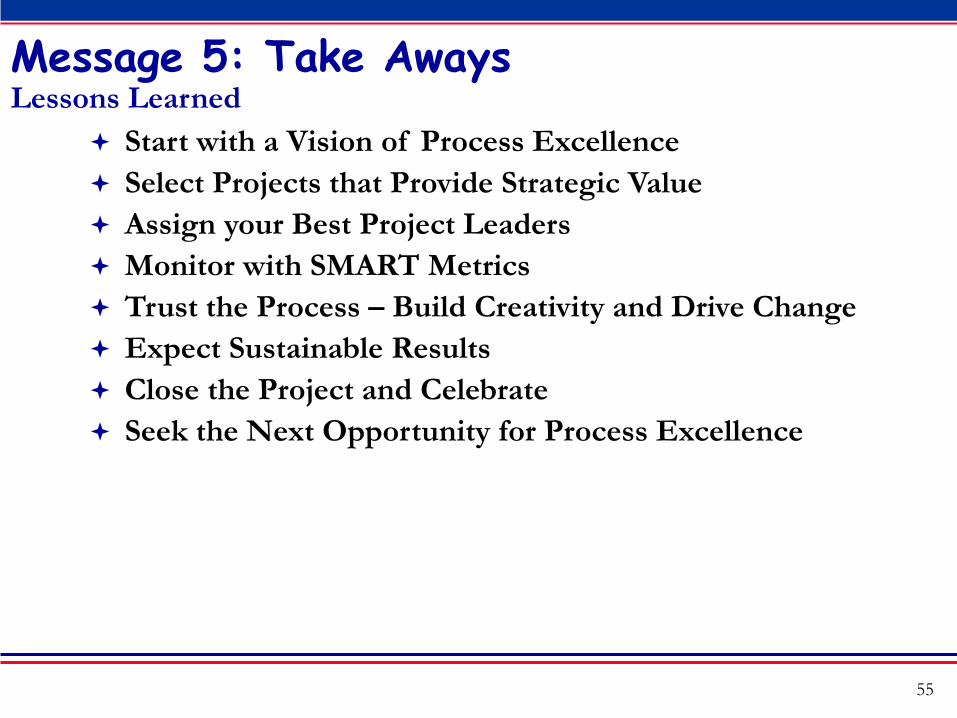
Message 5: Take Aways Lessons Learned
Start with a Vision of Process Excellence Select Projects that Provide Strategic Value Assign your Best Project Leaders Monitor with SMART Metrics Trust the Process – Build Creativity and Drive Change Expect Sustainable Results Close the Project and Celebrate Seek the Next Opportunity for Process Excellence
56
Continuing the Dialog
What are the compelling drivers in your organization now? How do you ensure alignment on current state and
desired state? How to gather the Voice of the Customer? What does it take for you to engage the team? Why do you leaders need to know change management? Do your efforts result in value delivery? When do you improve, how do you know the results are
sustained? What are you going to do to bring Kaizen and Kata into
your organization as a result of this roundtable discussion?
57
Thank You
Let's go get our boy.