Stereo 2Fo-Fc omit map of the ParF-ADP complex, crystal ... · PDF fileStereo 2Fo-Fc omit map...
3
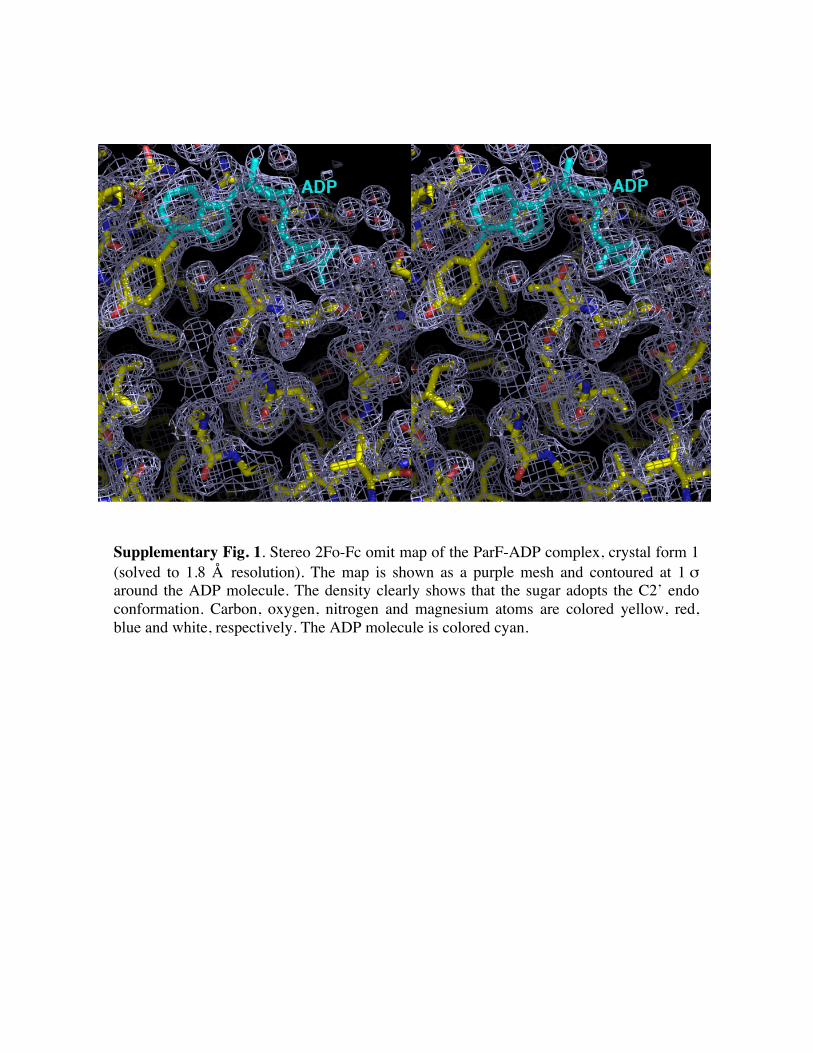
Supplementary Fig. 1. Stereo 2Fo-Fc omit map of the ParF-ADP complex, crystal form 1 (solved to 1.8 Å resolution). The map is shown as a purple mesh and contoured at 1 σ around the ADP molecule. The density clearly shows that the sugar adopts the C2’ endo conformation. Carbon, oxygen, nitrogen and magnesium atoms are colored yellow, red, blue and white, respectively. The ADP molecule is colored cyan.
-
Upload
truongliem -
Category
Documents
-
view
220 -
download
3
Transcript of Stereo 2Fo-Fc omit map of the ParF-ADP complex, crystal ... · PDF fileStereo 2Fo-Fc omit map...
Supplementary Fig. 1. Stereo 2Fo-Fc omit map of the ParF-ADP complex, crystal form 1 (solved to 1.8 Å resolution). The map is shown as a purple mesh and contoured at 1 σ around the ADP molecule. The density clearly shows that the sugar adopts the C2’ endo conformation. Carbon, oxygen, nitrogen and magnesium atoms are colored yellow, red, blue and white, respectively. The ADP molecule is colored cyan.
2
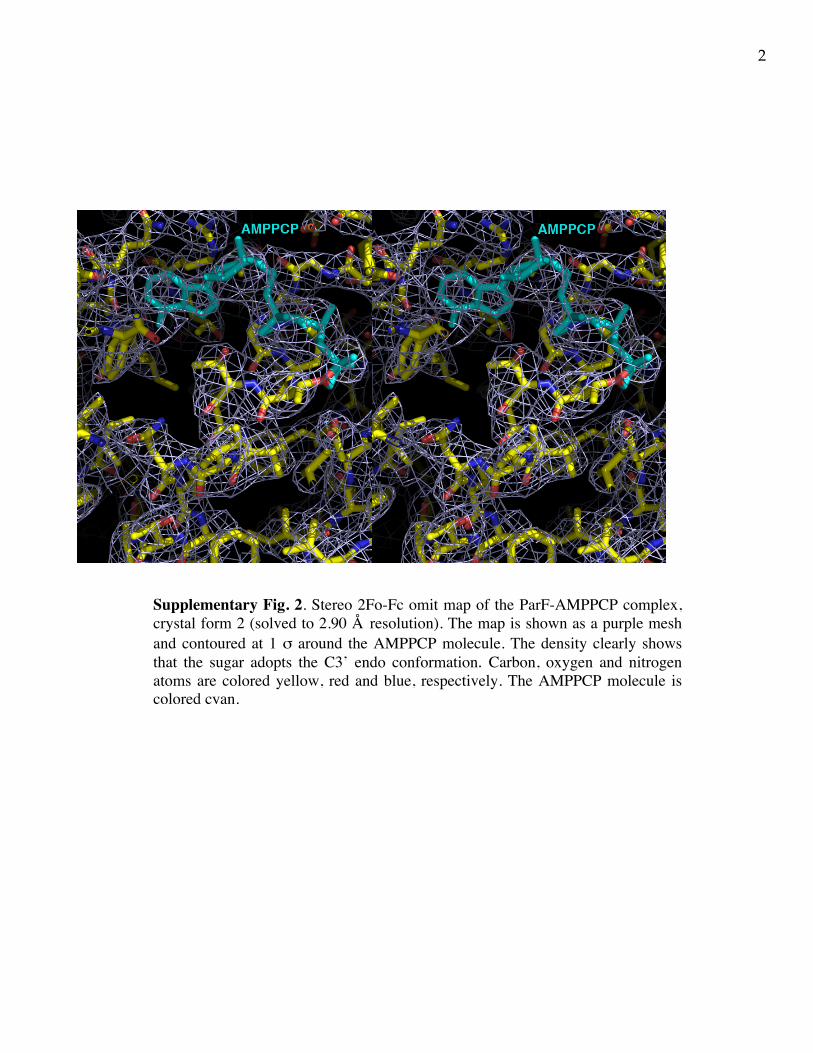
Supplementary Fig. 2. Stereo 2Fo-Fc omit map of the ParF-AMPPCP complex, crystal form 2 (solved to 2.90 Å resolution). The map is shown as a purple mesh and contoured at 1 σ around the AMPPCP molecule. The density clearly shows that the sugar adopts the C3’ endo conformation. Carbon, oxygen and nitrogen atoms are colored yellow, red and blue, respectively. The AMPPCP molecule is colored cyan.
3
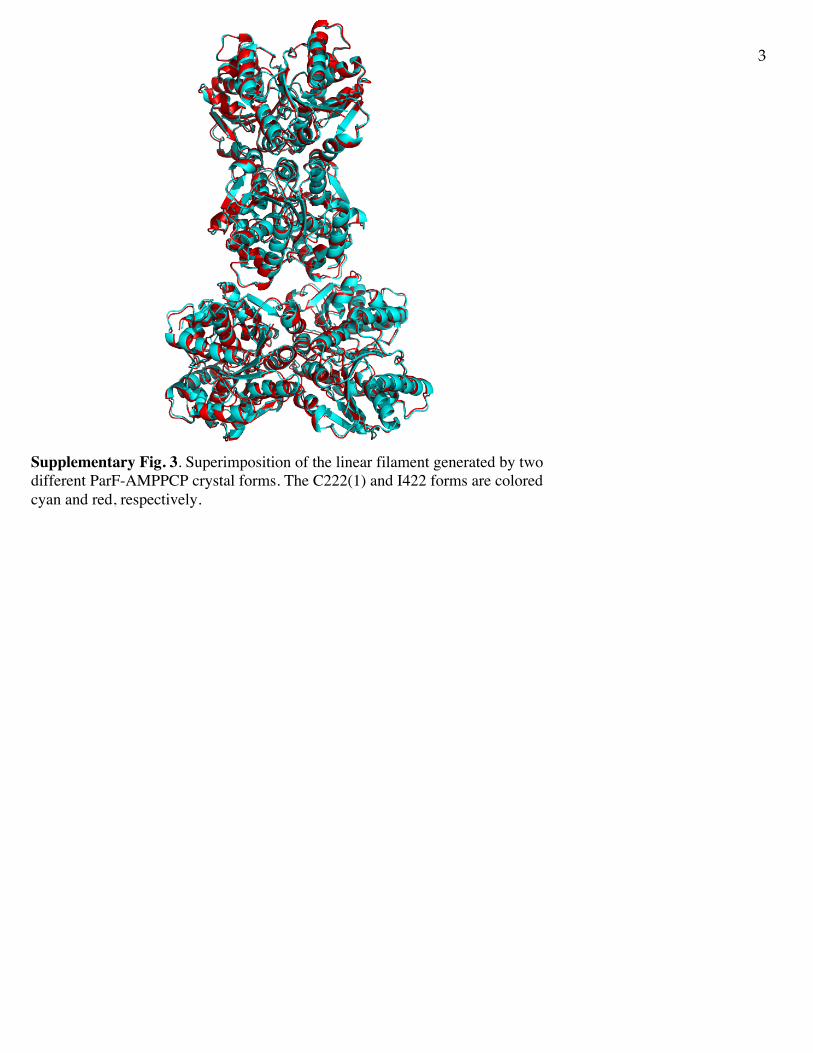
Supplementary Fig. 3. Superimposition of the linear filament generated by two different ParF-AMPPCP crystal forms. The C222(1) and I422 forms are colored cyan and red, respectively.