γ-secretase inhibitors reverse glucocorticoid resistance in T cell acute lymphoblastic leukemia
9
g-secretase inhibitors reverse glucocorticoid resistance in T cell acute lymphoblastic leukemia Pedro J Real 1,2 , Valeria Tosello 1,11 , Teresa Palomero 1,3,11 , Mireia Castillo 3 , Eva Hernando 4 , Elisa de Stanchina 5 , Maria Luisa Sulis 1,6 , Kelly Barnes 1 , Catherine Sawai 7 , Irene Homminga 8 , Jules Meijerink 8 , Iannis Aifantis 7 , Giuseppe Basso 9 , Carlos Cordon-Cardo 3 , Walden Ai 10 & Adolfo Ferrando 1,3,6 Gamma-secretase inhibitors (GSIs) block the activation of the oncogenic protein Notch homolog-1 (NOTCH1) in T cell acute lymphoblastic leukemia (T-ALL). However, limited antileukemic cytotoxicity and severe gastrointestinal toxicity have restricted the clinical application of these targeted drugs. Here we show that combination therapy with GSIs plus glucocorticoids can improve the antileukemic effects of GSIs and reduce their gut toxicity in vivo. Inhibition of NOTCH1 signaling in glucocorticoid-resistant T-ALL restored glucocorticoid receptor autoupregulation and induced apoptotic cell death through induction of the gene encoding BCL-2–like apoptosis initiator-11 (BCL2L11). GSI treatment resulted in cell cycle arrest and accumulation of goblet cells in the gut mediated by upregulation of the gene encoding the transcription factor Kru ¨ppel-like factor-4 (Klf4), a negative regulator of the cell cycle required for goblet cell differentiation. In contrast, glucocorticoid treatment induced transcriptional upregulation of cyclin D2 (Ccnd2) and protected mice from developing the intestinal goblet cell metaplasia typically induced by inhibition of NOTCH signaling with GSIs. These results support a role for glucocorticoids plus GSIs in the treatment of glucocorticoid-resistant T-ALL. GSIs, which block the presenilin–g-secretase complex, inhibit the production of amyloidogenic b-amyloid peptides involved in the pathogenesis of Alzheimer’s disease and the activation of NOTCH receptors 1,2 . The recent identification of activating mutations in the NOTCH1 receptor gene in over 50% of cases of T-ALL 3 prompted the initiation of a clinical trial to test the effectiveness of blocking NOTCH1 signaling with a small molecule GSI in this disease 4,5 . However, the clinical development of GSI-based therapies has been hampered by the limited ability of these drugs to induce apoptosis in human T-ALL 6,7 and by the development of severe gastrointestinal toxicity due to inhibition of NOTCH signaling in the gut 5,8–11 . Here we show that inhibition of NOTCH1 signaling with a GSI can reverse glucocorticoid resistance in T-ALL and that concurrent dexamethasone treatment protects mice from severe secretory meta- plasia 8–11 induced by inhibition of NOTCH signaling in the gut. RESULTS GSI treatment reverses glucocorticoid resistance in T-ALL NOTCH1 signaling has a key role in the specification of cell fate and maintenance of cell tropism during T cell development 12,13 . Aberrant NOTCH1 signaling can protect developing thymocytes against glucocorticoid-induced cell death 14 and is a crucial oncogenic event in the pathogenesis of T-ALL 15–17 . To test whether aberrant NOTCH1 signaling contributes to glucocorticoid resistance in T-ALL, we ana- lyzed the responses of human T-ALL cells to increased doses of dexamethasone in the presence of Compound E, a highly active GSI 18 . CUTLL1 cells, a well characterized T cell lymphoblastic cell line with activated NOTCH1 (ref. 6), are highly resistant to gluco- corticoids, showing only a minimal loss of cell viability when treated with dexamethasone concentrations as high as 1 10 5 M(Fig. 1a). Treatment of CUTLL1 cells with 100 nM Compound E for 72 h effectively blocks NOTCH1 signaling and induces a modest cytostatic response characterized by G1 cell cycle arrest (Supplementary Fig. 1 online) 6,19,20 . By contrast, treatment of CUTLL1 cells with dexametha- sone in the presence of Compound E (100 nM) effectively impaired cell viability, with a 50% inhibitory concentration (IC 50 ) value of 7.7 10 8 M for dexamethasone in the presence of Compound E at 72 h (Fig. 1a). Similarly, dose-response analysis of CUTLL1 cells treated with dexamethasone (100 nM) and a range of Compound E concentrations showed a synergistic dose-dependent response to this GSI in combination with dexamethasone (Supplementary Fig. 2 online). Subsequent analysis of KOPTK1 and TALL1 cells, two Received 29 July; accepted 19 November; published online 21 December 2008; doi:10.1038/nm.1900 1 Institute for Cancer Genetics, Columbia University, 1130 St. Nicholas Avenue, New York, New York 10032, USA. 2 Andalusian Stem Cell Bank, Centro de Investigacio ´n Biome ´ dica, Avenida del Conocimiento, Granada 18100, Spain. 3 Department of Pathology, Columbia University Medical Center, 630 West 168th Street, New York, New York 10032, USA. 4 Department of Pathology, New York University Medical Center, 550 First Avenue, New York, New York 10016, USA. 5 Antitumor Assessment Core Facility, Memorial Sloan-Kettering Cancer Center, Zuckerman Research Center, 417 East 68th Street, New York, New York 10021, USA. 6 Department of Pediatrics, Columbia University Medical Center, 161 Fort Washington Avenue, New York, New York 10032, USA. 7 Department of Pathology, New York University Cancer Institute, 530 First Avenue, New York, New York 10016, USA. 8 Department of Pediatric Oncology/Hematology, Erasmus MC-Sophia Children’s Hospital, Dr. Molewaterplein 60, Rotterdam 3015GJ, The Netherlands. 9 Laboratory of Oncohematology, Department of Pediatrics ‘Salus Pueri’, University of Padua, Via Giustiniani 3, Padua 35128, Italy. 10 Department of Pathology, Microbiology and Immunology, University of South Carolina School of Medicine, 6311 Garners Ferry Road, Columbia, South Carolina 29208, USA. 11 These authors contributed equally to this work. Correspondence should be addressed to A.F. ([email protected]). 50 VOLUME 15 [ NUMBER 1 [ JANUARY 2009 NATURE MEDICINE ARTICLES © 2009 Nature America, Inc. All rights reserved.
Transcript of γ-secretase inhibitors reverse glucocorticoid resistance in T cell acute lymphoblastic leukemia
g-secretase inhibitors reverse glucocorticoid resistancein T cell acute lymphoblastic leukemiaPedro J Real1,2, Valeria Tosello1,11, Teresa Palomero1,3,11, Mireia Castillo3, Eva Hernando4, Elisa de Stanchina5,Maria Luisa Sulis1,6, Kelly Barnes1, Catherine Sawai7, Irene Homminga8, Jules Meijerink8, Iannis Aifantis7,Giuseppe Basso9, Carlos Cordon-Cardo3, Walden Ai10 & Adolfo Ferrando1,3,6
Gamma-secretase inhibitors (GSIs) block the activation of the oncogenic protein Notch homolog-1 (NOTCH1) in T cell acute
lymphoblastic leukemia (T-ALL). However, limited antileukemic cytotoxicity and severe gastrointestinal toxicity have restricted the
clinical application of these targeted drugs. Here we show that combination therapy with GSIs plus glucocorticoids can improve
the antileukemic effects of GSIs and reduce their gut toxicity in vivo. Inhibition of NOTCH1 signaling in glucocorticoid-resistant
T-ALL restored glucocorticoid receptor autoupregulation and induced apoptotic cell death through induction of the gene encoding
BCL-2–like apoptosis initiator-11 (BCL2L11). GSI treatment resulted in cell cycle arrest and accumulation of goblet cells in the
gut mediated by upregulation of the gene encoding the transcription factor Kruppel-like factor-4 (Klf4), a negative regulator of the
cell cycle required for goblet cell differentiation. In contrast, glucocorticoid treatment induced transcriptional upregulation of cyclin
D2 (Ccnd2) and protected mice from developing the intestinal goblet cell metaplasia typically induced by inhibition of NOTCH
signaling with GSIs. These results support a role for glucocorticoids plus GSIs in the treatment of glucocorticoid-resistant T-ALL.
GSIs, which block the presenilin–g-secretase complex, inhibit theproduction of amyloidogenic b-amyloid peptides involved in thepathogenesis of Alzheimer’s disease and the activation of NOTCHreceptors1,2. The recent identification of activating mutations in theNOTCH1 receptor gene in over 50% of cases of T-ALL3 prompted theinitiation of a clinical trial to test the effectiveness of blockingNOTCH1 signaling with a small molecule GSI in this disease4,5.However, the clinical development of GSI-based therapies has beenhampered by the limited ability of these drugs to induce apoptosis inhuman T-ALL6,7 and by the development of severe gastrointestinaltoxicity due to inhibition of NOTCH signaling in the gut5,8–11.
Here we show that inhibition of NOTCH1 signaling with a GSIcan reverse glucocorticoid resistance in T-ALL and that concurrentdexamethasone treatment protects mice from severe secretory meta-plasia8–11 induced by inhibition of NOTCH signaling in the gut.
RESULTS
GSI treatment reverses glucocorticoid resistance in T-ALL
NOTCH1 signaling has a key role in the specification of cell fate andmaintenance of cell tropism during T cell development12,13. AberrantNOTCH1 signaling can protect developing thymocytes against
glucocorticoid-induced cell death14 and is a crucial oncogenic event inthe pathogenesis of T-ALL15–17. To test whether aberrant NOTCH1signaling contributes to glucocorticoid resistance in T-ALL, we ana-lyzed the responses of human T-ALL cells to increased doses ofdexamethasone in the presence of Compound E, a highly activeGSI18. CUTLL1 cells, a well characterized T cell lymphoblastic cellline with activated NOTCH1 (ref. 6), are highly resistant to gluco-corticoids, showing only a minimal loss of cell viability when treatedwith dexamethasone concentrations as high as 1 � 10�5 M (Fig. 1a).Treatment of CUTLL1 cells with 100 nM Compound E for 72 heffectively blocks NOTCH1 signaling and induces a modest cytostaticresponse characterized by G1 cell cycle arrest (Supplementary Fig. 1online)6,19,20. By contrast, treatment of CUTLL1 cells with dexametha-sone in the presence of Compound E (100 nM) effectively impairedcell viability, with a 50% inhibitory concentration (IC50) value of7.7 � 10�8 M for dexamethasone in the presence of Compound E at72 h (Fig. 1a). Similarly, dose-response analysis of CUTLL1 cellstreated with dexamethasone (100 nM) and a range of Compound Econcentrations showed a synergistic dose-dependent response to thisGSI in combination with dexamethasone (Supplementary Fig. 2online). Subsequent analysis of KOPTK1 and TALL1 cells, two
Received 29 July; accepted 19 November; published online 21 December 2008; doi:10.1038/nm.1900
1Institute for Cancer Genetics, Columbia University, 1130 St. Nicholas Avenue, New York, New York 10032, USA. 2Andalusian Stem Cell Bank, Centro de InvestigacionBiomedica, Avenida del Conocimiento, Granada 18100, Spain. 3Department of Pathology, Columbia University Medical Center, 630 West 168th Street, New York, NewYork 10032, USA. 4Department of Pathology, New York University Medical Center, 550 First Avenue, New York, New York 10016, USA. 5Antitumor Assessment CoreFacility, Memorial Sloan-Kettering Cancer Center, Zuckerman Research Center, 417 East 68th Street, New York, New York 10021, USA. 6Department of Pediatrics,Columbia University Medical Center, 161 Fort Washington Avenue, New York, New York 10032, USA. 7Department of Pathology, New York University Cancer Institute,530 First Avenue, New York, New York 10016, USA. 8Department of Pediatric Oncology/Hematology, Erasmus MC-Sophia Children’s Hospital, Dr. Molewaterplein 60,Rotterdam 3015GJ, The Netherlands. 9Laboratory of Oncohematology, Department of Pediatrics ‘Salus Pueri’, University of Padua, Via Giustiniani 3, Padua 35128,Italy. 10Department of Pathology, Microbiology and Immunology, University of South Carolina School of Medicine, 6311 Garners Ferry Road, Columbia, South Carolina29208, USA. 11These authors contributed equally to this work. Correspondence should be addressed to A.F. ([email protected]).
50 VOLUME 15 [ NUMBER 1 [ JANUARY 2009 NATURE MEDICINE
ART ICL ES©
2009
Nat
ure
Am
eric
a, In
c. A
ll ri
gh
ts r
eser
ved
.

additional glucocorticoid-resistant T-ALL cell lines that respond withG1 cell cycle arrest upon Compound E treatment3 (SupplementaryFig. 1), showed significant decreases in cell viability when treatedwith dexamethasone plus Compound E (P o 0.001), indicative of asynergistic interaction between these agents (Fig. 1a). Analysis ofglucocorticoid-sensitive cell lines (DND41 and P12-ICHIKAWA cells)or B cell–derived tumors devoid of NOTCH1 activation (Raji andRamos cells) showed no evidence of synergistic interaction betweenCompound E and dexamethasone (Fig. 1b). Similarly, analysis ofeight T-ALL primary samples from human subjects at relapseshowed synergistic interaction between Compound E and dexametha-sone in two out of three glucocorticoid-resistant tumors but not inleukemias retaining glucocorticoid sensitivity (Fig. 1c and Supple-mentary Fig. 3 online).
The synergistic effects of Compound E plus dexamethasoneobserved in CUTLL1 cells were reversed by treatment with RU486, aglucocorticoid receptor antagonist (Fig. 1d). Similarly, expression ofan intracellular activated NOTCH1 (ICN1), which does not requireg-secretase cleavage, bypassed the inhibitory effects of GSIs onNOTCH1 signaling and protected CUTLL1 cells from the effects ofdexamethasone plus Compound E treatment (Fig. 1e and Supple-mentary Fig. 4 online). These data, together with the lack ofsynergism between Compound E and other antileukemic drugs(Supplementary Results, Supplementary Discussion and Supple-mentary Fig. 5 online), demonstrate a specific interaction betweenGSIs and glucocorticoids in T-ALL.
Next, we asked whether the synergistic effects of Compound Eplus dexamethasone reflect enhanced apoptotic responses to glu-cocorticoid therapy. Annexin V–propidium iodide (PI) stainingindicated increased apoptosis in CUTLL1, KOPTK1 and TALL1cells treated with Compound E and dexamethasone for 48–72 h(Fig. 1f). Additionally, western blot analysis of CUTLL1 cellstreated with Compound E plus dexamethasone showed a marked
increase in poly-(ADP-ribose) polymerase (PARP) cleavage, indicativeof activation of effector caspases and apoptosis (Fig. 1g). Furthermore,Z-VAD, a pancaspase inhibitor, reversed the induction of PARPcleavage and apoptosis (detected by annexin V–PI staining) triggeredby Compound E plus dexamethasone in this cell line (Fig. 1g,h).
NOTCH1 inhibition restores NR3C1 autoregulation
Both NOTCH1 and the glucocorticoid receptor function as ligand-activated transcription factors, suggesting that crosstalk betweenNOTCH1 signaling and glucocorticoid therapy may enhance thetranscriptional response to dexamethasone in glucocorticoid-resistantT-ALL. To analyze the effects of glucocorticoid treatment in thetranscriptional regulatory network controlled by NOTCH1 inT-ALL19 and to explore the mechanisms mediating the reversal ofglucocorticoid resistance upon NOTCH inhibition, we performedgene expression profiling with oligonucleotide microarrays inCUTLL1 cells treated with vehicle (DMSO), dexamethasone (1 mM),Compound E (100 nM) or both dexamethasone and Compound E for24 h. This analysis showed a more efficient glucocorticoid response incells treated with Compound E plus dexamethasone, with synergisticupregulation of glucocorticoid-regulated genes such as TSC22D3 (alsoknown as GILZ), CD53, SOCS1 and BTG2 (Fig. 2a and Supplemen-tary Fig. 6 online). Notably, the glucocorticoid receptor gene (NR3C1)ranked among the top genes synergistically upregulated by dexametha-sone plus GSI treatment in our microarray analysis (Fig. 2a). Numer-ous studies on the mechanisms of glucocorticoid resistance haveestablished that an effective upregulation of the NR3C1 gene inresponse to glucocorticoids is required for the activation of apoptosisin human leukemias21–26. Quantitative RT-PCR and western blotanalysis showed a moderate increase in glucocorticoid receptorexpression in CUTLL1 cells and primary T-ALL lymphoblasts treatedwith GSI and dexamethasone (Fig. 2b and Supplementary Fig. 3). Incontrast, dexamethasone plus Compound E treatment resulted in a
DMSOZ-VAD
P < 0.001
P < 0.001
P < 0.05P < 0.02
P < 0.001P < 0.001
2520151050
CU
TLL
1ap
opto
sis
(%)
TALL
1ap
opto
sis
(%)
KO
PT
K1
apop
tosi
s (%
)
CU
TLL
1ap
opto
sis
(%)
Contro
l
CompE Dex
a
Dexa
+
CompE
DMSO
CompEDex
a
Dexa
+
CompE
DMSO
CompE
Dexa
Dexa
+
CompE
DMSO
Ramos
RajiP12
DND41
CompE
Dexa
Dexa
+
CompE
Contro
l
CompEDex
a
Dexa
+
CompE
Contro
l
CompE
Dexa
Dexa
+
CompE
Contro
l
CompE
Dexa
Dexa
+
CompE
Actin
Cleaved PARP
PARP
Z-VADDexa
CompE ––– –
–+ + + +
+++++
++ +– – –
––––
16
12
8
4
0
40
30
20
10
0
20
15
10
5
0
0010
–10
10–9
10–8
10–7
10–6
10–5
Dexamethasone (M)Dexamethasone (M)10
–10
10–9
10–8
10–7
10–6
10–50
Dexamethasone (M)10
–10
10–9
10–8
10–7
10–6
10–50
Dexamethasone (M)10
–10
10–9
10–8
10–7
10–6
10–5 0
10–1
0
10–9
10–8
10–7
10–6
10–5
Dexamethasone (M)
1251007550250C
UT
LL1
ICN
1vi
abili
ty (
%)125
1007550250
CU
TLL
1 R
U48
6vi
abili
ty (
%)
NS120
80
40
0T-A
LL s
ampl
e 3
viab
ility
(%
)120
80
40
0T-A
LL s
ampl
e 2
viab
ility
(%
)120
80
40
0T-A
LL s
ampl
e 1
viab
ility
(%
)
Via
bilit
y (%
) 100806040200
Dexa (1 µM) + DMSODexa (1 µM) +CompE (100 nM)
DMSO
CompE
* P < 0.05
** P < 0.01
*** P < 0.001
********** ****** ****
0255075
100
TALL
1vi
abili
ty (
%)
0255075
100
KO
PT
K1
viab
ility
(%
)
0255075
100
CU
TLL
1vi
abili
ty (
%)
a
b c
d
f
g h
e
Figure 1 GSIs reverse glucocorticoid resistance in T-ALL cells. (a) Viability assays in
the glucocorticoid-resistant T-ALL cell lines CUTLL1 (72 h), KOPTK1 (48 h) and
TALL1 (72 h) treated with 100 nM Compound E (CompE) or vehicle only plus
increasing concentrations of dexamethasone. (b) Analysis of T-ALL cell lines sensitive
to glucocorticoids (DND41 and P12 ICHIKAWA) or B cell lineage cell lines (Raji and
Ramos). Dexa, dexamethasone. (c) Analysis of viability in primary T-ALL samples
resistant to glucocorticoids. NS, not significant. (d) Analysis of CUTLL1 cells treated with the glucocorticoid receptor antagonist RU486 (1 mM). (e) Analysis
of CUTLL1 cells expressing constitutively active intracellular NOTCH1 (ICN1). (f) Percentage of apoptotic cells (annexin V positive and PI negative) in
CUTLL1 (72 h), KOPTK1 (48 h) and TALL1 cells (72 h) treated with DMSO (control), CompE (100 nM), dexamethasone (1 mM) or dexamethasone (1 mM)plus CompE (100 nM). (g,h) Inhibition of apoptosis induction by dexamethasone plus CompE treatment by the Z-VAD caspase inhibitor, as demonstrated by
inhibition of PARP cleavage by western blot analysis (g) and decreased annexin V–positive and PI-negative cells by flow cytometry (h). Data in a–f and h are
means ± s.d. of triplicate experiments. Statistical significance was assessed with Student’s t-test.
ART ICL ES
NATURE MEDICINE VOLUME 15 [ NUMBER 1 [ JANUARY 2009 51
©20
09 N
atu
re A
mer
ica,
Inc.
All
rig
hts
res
erve
d.

significantly higher (fivefold) upregulation of glucocorticoid receptortranscript and protein levels (Fig. 2b). These results suggest thatinhibition of NOTCH1 signaling enhances glucocorticoid receptorautoupregulation and glucocorticoid sensitivity in otherwiseglucocorticoid-resistant T-ALL cells (Supplementary Results andSupplementary Discussion). Consistent with this hypothesis, and inagreement with previous reports in T-ALL27–29, retroviral expressionof the NR3C1 gene restored glucocorticoid sensitivity and enhancedthe apoptotic response of CUTLL1 cells to dexamethasone (Fig. 2c).Conversely, short hairpin RNA (shRNA) knockdown of the glucocor-ticoid receptor resulted in complete abrogation of the apoptosisinduced by dexamethasone plus Compound E (Fig. 2d).
Glucocorticoid receptor autoupregulation has been linked to thefunction of NR3C1 promoter 1A (hematopoietic) and NR3C1promoters 1B and 1C (ubiquitous)25,30–32. Chromatin immunopreci-pitation (ChIP)-on-chip analysis of Hairy and Enhancer of Splithomolog-1 (HES1), a transcriptional repressor directly controlled byNOTCH1, identified HES1 binding in glucocorticoid receptor pro-moters 1B and 1C in T-ALL cells (Supplementary Fig. 7 online).Subsequent quantitative ChIP assays confirmed HES1 binding toglucocorticoid receptor promoters 1B and 1C and also showedHES1 binding to regulatory sequences in promoter 1A, which wasnot represented on the ChIP-on-chip promoter microarray (Fig. 2e).Upregulation of the hematopoietic NR3C1 A1 promoter is mediatedby a 35–base pair regulatory sequence (FP11-FP12) which is activatedby a NR3C1-myeloblastosis oncoprotein (MYB) heterodimer complexupon glucocorticoid treatment31. Luciferase reporter assays showed
that dexamethasone treatment and MYB expression activated aNR3C1 A1 FP11-FP12 reporter construct (Fig. 2f). Of note, HES1expression antagonized the activation of the NR3C1 A1 promoter bydexamethasone, MYB and the combination of glucocorticoid treat-ment and MYB expression (Fig. 2f). Consistent with these results,shRNA knockdown of HES1 in CUTLL1 cells resulted in increasedglucocorticoid receptor transcript and protein levels (Fig. 2g) andeffective reversal of glucocorticoid resistance (Fig. 2h).
BCL2L11 upregulation reverses glucocorticoid resistance
Analysis of the expression of proapototic and antiapoptotic regulatorsof the mitochondrial cell-death pathway showed that BCL2L11,encoding a BH3-only protein (BIM) required for glucocorticoid-induced apoptosis33–35, was slightly upregulated by dexamethasonebut markedly and synergistically upregulated in CUTLL1 cells treatedwith dexamethasone plus Compound E (Fig. 3a). Similarly, analysis ofthe gene encoding BCL2-modifying factor (BMF), a BH3-only proteininvolved in anoikis and cytoskeleton stress–induced apoptosis36,showed synergistic transcriptional upregulation in cells treated withCompound E plus dexamethasone (Fig. 3b). Similar results wereobtained in KOPTK1 and TALL1 cells (Supplementary Fig. 8 online).Western blot analysis showed a marked (fivefold) upregulation of theproapoptotic factors BIML, encoded by the BCL2L11 isoform 6, andBIMS, encoded by the BCL2L11 isoform 9, in CUTLL1 cellstreated with Compound E plus dexamethasone (Fig. 3c). In contrast,transcriptional upregulation of BMF caused less consistent increasesin BMF protein (Fig. 3c). Consistent with these results, shRNA
HES1shRNA
LUCshRNA
HES1shRNA
LUCshRNA
HES1shRNA
LUCshRNA
HES1shRNA
LUCshRNA
DMSO
Dexa
DMSO
Dexa
P = 0.001
P < 0.001
P = 0.001
P < 0.001
P < 0.001
P < 0.01
P < 0.05
P < 0.001
100
80
60
40
20
0
Via
bilit
y (%
)
NR3C1
Actin
NR3C1
1 5.3
3
2
1
0
NR
3C1
A1
rela
tive
expr
essi
on
HES1
Actin
HES1 1 0.1
1A 1B1 1B2 1C
Contro
lIg
GHES1
Contro
lIg
GHES1
Contro
lIg
GHES1
Contro
lIg
GHES1
50
40
30
20
10
0Fol
d en
richm
ent
NR
3C1
ChI
P
NR3C1
1A 1B1 1B2 1C
1A 27 kb 1B 1C6
5
4
3
2
1
0++++++++
+ + + +
+++++ + + +
–
––
–
––
–
–––
–
–
DexaMYB
HES1
NR3C1
Rel
ativ
e N
R3C
1 A
1(F
P11
-FP
12)
prom
oter
act
ivity
DMSO Dexa +CompE
0
5
10
15
20
Apo
ptos
is (
%)
Apo
ptos
is (
%)
NR3C1 1 0.01Actin
NR3C1
shRNA pGIP
Z
pMSCV
pMSCV
NR3C1
pGIP
Z
NR3C1
shRNA LUC
shRNA NR3C1
DMSO Dexa0
5
10
15
20pMSCV puropMSCV NR3C1
1 4.96NR3C1
Actin
NR3C1
1 1.4 2.5 5.0NR3C1
Actin
NR3C1
Dexa
CompE
+
+
+
+ –
––
–
CUTLL1
DMSO
CompE
Dexa
Dexa
+
CompE
86
4
2
0N
R3C
1re
lativ
e ex
pres
sion
DM
SO
Com
pED
exa
Dex
a +
Com
pE
–3 0 3
SLC7A11LRP4RXRA
CD300AABCA1
IL4HES1
FLT3LGCD52CD69
POLD4TGFBR2
TRAF3IP2PCAFBTG2XBP1
PBXIP1HIST1H2BG
SOCS1AKR1C3AKR1C2
RORCSOCS1SOCS1
HBP1FGFR1FAIM3
RHOBTB3CD53
AKAP2LRAP
ABCC5
TSC22D3NR3C1
NR3C1
a b
c
e f
g h
d
Figure 2 Inhibition of NOTCH1-HES1 signaling restores glucocorticoid receptor autoregulation. (a) Microarray gene expression changes in CUTLL1 cells at
24 h treated with DMSO, CompE, dexamethasone and CompE plus dexamethasone. Relative expression levels are color-coded as indicated at the bottom.
(b) Quantitative RT-PCR analysis of the gene encoding glucocorticoid receptor (NR3C1; left) and western blot analysis and quantification of glucocorticoid
receptor protein expression (right) in CUTLL1 cells treated with dexamethasone and CompE compared with vehicle only (DMSO). (c) Western blot analysis of
NR3C1 expression (left) and induction of apoptosis (right) by dexamethasone and CompE treatment in CUTLL1 cells infected with retroviruses expressingthe glucocorticoid receptor (pMSCV NR3C1) and an empty retroviral control (pMSCV puro). (d) Analysis of apoptosis induction by dexamethasone plus
CompE treatment in CUTLL1 cells infected with lentiviruses encoding shRNA targeting the glucocorticoid receptor (pGIPZ NR3C1). A shRNA targeting the
luciferase gene (LUC shRNA) was used as control. (e) Quantitative ChIP analysis of HES1 binding to NR3C1 promoter sequences. Kb, kilobases. (f) Effects
of HES1, MYB and dexamethasone (1 mM) in the activity of a human NR3C1 A1 reporter. Luciferase activity is shown relative to an internal control
expressing Renilla luciferase. (g,h) NR3C1 expression (g) and analysis of apoptosis (h) in CUTLL1 cells treated with dexamethasone and CompE after
lentiviral shRNA knockdown of HES1. Drug concentrations in a–c were 100 nM CompE and 1 mM dexamethasone. Error bars represent means ± s.d. of
triplicate experiments. Statistical significance was assessed with Student’s t-test. HES1 and NR3C1 relative protein expression is indicated at the bottom
of corresponding lanes in the western blot.
ART ICL ES
52 VOLUME 15 [ NUMBER 1 [ JANUARY 2009 NATURE MEDICINE
©20
09 N
atu
re A
mer
ica,
Inc.
All
rig
hts
res
erve
d.

knockdown of BCL2L11 effectively blocked the apoptosis inductionby Compound E plus dexamethasone treatment in CUTLL1 cells(Fig. 3d,e), but downregulation of BMF by shRNA knockdowndid not protect these cells from the apoptosis induced by suchtreatment (Fig. 3f,g). Together, these results demonstrate thatBCL2L11 upregulation mediates the reversal of glucocorticoidresistance in T-ALL cells treated with dexamethasone plusCompound E (Fig. 3h).
Antileukemic effects of GSI and glucocorticoids in vivo
To test whether the synergistic effects of concurrent GSI andglucocorticoid treatment in vitro enhance the therapeutic efficacyof these agents in vivo, we analyzed the effects of dexamethasoneand NOTCH inhibition in a xenograft model of glucocorticoid-resistant T-ALL. In these experiments we used DBZ in vitro (Supple-mentary Fig. 9 online) and with well established activity in vivo8.CUTLL1 cells infected with lentiviruses expressing the gene encodingluciferase were injected subcutaneously in the flanks of immuno-deficient (nonobese diabetic–severe combined immunodeficient(NOD-SCID)) mice. After 1 week, mice harboring homogeneoussubcutaneous tumors were treated with vehicle only (DMSO), DBZ,dexamethasone or DBZ plus dexamethasone and monitored for 4 dwith a bioimaging system to quantify luciferase activity. In thisexperiment, mice treated with dexamethasone showed progressivetumor growth similar to that observed in vehicle-treated controls,whereas mice treated with DBZ showed a moderate delay in tumorgrowth (Fig. 4a,b) consistent with the cytostatic effect of NOTCH1inhibition by GSIs observed in CUTLL1 cells in vitro (SupplementaryFig. 1)6. By contrast, mice treated with DBZ plus dexamethasonehad marked antitumor responses with a significant reduction intumor burden after 4 d of treatment (Fig. 4a,b; P o 0.01). Notably,tumor xenografts of CUTLL1 cells expressing the activated intra-cellular form of NOTCH1 (CUTLL1-ICN1 cells; SupplementaryFig. 4) were unresponsive to the combination of DBZ plusdexamethasone (Fig. 4c), indicating that reversal of glucocorticoid
resistance in vivo by DBZ treatment is mediated by inhibition ofNOTCH1 signaling in the leukemic cells.
To test the importance of these results in a xenograft model thatmay be a more faithful representation of the natural history of humanswith T-ALL, we intravenously injected CUTLL1 cells expressing theluciferase marker into irradiated NOD-SCID mice. After 3 weeks,groups of mice with homogeneous tumor burdens were treated withvehicle only, dexamethasone, DBZ or DBZ plus dexamethasone for2 weeks. Disease progression was readily apparent in control anddexamethasone-treated mice, resulting in tumor-related mortalitystarting 3 weeks after the initiation of the treatment (Fig. 4d). Micein the GSI-only treatment group developed weight loss and acceleratedmortality at week 3 (Fig. 4d and data not shown) despite having lowlevels of leukemia infiltration compared with DMSO and dexametha-sone–treated mice (data not shown). Finally, all mice treated withDBZ plus dexamethasone were disease free, as determined by in vivobioimaging 3 weeks after the initiation of the treatment (data notshown). However, two of these mice were euthanized on day 23because of excessive (420%) weight loss (Fig. 4d and data notshown). Analysis at the end of the observation period (10 weeks)showed significantly improved survival among mice treated withdexamethasone plus DBZ (P o 0.05 versus controls; Fig. 4d).
Dexamethasone abrogates GSI-induced toxicity in the gut
The poor outcome observed in DBZ-treated mice, which harbored lowlevels of leukemia infiltration, suggested that GSI-induced toxicitymight have contributed to their accelerated mortality. Moreover, theimproved survival observed in mice treated with DBZ plus dexametha-sone suggested that glucocorticoid therapy could ameliorate some ofthe toxic effects associated with GSI treatment. To test this hypothesis,we analyzed the effects of dexamethasone, DBZ or dexamethasone plusDBZ in C57/BL6 mice compared to vehicle-only treatment controls(Supplementary Results, Supplementary Discussion and Supple-mentary Fig. 10 online). Histological analysis of multiple organsrevealed marked changes induced by DBZ treatment in the intestine,
Figure 3 BCL2L11 upregulation reverses
glucocorticoid resistance in T-ALL cells
treated with dexamethasone plus CompE.
(a,b) Quantitative RT-PCR analysis of the BH3-
only factors BCL2L11 (a) and BMF (b) in
CUTLL1 cells treated with dexamethasone,
CompE or both compared with vehicle only
(DMSO). Relative expression is shown normalized
to vehicle-only controls. (c) Western blot analysis
and quantification of BIM and BMF in CUTLL1
cells treated with dexamethasone, CompE or both
compared with vehicle only (DMSO). (d) Western
blot analysis of BIM after shRNA-mediated
knockdown. CUTLL1 cells infected with control
lentivirus targeting the luciferase gene or BIMwere treated with vehicle only or dexamethasone
plus CompE for 24 h and analyzed by western
blotting. (e) Induction of apoptosis in control
and BIM knockdown cells treated with
dexamethasone plus CompE. (f) Western blot
analysis of BMF after shRNA knockdown.
CUTLL1 cells infected with control lentivirus
targeting the luciferase gene or lentivirus
targeting BMF were treated with vehicle only
or dexamethasone plus CompE for 24 h and
analyzed by western blot. (g) Induction of apoptosis in control and BMF knockdown cells treated with dexamethasone plus CompE. Apoptosis refers to the
percentage of annexin V–positive and PI-negative cells. (h) Schematic representation of the transcriptional regulatory network controlling glucocorticoid
receptor autoregulation downstream of NOTCH1 and dexamethasone-induced apoptosis upon inhibition of NOTCH1 signaling via GSI treatment.
0
ApoptosisApoptosis
Apo
ptos
is (
%)
BIM BIM
NR3C1NR3C1NR3C1
NR3C1
Dexa Dexa
HES1HES1
NOTCH1NOTCH1
GSI
2015105
DMSO
Dexa
+
CompE
DMSO Dexa +CompE
BMF shRNALUC shRNA
0.2
1.010.80.60.40.2
0shRNA
LUCshRNABIM
shRNALUC
shRNABIM
shRNALUC
shRNABIM
shRNALUC
shRNABMF
shRNALUC
shRNABIM
Dexa + CompE
Dexa + CompE Dexa + CompE
Dex
a +
Com
pEB
MF
leve
ls
Actin
BMF
Dexa +CompE
Dexa +CompE
– –+ +
– –+ +BIMELBIMLBIMS
Actin
1.0
0.05
10.80.60.40.2
0BIM
L le
vels 1
0.80.60.40.2
0BIM
S le
vels
1.0
0.02
20151050A
popt
osis
(%
) P < 0.001BIM shRNALUC shRNA
5.7
1.30.05
1.0
DMSO
CompE
Dexa
Dexa
+
CompEDM
SO
CompE
Dexa
Dexa
+
CompE
DMSO
CompE
Dexa
Dexa
+
CompE
DMSO
CompE
Dexa
Dexa
+
CompE
6
4
2
0
BIM
S le
vels
BIM
L le
vels 5.3
0.080.071.0
6
4
2
0
ActinBMFBIMSBIMLBIMEL
++++ –
–––CompE
Dexa80
60
40
20
0
BM
F r
elat
ive
expr
essi
on
BC
L2L1
1 re
lativ
eex
pres
sion
2520151050
a
d
e f
g h
b c
ART ICL ES
NATURE MEDICINE VOLUME 15 [ NUMBER 1 [ JANUARY 2009 53
©20
09 N
atu
re A
mer
ica,
Inc.
All
rig
hts
res
erve
d.

thymus and the spleen (Fig. 4e and Supplementary Fig. 11 online).Thus, DBZ-treated mice showed severe intestinal secretory metaplasiacharacterized by a marked increase in the number of goblet cells andarrested cell proliferation (determined by Ki67 immunostaining) in thecrypts of the small intestine8–11 (Fig. 4e and Supplementary Fig. 11).Dexamethasone treatment induced mild changes in the architecture ofthe gut that were most apparent after 10 d of treatment, with moderateelongation of the intestinal crypts and accumulation of Paneth cells atthe bottom of the crypt (Fig. 4e, Fig. 6d, Supplementary Results,Supplementary Discussion and Supplementary Fig. 11 online). Ofnote, mice treated with DBZ plus dexamethasone showed normalgoblet cell numbers with preservation of the architecture and prolifera-tion of the intestinal epithelium (Fig. 4e and Supplementary Fig. 11).
Pharmacokinetic analysis ruled out increased DBZ clearance inmice treated with dexamethasone plus DBZ (Supplementary Results,Supplementary Discussion and Supplementary Fig. 12 online) as amechanism of decreased GSI-induced gut toxicity. Moreover, histolo-gical analysis of the thymus and spleen showed increased lymphoidatrophy in mice treated with dexamethasone plus DBZ comparedwith mice treated with dexamethasone or DBZ alone (Fig. 4e,Supplementary Results, Supplementary Discussion and Supplemen-tary Figs. 13 and 14 online).
To analyze whether dexamethasone treatment could also amelioratethe effects of NOTCH inactivation via deletion of the gene coding for
recombination signal binding protein for immunoglobulin k J region(Rbpj, also known as Csl), which is the DNA binding proteincomponent of the Notch transcriptional complex9, we crossedRbpjflox/flox conditional knockout mice to the Cre-Tam mouse line,which expresses a tamoxifen-inducible Cre from the ubiquitousRosa26 locus37 and treated the resulting Rbpjflox/flox Cre-Tam micewith tamoxifen or tamoxifen plus dexamethasone. In this experi-ment, mice treated with tamoxifen showed increased numbers ofgoblet cells induced by ablation of Notch signaling in the gut. Incontrast, mice treated with tamoxifen plus dexamethasonewere protected from developing goblet cell metaplasia upon geneticinactivation of Notch signaling in the gut (Fig. 4f).
Klf4 upregulation in GSI-induced gut toxicity
The Klf4 tumor suppressor gene encodes a Kruppel-like zinc fingertranscription factor required for intestinal goblet cell differentia-tion38,39. Immunohistochemical analysis of Klf4 in the intestines ofmice treated with DMSO, dexamethasone, DBZ or DBZ plus dex-amethasone showed nuclear staining in goblet cells in the villi and inscattered cells in the crypts of control and dexamethasone-treatedmice (Fig. 5a). In contrast, mice treated with DBZ showed a markedincrease in the number of Klf4-positive cells in the crypts and in thevilli, which was abrogated by glucocorticoid treatment in mice treatedwith DBZ plus dexamethasone (Fig. 5a,b and Supplementary Fig. 15
+++
–––
DexaTMX
P < 0.001P < 0.01
P < 0.01
P < 0.01
P < 0.01
300
250
200
150
100
50
0
Gob
let c
ells
per
fiel
d
PAS
PAS
PAS
Rbpj flox/flox Cre-TamRbpj flox/flox Cre-Tam
Rbpj flox/flox Cre-TamTMX + Dexa
TMX
Thy
mus
Spl
een
PAS
H&
E
Sm
all i
ntes
tine
Control Dexa DBZ Dexa + DBZ
70605040302010
Time (d)
0
20
40
60
80
100
Sur
viva
l (%
)
DBZP < 0.01
DexaP = 0.5
Dexa + DBZP < 0.05
Control
Dexa + DBZControl
CUTLL1
CUTLL1
ICN1
CUTLL1
CUTLL1
ICN1
0
0.5
1
1.5
2
2.5
3
Fol
d ch
ange
tum
or m
ass
NS
Fold change0.48
Fold change1.53
Fold change1.75
Fold change1.8
Day 0 Day 4
Day 0 Day 4Day 0 Day 4
Day 0 Day 4
Dex
a +
DB
Z
DB
ZC
ontr
ol
Dex
a
Min = 50.000Max = 7 × 10⁶
Luci
fera
se c
ount
s ×
106
7
6
5
4
3
2
1ControlDexamethasoneDBZDexamethasone + DBZ0.1
1
10
Fol
d ch
ange
tum
or m
ass
1.95 1.67 1.30 0.69 Mean
a
c
e
f
d
b
Figure 4 Interaction of NOTCH inhibition and dexamethasone treatment in tumor response and gut toxicity in vivo. (a) Bioimaging quantification of tumor
mass changes in subcutaneous CUTLL1 T-ALL xenografts in mice treated with vehicle (control), dexamethasone, GSI (DBZ) or GSI plus dexamethasone
(Dexamethasone + DBZ) for 4 d. (b) Representative examples of bioluminescence in in vivo imaging showing changes in tumor load in representative mice
(mice with the closest values to the median are shown) treated with vehicle (control), dexamethasone (Dexa), DBZ or dexamethasone plus DBZ (Dexa +
DBZ). (c) Tumor mass changes induced by dexamethasone plus DBZ treatment compared to controls in CUTLL1 T-ALL xenografts (CUTLL1) and CUTLL1
xenografts expressing an intracellular form of NOTCH1 (CUTLL1 ICN1), which does not require g-secretase cleavage for activation. (d) Kaplan-Meier plot
of overall survival among mice treated with vehicle (Control), dexamethasone, DBZ or DBZ plus dexamethasone after xenograft transplantation of human
T-ALL cells via tail vein injection. (e) Histological analysis of small intestine, spleen and thymus from mice treated with vehicle, dexamethasone, DBZ or
dexamethasone plus DBZ for 5 d. PAS, periodic acid–Schiff stain. (f) Goblet cell analysis and quantification in the ileum of Rbpjflox/flox Cre-Tam conditional
knockout mice in basal conditions (Rbpjflox/flox Cre-Tam, after conditional deletion of Rbpj with tamoxifen (Rbpjflox/flox Cre-Tam TMX) and upon conditional
deletion of Rbpj followed by dexamethasone treatment (Rbpjflox/flox Cre-Tam TMX + Dexa). TMX, tamoxifen. Scale bars for e and f represent 100 mm in the
intestine and 400 mm in spleen and thymus. Error bars represent means ± s.d. of triplicate experiments.
ART ICL ES
54 VOLUME 15 [ NUMBER 1 [ JANUARY 2009 NATURE MEDICINE
©20
09 N
atu
re A
mer
ica,
Inc.
All
rig
hts
res
erve
d.
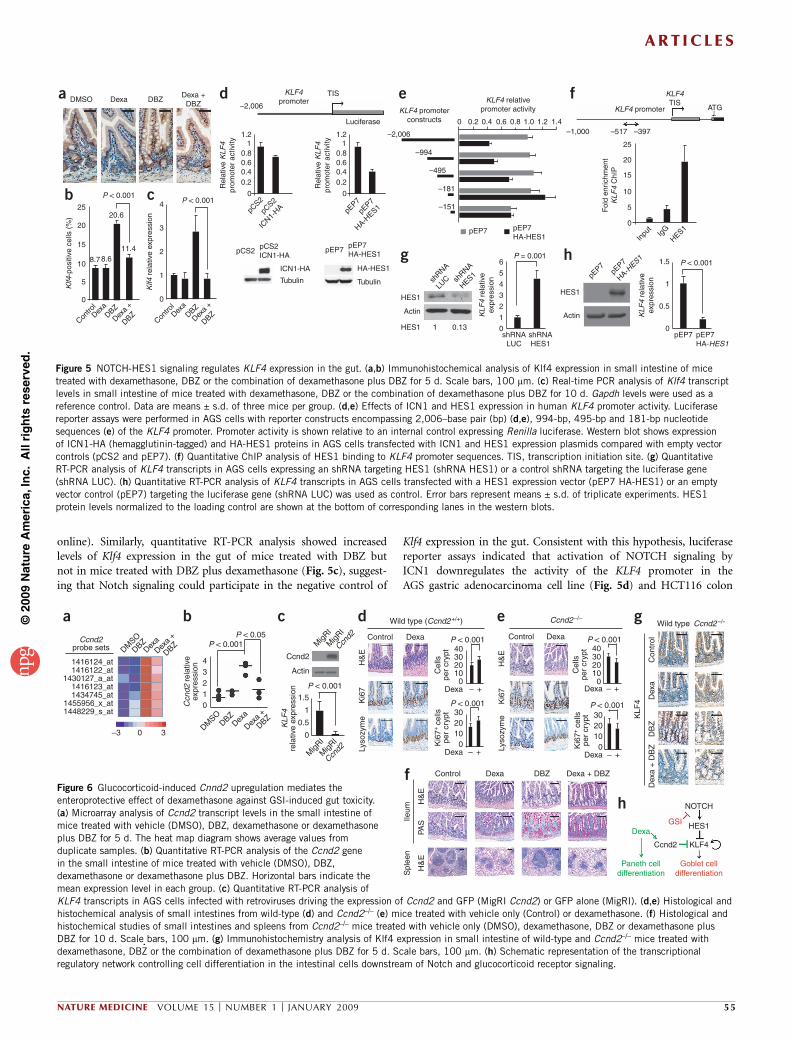
online). Similarly, quantitative RT-PCR analysis showed increasedlevels of Klf4 expression in the gut of mice treated with DBZ butnot in mice treated with DBZ plus dexamethasone (Fig. 5c), suggest-ing that Notch signaling could participate in the negative control of
Klf4 expression in the gut. Consistent with this hypothesis, luciferasereporter assays indicated that activation of NOTCH signaling byICN1 downregulates the activity of the KLF4 promoter in theAGS gastric adenocarcinoma cell line (Fig. 5d) and HCT116 colon
0Dexa – +
1020
Cel
lspe
r cr
ypt
Ki6
7+ c
ells
per
cryp
t
30
0Dexa – +
102030
40P < 0.001
P < 0.001
0Dexa – +
1020
Cel
lspe
r cr
ypt
Ki6
7+ c
ells
per
cryp
t
30
0Dexa – +
102030
40
P < 0.001
P < 0.001M
igRI
MigR
I
P < 0.001
Ccnd2
MigR
I
MigR
I
Ccnd2
Ccnd2
Actin
0
0.5KLF
4re
lativ
e ex
pres
sion
1
1.5
Ccnd2probe sets DM
SO
DBZDex
aDex
a +
DBZ
1416124_at1416122_at
1430127_a_at1416123_at1434745_at
1455956_x_at1448229_s_at
–3 0 3
a
432
Ccn
d2 r
elat
ive
expr
essi
on
10
DMSO
DBZDex
a
Dexa
+
DBZ
P < 0.001P < 0.05
b c d eWild type (Ccnd2+/+) Ccnd2–/–
Control
H&
EK
i67
Lyso
zym
e
Dexa
g
h
Ccnd2–/–Wild type
Con
trol
Dex
aD
BZ
KLF
4
Dex
a +
DB
Z
NOTCH
HES1
KLF4Ccnd2
Dexa
Paneth celldifferentiation
Goblet celldifferentiation
GSI
f Control
H&
EH
&E
PASIle
umS
plee
n
Dexa DBZ Dexa + DBZ
Control
H&
EK
i67
Lyso
zym
e
Dexa
Figure 6 Glucocorticoid-induced Cnnd2 upregulation mediates the
enteroprotective effect of dexamethasone against GSI-induced gut toxicity.
(a) Microarray analysis of Ccnd2 transcript levels in the small intestine of
mice treated with vehicle (DMSO), DBZ, dexamethasone or dexamethasone
plus DBZ for 5 d. The heat map diagram shows average values from
duplicate samples. (b) Quantitative RT-PCR analysis of the Ccnd2 gene
in the small intestine of mice treated with vehicle (DMSO), DBZ,
dexamethasone or dexamethasone plus DBZ. Horizontal bars indicate the
mean expression level in each group. (c) Quantitative RT-PCR analysis of
KLF4 transcripts in AGS cells infected with retroviruses driving the expression of Ccnd2 and GFP (MigRI Ccnd2) or GFP alone (MigRI). (d,e) Histological and
histochemical analysis of small intestines from wild-type (d) and Ccnd2–/– (e) mice treated with vehicle only (Control) or dexamethasone. (f) Histological and
histochemical studies of small intestines and spleens from Ccnd2–/– mice treated with vehicle only (DMSO), dexamethasone, DBZ or dexamethasone plusDBZ for 10 d. Scale bars, 100 mm. (g) Immunohistochemistry analysis of Klf4 expression in small intestine of wild-type and Ccnd2–/– mice treated with
dexamethasone, DBZ or the combination of dexamethasone plus DBZ for 5 d. Scale bars, 100 mm. (h) Schematic representation of the transcriptional
regulatory network controlling cell differentiation in the intestinal cells downstream of Notch and glucocorticoid receptor signaling.
pEP7HA-HES1
pEP7
HA-HES1
pEP7
pEP7 P < 0.001
P = 0.001
P < 0.001P < 0.001
1.5
1
0.5
0
KLF
4 re
lativ
eex
pres
sion
KLF
4 re
lativ
eex
pres
sion
HES1
Actin
shRNAHES1
shRNALUC
shRNA
HES1sh
RNA
LUC
0
1
2
3
4
5
6
HES1 1 0.13
HES1
Actin
25
20
15
10
5
0
Fol
d en
richm
ent
KLF
4 C
hIP
Inpu
tIg
GHES1
–1,000 –517 –397
ATG
KLF4TIS
KLF4 promoter
pEP7HA-HES1
pEP7
–151
–181
–495
–994
–2,006
1.41.21.00.80.60.40.20
KLF4 relativepromoter activityKLF4 promoter
constructs
pEP7
pEP7
pEP7
HA-HES1
pEP7HA-HES1
TubulinTubulin
HA-HES1ICN1-HA
pCS2ICN1-HA
pCS2
ICN1-
HA
pCS2
pCS2
1.2
0.80.60.40.2
0
1
Rel
ativ
e K
LF4
prom
oter
act
ivity
1.2
0.80.60.40.2
0
1
Rel
ativ
e K
LF4
prom
oter
act
ivity
Luciferase
–2,006
KLF4promoter
TISDMSO Dexa DBZ
Dexa +DBZ
4
3
2
1
0
Klf4
rel
ativ
e ex
pres
sion
Klf4
-pos
itive
cel
ls (
%)
Contro
lDex
aDBZ
Dexa
+
DBZCon
trolDex
aDBZ
Dexa
+
DBZ
11.4
20.6
8.68.7
25
20
15
10
5
0
a d f
g h
e
b c
Figure 5 NOTCH-HES1 signaling regulates KLF4 expression in the gut. (a,b) Immunohistochemical analysis of Klf4 expression in small intestine of mice
treated with dexamethasone, DBZ or the combination of dexamethasone plus DBZ for 5 d. Scale bars, 100 mm. (c) Real-time PCR analysis of Klf4 transcript
levels in small intestine of mice treated with dexamethasone, DBZ or the combination of dexamethasone plus DBZ for 10 d. Gapdh levels were used as a
reference control. Data are means ± s.d. of three mice per group. (d,e) Effects of ICN1 and HES1 expression in human KLF4 promoter activity. Luciferase
reporter assays were performed in AGS cells with reporter constructs encompassing 2,006–base pair (bp) (d,e), 994-bp, 495-bp and 181-bp nucleotide
sequences (e) of the KLF4 promoter. Promoter activity is shown relative to an internal control expressing Renilla luciferase. Western blot shows expression
of ICN1-HA (hemagglutinin-tagged) and HA-HES1 proteins in AGS cells transfected with ICN1 and HES1 expression plasmids compared with empty vector
controls (pCS2 and pEP7). (f) Quantitative ChIP analysis of HES1 binding to KLF4 promoter sequences. TIS, transcription initiation site. (g) Quantitative
RT-PCR analysis of KLF4 transcripts in AGS cells expressing an shRNA targeting HES1 (shRNA HES1) or a control shRNA targeting the luciferase gene
(shRNA LUC). (h) Quantitative RT-PCR analysis of KLF4 transcripts in AGS cells transfected with a HES1 expression vector (pEP7 HA-HES1) or an empty
vector control (pEP7) targeting the luciferase gene (shRNA LUC) was used as control. Error bars represent means ± s.d. of triplicate experiments. HES1
protein levels normalized to the loading control are shown at the bottom of corresponding lanes in the western blots.
ART ICL ES
NATURE MEDICINE VOLUME 15 [ NUMBER 1 [ JANUARY 2009 55
©20
09 N
atu
re A
mer
ica,
Inc.
All
rig
hts
res
erve
d.
adenocarcinoma cells (Supplementary Fig. 16 online). Notably, Hes1-knockout mice have an increased number of goblet cells in the gut40,suggesting that Hes1 can work as a transcriptional repressor control-ling Klf4 expression downstream of Notch signaling. Luciferasereporter assays confirmed this hypothesis, showing that HES1 expres-sion downregulates the activity of the KLF4 promoter (Fig. 5d,e).Furthermore, ChIP showed binding of HES1 protein to the KLF4promoter (Fig. 5f), whereas shRNA knockdown of HES1 inducedupregulation of KLF4 transcripts (Fig. 5g), and HES1 overexpressiondownregulated the expression of KLF4 transcripts (Fig. 5h). Overall,these experiments demonstrate that KLF4 is a direct transcriptionaltarget of HES1 downstream of NOTCH signaling in the gut andsupport a mechanistic role for Klf4 upregulation downstream ofNOTCH inhibition in GSI-induced gut toxicity.
Ccnd2 upregulation by dexamethasone reverses GSI gut toxicity
To elucidate the mechanism responsible for the reversal of GSI-inducedtoxicity in mice treated with glucocorticoids, we performed geneexpression profiling with oligonucleotide microarrays of the smallintestine of mice treated with vehicle (DMSO), dexamethasone, DBZor the combination of DBZ plus dexamethasone. This analysis identi-fied Ccnd2, a key regulator of cell cycle progression, among the genesupregulated by dexamethasone (Fig. 6a). Quantitative RT-PCR analysisconfirmed that Ccnd2 expression in the gut was upregulated in micetreated with dexamethasone compared to controls (P o 0.001;Fig. 6b). Notably, growth arrest and cell differentiation are temporallyand functionally linked events in the intestinal epithelium41, andexpression of Ccnd2 in AGS cells induced a marked decrease in KLF4transcript levels (Fig. 6c), suggesting that upregulation of Ccnd2expression by dexamethasone may mediate, at least in part, theprotective effects of glucocorticoids against GSI-induced goblet cellmetaplasia. To address this question, we analyzed the effects ofdexamethasone, DBZ or the combination of DBZ plus dexamethasonein Ccnd2-knockout mice42. As observed in wild-type mice, dexametha-sone treatment induced accumulation of Paneth cells at the bottom ofthe intestinal crypt in Ccnd2-knockout mice (Fig. 6d,e). However, thisincrease in cell differentiation toward the Paneth cell lineage wasassociated with decreased cell numbers and a reduction of Ki67-positive cells per crypt, which was in contrast with the moderate cellexpansion induced by glucocorticoid treatment in the intestine of wild-type mice (Fig. 6d,e). Moreover, when treated with DBZ plus dex-amethasone, Ccnd2-knockout mice developed GSI-induced goblet cellmetaplasia (Fig. 6f) associated with increased Klf4 expression in the gut(Fig. 6g). Histological analysis of the spleen showed no differencesbetween wild-type and Ccnd2-deficient mice and served as positivecontrol for the activity of DBZ and dexamethasone in this experiment(Fig. 6f). Overall, these results highlight the functional relevance ofCcnd2 upregulation induced by dexamethasone treatment for theprotection from GSI-induced toxicity in the gut (Fig. 6h, Supplemen-tary Results and Supplementary Discussion).
DISCUSSION
Despite the strong rationale for inhibiting NOTCH1 signaling in thetreatment of individuals with T-ALL harboring activating mutationsin the NOTCH1 gene, progress in clinical testing of GSIs has beenhindered by the lack of effective antileukemic cytotoxicity and thedevelopment of severe gastrointestinal toxicity5,8–11,20. On the basis ofthe hypothesis that the combination of NOTCH1 inhibition withchemotherapy might provide an improved therapeutic window, wetested the activity of a GSI with conventional antileukemic agents.These studies showed that inhibition of NOTCH1 signaling can
effectively abrogate glucocorticoid resistance in T-ALL primaryhuman samples and cell lines. Additional pharmacologic interactionsaffecting glucocorticoid resistance in T-ALL have been describedbefore. Most notably, inhibition of mammalian target of rapamycin(mTOR) signaling with rapamycin can reverse glucocorticoid resis-tance in leukemic lymphoblasts by inducing post-transcriptionaldownregulation of myeloid cell leukemia sequence-1, (ref. 43); how-ever, we did not detect changes in the protein expression of thisantiapoptotic factor in cells treated with Compound E plus dexa-methasone (data not shown). Similarly, we did not detect changes inthe differentiation arrest of T-ALL cells that could be linked todifferential glucocorticoid sensitivity or transcriptional changes inthe SRG3 gene (encoding a chromatin-remodeling factor, data notshown), two mechanisms proposed to reduce the sensitivity toglucocorticoid-induced apoptosis downstream of NOTCH1 activationin mouse primary thymocytes14,44–46.
Analysis of therapeutic efficacy in leukemia-bearing mice treatedwith a highly active GSI plus dexamethasone in vivo showed increasedantileukemic effects but also a surprising decrease in GSI-induced guttoxicity. Molecular analysis of the mechanisms mediating the gobletcell metaplasia induced by inhibition of NOTCH signaling in thegut identified KLF4, a transcription factor responsible for goblet celldifferentiation, as a potential mediator of GSI-induced intestinaltoxicity. Thus, a possible explanation to account for the protectiveeffects of dexamethasone against GSI-induced gut toxicity in vivowould be an inhibitory effect of glucocorticoids on the expression ofKlf4. However, luciferase reporter assays did not detect regulation ofKLF4 promoter activity by dexamethasone (Supplementary Fig. 17online). These negative results suggest that an indirect effect accountsfor the downregulation of Klf4 expression in mice treated with a GSIplus dexamethasone.
Detailed characterization of the effects of dexamethasone in theintestinal epithelium showed that glucocorticoids induce a moderateincrease in proliferation associated with Ccnd2 upregulation andpromote differentiation of intestinal progenitors into Paneth cells.Given that Klf4 is a negative regulator of the cell cycle, we explored thepossibility that dexamethasone-induced Ccnd2 upregulation couldantagonize the expression of Klf4 in the gut. Consistent with thishypothesis, in vitro studies in AGS cells showed that forced expressionof Ccnd2 resulted in decreased levels of KLF4 transcripts. Moreover,in vivo analysis of Ccnd2-deficient mice treated with a GSI plusdexamethasone showed accumulation of goblet cells and elevatedKlf4 expression, similar to that observed in mice treated with a GSIalone. These results suggest that dexamethasone-induced Ccnd2upregulation is strictly required for the enteroprotective effects ofglucocorticoids against GSI-induced gut toxicity.
Overall, our results support that combination therapies with GSIsplus glucocorticoids may be effective against glucocorticoid-resistantT-ALL, identify glucocorticoids as key regulators of cell fate determi-nation and tissue homeostasis in the gut and suggest that concurrenttreatment with glucocorticoids may facilitate the clinical developmentof GSIs by protecting individuals from the intestinal toxicity typicallyassociated with inhibition of NOTCH signaling in the gut.
METHODSInhibitors and drugs. Both compound E ([(2S)-2-{[(3,5-difluorophenyl)-
acetylamino}-N-[(3S)-1-methyl-2-oxo-5-phenyl-2,3-dihydro-1H-1,4-benzodia-
zepin-3-yl] propanamide; Alexis Biochemicals) and DBZ ((2S)-2-[2-(3,5-
difluorophenyl)-acetylamino]-N-(5-methyl-6-oxo-6,7-dihydro-5H-dibenzo[b,-
d]azepin-7-yl)-propionamide; SYNCOM BV) are cell-permeable, selective,
nontransition state and noncompetitive inhibitors of the g-secretase complex.
ART ICL ES
56 VOLUME 15 [ NUMBER 1 [ JANUARY 2009 NATURE MEDICINE
©20
09 N
atu
re A
mer
ica,
Inc.
All
rig
hts
res
erve
d.

We obtained Z-VAD, dexamethasone, etoposide, methotrexate, vincristine and
RU486 from Sigma-Aldrich and L-asparaginase from Roche.
Primary leukemia samples. Cryopreserved lymphoblast samples were pro-
vided by collaborating institutions in the US (Department of Pediatrics,
Columbia Presbyterian Hospital), The Netherlands (Erasmus MC-Sophia
Children’s Hospital) and Italy (Hemato-Oncology Laboratory, Department
of Pediatrics, University of Padua). All samples were collected with
informed consent and under the supervision of the Medical Ethics Committee
of the Erasmus Medical Center, the Columbia University Medical Center
Institutional Review Board and the Acute Lymphoblastic Leukemia Strategic
Scientific Commitee.
Cell viability studies and gene and protein expression analysis. We
performed cell viability assays, retroviral and lentiviral transduction,
microarray analysis, quantitative RT-PCR, luciferase reporter assays,
chromatin immunoprecipitation, western blot and immunohistochemistry
assays following standard procedures, which are detailed in the Supplementary
Methods online.
Mice and mouse procedures. We kept all mice in specific pathogen–free
animal facilities at Memorial-Sloan Kettering Cancer Center, New York Uni-
versity Medical Center and Columbia University Medical Center. We per-
formed all mouse procedures in accordance with the guidelines of the
Memorial-Sloan Kettering Cancer Center, New York University Medical Center
and Columbia University Medical Center Institutional Animal Care and Use
Committees. We performed xenograft experiments with 6–8-week-old NOD-
SCID female mice (Taconic Farms) as recipients. We carried out toxicity
experiments in 6-week-old C57/BL6 female mice (Jackson Laboratory) and
Ccnd2-knockout mice. Ccnd2-knockout mice have been previously described42.
To analyze the effects of dexamethasone in GSI-induced toxicity, we treated
mice with vehicle (DMSO), dexamethasone (15 mg kg–1), DBZ (10 mmol kg–1)
and dexamethasone (15 mg kg–1) plus DBZ (10 mmol kg–1) daily by intraper-
itoneal injection for 5 and 10 d. At the end of the treatment, we killed the mice
and collected and processed tissues and organs for histological and immuno-
histochemical analysis.
We generated mice for inducible deletion of Rbpj by breeding Rbpjflox/flox
conditional knockout mice47 to the Cre-Tam mouse line, which expresses a
tamoxifen-inducible Cre from the ubiquitous Rosa26 locus37. We treated
Rbpjflox/flox Cre-Tam mice with tamoxifen (1 mg) by oral gavage daily for 3 d
to induce Rbpj deletion. To analyze the effect of dexamethasone treatment in
the induction of goblet cell metaplasia induced by Notch inactivation via Rbpj
deletion, we injected Rbpjflox/flox Cre-Tam tamoxifen-treated mice with dex-
amethasone (15 mg kg–1) (n ¼ 3) or vehicle only (n ¼ 3) via intraperitoneal
injection for 10 d, starting on the first day of tamoxifen treatment. We
evaluated the effects of tamoxifen and dexamethasone treatment in the gut
through histological and immunohistochemical analysis.
We generated luminiscent CUTLL1 cells by infecting the CUTLL1 cell line
with FUW-luc lentiviruses followed by selecting with neomycin (1 mg ml–1);
we verified luciferase expression in vitro with the Dual-Luciferase Reporter
Assay kit (Promega). For subcutaneous xenograft experiments, we injected
2.5 � 106 T-ALL cells embedded in Matrigel (BD Biosciences) in the flank.
After 1 week, we segregated the mice into treatment groups (six mice per
group) and treated them daily with vehicle (DMSO), dexamethasone (15 mg
kg–1), DBZ (10 mmol kg–1) or dexamethasone (15 mg kg–1) plus DBZ (10 mmol
kg–1) by intraperitoneal injection. For imaging studies, we anesthetized the
mice by isoflurane inhalation and injected them with D-luciferin at 50 mg kg–1
(Xenogen) intraperitoneally. We imaged photonic emission with the In Vivo
Imaging System (IVIS, Xenogen) with a collection time of 1 min. We quantified
tumor bioluminescence by integrating the photonic flux (photons per second)
through a region encircling each tumor, as determined by the LIVING IMAGES
software package (Xenogen).
For intravenous xenograft transplantation, we irradiated recipient mice with
a total X-ray dose of 300 cGy. We injected two million CUTLL1 cells expressing
luciferase via the tail vein. After a 3-week window for tumor engraftment, we
segregated mice with homogeneous tumor burdens into treatment groups (eight
mice per group) and treated them daily with vehicle (DMSO), dexamethasone
(15 mg kg–1), DBZ (10 mmol kg–1) or dexamethasone (15 mg kg–1) plus DBZ
(10 mmol kg–1) by intraperitoneal injection for 14 d. We evaluated disease
progression and therapy response weekly with bioimaging as described above by
integrating the photonic flux (photons per second) through a region around
each mouse. We followed up on the mice for up to 10 weeks. At the end of the
observation period, we analyzed single-cell suspensions from the spleens of
surviving mice for the presence of leukemic cells by flow cytometry after staining
with FITC-labeled human antibody to CD45 (BD Biosciences).
Statistical analyses. We performed statistical analysis by Student’s t-test.
Survival in mouse experiments was represented with Kaplan-Meier curves,
and significance was estimated with the log-rank test. Values were considered
statistically significant at P o 0.05.
Accession codes. Microarray data are available at Gene Expression Omnibus
(accession numbers GSE7067 and GSE11184).
Note: Supplementary information is available on the Nature Medicine website.
ACKNOWLEDGMENTSWe thank U. Klein for help with flow cytometry analysis; T. Matos for theprocessing of histological, histochemical and imunohistochemical assays;P. Sicinski (Dana-Farber Cancer Institute) for the Ccnd2-knockout mouse;T. Honjo (Kyoto University) and B. Reitzis (Columbia University) for theRbpjflox/flox conditional knockout mouse; T. Ludwig (Columbia University) for theCre-Tam mouse line; A. Kung (Dana-Farber Cancer Institute) for the FUW-Lucneo vector; J. Aster (Brigham and Women’s Hospital) for the MigR1 and MigR1-ICN1 retroviral constructs and for the NOTCH1-TAD antibody; W. Hahn (Dana-Farber Cancer Institute) for the pLKO shRNA vector; R. Dalla Favera (ColumbiaUniversity) for the pCM8-cMYB vector; M.J. Garabedian (New York University)for the pCMV-HA-hGR vector; and N. Wu and C. Wa for pharmacokinetic anddrug metabolism analysis. This work was supported by the US National Institutesof Health (R01CA120196 and R01CA129382 to A.F. and R56AI070310,1R01CA105129 and 1R01CA133379 to I.A.); the Wipe Out Leukemia ForeverFoundation (A.F.), the Leukemia and Lymphoma Society (grants 1287-08 and6237-08 to A.F.), the Charlotte Geyer Foundation (A.F.), the Cancer ResearchInstitute (A.F.), the Swim Across America Foundation (A.F.), the Golfers AgainstCancer Foundation (A.F.), the American Cancer Society (RSG0806801 to I.A.),the Citta della Speranza Foundation, a Cassa di Risparmio di Padova e Rovigoresearch grant, a Programmi di Ricerca Scientifica di Rilevante InteresseNazionale, and the Fondo de Investigacion Sanitaria (grant CD07/00033 to P.J.R.).A.F. and I.A. are Leukemia & Lymphoma Society Scholars. T.P. is a recipient of aYoung Investigator Award from the Alex’s Lemonade Stand Foundation. I.H. issupported by the Dutch Cancer Society.
AUTHOR CONTRIBUTIONSA.F. supervised the project. P.J.R., V.T., T.P., M.L.S, K.B., C.S. and I.H. designedand performed experiments. M.C. performed histological and immuno-histochemical studies. E.H. and E.d.S. assisted in bioimaging analysis oftumor xenografts. G.B. provided clinical samples. J.M. provided clinicalsamples and supervised drug sensitivity assays in these cells. A.F. and I.A.supervised the analysis of Ccnd2–/– mice. C.C.-C. supervised histological andimmunohistochemical studies. W.A. designed and performed experimentson the regulation of Klf4 by NOTCH1 and HES1. A.F. wrote the manuscript.
Published online at http://www.nature.com/naturemedicine/
Reprints and permissions information is available online at http://npg.nature.com/
reprintsandpermissions/
1. Evin, G., Sernee, M.F. & Masters, C.L. Inhibition of g-secretase as a therapeuticintervention for Alzheimer’s disease: prospects, limitations and strategies. CNS Drugs20, 351–372 (2006).
2. Selkoe, D. & Kopan, R. Notch and presenilin: regulated intramembraneproteolysis links development and degeneration. Annu. Rev. Neurosci. 26, 565–597(2003).
3. Weng, A.P. et al. Activating mutations of NOTCH1 in human T cell acute lymphoblasticleukemia. Science 306, 269–271 (2004).
4. Roy, M., Pear, W.S. & Aster, J.C. The multifaceted role of Notch in cancer. Curr. Opin.Genet. Dev. 17, 52–59 (2007).
5. Deangelo, D. et al. A phase I clinical trial of the notch inhibitor MK-0752 in patientswith T cell acute lymphoblastic leukemia/lymphoma (T-ALL) and other leukemias.J. of Clin. Oncol. 2006 ASCO Annual Meeting Proceedings Part I. 24, 6585(2006).
ART ICL ES
NATURE MEDICINE VOLUME 15 [ NUMBER 1 [ JANUARY 2009 57
©20
09 N
atu
re A
mer
ica,
Inc.
All
rig
hts
res
erve
d.

6. Palomero, T. et al. CUTLL1, a novel human T-cell lymphoma cell line with t(7;9)rearrangement, aberrant NOTCH1 activation and high sensitivity to g-secretase inhibi-tors. Leukemia 20, 1279–1287 (2006).
7. Lewis, H.D. et al. Apoptosis in Tcell acute lymphoblastic leukemia cells after cell cyclearrest induced by pharmacological inhibition of notch signaling. Chem. Biol. 14,209–219 (2007).
8. Milano, J. et al. Modulation of Notch processing by g-secretase inhibitors causesintestinal goblet cell metaplasia and induction of genes known to specify gut secretorylineage differentiation. Toxicol. Sci. 82, 341–358 (2004).
9. van Es, J.H. et al. Notch/g-secretase inhibition turns proliferative cells in intestinalcrypts and adenomas into goblet cells. Nature 435, 959–963 (2005).
10. Wong, G.T. et al. Chronic treatment with the g-secretase inhibitor LY-411,575 inhibitsb-amyloid peptide production and alters lymphopoiesis and intestinal cell differentia-tion. J. Biol. Chem. 279, 12876–12882 (2004).
11. Searfoss, G.H. et al. Adipsin, a biomarker of gastrointestinal toxicity mediated by afunctional g-secretase inhibitor. J. Biol. Chem. 278, 46107–46116 (2003).
12. Pear, W.S. & Radtke, F. Notch signaling in lymphopoiesis. Semin. Immunol. 15, 69–79(2003).
13. Ciofani, M. & Zuniga-Pflucker, J.C. Notch promotes survival of pre-T cells at theb-selection checkpoint by regulating cellular metabolism. Nat. Immunol. 6, 881–888(2005).
14. Deftos, M.L., He, Y.W., Ojala, E.W. & Bevan, M.J. Correlating Notch signaling withthymocyte maturation. Immunity 9, 777–786 (1998).
15. Aster, J.C., Pear, W.S. & Blacklow, S.C. Notch signaling in leukemia. Annu. Rev.Pathol. 3, 587–613 (2008).
16. Palomero, T., Dominguez, M. & Ferrando, A.A. The role of the PTEN/AKT pathway inNOTCH1-induced leukemia. Cell Cycle 7, 965–970 (2008).
17. Palomero, T. & Ferrando, A. Oncogenic NOTCH1 control of MYC and PI3K: challengesand opportunities for anti-NOTCH1 therapy in T cell acute lymphoblastic leukemiasand lymphomas. Clin. Cancer Res. 14, 5314–5317 (2008).
18. Seiffert, D. et al. Presenilin-1 and -2 are molecular targets for g-secretase inhibitors.J. Biol. Chem. 275, 34086–34091 (2000).
19. Palomero, T. et al. NOTCH1 directly regulates c-MYC and activates a feed-forward-looptranscriptional network promoting leukemic cell growth. Proc. Natl. Acad. Sci. USA103, 18261–18266 (2006).
20. Palomero, T. et al. Mutational loss of PTEN induces resistance to NOTCH1 inhibition inT-cell leukemia. Nat. Med. 13, 1203–1210 (2007).
21. Eisen, L.P., Elsasser, M.S. & Harmon, J.M. Positive regulation of the glucocorticoidreceptor in human T cells sensitive to the cytolytic effects of glucocorticoids. J. Biol.Chem. 263, 12044–12048 (1988).
22. Ramdas, J., Liu, W. & Harmon, J.M. Glucocorticoid-induced cell death requiresautoinduction of glucocorticoid receptor expression in human leukemic T cells. CancerRes. 59, 1378–1385 (1999).
23. Levine, E.G., Peterson, B.A., Smith, K.A., Hurd, D.D. & Bloomfield, C.D. Glucocorti-coid receptors in chronic lymphocytic leukemia. Leuk. Res. 9, 993–999 (1985).
24. Leventhal, B.G. Glucocorticoid receptors in lymphoid tumors. Cancer Res. 41,4861–4862 (1981).
25. Pedersen, K.B. & Vedeckis, W.V. Quantification and glucocorticoid regulation ofglucocorticoid receptor transcripts in two human leukemic cell lines. Biochemistry42, 10978–10990 (2003).
26. Pedersen, K.B., Geng, C.D. & Vedeckis, W.V. Three mechanisms are involved inglucocorticoid receptor autoregulation in a human T lymphoblast cell line. Biochem-istry 43, 10851–10858 (2004).
27. Renner, K., Ausserlechner, M.J. & Kofler, R. A conceptual view on glucocorticoid-lnduced apoptosis, cell cycle arrest and glucocorticoid resistance in lymphoblasticleukemia. Curr. Mol. Med. 3, 707–717 (2003).
28. Geley, S. et al. Resistance to glucocorticoid-induced apoptosis in human T cell acutelymphoblastic leukemia CEM-C1 cells is due to insufficient glucocorticoid receptorexpression. Cancer Res. 56, 5033–5038 (1996).
29. Schmidt, S. et al. Glucocorticoid resistance in two key models of acute lymphoblasticleukemia occurs at the level of the glucocorticoid receptor. FASEB J. 20, 2600–2602(2006).
30. Breslin, M.B., Geng, C.D. & Vedeckis, W.V. Multiple promoters exist in the human GRgene, one of which is activated by glucocorticoids. Mol. Endocrinol. 15, 1381–1395(2001).
31. Geng, C.D. & Vedeckis, W.V. c-Myb and members of the c-Ets family of transcriptionfactors act as molecular switches to mediate opposite steroid regulation of thehuman glucocorticoid receptor 1A promoter. J. Biol. Chem. 280, 43264–43271(2005).
32. Nunez, B.S. & Vedeckis, W.V. Characterization of promoter 1B in the human gluco-corticoid receptor gene. Mol. Cell. Endocrinol. 189, 191–199 (2002).
33. Erlacher, M. et al. BH3-only proteins Puma and Bim are rate-limiting for g-radiation–and glucocorticoid-induced apoptosis of lymphoid cells in vivo. Blood 106,4131–4138 (2005).
34. Abrams, M.T., Robertson, N.M., Yoon, K. & Wickstrom, E. Inhibition of glucocorticoid-induced apoptosis by targeting the major splice variants of BIM mRNA withsmall interfering RNA and short hairpin RNA. J. Biol. Chem. 279, 55809–55817(2004).
35. Wang, Z., Malone, M.H., He, H., McColl, K.S. & Distelhorst, C.W. Microarray analysisuncovers the induction of the proapoptotic BH3-only protein Bim in multiple models ofglucocorticoid-induced apoptosis. J. Biol. Chem. 278, 23861–23867 (2003).
36. Puthalakath, H. et al. Bmf: a proapoptotic BH3-only protein regulated by interactionwith the myosin V actin motor complex, activated by anoikis. Science 293,1829–1832 (2001).
37. Guo, K. et al. Disruption of peripheral leptin signaling in mice results in hyperlepti-nemia without associated metabolic abnormalities. Endocrinology 148, 3987–3997(2007).
38. Katz, J.P. et al. The zinc-finger transcription factor Klf4 is required for terminaldifferentiation of goblet cells in the colon. Development 129, 2619–2628 (2002).
39. Wei, D., Kanai, M., Huang, S. & Xie, K. Emerging role of KLF4 in human gastro-intestinal cancer. Carcinogenesis 27, 23–31 (2006).
40. Jensen, J. et al. Control of endodermal endocrine development by Hes-1. Nat. Genet.24, 36–44 (2000).
41. Stappenbeck, T.S., Wong, M.H., Saam, J.R., Mysorekar, I.U. & Gordon, J.I. Notes fromsome crypt watchers: regulation of renewal in the mouse intestinal epithelium. Curr.Opin. Cell Biol. 10, 702–709 (1998).
42. Sicinski, P. et al. Cyclin D2 is an FSH-responsive gene involved in gonadal cellproliferation and oncogenesis. Nature 384, 470–474 (1996).
43. Wei, G. et al. Gene expression–based chemical genomics identifies rapamycin as amodulator of MCL1 and glucocorticoid resistance. Cancer Cell 10, 331–342 (2006).
44. Jang, J. et al. Notch1 confers thymocytes a resistance to GC-induced apoptosisthrough Deltex1 by blocking the recruitment of p300 to the SRG3 promoter. CellDeath Differ. 13, 1495–1505 (2006).
45. Choi, Y.I. et al. Notch1 confers a resistance to glucocorticoid-induced apoptosis ondeveloping thymocytes by down-regulating SRG3 expression. Proc. Natl. Acad. Sci.USA 98, 10267–10272 (2001).
46. Jeon, S.H. et al. A new mouse gene, SRG3, related to the SWI3 of Saccharomycescerevisiae, is required for apoptosis induced by glucocorticoids in a thymoma cell line.J. Exp. Med. 185, 1827–1836 (1997).
47. Han, H. et al. Inducible gene knockout of transcription factor recombination signalbinding protein-J reveals its essential role in T versus B lineage decision. Int. Immunol.14, 637–645 (2002).
ART ICL ES
58 VOLUME 15 [ NUMBER 1 [ JANUARY 2009 NATURE MEDICINE
©20
09 N
atu
re A
mer
ica,
Inc.
All
rig
hts
res
erve
d.