ΑΠΟ… “ΠΛΗΘΩΡΙΣΜΟ” ΣΤΗΝ ΚΡΙΣΗ file41 41 48 51 45 57 72 79 3Q 2006 1Q 2007...
23
ΓΕΝΙΚΗ ΣΥΝΕΛΕΥΣΗ / ΗΜΕΡΙΔΑ ΕΣΒΕΠ Τετάρτη 27 Μαρτίου 2013 ΑΠΟ… “ΠΛΗΘΩΡΙΣΜΟ” ΣΤΗΝ ΚΡΙΣΗ ΟΙ ΕΞΕΛΙΞΕΙΣ ΣΤΟ ΛΙΑΝΕΜΠΟΡΙΟ ΤΡΟΦΙΜΩΝ ΤΑ ΤΕΛΕΥΤΑΙΑ ΧΡΟΝΙΑ
Transcript of ΑΠΟ… “ΠΛΗΘΩΡΙΣΜΟ” ΣΤΗΝ ΚΡΙΣΗ file41 41 48 51 45 57 72 79 3Q 2006 1Q 2007...

ΓΕΝΙΚΗ ΣΥΝΕΛΕΥΣΗ / ΗΜΕΡΙΔΑ ΕΣΒΕΠ
Τετάρτη 27 Μαρτίου 2013
ΑΠΟ… “ΠΛΗΘΩΡΙΣΜΟ” ΣΤΗΝ ΚΡΙΣΗΟΙ ΕΞΕΛΙΞΕΙΣ ΣΤΟ ΛΙΑΝΕΜΠΟΡΙΟ ΤΡΟΦΙΜΩΝ ΤΑ ΤΕΛΕΥΤΑΙΑ ΧΡΟΝΙΑ
Co
py
rig
ht
©2
01
2 T
he
Nie
lse
n C
om
pa
ny
. C
on
fid
en
tia
l a
nd
pro
pri
eta
ry.
2
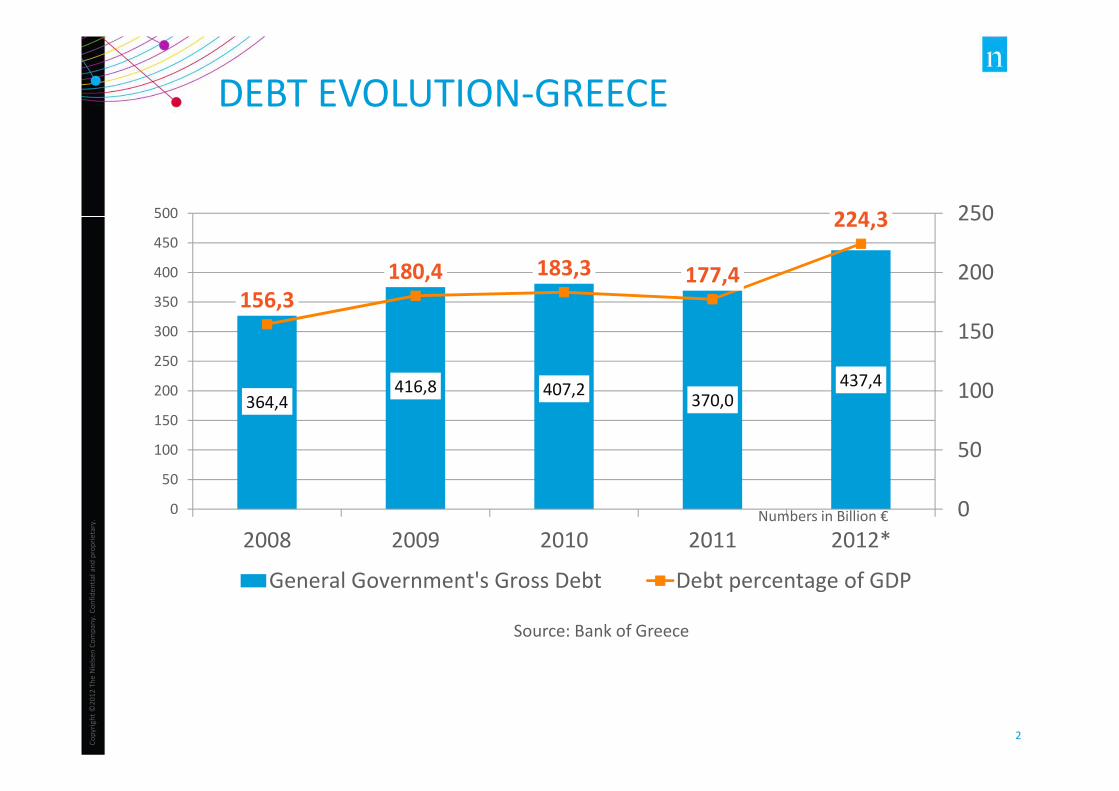
364,4416,8 407,2
370,0437,4
156,3
180,4 183,3 177,4
224,3
0
50
100
150
200
250
0
50
100
150
200
250
300
350
400
450
500
2008 2009 2010 2011 2012*
General Government's Gross Debt Debt percentage of GDP
DEBT EVOLUTION-GREECE
Numbers in Billion €
Source: Bank of Greece

Co
py
rig
ht
©2
01
2 T
he
Nie
lse
n C
om
pa
ny
. C
on
fid
en
tia
l a
nd
pro
pri
eta
ry.
3
0,2%0,5%0,0%
-1,3%
-4,4% -4,4%
-3,5%
-0,8%
0,4%
-0,7%
-4,6%
-8,6%-8,0%
-7,3%
-5,0%
-7,5%
-6,7%-6,4%
-6,7%-6,0%
Source: El.Stat.
G.D.P EVOLUTION (CONSTANT PRICES 2005)

Co
py
rig
ht
©2
01
2 T
he
Nie
lse
n C
om
pa
ny
. C
on
fid
en
tia
l a
nd
pro
pri
eta
ry.
4
21,4 20,2 20,3 20,8
28,231,0
28,6 26,2
3,74,9 6,4
4,32,0
3,1 3,74,6
0
10
20
30
40
50
60
2009 2010 2011 2012*
DIRECT TAXES INDIRECT TAXES NON - TAX REVENUES REVENUES OF THE PUBLIC INVEST. BUDGET
Numbers in Billion €
Source: Ministry of Finance, State General Accounting
Office.
-5,2%
GOVERNMENT REVENUES EVOLUTIONThe Direct Taxes represent the 37,1% (‘12) while the Indirect Taxes
represent the 46,8%. It is being projected that the Revenues from the
Direct Taxes would be reduced by 7,4% in ‘13 compared to ‘09 while the
Indirect Taxes would be reduced by 13,4.

Co
py
rig
ht
©2
01
2 T
he
Nie
lse
n C
om
pa
ny
. C
on
fid
en
tia
l a
nd
pro
pri
eta
ry.
5
161,9 160,1 156,1148,6
114,7106,6
0,0
20,0
40,0
60,0
80,0
100,0
120,0
140,0
160,0
180,0
2008 2009 2010 2011 9M 2011 9M 2012
Consumption
Numbers in Billion €
CONSUMPTIONHOUSEHOLDS & NON PROFIT ORGANIZATIONS
Source: El.Stat.
-4,8%
-7,0%
Co
py
rig
ht
©2
01
2 T
he
Nie
lse
n C
om
pa
ny
. C
on
fid
en
tia
l a
nd
pro
pri
eta
ry.
6
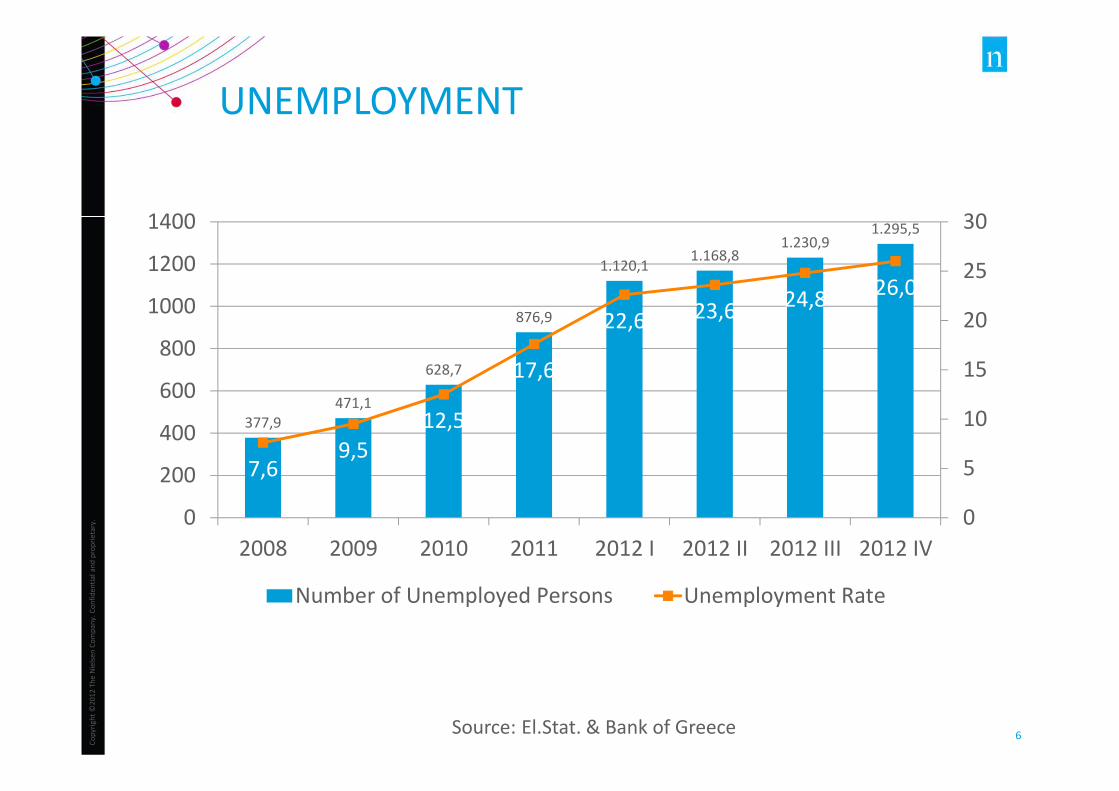
377,9
471,1
628,7
876,9
1.120,11.168,8
1.230,91.295,5
7,69,5
12,5
17,6
22,6 23,624,8
26,0
0
5
10
15
20
25
30
0
200
400
600
800
1000
1200
1400
2008 2009 2010 2011 2012 I 2012 II 2012 III 2012 IV
Number of Unemployed Persons Unemployment Rate
UNEMPLOYMENT
Source: El.Stat. & Bank of Greece

Co
py
rig
ht
©2
01
2 T
he
Nie
lse
n C
om
pa
ny
. C
on
fid
en
tia
l a
nd
pro
pri
eta
ry.
7
227,2
237,3
209,5
174,1 168,8
164,3
165,2165,8
157,3
150,5
153,8
153,3154,2 155,1
0
50
100
150
200
250
2008 2009 2010 2011 JAN '12 FEB '12 MAR '12 APR '12 MAY '12 JUN '12 JUL '12 AUG '12 SEP '12 OCT '12
DEPOSITS BY DOMESTIC ENTERPRISES AND HOUSEHOLDS
Numbers in Billion €
Source: Bank of Greece
DEPOSITS IN GREEK BANKING SYSTEMBY DOMESTIC ENTERPRISES & HOUSEHOLDS
In 2012 the Money Deposits of Households and Enterprises were reduced by
7,3% (Dec ‘12: 161,5 Bil. €) If we make the comparison of the Deposits in
September 09 with the deposits in December ‘12 we will find out that they were
reduced by 33% (77,8 Bil. €)
Co
py
rig
ht
©2
01
2 T
he
Nie
lse
n C
om
pa
ny
. C
on
fid
en
tia
l a
nd
pro
pri
eta
ry.
8
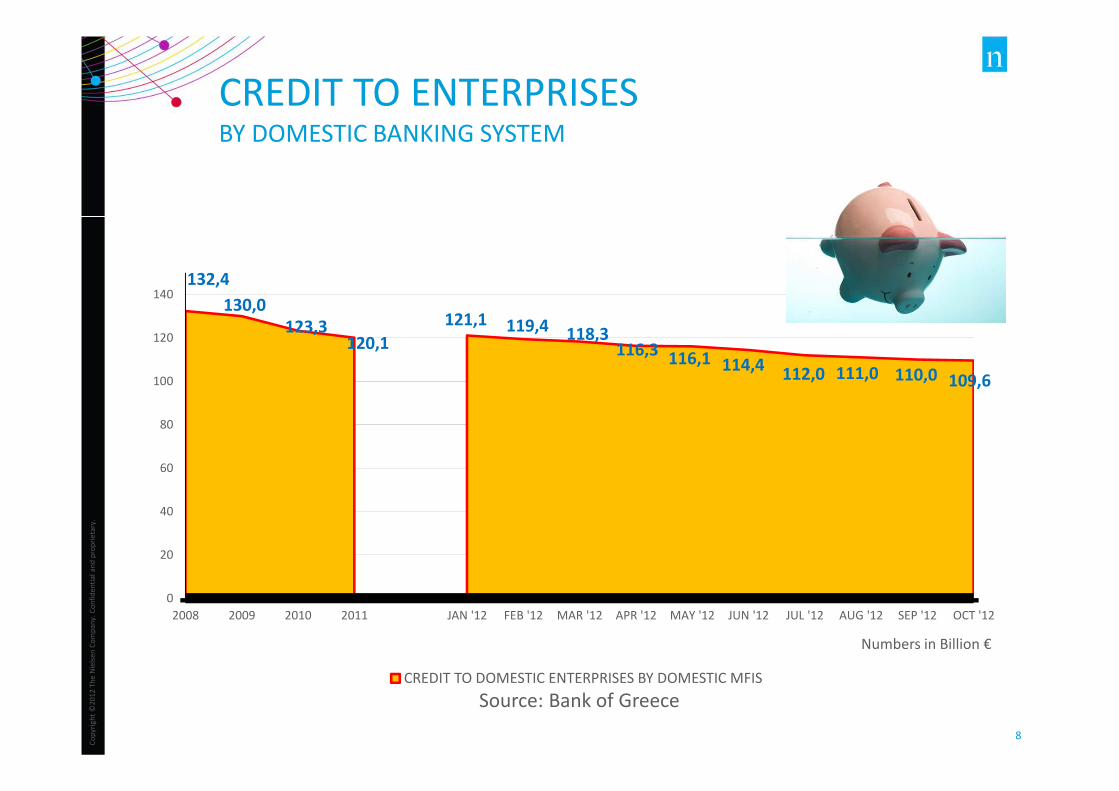
132,4
130,0
123,3120,1
121,1 119,4 118,3116,3
116,1 114,4112,0 111,0 110,0 109,6
0
20
40
60
80
100
120
140
2008 2009 2010 2011 JAN '12 FEB '12 MAR '12 APR '12 MAY '12 JUN '12 JUL '12 AUG '12 SEP '12 OCT '12
CREDIT TO DOMESTIC ENTERPRISES BY DOMESTIC MFIS
Numbers in Billion €
CREDIT TO ENTERPRISES BY DOMESTIC BANKING SYSTEM
Source: Bank of Greece
CONSUMER CONFIDENCE
Co
py
rig
ht
©2
01
2 T
he
Nie
lse
n C
om
pa
ny
. C
on
fid
en
tia
l a
nd
pro
pri
eta
ry.
10
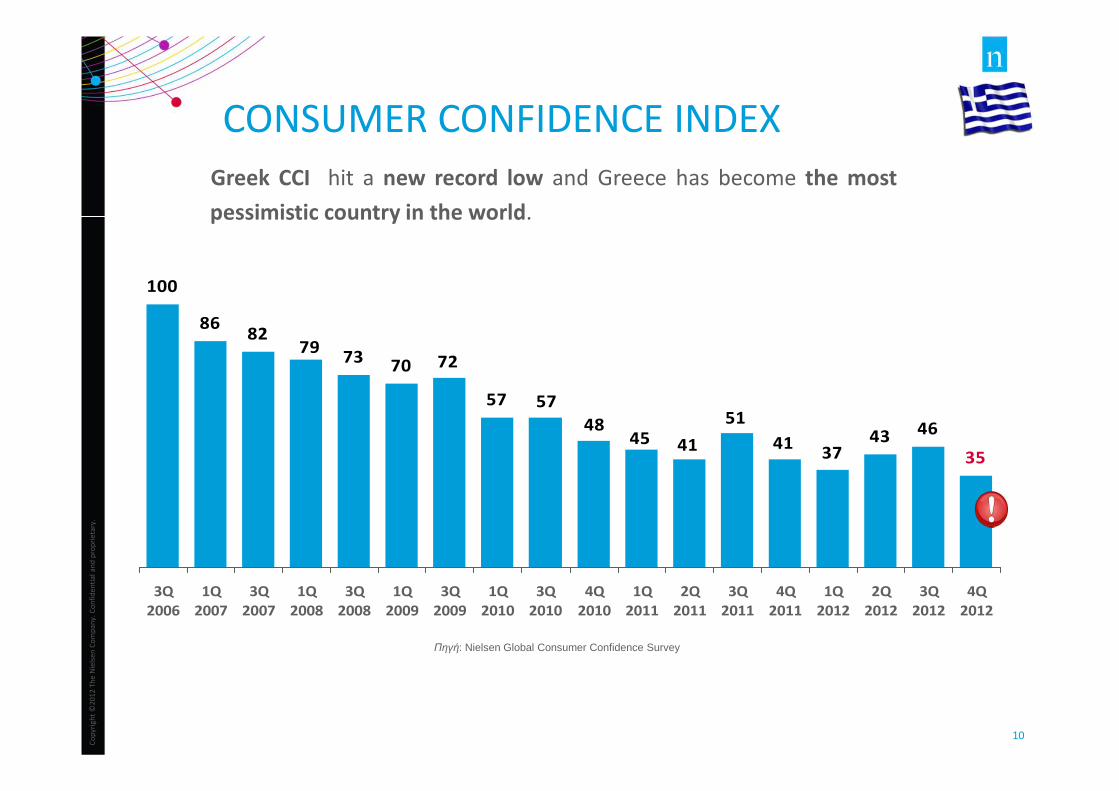
Πηγή: Nielsen Global Consumer Confidence Survey
100
8682
7370
57
43 46
35374141
514845
57
7279
3Q
2006
1Q
2007
3Q
2007
1Q
2008
3Q
2008
1Q
2009
3Q
2009
1Q
2010
3Q
2010
4Q
2010
1Q
2011
2Q
2011
3Q
2011
4Q
2011
1Q
2012
2Q
2012
3Q
2012
4Q
2012
CONSUMER CONFIDENCE INDEX
Greek CCI hit a new record low and Greece has become the most
pessimistic country in the world.
Co
py
rig
ht
©2
01
2 T
he
Nie
lse
n C
om
pa
ny
. C
on
fid
en
tia
l a
nd
pro
pri
eta
ry.
11
Source: Q4 , 2012 Nielsen Global Consumer Confidence Survey
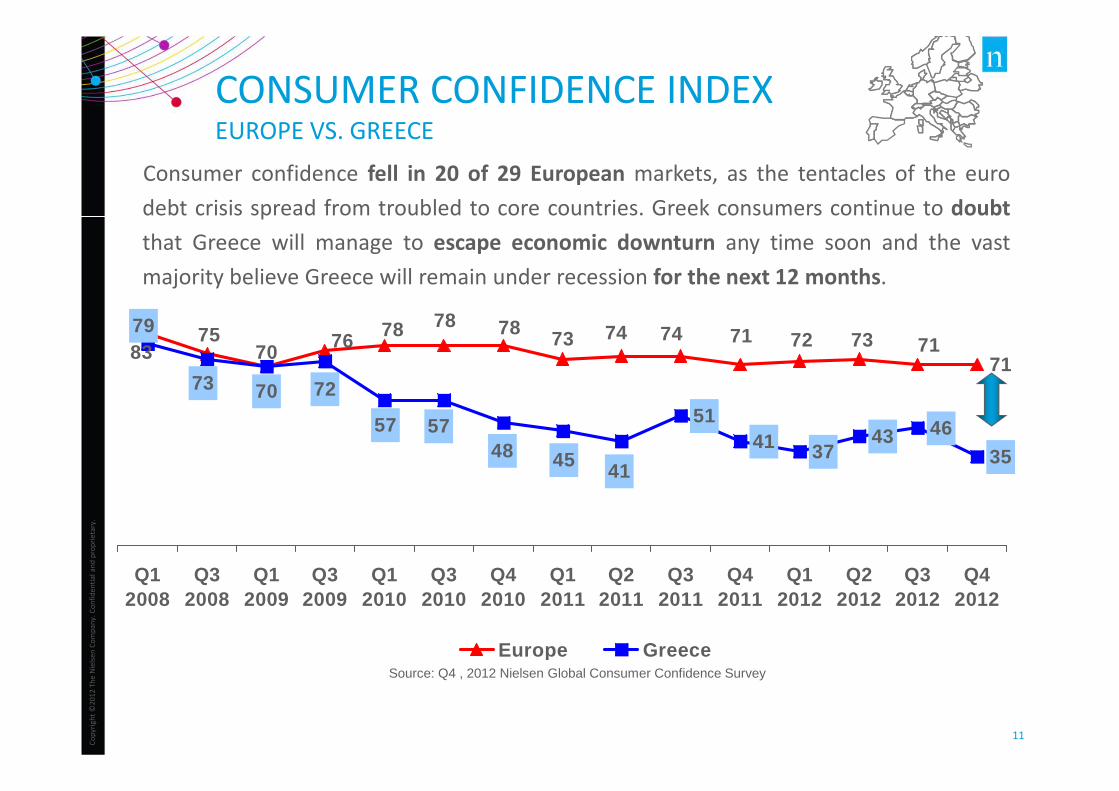
71
5141 37
43 4635
717372717474737570 7683
78 78 78
41
79
73 70 72
57 5748 45
Q12008
Q32008
Q12009
Q32009
Q12010
Q32010
Q42010
Q12011
Q22011
Q32011
Q42011
Q12012
Q22012
Q32012
Q42012
Europe Greece
CONSUMER CONFIDENCE INDEX EUROPE VS. GREECE
Consumer confidence fell in 20 of 29 European markets, as the tentacles of the euro
debt crisis spread from troubled to core countries. Greek consumers continue to doubt
that Greece will manage to escape economic downturn any time soon and the vast
majority believe Greece will remain under recession for the next 12 months.

Co
py
rig
ht
©2
01
2 T
he
Nie
lse
n C
om
pa
ny
. C
on
fid
en
tia
l a
nd
pro
pri
eta
ry.
12
27
21
17
5
6
4
6
5
2
3
1
1
17
17
9
16
6
7
4
2
4
2
4
3
7
4
5
5
6
10
21
12
11
26
38
44Job security
The economy
Debt
Increasing utility bills (electricity, gas, heating)
Health
Crime
Childrens' education and/or welfare
War
Political stability
Work/life balance
Increasing food prices
Parents' welfare and happiness
Biggest concern
Second biggest concern
MAJOR CONCERNS OVER THE NEXT 6
MONTHS
Base: All Greek respondents, n=502%
What is your biggest concern over the next six months? Your second biggest concern?
Concern for job security remained top worry
among Greek consumers, scoring one of the
highest percentages across globe.

Co
py
rig
ht
©2
01
2 T
he
Nie
lse
n C
om
pa
ny
. C
on
fid
en
tia
l a
nd
pro
pri
eta
ry.
13
UTILIZATION OF SPARE CASH
31%
22%
14%
10%
9%
9%
7%
3%
2%
41%
34%
20%
20%
13%
15%
16%
9%
4%
5%
34%
34%
25%
25%
16%
28%
21%
13%
5%
5%
25%
Paying off debts/credit cards/loans
Putting into savings
Out-of-home entertainment
New technology products
Holidays / Vacations
New clothes
Home improvements/decorating
Retirement fund
Investing in shares of stock/mutual funds
I have no spare cash
4Q 2012
Q4 2011
4Q 2010
Source: Nielsen Global
Consumer Confidence Survey
%
Once you have covered your essential living expenses, which of the following statements
best describes what you do with your spare cash?
4 out of 10 Greeks (41%) state they
have no spare cash; the highest
percentage ever. Faced with this
heightened lack of confidence,
almost all Greek consumers (92%)
have changed their shopping habits
and have become more cautious
with their spending.
Co
py
rig
ht
©2
01
2 T
he
Nie
lse
n C
om
pa
ny
. C
on
fid
en
tia
l a
nd
pro
pri
eta
ry.
14
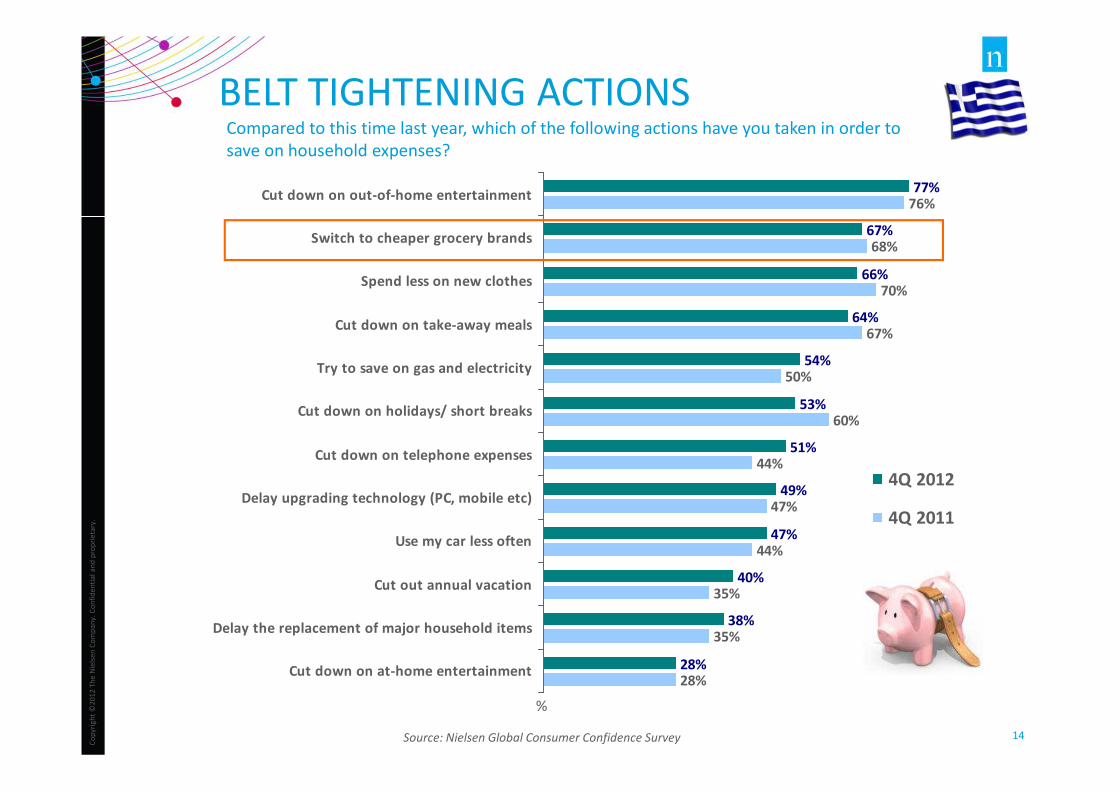
BELT TIGHTENING ACTIONS
77%
67%
66%
64%
54%
53%
51%
49%
47%
40%
38%
28%
76%
68%
70%
67%
50%
60%
44%
47%
44%
35%
35%
28%
Cut down on out-of-home entertainment
Switch to cheaper grocery brands
Spend less on new clothes
Cut down on take-away meals
Try to save on gas and electricity
Cut down on holidays/ short breaks
Cut down on telephone expenses
Delay upgrading technology (PC, mobile etc)
Use my car less often
Cut out annual vacation
Delay the replacement of major household items
Cut down on at-home entertainment
4Q 2012
4Q 2011
Source: Nielsen Global Consumer Confidence Survey
%
Compared to this time last year, which of the following actions have you taken in order to
save on household expenses?
Co
py
rig
ht
©2
01
2 T
he
Nie
lse
n C
om
pa
ny
. C
on
fid
en
tia
l a
nd
pro
pri
eta
ry.
15
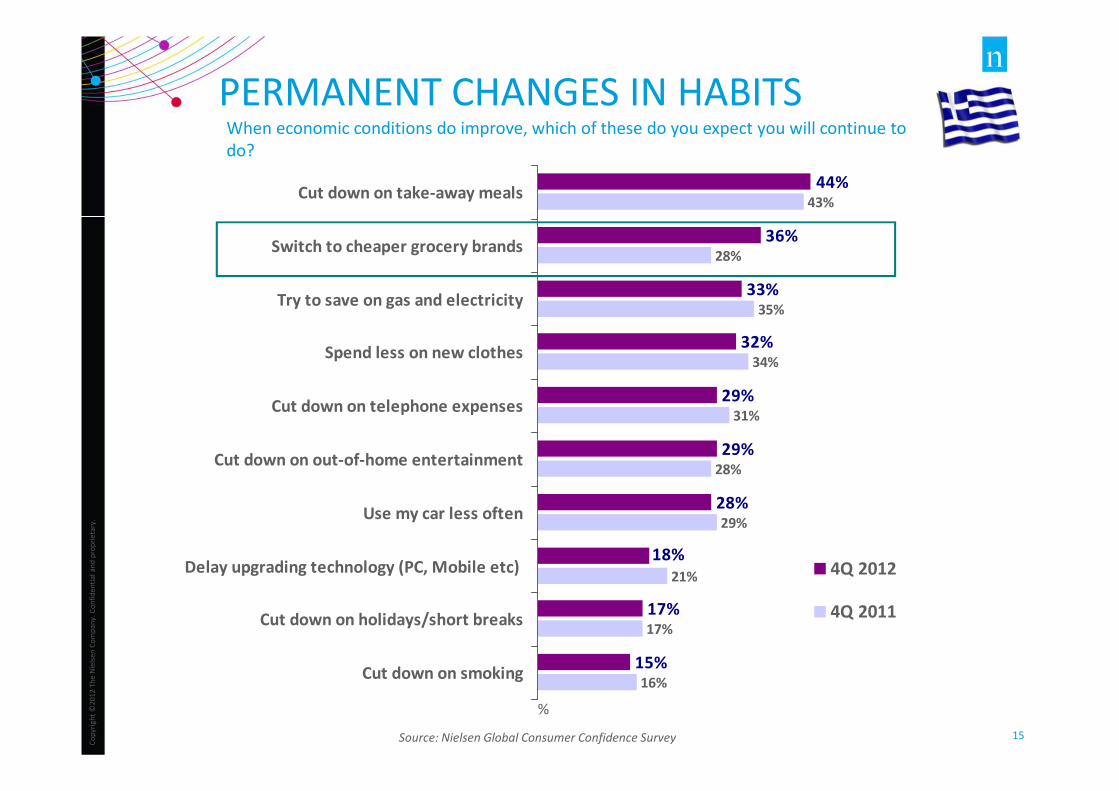
PERMANENT CHANGES IN HABITSWhen economic conditions do improve, which of these do you expect you will continue to
do?
36%
33%
32%
29%
29%
28%
17%
15%
43%
28%
35%
34%
31%
28%
29%
21%
17%
16%
44%
18%
Cut down on take-away meals
Switch to cheaper grocery brands
Try to save on gas and electricity
Spend less on new clothes
Cut down on telephone expenses
Cut down on out-of-home entertainment
Use my car less often
Delay upgrading technology (PC, Mobile etc)
Cut down on holidays/short breaks
Cut down on smoking
4Q 2012
4Q 2011
Source: Nielsen Global Consumer Confidence Survey
%

RETAIL MARKET & GROWTH REPORTER
ANALYSIS
Co
py
rig
ht
©2
01
2 T
he
Nie
lse
n C
om
pa
ny
. C
on
fid
en
tia
l a
nd
pro
pri
eta
ry.
17
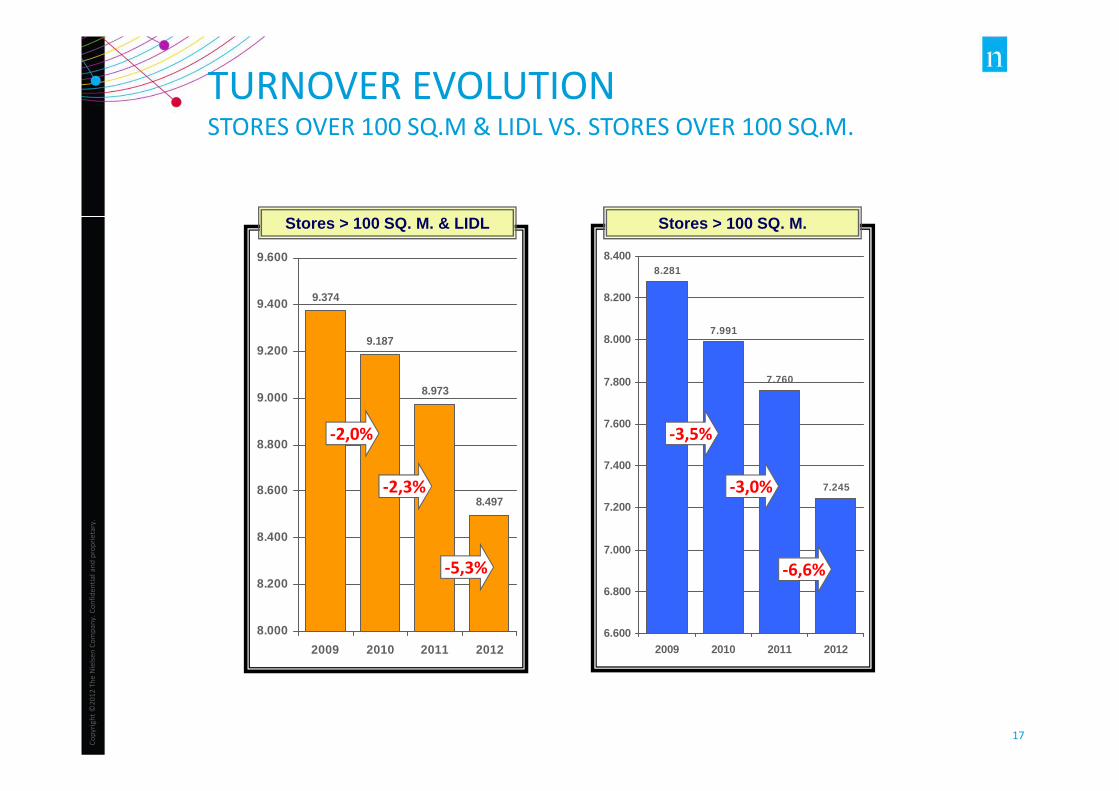
8.281
7.991
7.760
7.245
6.600
6.800
7.000
7.200
7.400
7.600
7.800
8.000
8.200
8.400
2009 2010 2011 2012
TURNOVER EVOLUTIONSTORES OVER 100 SQ.M & LIDL VS. STORES OVER 100 SQ.M.
9.374
9.187
8.973
8.497
8.000
8.200
8.400
8.600
8.800
9.000
9.200
9.400
9.600
2009 2010 2011 2012
-2,3%
-5,3%
-3,0%
-6,6%
Stores > 100 SQ. M. & LIDL Stores > 100 SQ. M.
-2,0% -3,5%
Co
py
rig
ht
©2
01
2 T
he
Nie
lse
n C
om
pa
ny
. C
on
fid
en
tia
l a
nd
pro
pri
eta
ry.
18
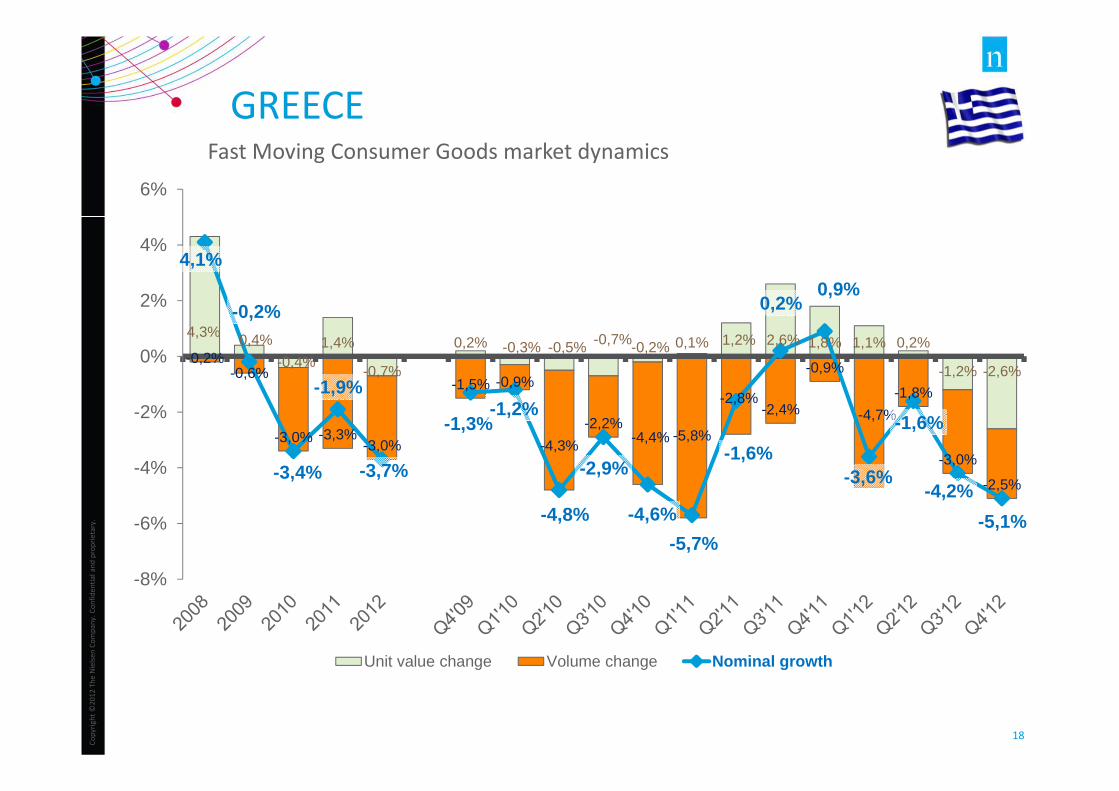
GREECEFast Moving Consumer Goods market dynamics
4,3% 0,4%
-0,4%1,4%
-0,7%
0,2% -0,3% -0,5% -0,7%-0,2% 0,1% 1,2% 2,6% 1,8% 1,1% 0,2%
-1,2% -2,6%-0,2%
-0,6%
-3,0% -3,3%-3,0%
-1,5% -0,9%
-4,3%
-2,2%-4,4% -5,8%
-2,8%-2,4%
-0,9%
-4,7%
-1,8%
-3,0%
-2,5%
4,1%
-0,2%
-3,4%
-1,9%
-3,7%
-1,3%-1,2%
-4,8%
-2,9%
-4,6%
-5,7%
-1,6%
0,2%0,9%
-3,6%
-1,6%
-4,2%
-5,1%
-8%
-6%
-4%
-2%
0%
2%
4%
6%
Unit value change Volume change Nominal growth
Co
py
rig
ht
©2
01
2 T
he
Nie
lse
n C
om
pa
ny
. C
on
fid
en
tia
l a
nd
pro
pri
eta
ry.
19
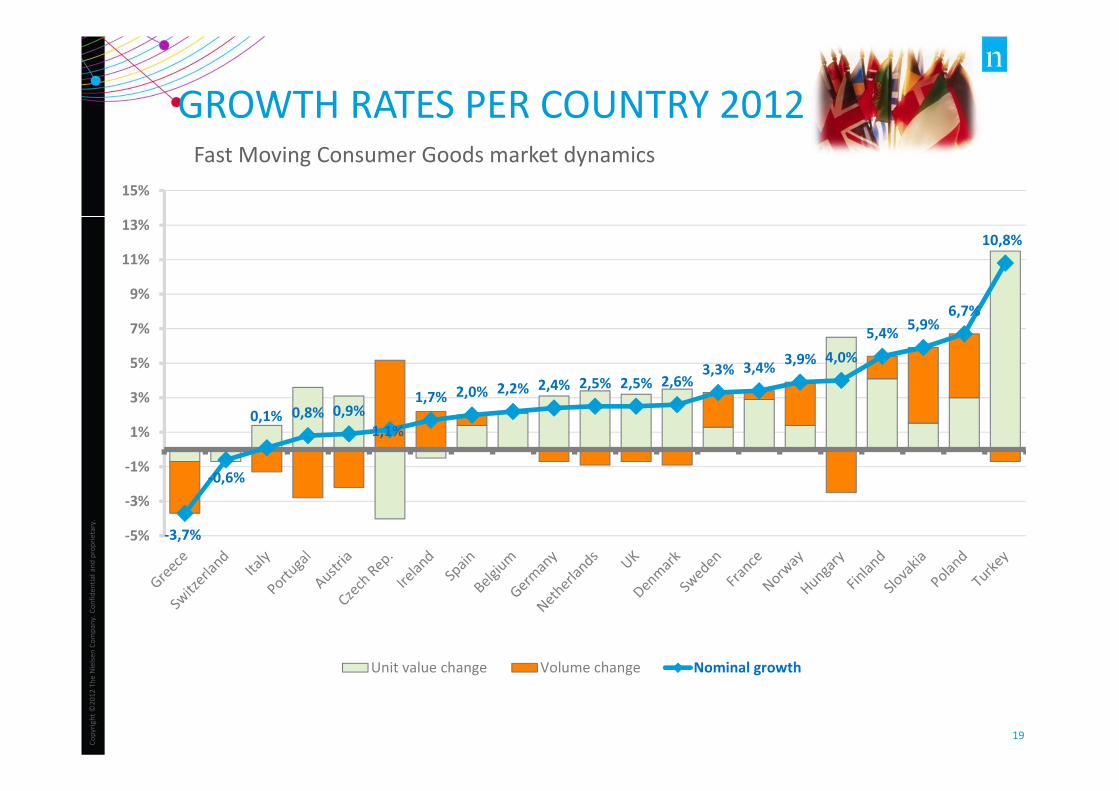
GROWTH RATES PER COUNTRY 2012Fast Moving Consumer Goods market dynamics
-3,7%
-0,6%
0,1% 0,8% 0,9%
1,1%
1,7% 2,0% 2,2% 2,4% 2,5% 2,5% 2,6%3,3% 3,4%
3,9% 4,0%
5,4%5,9%
6,7%
10,8%
-5%
-3%
-1%
1%
3%
5%
7%
9%
11%
13%
15%
Unit value change Volume change Nominal growth
Co
py
rig
ht
©2
01
2 T
he
Nie
lse
n C
om
pa
ny
. C
on
fid
en
tia
l a
nd
pro
pri
eta
ry.
20
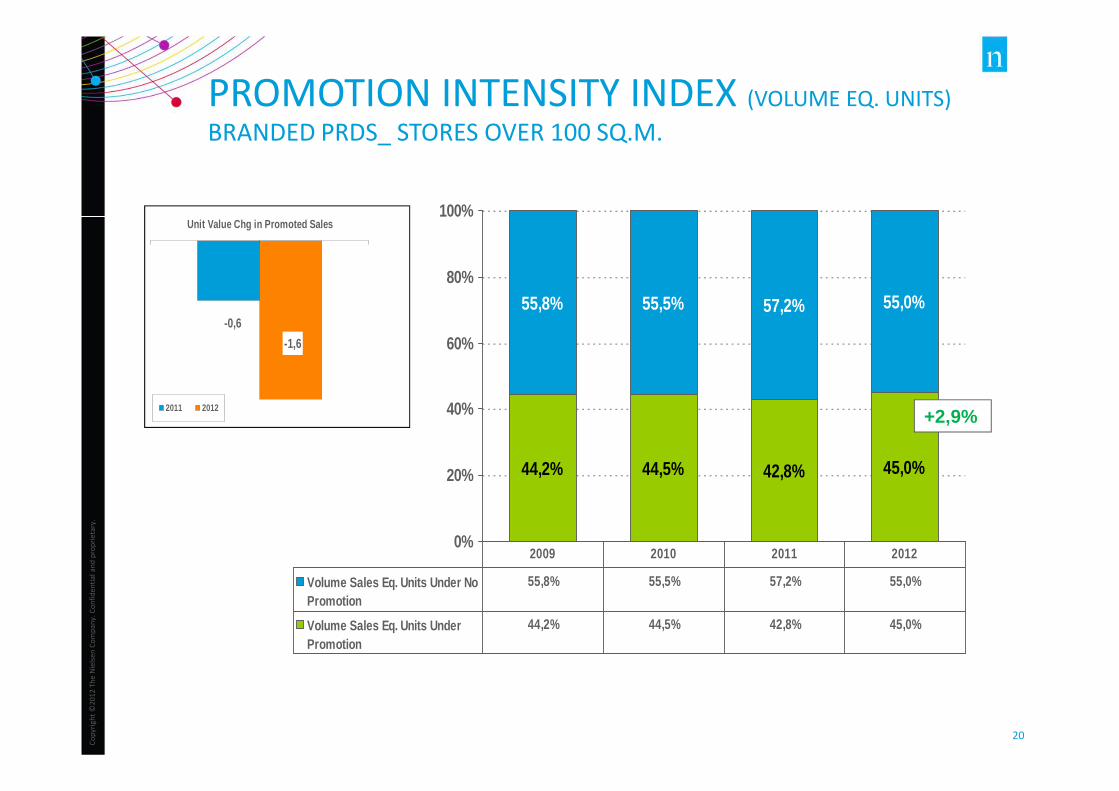
PROMOTION INTENSITY INDEX (VOLUME EQ. UNITS)
BRANDED PRDS_ STORES OVER 100 SQ.M.
44,2% 44,5% 42,8% 45,0%
55,8% 55,5% 57,2% 55,0%
0%
20%
40%
60%
80%
100%
Volume Sales Eq. Units Under NoPromotion
55,8% 55,5% 57,2% 55,0%
Volume Sales Eq. Units UnderPromotion
44,2% 44,5% 42,8% 45,0%
2009 2010 2011 2012
+2,9%
-0,6
-1,6
Unit Value Chg in Promoted Sales
2011 2012
Co
py
rig
ht
©2
01
2 T
he
Nie
lse
n C
om
pa
ny
. C
on
fid
en
tia
l a
nd
pro
pri
eta
ry.
21
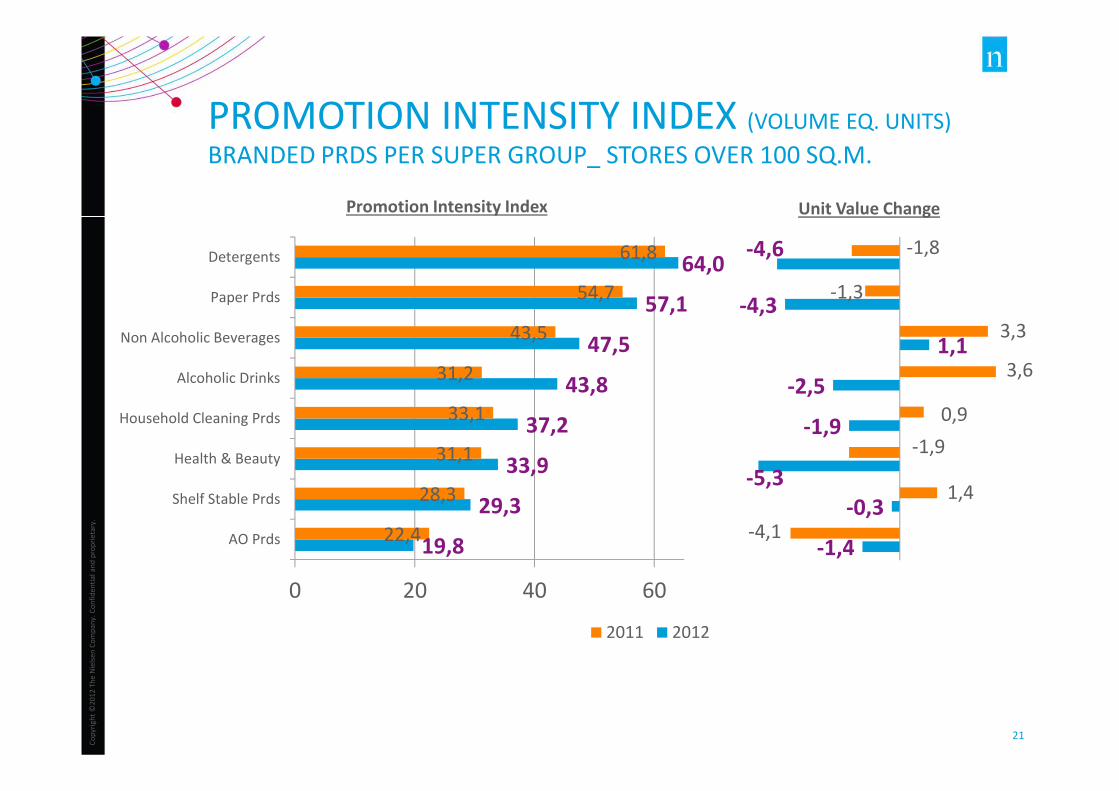
19,8
29,3
33,9
37,2
43,8
47,5
57,1
64,0
22,4
28,3
31,1
33,1
31,2
43,5
54,7
61,8
0 20 40 60
AO Prds
Shelf Stable Prds
Health & Beauty
Household Cleaning Prds
Alcoholic Drinks
Non Alcoholic Beverages
Paper Prds
Detergents
2011 2012
-1,4
-0,3
-5,3
-1,9
-2,5
1,1
-4,3
-4,6
-4,1
1,4
-1,9
0,9
3,6
3,3
-1,3
-1,8
PROMOTION INTENSITY INDEX (VOLUME EQ. UNITS)
BRANDED PRDS PER SUPER GROUP_ STORES OVER 100 SQ.M.
Unit Value ChangePromotion Intensity Index
Co
py
rig
ht
©2
01
2 T
he
Nie
lse
n C
om
pa
ny
. C
on
fid
en
tia
l a
nd
pro
pri
eta
ry.
22
-4%
-3%
-2%
-1%
0%
1%
2%
3%
4%
5%
6%
PL 5,4% 4,1% 4,4% 2,3% 1,5% 0,9% 2,3% 3,4% 4,7% 5,9% 6,1% 5,8% 5,8% 5,0% 4,0% 1,8%
BRANDED 1,2% -0,1% 0,4% 0,0% -0,8% 0,3% 0,0% 0,1% 0,3% 0,4% 2,3% 1,8% 0,8% -0,4% -2,0% -3,4%
Q1 '09
Q2 '09
Q3 '09
Q4 '09
Q1 '10
Q2 '10
Q3 '10
Q4 '10
Q1 '11
Q2 '11
Q3 '11
Q4 '11
Q1 '12
Q2 '12
Q3 '12
Q4 '12
Source: El.Stat. & ScanTrack, Nielsen
UNIT VALUE CHANGE: BRANDED VS PL
Per Quarter Q1 2009 – Q4 2012
THANK YOU!
For more information please contact:
Alexandros Floros
Retailer Services Manager
Nielsen Greece, Bulgaria, Cyprus
� +210 9500516