
γλώσσες
Σελίδες
Νομικός

Transl Clin PharmacolTCP
173Vol. 25, No.4, Dec 15, 2017
http://dx.doi.org/10.12793/tcp.2017.25.4.173
2017;25(4):173-178
OR
IGIN
AL A
RTICLE
Introduction Diazepam is a benzodiazepine agent potentiating the inhibitory effect of γ-aminobutyric acid (GABA) by enhancing the mem-brane permeability of chloride ions. It is commonly used as ad-junctive therapy for various psychiatric disorders such as anxiety, alcohol withdrawal, skeletal muscle cramps, and seizures. The unbound fraction of diazepam in plasma is approximately 2% with the blood-to-plasma concentration ratio of approximately 0.58.[1] Diazepam is metabolized to temazepam and nordiaze-pam, which are ultimately converted to oxazepam by CYP3A
and CYP2C19 isoforms. Oxazepam and temazepam are further metabolized to glucuronide conjugates.[2] Previous studies have proposed several analytical methods us-ing high-performance liquid chromatography (HPLC) with an ultraviolet (UV) [3,4] or mass spectrometry (MS) [5-9] detection to determine the concentrations of diazepam administered by various routes including nasal spray, rectal gel, intramuscular in-jection, and oral formulations.[10-15] However, these previously developed analytical methods have been associated with several limitations including inadequate sample preparation due to dif-ficulty in removing impurities,[5] inadequate sensitivity (a lower limit of quantitation [LLOQ] up to 50 ng/mL),[6] labor-inten-sive sample preparation process,[7] the need for a relatively large volume of plasma (≥ 100 μL) for analysis,[8] and long retention times (≥ 8 min).[9] Therefore, a new bioanalytical method to quantitate diazepam has been needed to improve those limita-tions.
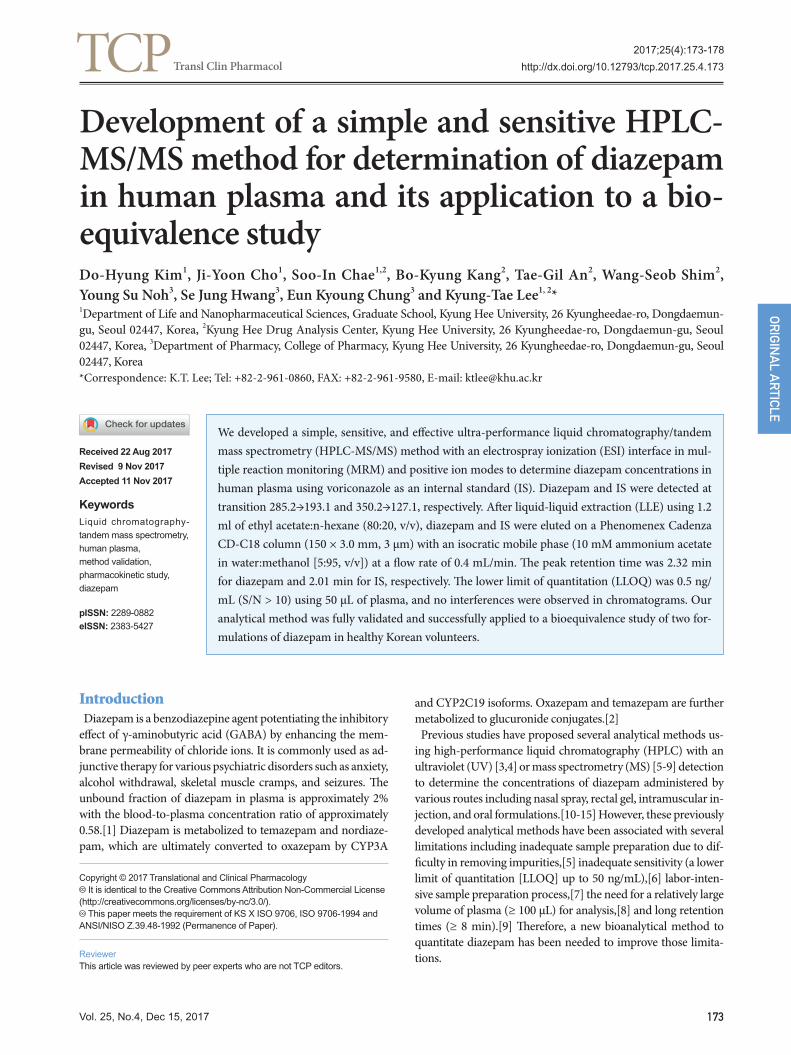
We developed a simple, sensitive, and effective ultra-performance liquid chromatography/tandem mass spectrometry (HPLC-MS/MS) method with an electrospray ionization (ESI) interface in mul-tiple reaction monitoring (MRM) and positive ion modes to determine diazepam concentrations in human plasma using voriconazole as an internal standard (IS). Diazepam and IS were detected at transition 285.2→193.1 and 350.2→127.1, respectively. After liquid-liquid extraction (LLE) using 1.2 ml of ethyl acetate:n-hexane (80:20, v/v), diazepam and IS were eluted on a Phenomenex Cadenza CD-C18 column (150 × 3.0 mm, 3 µm) with an isocratic mobile phase (10 mM ammonium acetate in water:methanol [5:95, v/v]) at a flow rate of 0.4 mL/min. The peak retention time was 2.32 min for diazepam and 2.01 min for IS, respectively. The lower limit of quantitation (LLOQ) was 0.5 ng/mL (S/N > 10) using 50 µL of plasma, and no interferences were observed in chromatograms. Our analytical method was fully validated and successfully applied to a bioequivalence study of two for-mulations of diazepam in healthy Korean volunteers.
Received 22 Aug 2017
Revised 9 Nov 2017
Accepted 11 Nov 2017
KeywordsLiquid chromatography-
tandem mass spectrometry,
human plasma,
method validation,
pharmacokinetic study,
diazepam
pISSN: 2289-0882
eISSN: 2383-5427
Development of a simple and sensitive HPLC-MS/MS method for determination of diazepam in human plasma and its application to a bio-equivalence study
Copyright © 2017 Translational and Clinical Pharmacology It is identical to the Creative Commons Attribution Non-Commercial License
(http://creativecommons.org/licenses/by-nc/3.0/). This paper meets the requirement of KS X ISO 9706, ISO 9706-1994 and
ANSI/NISO Z.39.48-1992 (Permanence of Paper).
ReviewerThis article was reviewed by peer experts who are not TCP editors.
Do-Hyung Kim1, Ji-Yoon Cho1, Soo-In Chae1,2, Bo-Kyung Kang2, Tae-Gil An2, Wang-Seob Shim2, Young Su Noh3, Se Jung Hwang3, Eun Kyoung Chung3 and Kyung-Tae Lee1, 2*1Department of Life and Nanopharmaceutical Sciences, Graduate School, Kyung Hee University, 26 Kyungheedae-ro, Dongdaemun-gu, Seoul 02447, Korea, 2Kyung Hee Drug Analysis Center, Kyung Hee University, 26 Kyungheedae-ro, Dongdaemun-gu, Seoul 02447, Korea, 3Department of Pharmacy, College of Pharmacy, Kyung Hee University, 26 Kyungheedae-ro, Dongdaemun-gu, Seoul 02447, Korea*Correspondence: K.T. Lee; Tel: +82-2-961-0860, FAX: +82-2-961-9580, E-mail: [email protected]
Vol. 25, No.4, Dec 15, 2017174
TCP Transl Clin Pharmacol
The objective of this study was to develop and validate a rapid, selective, and sensitive HPLC-MS/MS method for the analysis of diazepam in human plasma. The applicability of the diazepam bioanalytical method developed in this study was evaluated in a bioequivalence study where more than 1300 human plasma samples were collected from 40 healthy Korean male volunteers receiving two different formulations of a diazepam 2-mg tablet as a single dose.
Methods
Chemicals and Reagents Diazepam (99.8% purity) was supplied by the Ministry of Food and Drug Safety (MFDS) (Cheongju, Korea). Voriconazole (99.6% purity) was purchased from Sigma Aldrich (Saint Louis, MO, USA). Figure 1 shows the molecular structures of diazepam and voriconazole, respectively. Ethyl acetate, methanol, and n-hexane were obtained from J.T. Baker (Philipsburg, NJ, USA). Water was purified by using a Milli-Q® water purification system (Millipore Co., Milford, MA, USA).
Hplc-ms/ms conditions of diazepam analysis Chromatographic separation was performed using Shimadzu Nexera X2 (Shimadzu, Japan) equipped with an autosampler, a column heater, and a binary pump. Utilizing the Cadenza CD-C18 column (150 × 3.0 mm, 3 µm) (Imtakt, Japan) at 40°C, the analytes were separated using the isocratic mobile phase of 10 mM ammonium acetate:100% methanol (5:95, v/v) at a flow rate of 0.4 mL/min. The column was eluted into the Applied Biosys-tems MDS SCIEX API 4000 triple quadrupole mass spectrome-ter (Applied Biosystems, Canada) with an ESI source, operating in the multiple reaction monitoring (MRM) mode under unit mass resolution conditions in mass analyzers. The optimized MS condition was as follows: curtain gas flow 20 L/h, collision gas flow 6 L/h, collision energy 45 V, and declustering potential 51 V. Data analysis was performed using Analyst 1.6 software (Ap-plied Biosystems, Canada).
Preparation of Calibration Standard and Quality Control-Samples of Diazepam Standard stock solutions (1 mg/mL) of diazepam and vori-conazole (internal standard [IS]) were prepared in 100% methanol and stored in the refrigerator at −20°C. Working solutions of diazepam for calibrations were obtained by serial dilution with 50% methanol from the stock solution to con-centrations of 5, 10, 50, 100, 500, 1,000, and 3,000 ng/mL. Calibration standards and QC samples of diazepam in plasma were prepared by diluting the corresponding working solu-tions with blank human plasma. The final concentrations of calibration standards were 0.5, 1, 5, 10, 50, 100, and 300 ng/mL. QC samples were prepared at three different concentra-tions of 1.5, 100, and 240 ng/mL. The IS working solution was prepared at 200 ng/mL. All solutions were stored in the −20°C freezer when not in use.
Sample Preparation The human plasma samples stored in −70°C were thawed at room temperature. An aliquot of each sample (50 μL) was placed into a polypropylene microtube, and IS solution (20 μL, 200 ng/mL), 0.1% formic acid (100 μL), and 1.2 mL of ethyl acetate: n-hexane (80:20, v/v) were added. The mixture was vortexed for 10 min and then centrifuged at 14,000 rpm for 10 min. The super-natant (1 mL) was transferred to a new microtube and evapo-rated under nitrogen gas at 40°C. The remaining residue was re-constituted with 300 μL of 90% methanol. For the analysis, 6 μL supernatant aliquot was pipetted into a vial and then injected into the HPLC-MS/MS system.
Validation of the Analytical Method The developed analytical method was validated for selectivity, linearity, accuracy, precision, recovery, matrix effect, and stabili-ty according to the bioanalytical method validation guidelines by the MFDS and the USFDA.[16,17]
A validated LC-MS/MS method for determination of diazepam in human
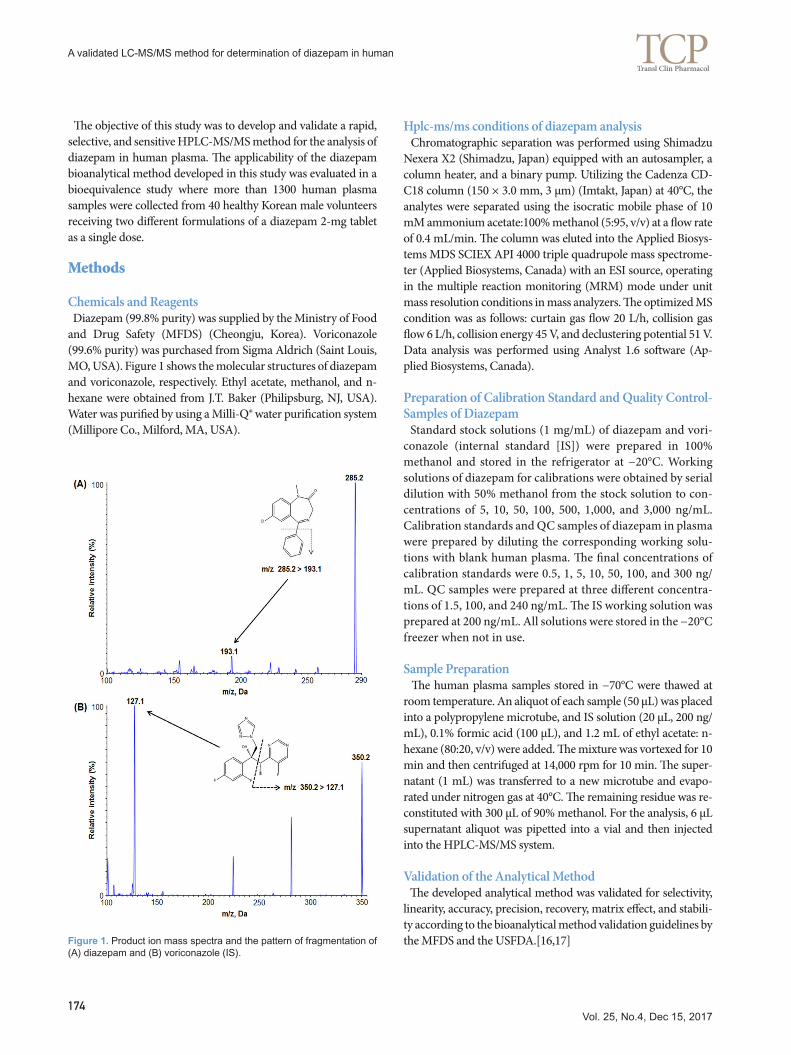
Figure 1. Product ion mass spectra and the pattern of fragmentation of (A) diazepam and (B) voriconazole (IS).
Vol. 25, No.4, Dec 15, 2017175
TCP Transl Clin Pharmacol
Specificity and Lower Limit of Quantitation To evaluate its specificity, the analytical method was assessed by comparing the chromatograms obtained from the samples con-taining diazepam and IS with blank samples. Six blank human plasma samples from different volunteers were collected under equivalent controlled conditions, and they were subjected to the sample preparation procedure as described above. Afterward, they were evaluated for the interference of the endogenous plas-ma components with diazepam or IS. The lower limit of the quantification (LLOQ) was defined as the lowest plasma diaze-pam concentration corresponding to a signal-to-noise (S/N) ra-tio of ≥ 10 with an acceptable precision not exceeding 20% and accuracy within ± 20%.
Linearity Linearity was evaluated using a weighting linear least-squares regression (1/x2) model over the diazepam concentration range of 0.5–300 ng/mL. The calibration curves were y = ax + b, where y is the mean of the peak area ratios of the analytes to their inter-nal standards, a is the slope of the calibration curve, b is the y-axis intercept of the calibration curve, and x is the analyte con-centration. A coefficient of determination (r2) of 0.99 or greater was considered satisfactory.
Precision and Accuracy In order to assess inter- and intra-day precision and accuracy of the analytical method, four concentrations of QC samples were analyzed. Intra-day assays were performed on five replicates per day, and inter-day assays were carried out for three consecutive days. The acceptance criteria for the accuracy and precision based on each back-calculated standard concentration were a 15% coefficient of variation (CV; standard deviation/mean × 100) from the nominal value except at the LLOQ, where the ac-ceptance limit of %CV was 20%.
Stability The stock solution stability of diazepam was tested using three replicates of low and high QC at room temperature for 3 h and −20°C for 93 days. The stability of the analyte in human plasma was evaluated using low, middle, and high QC samples under the following conditions: refrigerated (4°C), frozen (−70°C), room temperature (7 h), five freezing-thawing cycles (−70°C to 20°C), and long-term frozen storage (−70°C) for 86 days.
Recovery and Matrix effect Diazepam recovery in plasma was evaluated at three QC con-centrations by comparing the analytical peak area of the pre-ex-tracted QC sample and that of the post-extraction QC samples, which were prepared by adding compound to post-extracted drug-free plasma at each concentration. The matrix effect was assessed by comparing the peak areas at the QC concentrations spiked after extraction into plasma with standard solutions of the analyte.
Application to a Bioequivalence Study Our validated analytical method was applied to a cross-over bioequivalence study to determine the concentrations of diaze-pam in human plasma samples collected from 40 healthy Korean male volunteers who received a single-dose 2 mg diazepam tab-let (Daewon [DW] or Samjin [SJ]) orally. This study was ap-proved by the MFDS as well as the institutional review board (IRB) at the study site, and written informed consent was ob-tained from study participants in accordance with the principles of the Helsinki Declaration (World Medical Association Decla-ration of Helsinki 2000) [18]. Subjects were instructed not to drink or smoke until 24 h before the study. Blood samples (7 mL) were collected in heparinized tubes as scheduled at the following times: prior tz and harvested plasma was stored at −70 °C until analysis. Cmax (peak plasma concentration) and Tmax (time to reach Cmax) of diazepam were determined based on the individ-ual plasma concentration-time profiles. A non-compartmental method for extravascular input, provided in BA Calc 2007 soft-ware, was used to calculate pharmacokinetic parameters includ-ing AUClast (area under the plasma drug concentration-time curve between 0 and the last measurable time point) and extrap-olated AUCinf (AUC from 0 to infinity). Bioequivalence of the two diazepam tablets was evaluated based on the ratio (test/ref-erence) of log-transformed data (Cmax and AUClast) with 90% confidence intervals (CIs) using the K-BE test II software distri-buted by the MFDS.[17]
Results
Method development
Mass spectrometry Diazepam and voriconazole (IS) were dissolved in 100% metha-nol at a concentration of 250 ng/mL. The samples were injected into a mass spectrometer with a syringe pump operating at a flow rate of 10 µL/min. The maximum amount of product ion was obtained in a positive mode using a turboionspray ESI interface. Based on the Q1 full scan, diazepam and IS were detected at m/z transition of 285.2→193.1 and 350.2→127.1, respectively (Fig. 1).
Chromatographic conditions Several HPLC methods were investigated using different col-umns and mobile phases to reduce ion suppression induced by endogenous substances and to optimize the peak shapes and re-tention times of diazepam and IS. In our preliminary study, Phe-nomenex Luna HILIC (50 × 2.0 mm, 3 μm), Cadenza CD-C18 (150 × 3.0 mm, 3 μm), Phenomenex Luna C8 (50 × 2.0 mm, 3 μm), and Halo™ phenyl hexyl (2.1 × 150 mm, 2.7 μm) columns were tested for optimization. The best results in terms of separa-tion, peak shape, and reproducibility were obtained with a Ca-denza CD-C18 column (150 × 3.0 mm, 3 μm); when using other columns, peak tailing or fronting occurred. For the mobile phase, a series of aqueous mobile phases containing different
Do-Hyung Kim, et al.
Vol. 25, No.4, Dec 15, 2017176
TCP Transl Clin Pharmacol
A validated LC-MS/MS method for determination of diazepam in human
additives (acidic buffers and additives such as formic acid, am-monium acetate, and ammonium formate) with different pH values were tested with methanol solution. A mobile phase con-sisting of 10 mM ammonium acetate (pH 3.0, adjusted with for-mic acid) in methanol (5:95, v/v) achieved symmetric peak shapes and short retention time (3 min) (Fig. 2).
Method Validation
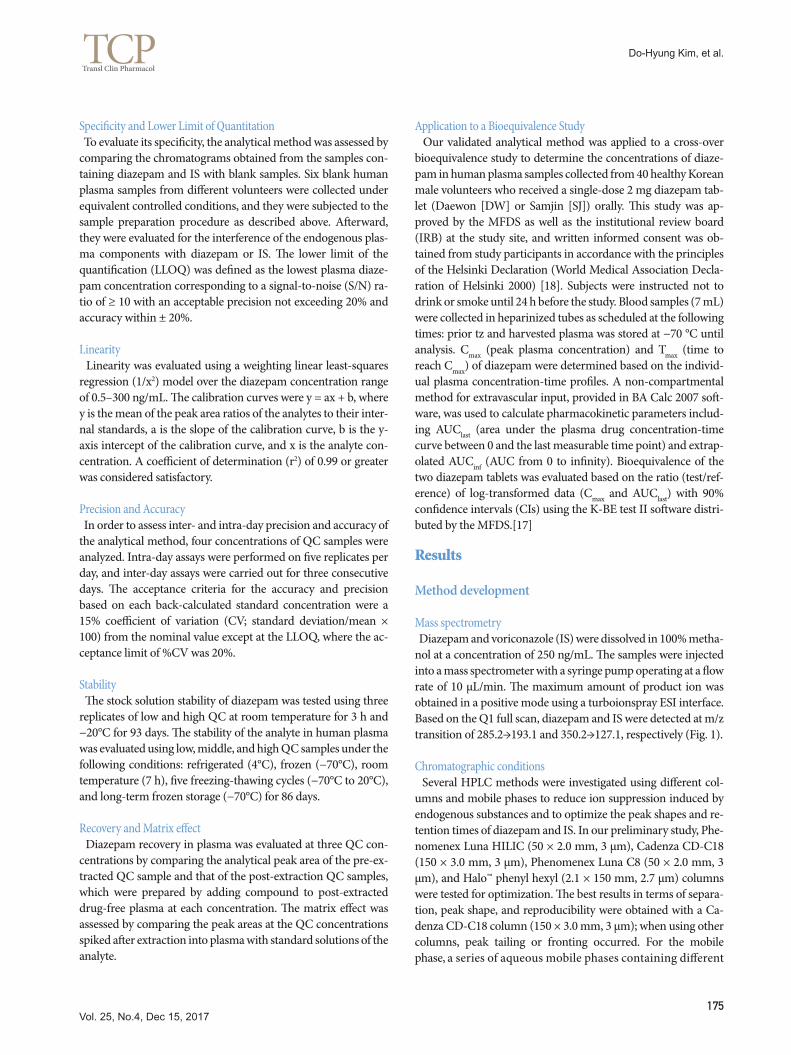
Specificity and Lower Limit of Quantitation Under the experimental conditions described above, Figure 2 showed the chromatograms of blank plasma, plasma sample spiked with IS only, plasma sample spiked with diazepam at the LLOQ (0.5 ng/mL), and plasma sample spiked with IS from a vol-unteer at 0.75 h after an oral administration of 2 mg diazepam. No interference was observed with diazepam and IS. The S/N ratio at the LLOQ (0.5 ng/mL) was > 10. The LLOQ for our method was
lower than that for previously developed methods using LC-MS/MS.[5,6,9] The precision and accuracy of several LLOQ samples were adequate and applicable to bioavailability studies.
Linearity The regression equation with mean ± standard deviation regres-sion coefficient for the calibration curve (n = 5) was y = 0.0246 (± 0.002)x − 0.000559 for diazepam with the correlation coefficients > 0.99 for all curves, suggesting adequate linearity and reproduc-ibility over the concentration range.
Precision and Accuracy Intra-day and inter-day precision and accuracy for diazepam in human plasma at four concentrations are summarized in Table 1. Intra-day precision and accuracy ranged from 1.79% to 12.47% and from 86.87% to 112.92%, respectively. Inter-day pre-cision and accuracy ranged from 7.25% to 11.98% and from 97.37% to 104.25%, respectively. Thus, our precision and accu-racy results were within the acceptable criteria based on the MFDS guideline, suggesting adequate precision and accuracy of our developed analytical method.[17]
Stability Table 2 presents the stability of diazepam in stock solutions us-ing two QC concentrations (1.5 and 240 ng/mL) and in human plasma using three QC concentrations (1.5, 100, and 240 ng/mL) under different conditions during sample preparation and stor-age. Diazepam was considered stable in stock solutions and hu-
Concentra-tion
(ng/mL)
Intra-day Inter-day
Precision (%) Accuracy (%) Precision (%) Accuracy (%)
0.5 10.8 104.3 12.0 104.3
1.5 5.4 101.4 7.2 101.4
100 5.4 102.3 7.8 102.3
300 4.7 97.4 9.8 97.4
Table 1. Intra- and Inter-day precision and accuracy for the HPLC-MS/MS assay of diazepam in human plasma (n = 5)
Figure 2. Multiple reaction monitoring chromatograms of (A) blank human plasma, (B) plasma spiked with IS only (voriconazole, 200 ng /mL), (C) plasma spiked with 0.5 ng/mL diazepam (LLOQ) and IS and (D) sample plasma from a volunteer after an oral administration of 2 mg diazepam (measured diazepam concentration: 75.728 ng/mL).
Vol. 25, No.4, Dec 15, 2017177
TCP Transl Clin Pharmacol
Do-Hyung Kim, et al.
man plasma with the concentration deviation from the newly prepared sample < ± 15%. Our diazepam stability test results demonstrated a good stability without any significant degrada-tion of diazepam over all steps of the routine sample preparation and storage for pharmacokinetic and bioavailability studies.
Recovery and Matrix effect To remove interfering substances and decrease the LLOQ, the sample preparation procedures must be highly reproducible with high recovery of analyte and a minimum number of work-ing steps. In this study, five different extraction solvents includ-ing methyl tert-butyl ether (MTBE), ethyl acetate, methyl chlo-ride, n-hexane, and a mixture of ethyl acetate and n-hexane (80:20, v/v) were evaluated. The mixture of ethyl acetate and n-hexane (80:20, v/v) was chosen based on the adequate sensitivity and recovery of analytes. Although protein precipitation (PP) and solid phase extraction (SPE) methods have been previously used to extract the analyte, these methods are laborious and thus, may not be the best for routine analysis when processing a large number of plasma samples.[6-8] The extraction recoveries and matrix effects of diazepam following extraction at three QC con-centrations were 81.92–86.63% and 88.15–93.54% (n = 6), re-spectively (Table 3). The extraction recovery and absolute matrix effect of IS were 87.61% and 89.71%, respectively, at 200 ng/mL
(Table 3). These results suggested no endogenous substances substantially associated with the ion suppression in this analyti-cal method, demonstrating the reliability of our bioanalytical method.
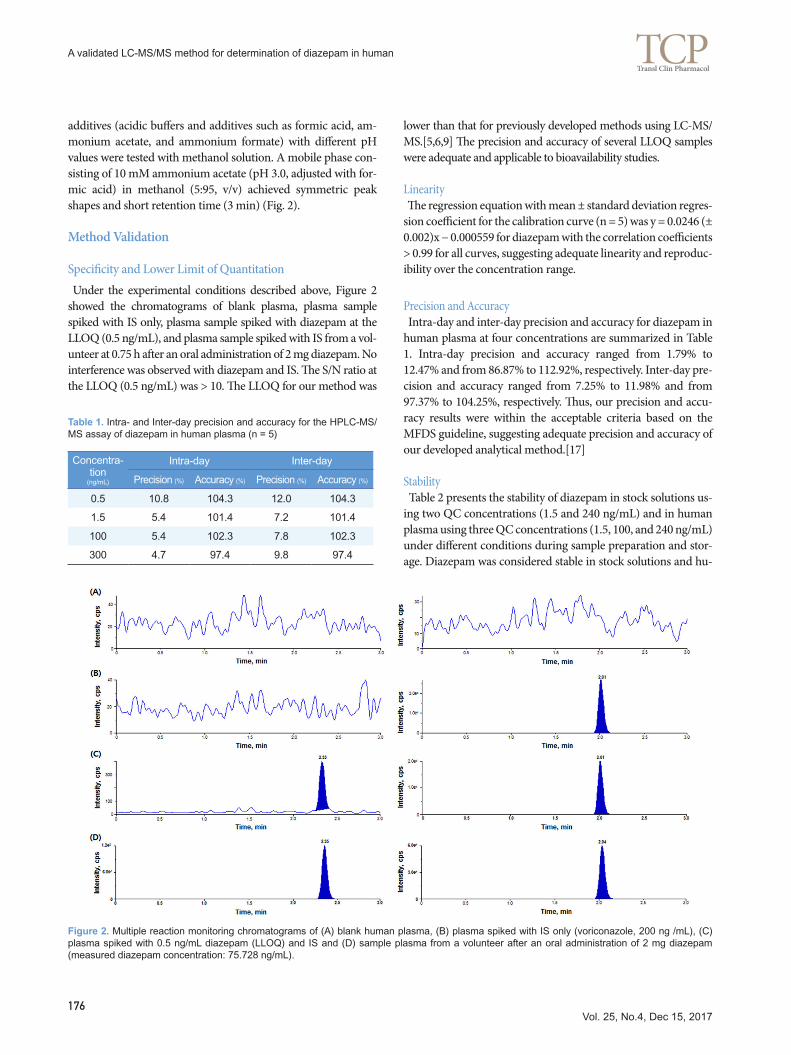
Clinical application Our proposed HPLC-MS/MS method was successfully ap-plied to a bioequivalence study of a single-dose, oral 2 mg diaz-epam tablet in 40 healthy male Korean volunteers to quantitate diazepam concentrations (n = 1300). The mean plasma diaz-epam concentration-time curve after an oral administration of a single-dose reference and test diazepam tablet (2 mg) is shown in Figure 3. No significant sequence effect was observed for any pharmacokinetic parameters. Compared with previous diazepam pharmacokinetic studies after an oral administra-tion (AUCinf: 2760 ± 800 ng·h/mL [Dose: 5 mg] and 7551 ± 642 ng·h/mL [Dose: 10 mg]; Cmax: 131 ± 37 ng/mL [Dose: 5 mg] and 394 ± 19 ng/mL [Dose: 10 mg]), our study reported similar estimates of pharmacokinetic parameters (Table 4).[19, 20] The mean ± standard deviation (SD) AUCinf, AUClast, and Cmax were 1793.854 ± 969.919 ng·h/mL, 1347.273 ± 470.211 ng·h/mL, and 75.160 ± 21.68 ng/mL, respectively, for the reference drug (Table 4). For the test drug, the mean ± SD AUCinf, AUClast, and Cmax were 1796.746 ± 888.349 ng·h/L, 1343.681 ± 500.314 ng·h/
Table 2. Stability of diazepam in stock solution and human plasma (%)
Stability conditionConcentration (ng/mL)
1.5 100 240
Stock solution
3 h, Room temperature (%) 95.7 97.9
93 days, −20°C (%) 97.9 98.1
Plasma
7 h, Room temperature (%) 99.4 98.3 95.5
7 h, 4°C (%) 91.6 101.4 94.1
7 h, −70°C (%) 94.4 100.0 95.9
60 h, Autosampler (5°C) (%) 101.0 101.9 99.2
Freeze-thaw stability (5 cycles) (%) 110.7 98.0 101.1
86 days, −70°C (%) 104.5 91.8 102.1
Table 3. Extraction recovery and matrix effect of diazepam and IS
Nominal concentra-
tion (ng/mL)Recovery
(%)Matrix Effect
(%)
Diazepam 1.5 81.9 93.0
100 83.1 94.5
240 86.6 88.2
IS 200 87.6 89.7
Figure 3. Mean plasma concentration-time profile of diazepam in the plasma after an oral dose of 2-mg diazepam Samjin tablet (●, refer-ence formulation) and Daewon tablet (○, test formulation) administered to healthy volunteers (n = 40).
Table 4. Pharmacokinetics parameters of diazepam in plasma after an oral administration of a 2 mg tablet (n = 40)
Parameterreference test
Mean ± S.D Mean ± S.D
Cmax (ng/mL) 75.160 ± 21.683 77.924 ± 30.764
AUClast (ng·h/mL) 1347.273 ± 470.211 1343.681 ± 500.314
AUCinf (ng·h/mL) 1793.854 ± 969.919 1796.746 ± 888.349
Tmax (h) 0.773 ± 0.339 0.829 ± 0.517
Vol. 25, No.4, Dec 15, 2017178
TCP Transl Clin Pharmacol
A validated LC-MS/MS method for determination of diazepam in human
mL, and 77.924 ± 30.76 ng/mL, respectively (Table 4). The 90% CIs for the geometric mean ratios of AUClast and Cmax were 0.96–1.03 and 0.93–1.10, respectively, satisfying the bioequivalence criteria based on the 90% CI for the geometric mean ratios of AUC and Cmax of 0.80-1.25.[16,17] Therefore, the two diazepam tablets evaluated in this study were bioequivalent, no significant difference in the systemic disposition of diazepam between the two formulations.
Discussion In this study, we described a reliable and efficient method to determine diazepam concentrations in human plasma. The full validation procedures demonstrated our proposed method, with a total running time of 3 min for each sample, was specific, rapid, and reproducible over the concentration range of 0.5–300 ng/mL. In previous studies to develop a bioanalytical method to quantitate diazepam in human plasma, samples were prepared using the protein precipitation (PP) method or solid-phase ex-traction (SPE) method.[5-8] However, due to insufficient remov-al of impurities from the sample when using the PP method, the analytical method with samples prepared using the PP method may not be appropriate for the routine analysis of a large number of samples.[5,6] The SPE method is a complicating and time-consuming sample preparation procedure.[7,8] Therefore, in this study, a liquid-liquid extraction (LLE) method was used to effectively remove endogenous substances and thus, improve the efficiency of analyzing a large number of samples for human pharmacokinetic research. Our developed method satisfied all of the MFDS and USFDA guidelines for validating a bioanalytical assay.[16,17] Addition-ally, this method has been successfully applied to a bioequiva-lence study of diazepam to analyze more than 1300 clinical sam-ples from healthy volunteers. Therefore, the diazepam bioana-lytical method developed in this study may be more appropriate for the routine quantification of a large number of samples with an improved analytical sensitivity.
Acknowledgements The study was funded by a grant from Daewon Pharm Co, Ltd.
Conflicts of interests-Authors: Nothing to declare-Reviewers: Nothing to declare-Editors: Nothing to declare
References 1. Klotz U, Avant GR, Hoyumpa A, Schenker S, Wilkinson GR. The effects of age
and liver disease on the disposition and elimination of diazepam in adult man. J Clin Invest 1975;55:347-359.
2. APO-diazepam-productinformation-Australia. http://www.medicines.org.au/files/txpdiaze.pdf. Accessed 10 September 2017.
3. Rouini MR, Ardakani YH, Moghaddam KA, Solatani F. An improved HPLC
method for rapid quantitation of diazepam and its major metabolites in human plasma.Talanta 2008;75:671-676. doi: 10.1016/j.talanta.2007.11.060.
4. Mercolini L, Mandrioli R, Iannello C, Matrisciano F, Nicoletti F, Raggi MA. Si-multaneous analysis of diazepam and its metabolites in rat plasma and brain tissue by HPLC-UV and SPE. Talanta 2009;80:279-285. doi: 10.1016/j.talan-ta.2009.06.074.
5. Agarwal SK, Kriel RL, Brundage RC, Ivaturi VD, Cloyd JC. A pilot study as-sessing the bioavailability and pharmacokinetics of diazepam after intranasal and intravenous administration in healthy volunteers. Epilepsy Res 2013; 105:362-327. doi: 10.1016/j.eplepsyres.2013.02.018.
6. Lee XP, Shouji Y, Kumazawa T, Hasegawa C, Fujishiro M, Sato J, et al. Rapid and highly sensitive analysis of benzodiazepines and tandospirone in human plasma by automated on-line column-switching UFLC-MS/MS. Leg Med (To-kyo) 2017;24:36-55. doi: 10.1016/j.legalmed.2016.11.005.
7. Wang R, Wang X, Liang C, Ni C, Xiong L, Rao Y, et al. Direct determination of diazepam and its glucuronide metabolites in human whole blood by μElution solid-phase extraction and liquid chromatography–tandem mass spectrome-try. Forensic Sci Int 2013;233:304-311. doi: 10.1016/j.forsciint.2013.10.004.
8. Jiang F, Rao Y, Wang R, Johansen SS, Ni C, Liang C, et al. Sensitive, auto-matic method for the determination of diazepam and its five metabolites in human oral fluid by online solid-phase extraction and liquid chromatography with tandem mass spectrometry. J Sep Sci 2016;39:1873-1883. doi: 10.1002/jssc.201600107.
9. De Boeck M, Missotten S, Dehaen W, Tytgat J, Cuypers E. Development and validation of a fast ionic liquid-based dispersive liquid–liquid microex-traction procedure combined with LC–MS/MS analysis for the quantifica-tion of benzodiazepines and benzodiazepine-like hypnotics in whole blood. Forensic Sci Int 2017;274:44-54. doi: 10.1016/j.forsciint.2016.12.026.
10. Ivaturi V, Kriel R, Brundage R, Loewen G, Mansbach H, Cloyd J. Bioavail-ability of intranasal vs. rectal diazepam. Epilepsy Res 2013;103:254-261. doi: 10.1016/j.eplepsyres.2012.07.018.
11. Abbara C, Bardot I, Cailleux A, Lallement G, Le Bouil A, Turcant A, et al. High-performance liquid chromatography coupled with electrospray tan-dem mass spectrometry (LC/MS/MS) method for the simultaneous deter-mination of diazepam, atropine and pralidoxime in human plasma. J Chro-matogr B Analyt Technol Biomed Life Sci 2008;874:42-50. doi: 10.1016/j.jchromb.2008.08.027.
12. Cloyd JC, Lalonde RL, Beniak TE, Novack GD. A Single-Blind, crossover comparison of the pharmacokinetics and cognitive effects of a new diaz-epam rectal gel with intravenous diazepam. Epilepsia 1998;39:520-526.
13. Abbara C, Rousseau J, Turcant A, Lallement G, Comets E, Bardot I, et al. Bioavailability of diazepam after intramuscular injection of its water-solu-ble prodrug alone or with atropine–pralidoxime in healthy volunteers. Br J Pharmacol 2009;157:1390-1397. doi: 10.1111/j.1476-5381.2009.00330.x.
14. Ivaturi VD, Riss JR, Kriel RL, Cloyd JC. Pharmacokinetics and tolerability of intranasal diazepam and midazolam in healthy adult volunteers. Acta Neurol Scand 2009;120:353-357. doi: 10.1111/j.1600-0404.2009.01170.x.
15. Lamson MJ, Sitki-Green D, Wannarka GL, Mesa M, Andrews P, Pellock J. Pharmacokinetics of diazepam administered intramuscularly by autoin-jector versus rectal gel in healthy subjects: a phase I, randomized, open-label, single-dose, crossover, single-centre study. Clin Drug Investig 2011;31:585-597. doi: 10.2165/11590250-000000000-00000.
16. Bio-analytical Method Validation. Korea Food and Drug Administration, 2013. https://eirb.ajoumc.or.kr/board/file/Notice/Notice_1055.pdf. Accessed 20 September 2017
17. Guidance for industry: Bioanalytical method validation. https://www.fda.gov/downloads/drugs/guidances/ucm368107.pdf Accessed 30 Septem-ber 2017
18. General Assembly of the World Medical Association. World medical as-sociation declaration of helsinki: Ethical principles for medical research involving human subjects. J Am Coll Dent 2014;81:14-18.
19. Saari TI, Laine K, Bertilsson L, Neuvonen PJ, Olkkola KT. Voriconazole and fluconazole increase the exposure to oral diazepam. Eur J Clin Phar-macol 2007;63:941-949.
20. Locniskar A, Greenblatt DJ, Harmatz JS, Shader RI. Bioinequivalence of a generic brand of diazepam. Biopharm Drug Dispos 1989;10:597-605.
Top Related