![Hepatic cancer stem cell marker granulin-epithelin ... · 21645 ncotarget xenografts [14, 16]. Recently, we revealed that GEP was a hepatic oncofetal protein regulating hepatic cancer](https://static.fdocument.org/doc/165x107/6032aadad662762bd97dbde0/hepatic-cancer-stem-cell-marker-granulin-epithelin-21645-ncotarget-xenografts.jpg)


γλώσσες
Σελίδες
Νομικός

PGC-1� Regulates Hepatic Hepcidin Expression andIron Homeostasis in Response to inflammation
Jinchun Qian, Siyu Chen, Yueyue Huang, Xiaoli Shi, and Chang Liu
Jiangsu Key Laboratory for Molecular and Medical Biotechnology and College of Life Sciences, NanjingNormal University, Nanjing, Jiangsu 210023, China
Systemic iron homeostasis is finely regulated by the liver through synthesis of the peptide hor-mone hepcidin (HAMP), which plays an important role in duodenal iron absorption and macro-phage iron release. Clinical investigations have shown that chronic and low-grade inflammationleads to the increase of serum HAMP levels and the development of various diseases such asanemia of inflammation. However, gaps remain to fully elucidate the mechanism linking inflam-mation and iron dysregulation. Here we show that although inflammatory stimuli increase he-patic HAMP expression and cause systemic iron deficiency in mice, they inhibit the expression ofperoxisome proliferator-activated receptor � coactivator-1� (PGC-1�), a transcriptional coactiva-tor actively involved in metabolic regulation. Liver-specific overexpression of PGC-1� antagonizeslipopolysaccharide-induced HAMP expression and alleviates various pathophysiological changessimilar to anemia of inflammation. Consistently, overexpression of PGC-1� in HepG2 or HuH7 cellsalso suppresses HAMP expression and reduces iron accumulation. In contrast, knockdown ofPGC-1� exaggerates LPS-induced HAMP expression and iron dysregulation. At the molecular level,PGC-1� suppresses HAMP transcription via the interaction with hepatocyte nuclear factor 4�. Inaddition, PGC-1� is present near hepatocyte nuclear factor 4�-binding site on the proximal HAMPpromoter and turns the chromatin structure into an inactive state. Our data suggest a critical rolefor PGC-1� in the regulation of hepatic HAMP expression and iron homeostasis under inflamma-tory circumstances. (Molecular Endocrinology 27: 0000–0000, 2013)
Limiting systemic iron levels within a narrow window iscritical for human health. Either iron deficiency or
iron overload leads to various diseases that are seen mostfrequently worldwide. The homeostatic system finely reg-ulates plasma iron availability so that the iron supply tocells and tissues is guaranteed while the toxic iron excessis prevented. In particular, the erythron requires most ofthe systemically available iron for erythroid heme synthe-sis and at least 3 different types of cells participate in thisprocess including duodenal enterocytes (which absorbiron from the diet), macrophages (which release iron re-cycled from senescent erythrocytes), and hepatocytes (themajor iron reserve) (1).
The liver is the major body iron storage site and theendocrine organ responsible for the regulation of systemiciron homeostasis. It synthesizes hepcidin (HAMP), a 25–amino-acid peptide that controls the amount of ironavailable in the circulation (1). HAMP acts via binding tothe only known mammalian cellular iron exporter, ferro-portin, leading to its internalization and degradation,with consequent loss of iron export from the duodenalenterocytes and reticuloendothelial cells (2). Notably,HAMP expression is robustly regulated by intracellularstimuli. For example, erythropoiesis and iron deficiencysuppress, whereas iron overload and inflammation up-regulate, HAMP synthesis (3). Infusion of IL-6 (4) and
ISSN Print 0888-8809 ISSN Online 1944-9917Printed in U.S.A.Copyright © 2013 by The Endocrine Societydoi: 10.1210/me.2012-1345 Received October 25, 2012. Accepted January 31, 2013.
Abbreviations: AcH3, acetylated histone 3; AI, anemia of inflammation; BMP, bone mor-phogenetic protein; ChIP, chromatin immunoprecipitation; FAO, fatty acid �-oxidation;GFP, green fluorescent protein; HAMP, hepcidin; Hb, hemoglobin; HJV, hemojuvelin;H3K4me3, trimethylation of lysine 4 of histone 3; H3K9me2, dimethylation of lysine 9 ofhistone 3; HNF4�, hepatocyte nuclear factor 4�; LPS, lipopolysaccharide; PGC-1�, perox-isome proliferator-activated receptor-� coactivator-1�; qPCR, quantitative PCR; RBC, redblood cell; RNAi, RNA interference; shRNA, short hairpin RNA; STAT-3, signal transducerand activator of transcription-3; TIBC, total iron binding capacity.
O R I G I N A L R E S E A R C H
doi: 10.1210/me.2012-1345 Mol Endocrinol mend.endojournals.org 1
Molecular Endocrinology. First published ahead of print February 25, 2013 as doi:10.1210/me.2012-1345
Copyright (C) 2013 by The Endocrine Society
lipopolysaccharide (LPS) (5) into healthy volunteers leadsto a rapid increase in urinary HAMP, with concomitantdecrease in serum iron levels. In accordance with theseobservations, patients with severe inflammation have el-evated HAMP levels when compared with healthy con-trols. Interestingly, various pathological changes (includ-ing a mild hypochromic anemia, sequestration of iron inthe spleen, and impaired marrow response to erythropoi-etin) seen in the anemia of inflammation (AI), a commondisorder of patients with chronic inflammatory condi-tions, can be replicated in a HAMP transgenic mousemodel (6). Mechanistic studies have demonstrated thatproinflammatory cytokines such as IL-6 induce HAMPsynthesis via signal transducer and activator of transcrip-tion-3 (STAT-3) signaling pathway (7). Another criticalregulator of HAMP expression is the bone morphogeneticprotein (BMP) pathway. BMPs bind to several types ofreceptors, resulting in phosphorylation of cytoplasmicSmad1/Smad5/Smad8, which associate with the commonmediator Smad4 and translocate into the nucleus wherethey act as transcription factors (8). Liver-specific disrup-tion of Smad4 in mice causes iron overload due to severelydecreased HAMP expression (9). Typically, BMP signal-ing is modulated by coreceptors, among which hemoju-velin (HJV) is specific for iron regulation. Humans withdisruptive HJV mutations (10) or HJV-knockout mice(11) have iron overload as severe as that caused by abla-tion of HAMP. Taken together, HAMP is a critical or-chestrator of iron homeostasis, and a strategy aiming toregulate HAMP levels would be beneficial for the patientswith diseases related to iron dysregulation.
Peroxisome proliferator-activated receptor-� coactiva-tor-1� (PGC-1�) is a transcriptional coactivator inten-sively involved in the regulation of cellular energy metab-olism. Ubiquitously expressed in tissues with high energyconsumption levels including brown fat, skeletal muscle,liver, heart, kidney and brain, PGC-1� stimulates variousphysiological processes such as mitochondrial biogenesis,hepatic fatty acid �-oxidation (FAO), muscle fiber switch,and circadian clock machinery by selectively activatingnuclear receptors and transcriptional factors includinghepatocyte nuclear factor 4� (HNF4�) (12). Specifically,recent studies have disclosed the active roles of PGC-1� ininflammatory responses. For example, inflammatory cy-tokines (TNF-�, IL-1, and IL-6) impair various physio-logical processes including hepatic FAO (13), glucose up-take in skeletal muscle (14), and glucose-stimulatedinsulin secretion in pancreatic islets (15) via suppressionof PGC-1�. These cytokines can also retard the recruit-ment of PGC-1� to the binding site of HNF4� promoterand thus decrease HNF4� transcriptional activity (16).More importantly, STAT-3, an activator for HAMP, is
known to suppress the expression of PGC-1� and gluco-neogenic gene expression in the liver (17). These previousstudies prompt us to investigate whether PGC-1� alsoparticipates in the regulation of HAMP expression in re-sponse to inflammation.
Materials and Methods
Animal experimentsAll animal experiments in this investigation were conducted
in compliance with the Guide for the Care and Use of Labora-tory Animals published by the National Institutes of Health(NIH publication No. 85-23, revised 1996) and approved by theAnimal Care and Use Committee of Nanjing Normal University,China (permit number 2090658, issue date April 20, 2008). Weused male 8-week-old C57BL/6J mice in the experiments, andall mice were housed under a constant light-dark cycle, main-tained on a standard mouse diet, and allowed ad libitum accessto food and water. To examine the effects of low-grade inflam-mation on the hepatic expression of hamp and pgc-1�, micewere injected ip with sterile PBS (as the control) or LPS (Sigma,St Louis, Missouri) at a dose of 1 mg/kg body weight. Theanimals were decapitated at 4, 6, 12, and 24 hours after theadministration of LPS, and the liver and blood were harvested.For liver-specific PGC-1� overexpression, mice were adminis-tered with adenoviruses expressing green fluorescent protein(GFP) (as the control) or PGC-1� (0.1 absorbance units permouse) through tail vein injection. For liver-specific PGC-1�knockdown, mice were administered control or PGC-1� RNAinterference (RNAi) adenoviruses via the tail vein. Four dayslater, these mice were given an LPS injection as described aboveand killed at 6 hours (for mRNA quantification) or 24 hours (forother assays) thereafter.
Cell cultureHuman hepatoma HepG2 and HuH7 cells transduced with
adenoviruses expressing GFP or PGC-1� were established andmaintained in DMEM supplemented with 5% fetal bovine se-rum. For inflammatory cytokine stimulation, cells were incu-bated either with 10 �g/ml LPS for 12 hours or with 100 ng/mlIL-6 (Millipore, Darmstadt, Germany) for 8 hours. Cells werethen collected for mRNA and protein expression analysis. ForHNF4� knockdown, the plasmids encoding short hairpin RNA(shRNA) against HNF4� (Santa Cruz Biotechnology, SantaCruz, California) were transfected into HepG2 cells using Fu-GENE HD transfection reagent (Roche, Indianapolis, Indiana).Eight hours later, cells were infected by adenoviruses expressingPGC-1� when necessary. Plasmids encoding a control scram-bled shRNA sequence were transfected in parallel to serve as anegative control.
mRNA and protein expression analysisTotal RNA was isolated using Trizol reagents (Invitrogen,
Carlsbad, California), reverse transcribed, and analyzed byquantitative PCR (qPCR) using SYBR Green and the Mastercy-cler ep realplex2 system (Eppendorf, Hamburg, Germany).Primers for human �-actin or mouse 36B4 were included fornormalization. A complete list of PCR primers is shown in Sup-
2 Qian et al PGC-1� Regulates Hepcidin Mol Endocrinol
plemental Table 1 (published on The Endocrine Society’s Jour-nals Online web site at http://mend.endojournals.org). For pro-tein analysis, tissue samples were homogenized and cells werelysed in RIPA buffer containing 50mM Tris/HCl (pH 8.0),150mM NaCl, 1% Nonidet P-40, 1% sodium deoxycholate,0.1% sodium dodecyl sulfate, 0.1mM dithiothreitol, 0.05mMphenylmethylsulfonyl fluoride, 0.002 mg/ml aprotinin, 0.002mg/ml leupeptin, and 1mM NaVO3. The protein concentrationwas quantified with a Dc protein assay reagent (Bio-Rad, Her-cules, California). Equal amounts of protein were loaded andseparated by 10% SDS-PAGE (for HAMP, 18%) and thentransferred onto polyvinylidene difluoride membrane (Bio-Rad). The membranes were incubated overnight with appropri-ate primary antibodies. Bound antibodies were then visualizedusing alkaline phosphatase-conjugated secondary antibodies.Quantitative analysis was performed by NIH Image J version1.32j software. For antibody information, anti-PGC-1� anti-body was purchased from Calbiochem (La Jolla, California),anti-HNF4� antibody was purchased from Santa Cruz Biotech-nology, anti-HAMP antibody was obtained from Alpha Diag-nostics (San Antonio, Texas), and anti-GAPDH antibody wasfrom Cell Signaling Technology (Danvers, Massachusetts).
Iron measurementsBlood samples were collected in nonheparinized tubes and
centrifuged at 3000 rpm for 10 minutes at 4°C. Serum iron andtotal iron binding capacity (TIBC) levels were measured using aspectrophotometric assay at the wavelength of 520 nm. Serumferritin levels were measured with a commercial ELISA kit (UscnLife Science, Missouri City, Texas) based on the principle of thedouble-antibody sandwich technique. To evaluate iron deposi-tion in the liver and the spleen, tissues were immersion fixed in4% buffered formalin, embedded in paraffin wax, sectioned,and stained with Perls’ Prussian blue solution at room temper-ature for 30 minutes. A nuclear fast red counterstain was thenapplied to provide a pink to red contrasting background. Imageswere captured using a Nikon microscope (Ti-S 533665). Toquantitatively measure iron levels in vivo, liver and spleen sam-ples were weighed and digested in acid solution (3M hydrochlo-ric acid, 10% trichloroacetic acid) at 65°C for 20 hours, and 100�l of each acid extract was mixed with 2 ml bathophenanthro-line chromogen reagent. After 20 minutes of incubation at roomtemperature, the absorbance at 535 nm was measured in a spec-trophotometer (Bio-Tek, Winooski, Vermont).
Hematological analysisThe number of red blood cells (RBCs) and the levels of he-
moglobin (Hb) in the mouse blood were measured by using aSELECTRA JUNIOR version 04 autoanalyzer (Vital Scientific,Spankeren, The Netherlands). Serum IL-6 levels were measuredusing a commercial ELISA kit (Raybio, Norcross, Georgia)based on the principle of the double-antibody sandwich tech-nique. Each measurement was repeated 6 times, and the meanconcentrations were calculated.
Immunocytochemical and immunohistochemicalstaining
HepG2 cells were fixed in ice-cold 4% paraformaldehyde for30 minutes followed by blocking in 5% goat serum for 1 hour.Cells were then incubated with anti-HAMP antibody overnight
at 4°C. After intensive washing, cells were incubated with horse-radish peroxidase-conjugated secondary antibody. DAPI (4=,6-diamidino-2-phenylindole) staining for nuclear localization wasperformed simultaneously. For the staining of tissue samples,liver paraffin-embedded sections were rehydrated and antigenretrieval was achieved by boiling for 20 minutes in citrate buffer(pH 6.0). The endogenous peroxidase activity was blocked with3% hydrogen peroxide for 5 minutes. Samples were then rinsedin PBS and blocked with nonimmune goat serum followed byincubation with indicated primary antibodies at 4°C overnightfor the later immunostaining by using diaminobenzidine. Non-immune IgG was used as a negative control.
Luciferase assayHepG2 cells were transfected with 100 ng mhamp-luc re-
porter plasmid (�775/�14, kindly provided by Dr. AntonelloPietrangelo, Mario Coppo Liver Research Center, UniversityHospital of Modena, Modena, Italy), mixed with 200 ngPGC-1� and 200 ng HNF-4� expression constructs. Equalamounts of DNA were used for all transfection combinations byadding appropriate vector DNA. At 30 hours after the transfec-tion, cells were stimulated with LPS (10 �g/ml) for 12 hours orwith IL-6 (100 ng/ml) for 8 hours. Relative luciferase activitieswere determined using the Dual Luciferase System (Promega,Madison, Wisconsin). All transfection experiments were per-formed in triplicate.
Chromatin immunoprecipitation assayChromatin immunoprecipitation (ChIP) was performed es-
sentially as described by Upstate Biotechnology (Lake Placid,NY). Briefly, HepG2 cells were transduced with adenovirusesexpressing GFP or PGC-1� for 48 hours. Chromatin lysateswere prepared, precleared with protein-A/G agarose beads, andimmunoprecipitated with antibodies against PGC-1�, dimethy-lation of lysine 9 of histone 3 (H3K9me2), trimethylation oflysine 4 of histone 3 (H3K4me3) (Abcam, Cambridge, Massa-chusetts), acetylated histone 3 (AcH3) (Upstate Biotechnology),or normal mouse IgG (Santa Cruz Biotechnology) in the pres-ence of BSA and salmon sperm DNA. Beads were extensivelywashed before reverse cross-linking. DNA was purified using aPCR purification kit (QIAGEN, Valencia, California) and sub-sequently analyzed by PCR using primers flanking the proximalbinding sites for HNF4� (�602 to �589 from the predictedtranslational starting site) on the human hamp promoter, asdetailed in Supplemental Table 1. For in vivo ChIP, frozenmouse liver was crushed into powder and equal quantities ofeach sample were pooled. DNA-protein cross-linking was per-formed by incubating pooled powdered liver tissue (�30 mg)with 1% formaldehyde in PBS containing protease inhibitorcocktail (Roche) and phosphatase inhibitor cocktail (Sigma) for10 to 15 minutes at room temperature with gentle shaking.Cross-linking reactions were stopped by adding glycine to0.125M. Liver nuclei were isolated with a dounce homogenizerin hypotonic solution followed by centrifugation at 4000g for 1minute. The following procedures were similar to the in vitroChIP.
doi: 10.1210/me.2012-1345 mend.endojournals.org 3
Statistical analysisGroups of data are presented as mean � SE. We performed
statistical comparisons with the unpaired 2-tailed Student’s ttest. A value of P � .05 was considered statistically significant.
Results
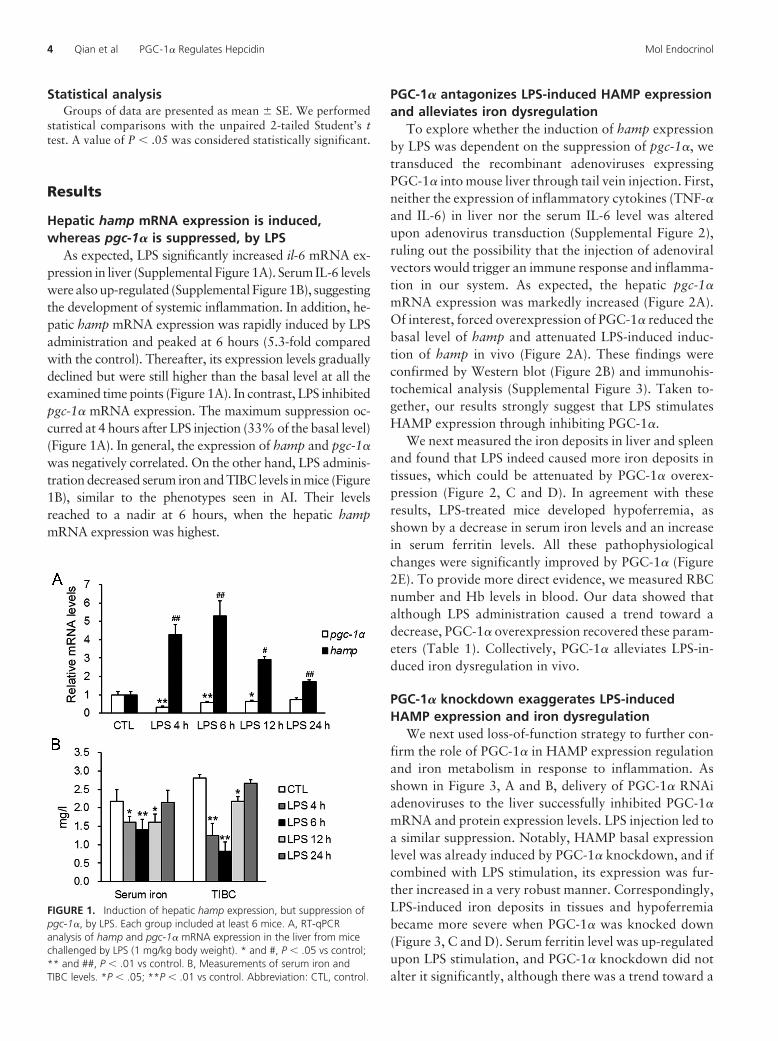
Hepatic hamp mRNA expression is induced,whereas pgc-1� is suppressed, by LPS
As expected, LPS significantly increased il-6 mRNA ex-pression in liver (Supplemental Figure 1A). Serum IL-6 levelswere also up-regulated (Supplemental Figure 1B), suggestingthe development of systemic inflammation. In addition, he-patic hamp mRNA expression was rapidly induced by LPSadministration and peaked at 6 hours (5.3-fold comparedwith the control). Thereafter, its expression levels graduallydeclined but were still higher than the basal level at all theexamined time points (Figure 1A). In contrast, LPS inhibitedpgc-1� mRNA expression. The maximum suppression oc-curred at 4 hours after LPS injection (33% of the basal level)(Figure 1A). In general, the expression of hamp and pgc-1�
was negatively correlated. On the other hand, LPS adminis-tration decreased serum iron and TIBC levels in mice (Figure1B), similar to the phenotypes seen in AI. Their levelsreached to a nadir at 6 hours, when the hepatic hampmRNA expression was highest.
PGC-1� antagonizes LPS-induced HAMP expressionand alleviates iron dysregulation
To explore whether the induction of hamp expressionby LPS was dependent on the suppression of pgc-1�, wetransduced the recombinant adenoviruses expressingPGC-1� into mouse liver through tail vein injection. First,neither the expression of inflammatory cytokines (TNF-�and IL-6) in liver nor the serum IL-6 level was alteredupon adenovirus transduction (Supplemental Figure 2),ruling out the possibility that the injection of adenoviralvectors would trigger an immune response and inflamma-tion in our system. As expected, the hepatic pgc-1�
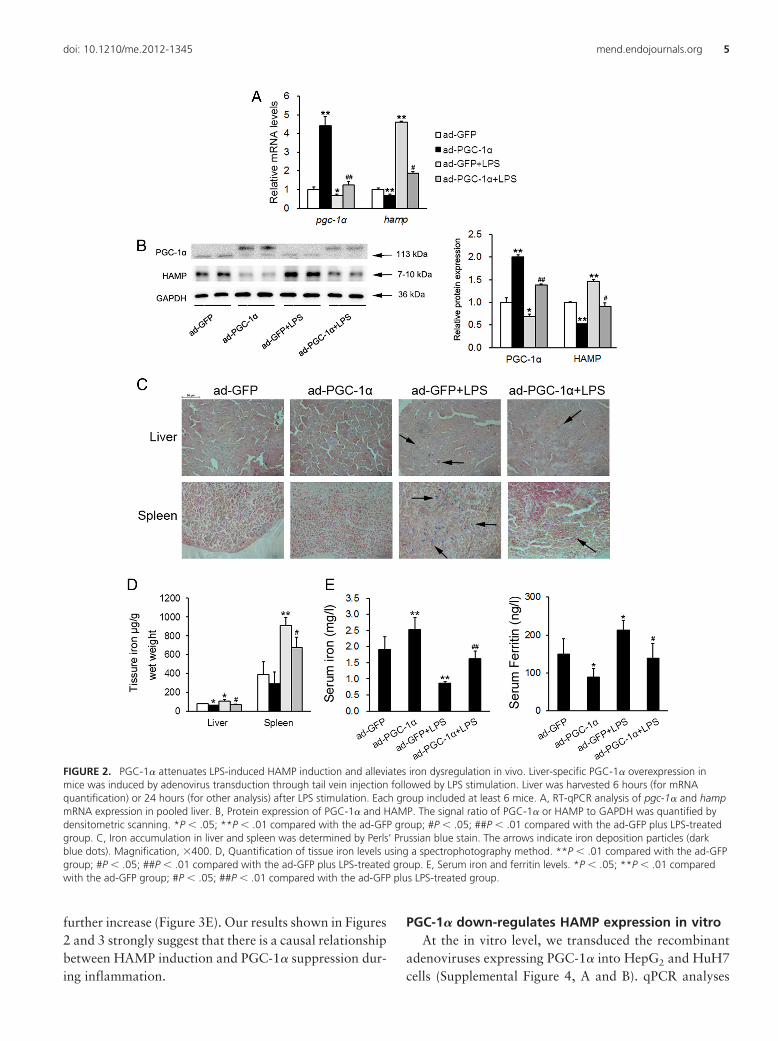
mRNA expression was markedly increased (Figure 2A).Of interest, forced overexpression of PGC-1� reduced thebasal level of hamp and attenuated LPS-induced induc-tion of hamp in vivo (Figure 2A). These findings wereconfirmed by Western blot (Figure 2B) and immunohis-tochemical analysis (Supplemental Figure 3). Taken to-gether, our results strongly suggest that LPS stimulatesHAMP expression through inhibiting PGC-1�.
We next measured the iron deposits in liver and spleenand found that LPS indeed caused more iron deposits intissues, which could be attenuated by PGC-1� overex-pression (Figure 2, C and D). In agreement with theseresults, LPS-treated mice developed hypoferremia, asshown by a decrease in serum iron levels and an increasein serum ferritin levels. All these pathophysiologicalchanges were significantly improved by PGC-1� (Figure2E). To provide more direct evidence, we measured RBCnumber and Hb levels in blood. Our data showed thatalthough LPS administration caused a trend toward adecrease, PGC-1� overexpression recovered these param-eters (Table 1). Collectively, PGC-1� alleviates LPS-in-duced iron dysregulation in vivo.
PGC-1� knockdown exaggerates LPS-inducedHAMP expression and iron dysregulation
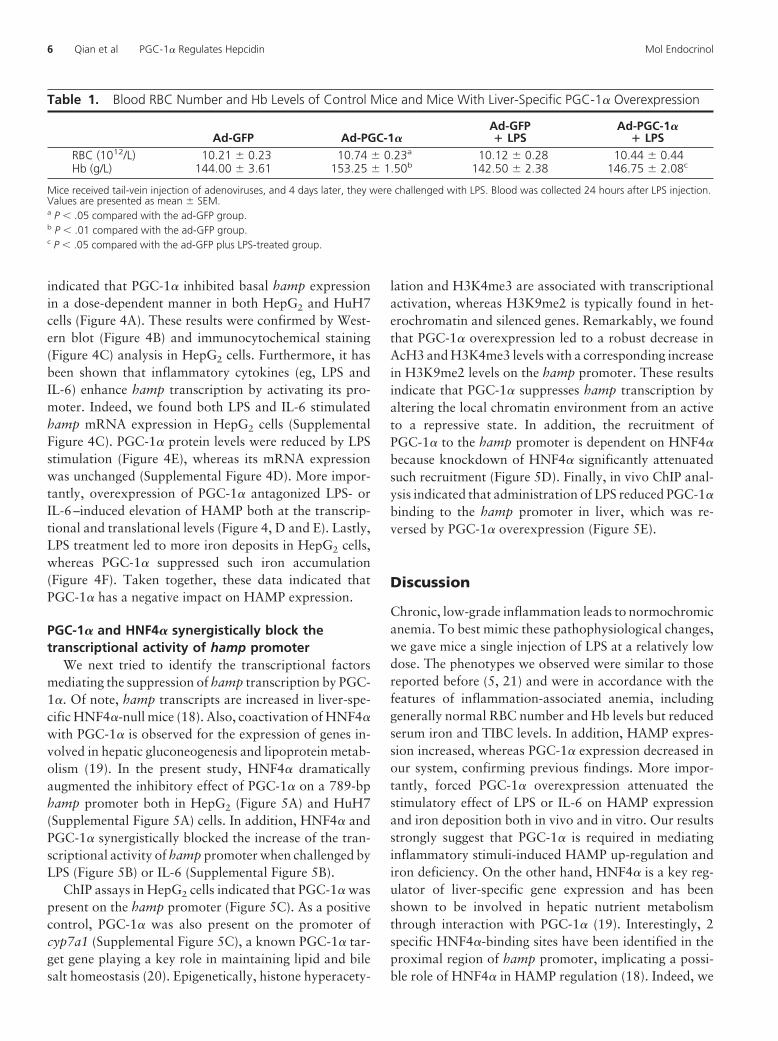
We next used loss-of-function strategy to further con-firm the role of PGC-1� in HAMP expression regulationand iron metabolism in response to inflammation. Asshown in Figure 3, A and B, delivery of PGC-1� RNAiadenoviruses to the liver successfully inhibited PGC-1�
mRNA and protein expression levels. LPS injection led toa similar suppression. Notably, HAMP basal expressionlevel was already induced by PGC-1� knockdown, and ifcombined with LPS stimulation, its expression was fur-ther increased in a very robust manner. Correspondingly,LPS-induced iron deposits in tissues and hypoferremiabecame more severe when PGC-1� was knocked down(Figure 3, C and D). Serum ferritin level was up-regulatedupon LPS stimulation, and PGC-1� knockdown did notalter it significantly, although there was a trend toward a
FIGURE 1. Induction of hepatic hamp expression, but suppression ofpgc-1�, by LPS. Each group included at least 6 mice. A, RT-qPCRanalysis of hamp and pgc-1� mRNA expression in the liver from micechallenged by LPS (1 mg/kg body weight). * and #, P � .05 vs control;** and ##, P � .01 vs control. B, Measurements of serum iron andTIBC levels. *P � .05; **P � .01 vs control. Abbreviation: CTL, control.
4 Qian et al PGC-1� Regulates Hepcidin Mol Endocrinol
further increase (Figure 3E). Our results shown in Figures2 and 3 strongly suggest that there is a causal relationshipbetween HAMP induction and PGC-1� suppression dur-ing inflammation.
PGC-1� down-regulates HAMP expression in vitroAt the in vitro level, we transduced the recombinant
adenoviruses expressing PGC-1� into HepG2 and HuH7cells (Supplemental Figure 4, A and B). qPCR analyses
FIGURE 2. PGC-1� attenuates LPS-induced HAMP induction and alleviates iron dysregulation in vivo. Liver-specific PGC-1� overexpression inmice was induced by adenovirus transduction through tail vein injection followed by LPS stimulation. Liver was harvested 6 hours (for mRNAquantification) or 24 hours (for other analysis) after LPS stimulation. Each group included at least 6 mice. A, RT-qPCR analysis of pgc-1� and hampmRNA expression in pooled liver. B, Protein expression of PGC-1� and HAMP. The signal ratio of PGC-1� or HAMP to GAPDH was quantified bydensitometric scanning. *P � .05; **P � .01 compared with the ad-GFP group; #P � .05; ##P � .01 compared with the ad-GFP plus LPS-treatedgroup. C, Iron accumulation in liver and spleen was determined by Perls’ Prussian blue stain. The arrows indicate iron deposition particles (darkblue dots). Magnification, �400. D, Quantification of tissue iron levels using a spectrophotography method. **P � .01 compared with the ad-GFPgroup; #P � .05; ##P � .01 compared with the ad-GFP plus LPS-treated group. E, Serum iron and ferritin levels. *P � .05; **P � .01 comparedwith the ad-GFP group; #P � .05; ##P � .01 compared with the ad-GFP plus LPS-treated group.
doi: 10.1210/me.2012-1345 mend.endojournals.org 5
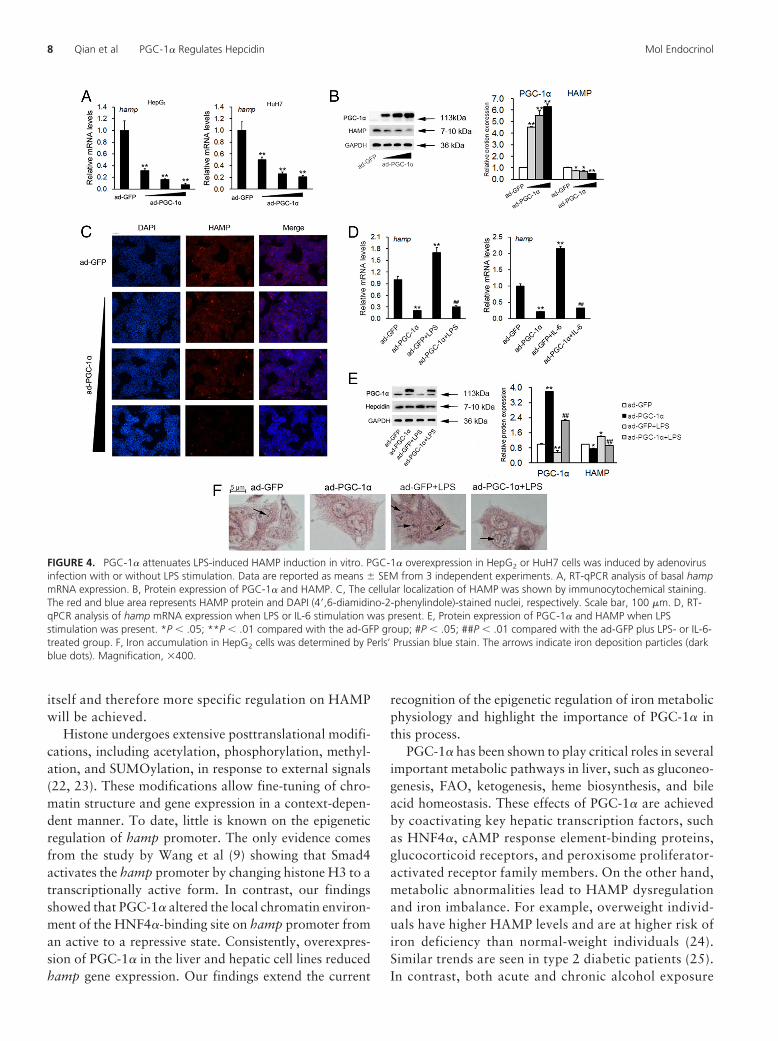
indicated that PGC-1� inhibited basal hamp expressionin a dose-dependent manner in both HepG2 and HuH7cells (Figure 4A). These results were confirmed by West-ern blot (Figure 4B) and immunocytochemical staining(Figure 4C) analysis in HepG2 cells. Furthermore, it hasbeen shown that inflammatory cytokines (eg, LPS andIL-6) enhance hamp transcription by activating its pro-moter. Indeed, we found both LPS and IL-6 stimulatedhamp mRNA expression in HepG2 cells (SupplementalFigure 4C). PGC-1� protein levels were reduced by LPSstimulation (Figure 4E), whereas its mRNA expressionwas unchanged (Supplemental Figure 4D). More impor-tantly, overexpression of PGC-1� antagonized LPS- orIL-6–induced elevation of HAMP both at the transcrip-tional and translational levels (Figure 4, D and E). Lastly,LPS treatment led to more iron deposits in HepG2 cells,whereas PGC-1� suppressed such iron accumulation(Figure 4F). Taken together, these data indicated thatPGC-1� has a negative impact on HAMP expression.
PGC-1� and HNF4� synergistically block thetranscriptional activity of hamp promoter
We next tried to identify the transcriptional factorsmediating the suppression of hamp transcription by PGC-1�. Of note, hamp transcripts are increased in liver-spe-cific HNF4�-null mice (18). Also, coactivation of HNF4�
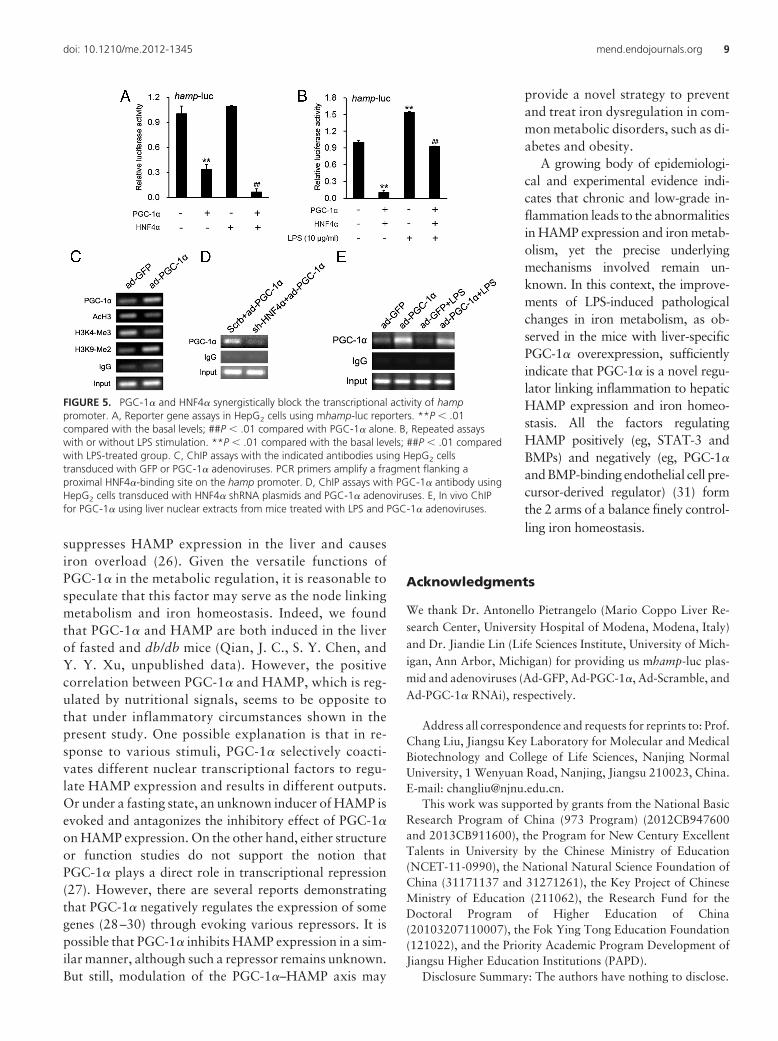
with PGC-1� is observed for the expression of genes in-volved in hepatic gluconeogenesis and lipoprotein metab-olism (19). In the present study, HNF4� dramaticallyaugmented the inhibitory effect of PGC-1� on a 789-bphamp promoter both in HepG2 (Figure 5A) and HuH7(Supplemental Figure 5A) cells. In addition, HNF4� andPGC-1� synergistically blocked the increase of the tran-scriptional activity of hamp promoter when challenged byLPS (Figure 5B) or IL-6 (Supplemental Figure 5B).
ChIP assays in HepG2 cells indicated that PGC-1� waspresent on the hamp promoter (Figure 5C). As a positivecontrol, PGC-1� was also present on the promoter ofcyp7a1 (Supplemental Figure 5C), a known PGC-1� tar-get gene playing a key role in maintaining lipid and bilesalt homeostasis (20). Epigenetically, histone hyperacety-
lation and H3K4me3 are associated with transcriptionalactivation, whereas H3K9me2 is typically found in het-erochromatin and silenced genes. Remarkably, we foundthat PGC-1� overexpression led to a robust decrease inAcH3 and H3K4me3 levels with a corresponding increasein H3K9me2 levels on the hamp promoter. These resultsindicate that PGC-1� suppresses hamp transcription byaltering the local chromatin environment from an activeto a repressive state. In addition, the recruitment ofPGC-1� to the hamp promoter is dependent on HNF4�
because knockdown of HNF4� significantly attenuatedsuch recruitment (Figure 5D). Finally, in vivo ChIP anal-ysis indicated that administration of LPS reduced PGC-1�
binding to the hamp promoter in liver, which was re-versed by PGC-1� overexpression (Figure 5E).
Discussion
Chronic, low-grade inflammation leads to normochromicanemia. To best mimic these pathophysiological changes,we gave mice a single injection of LPS at a relatively lowdose. The phenotypes we observed were similar to thosereported before (5, 21) and were in accordance with thefeatures of inflammation-associated anemia, includinggenerally normal RBC number and Hb levels but reducedserum iron and TIBC levels. In addition, HAMP expres-sion increased, whereas PGC-1� expression decreased inour system, confirming previous findings. More impor-tantly, forced PGC-1� overexpression attenuated thestimulatory effect of LPS or IL-6 on HAMP expressionand iron deposition both in vivo and in vitro. Our resultsstrongly suggest that PGC-1� is required in mediatinginflammatory stimuli-induced HAMP up-regulation andiron deficiency. On the other hand, HNF4� is a key reg-ulator of liver-specific gene expression and has beenshown to be involved in hepatic nutrient metabolismthrough interaction with PGC-1� (19). Interestingly, 2specific HNF4�-binding sites have been identified in theproximal region of hamp promoter, implicating a possi-ble role of HNF4� in HAMP regulation (18). Indeed, we
Table 1. Blood RBC Number and Hb Levels of Control Mice and Mice With Liver-Specific PGC-1� Overexpression
Ad-GFP Ad-PGC-1�Ad-GFP� LPS
Ad-PGC-1�� LPS
RBC (1012/L) 10.21 � 0.23 10.74 � 0.23a 10.12 � 0.28 10.44 � 0.44Hb (g/L) 144.00 � 3.61 153.25 � 1.50b 142.50 � 2.38 146.75 � 2.08c
Mice received tail-vein injection of adenoviruses, and 4 days later, they were challenged with LPS. Blood was collected 24 hours after LPS injection.Values are presented as mean � SEM.a P � .05 compared with the ad-GFP group.b P � .01 compared with the ad-GFP group.c P � .05 compared with the ad-GFP plus LPS-treated group.
6 Qian et al PGC-1� Regulates Hepcidin Mol Endocrinol
found that PGC-1� and HNF4� coordinately suppressedLPS-induced increase in the transcriptional activity ofhamp promoter. This may be due to the recovery of thedecreased recruitment of PGC-1� to the HNF4�-bindingsite when inflammatory cytokines were present (16).
Previous studies have demonstrated the importance ofSTAT-3 and BMPs in regulating HAMP expression andiron metabolism in response to inflammatory stimuli.
However, as multifunctional and relatively upstreamfactors, STAT-3 and BMPs also participate in control-ling other critical physiological processes including cellsurvival, differentiation, metabolism, and tumor angio-genesis. This will bring great difficulties when takingthese factors as targets to regulate HAMP. Such obsta-cles may be overcome by aiming PGC-1�, the down-stream target of STAT-3, without disturbing STAT-3
FIGURE 3. PGC-1� knockdown exaggerates LPS-induced HAMP expression and iron dysregulation in vivo. Liver-specific PGC-1� knockdown inmice was induced by PGC-1� RNAi adenovirus transduction through tail vein injection followed by LPS stimulation. Adenoviruses expressing ascramble siRNA sequence were used as a negative control. Liver was harvested 6 hours (for mRNA quantification) or 24 hours (for other analysis)after LPS stimulation. Each group included at least 6 mice. The results are presented as described in Figure 2.
doi: 10.1210/me.2012-1345 mend.endojournals.org 7
itself and therefore more specific regulation on HAMPwill be achieved.
Histone undergoes extensive posttranslational modifi-cations, including acetylation, phosphorylation, methyl-ation, and SUMOylation, in response to external signals(22, 23). These modifications allow fine-tuning of chro-matin structure and gene expression in a context-depen-dent manner. To date, little is known on the epigeneticregulation of hamp promoter. The only evidence comesfrom the study by Wang et al (9) showing that Smad4activates the hamp promoter by changing histone H3 to atranscriptionally active form. In contrast, our findingsshowed that PGC-1� altered the local chromatin environ-ment of the HNF4�-binding site on hamp promoter froman active to a repressive state. Consistently, overexpres-sion of PGC-1� in the liver and hepatic cell lines reducedhamp gene expression. Our findings extend the current
recognition of the epigenetic regulation of iron metabolicphysiology and highlight the importance of PGC-1� inthis process.
PGC-1� has been shown to play critical roles in severalimportant metabolic pathways in liver, such as gluconeo-genesis, FAO, ketogenesis, heme biosynthesis, and bileacid homeostasis. These effects of PGC-1� are achievedby coactivating key hepatic transcription factors, suchas HNF4�, cAMP response element-binding proteins,glucocorticoid receptors, and peroxisome proliferator-activated receptor family members. On the other hand,metabolic abnormalities lead to HAMP dysregulationand iron imbalance. For example, overweight individ-uals have higher HAMP levels and are at higher risk ofiron deficiency than normal-weight individuals (24).Similar trends are seen in type 2 diabetic patients (25).In contrast, both acute and chronic alcohol exposure
FIGURE 4. PGC-1� attenuates LPS-induced HAMP induction in vitro. PGC-1� overexpression in HepG2 or HuH7 cells was induced by adenovirusinfection with or without LPS stimulation. Data are reported as means � SEM from 3 independent experiments. A, RT-qPCR analysis of basal hampmRNA expression. B, Protein expression of PGC-1� and HAMP. C, The cellular localization of HAMP was shown by immunocytochemical staining.The red and blue area represents HAMP protein and DAPI (4=,6-diamidino-2-phenylindole)-stained nuclei, respectively. Scale bar, 100 �m. D, RT-qPCR analysis of hamp mRNA expression when LPS or IL-6 stimulation was present. E, Protein expression of PGC-1� and HAMP when LPSstimulation was present. *P � .05; **P � .01 compared with the ad-GFP group; #P � .05; ##P � .01 compared with the ad-GFP plus LPS- or IL-6-treated group. F, Iron accumulation in HepG2 cells was determined by Perls’ Prussian blue stain. The arrows indicate iron deposition particles (darkblue dots). Magnification, �400.
8 Qian et al PGC-1� Regulates Hepcidin Mol Endocrinol
suppresses HAMP expression in the liver and causesiron overload (26). Given the versatile functions ofPGC-1� in the metabolic regulation, it is reasonable tospeculate that this factor may serve as the node linkingmetabolism and iron homeostasis. Indeed, we foundthat PGC-1� and HAMP are both induced in the liverof fasted and db/db mice (Qian, J. C., S. Y. Chen, andY. Y. Xu, unpublished data). However, the positivecorrelation between PGC-1� and HAMP, which is reg-ulated by nutritional signals, seems to be opposite tothat under inflammatory circumstances shown in thepresent study. One possible explanation is that in re-sponse to various stimuli, PGC-1� selectively coacti-vates different nuclear transcriptional factors to regu-late HAMP expression and results in different outputs.Or under a fasting state, an unknown inducer of HAMP isevoked and antagonizes the inhibitory effect of PGC-1�
on HAMP expression. On the other hand, either structureor function studies do not support the notion thatPGC-1� plays a direct role in transcriptional repression(27). However, there are several reports demonstratingthat PGC-1� negatively regulates the expression of somegenes (28–30) through evoking various repressors. It ispossible that PGC-1� inhibits HAMP expression in a sim-ilar manner, although such a repressor remains unknown.But still, modulation of the PGC-1�–HAMP axis may
provide a novel strategy to preventand treat iron dysregulation in com-mon metabolic disorders, such as di-abetes and obesity.
A growing body of epidemiologi-cal and experimental evidence indi-cates that chronic and low-grade in-flammation leads to the abnormalitiesin HAMP expression and iron metab-olism, yet the precise underlyingmechanisms involved remain un-known. In this context, the improve-ments of LPS-induced pathologicalchanges in iron metabolism, as ob-served in the mice with liver-specificPGC-1� overexpression, sufficientlyindicate that PGC-1� is a novel regu-lator linking inflammation to hepaticHAMP expression and iron homeo-stasis. All the factors regulatingHAMP positively (eg, STAT-3 andBMPs) and negatively (eg, PGC-1�
and BMP-binding endothelial cell pre-cursor-derived regulator) (31) formthe 2 arms of a balance finely control-ling iron homeostasis.
Acknowledgments
We thank Dr. Antonello Pietrangelo (Mario Coppo Liver Re-search Center, University Hospital of Modena, Modena, Italy)and Dr. Jiandie Lin (Life Sciences Institute, University of Mich-igan, Ann Arbor, Michigan) for providing us mhamp-luc plas-mid and adenoviruses (Ad-GFP, Ad-PGC-1�, Ad-Scramble, andAd-PGC-1� RNAi), respectively.
Address all correspondence and requests for reprints to: Prof.Chang Liu, Jiangsu Key Laboratory for Molecular and MedicalBiotechnology and College of Life Sciences, Nanjing NormalUniversity, 1 Wenyuan Road, Nanjing, Jiangsu 210023, China.E-mail: [email protected].
This work was supported by grants from the National BasicResearch Program of China (973 Program) (2012CB947600and 2013CB911600), the Program for New Century ExcellentTalents in University by the Chinese Ministry of Education(NCET-11-0990), the National Natural Science Foundation ofChina (31171137 and 31271261), the Key Project of ChineseMinistry of Education (211062), the Research Fund for theDoctoral Program of Higher Education of China(20103207110007), the Fok Ying Tong Education Foundation(121022), and the Priority Academic Program Development ofJiangsu Higher Education Institutions (PAPD).
Disclosure Summary: The authors have nothing to disclose.
FIGURE 5. PGC-1� and HNF4� synergistically block the transcriptional activity of hamppromoter. A, Reporter gene assays in HepG2 cells using mhamp-luc reporters. **P � .01compared with the basal levels; ##P � .01 compared with PGC-1� alone. B, Repeated assayswith or without LPS stimulation. **P � .01 compared with the basal levels; ##P � .01 comparedwith LPS-treated group. C, ChIP assays with the indicated antibodies using HepG2 cellstransduced with GFP or PGC-1� adenoviruses. PCR primers amplify a fragment flanking aproximal HNF4�-binding site on the hamp promoter. D, ChIP assays with PGC-1� antibody usingHepG2 cells transduced with HNF4� shRNA plasmids and PGC-1� adenoviruses. E, In vivo ChIPfor PGC-1� using liver nuclear extracts from mice treated with LPS and PGC-1� adenoviruses.
doi: 10.1210/me.2012-1345 mend.endojournals.org 9
References
1. Ganz T. Hepcidin and its role in regulating systemic iron metabo-lism. Hematology. 2006;2006:29–35.
2. De Domenico I, Ward DM, Langelier C, et al. The molecular mech-anism of hepcidin-mediated ferroportin downregulation. Mol BiolCell. 2007;18:2569–2578.
3. Ganz T, Nemeth E. Hepcidin and iron homeostasis. Biochim Bio-phys Acta. 2012;1823:1434–1443.
4. Nemeth E, Rivera S, Gabayan V, Keller C, Taudorf S, Pedersen BK,Ganz T. IL-6 mediates hypoferremia of inflammation by inducingthe synthesis of the iron regulatory hormone hepcidin. J Clin Invest.2004;113:1271–1276.
5. Kemna E, Pickkers P, Nemeth E, van der Hoeven H, Swinkels D.Time-course analysis of hepcidin, serum iron, and plasma cytokinelevels in humans injected with LPS. Blood. 2005;106:1864–1866.
6. Roy CN, Mak HH, Akpan I, Losyev G, Zurakowski D, AndrewsNC. Hepcidin antimicrobial peptide transgenic mice exhibit fea-tures of the anemia of inflammation. Blood. 2007;109:4038–4044.
7. Wrighting DM, Andrews NC. Interleukin-6 induces hepcidin ex-pression through STAT3. Blood. 2006;108:3204–3209.
8. Viatte L, Vaulont S. Hepcidin, the iron watcher. Biochimie. 2009;91:1223–1228.
9. Wang RH, Li C, Xu X, et al. A role of SMAD4 in iron metabolismthrough the positive regulation of hepcidin expression. Cell Metab.2005;2:399–409.
10. Papanikolaou G, Samuels ME, Ludwig EH, et al. Mutations inHFE2 cause iron overload in chromosome 1q-linked juvenile hemo-chromatosis. Nat Genet. 2004;36:77–82.
11. Huang FW, Pinkus JL, Pinkus GS, Fleming MD, Andrews NC. Amouse model of juvenile hemochromatosis. J Clin Invest. 2005;115:2187–2191.
12. Liu C, Lin JD. PGC-1 coactivators in the control of energy metab-olism. Acta Biochim Biophys Sin (Shanghai). 2011;43:248–257.
13. Maitra U, Chang S, Singh N, Li L. Molecular mechanism underly-ing the suppression of lipid oxidation during endotoxemia. MolImmunol. 2009;47:420–425.
14. Handschin C. Peroxisome proliferator-activated receptor-� coacti-vator-1� in muscle links metabolism to inflammation. Clin ExpPharmacol Physiol. 2009;36:1139–1143.
15. Handschin C, Choi CS, Chin S, et al. Abnormal glucose homeosta-sis in skeletal muscle-specific PGC-1� knockout mice reveals skel-etal muscle-pancreatic �-cell crosstalk. J Clin Invest. 2007;117:3463–3474.
16. Wang Z, Burke PA. Modulation of hepatocyte nuclear factor-4�
function by the peroxisome-proliferator-activated receptor-� co-activator-1� in the acute-phase response. Biochem J. 2008;415:289–296.
17. Nie Y, Erion DM, Yuan Z, et al. STAT3 inhibition of gluconeogen-esis is downregulated by SirT1. Nat Cell Biol. 2009;11:492–500.
18. Courselaud B, Pigeon C, Inoue Y, et al. C/EBP� regulates hepatictranscription of hepcidin, an antimicrobial peptide and regulator ofiron metabolism. Cross-talk between C/EBP pathway and iron me-tabolism. J Biol Chem. 2002;277:41163–41170.
19. Rhee J, Inoue Y, Yoon JC, et al. Regulation of hepatic fastingresponse by PPAR� coactivator-1� (PGC-1): requirement for hepa-tocyte nuclear factor 4� in gluconeogenesis. Proc Natl Acad Sci U SA. 2003;100:4012–4017.
20. Li T, Chiang J. Mechanism of rifampicin and pregnane X receptorinhibition of human cholesterol 7�-hydroxylase gene transcription.Am J Physiol Gastrointest Liver Physiol. 2005;288:G74–G84.
21. Wang Q, Du F, Qian ZM, et al. Lipopolysaccharide induces asignificant increase in expression of iron regulatory hormone hep-cidin in the cortex and substantia nigra in rat brain. Endocrinology.2008;149:3920–3925.
22. Strahl BD, Allis CD. The language of covalent histone modifica-tions. Nature. 2000;403:41–45.
23. Berger SL. An embarrassment of niches: the many covalent modi-fications of histones in transcriptional regulation. Oncogene. 2001;20:3007–3013.
24. Aeberli I, Hurrell RF, Zimmermann MB. Overweight children havehigher circulating hepcidin concentrations and lower iron status buthave dietary iron intakes and bioavailability comparable with nor-mal weight children. Int J Obes (Lond). 2009;33:1111–1117.
25. Bekri S, Gual P, Anty R, et al. Increased adipose tissue expression ofhepcidin in severe obesity is independent from diabetes and NASH.Gastroenterology. 2006;131:946–947.
26. Harrison-Findik DD, Klein E, Crist C, Evans J, Timchenko N,Gollan J. Iron-mediated regulation of liver hepcindin expression inrats and mice is abolished by alcohol. Hepatology. 2007;46:1979–1985.
27. Spiegelman BM, Heinrich R. Biological control through regulatedtranscriptional coactivators. Cell. 2004;119:157–167.
28. Zhang Y, Castellani LW, Sinal CJ, Gonzalez FJ, Edwards PA. Per-oxisome proliferator-activated receptor-� coactivator 1� (PGC-1�)regulates triglyceride metabolism by activation of the nuclear re-ceptor FXR. Genes Dev. 2004;18:157–169.
29. Jeong JH, Cho S, Pak YK. Sterol-independent repression of lowdensity lipoprotein receptor promoter by peroxisome proliferatoractivated receptor � coactivator-1� (PGC-1�) Exp Mol Med. 2009;41:406–416.
30. Estall JL, Ruas JL, Choi CS, et al. PGC-1� negatively regulateshepatic FGF21 expression by modulating the heme/Rev-Erb(�)axis. Proc Natl Acad Sci U S A. 2009;106:22510–22515.
31. Patel N, Masaratana P, Diaz-Castro J, et al. BMPER protein is anegative regulator of hepcidin and is up-regulated in hypotransfer-rinemic mice. J Biol Chem. 2012;287:4099–4106.
10 Qian et al PGC-1� Regulates Hepcidin Mol Endocrinol
Top Related