


γλώσσες
Σελίδες
Νομικός


Adam J. FleisherDavid W. Pratt
University of Pittsburgh
Alessandro CembranJiali Gao
University of Minnesota
Charge redistribution in theβ-naphthol-water complex as measured by high resolution Stark spectroscopy in the gas phase.
MG-04
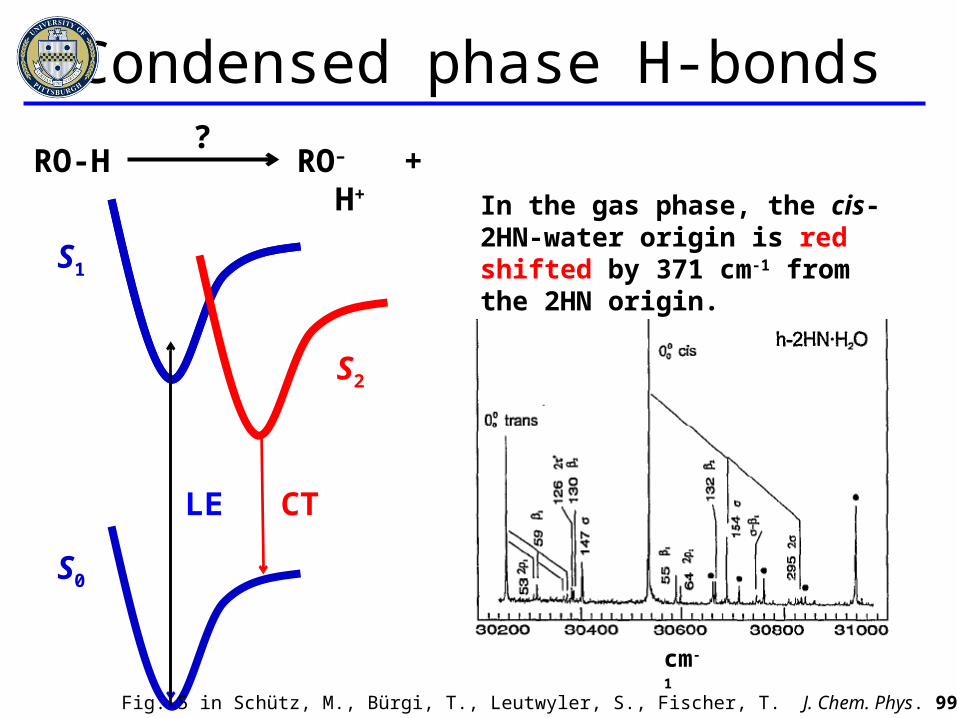
Condensed phase H-bonds
S0
S1
S2
RO-H RO– + H+?
LE CT
Fig. 5 in Schütz, M., Bürgi, T., Leutwyler, S., Fischer, T. J. Chem. Phys. 99, 1469, (1993).
In the gas phase, the cis-2HN-water origin is red shifted by 371 cm-1 from the 2HN origin.
cm-1
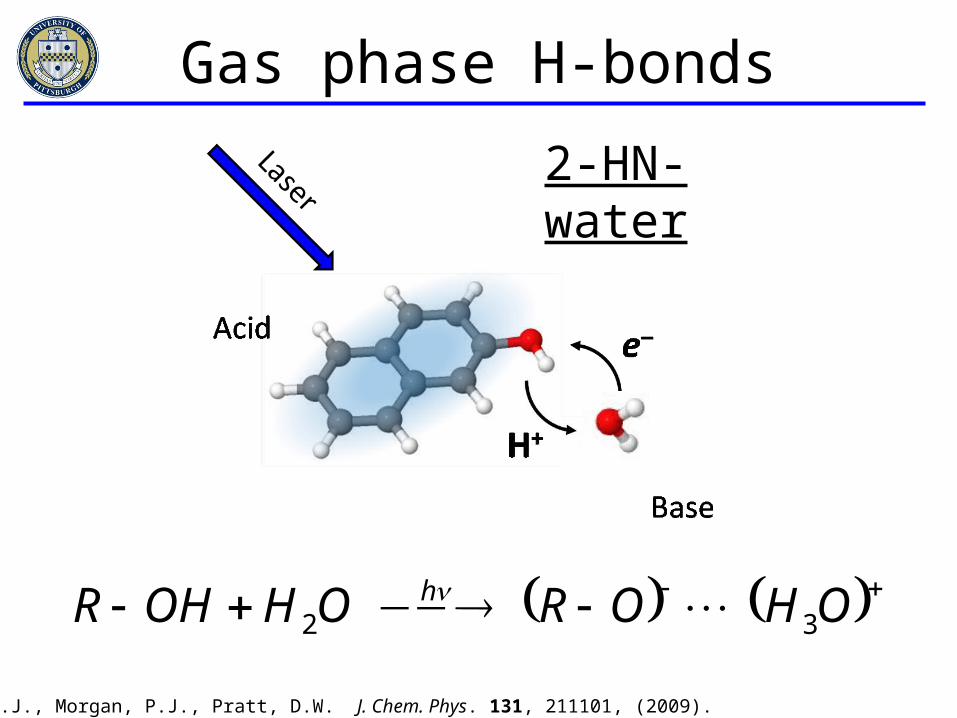
OHOROHOHR h32
Fleisher, A.J., Morgan, P.J., Pratt, D.W. J. Chem. Phys. 131, 211101, (2009).
Gas phase H-bonds
2-HN-water
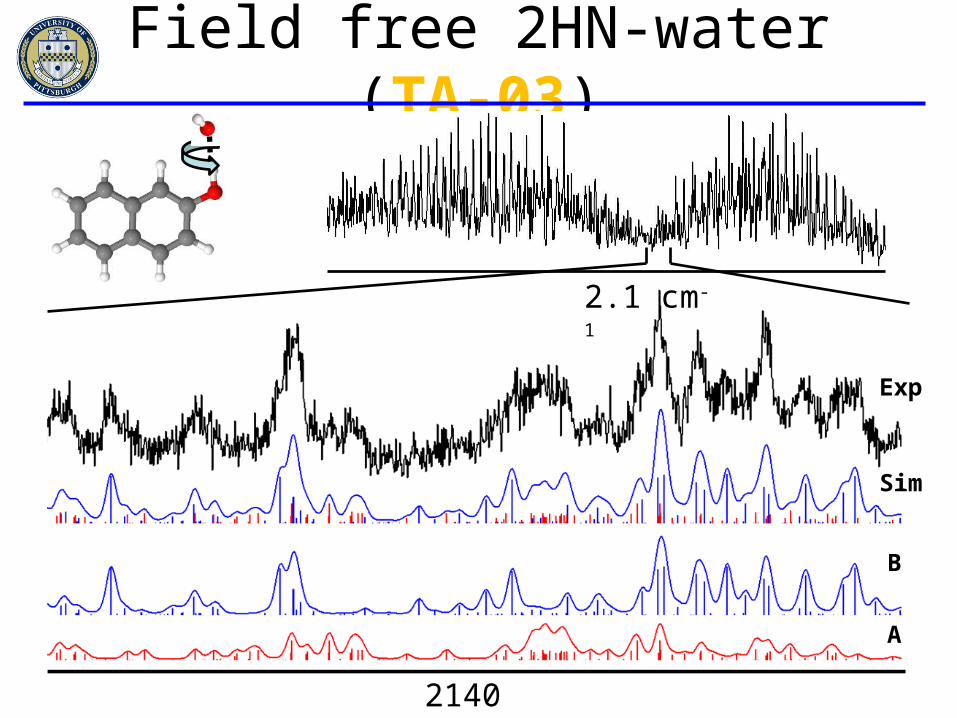
Field free 2HN-water (TA-03)
B
A
Sim
Exp
2.1 cm-1
2140 MHz
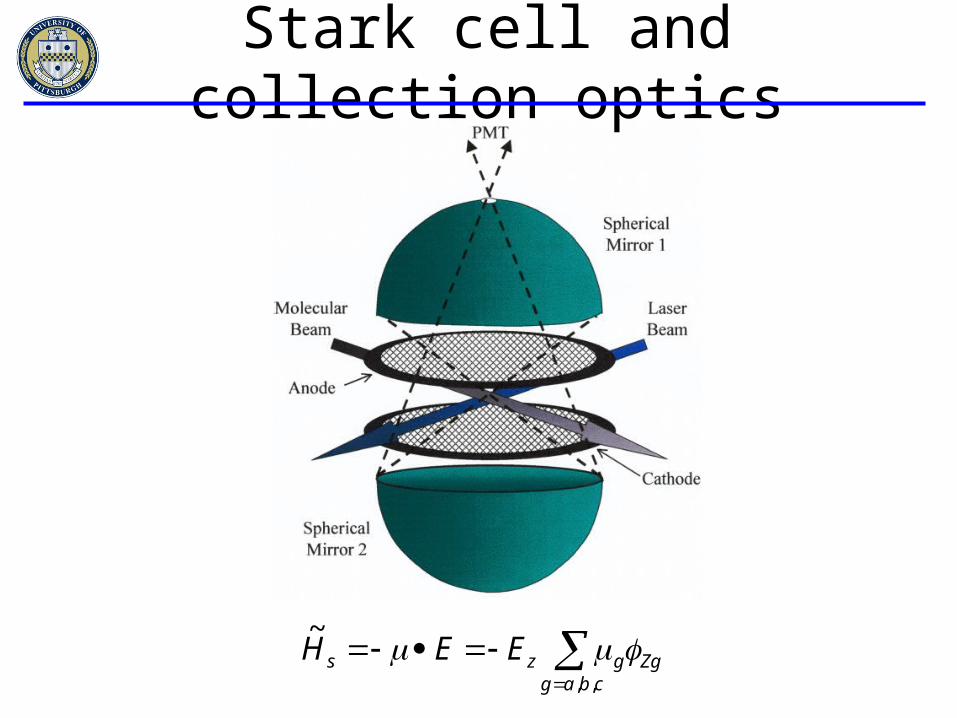
Stark cell and collection optics
cbag
Zggzs EEH,,
~

30901.4 30904.7 cm-1
0.04 cm-1
0 V/cm
846 V/cm
1776 V/cm
Stark effect in 2-naphthol
Fleisher, A.J., Morgan, P.J., Pratt, D.W. J. Chem. Phys. 131, 211101, (2009).

2-HN-water Stark spectra
2 cm-1
0 V/cm
169 V/cm
846 V/cm
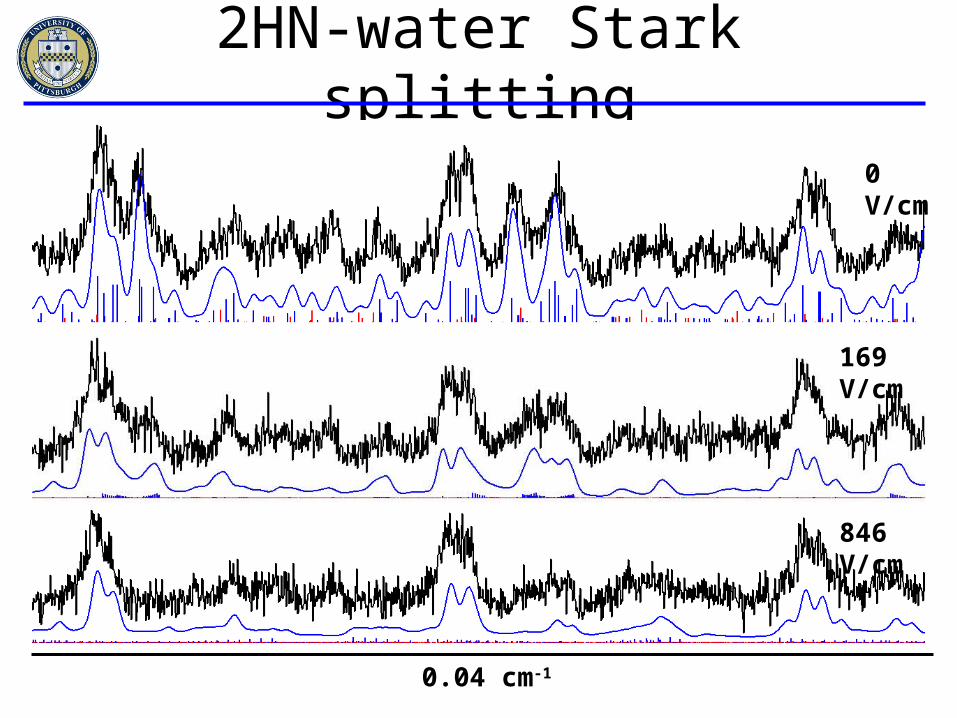
2HN-water Stark splitting
0 V/cm
169 V/cm
846 V/cm
0.04 cm-1
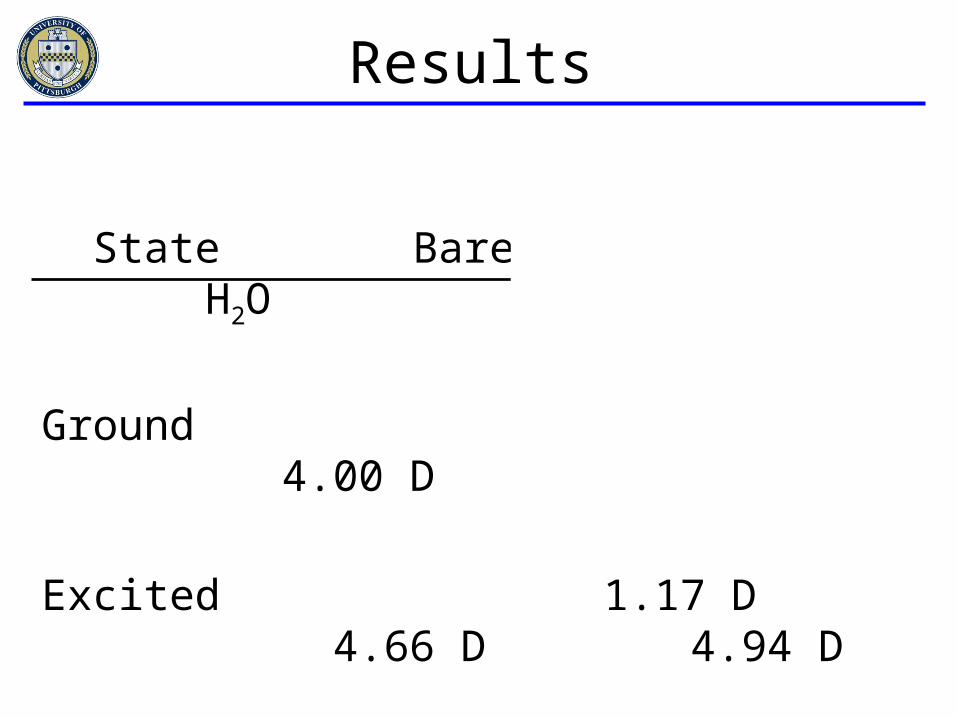
Results
State Bare Molecule H2O NH3
Ground 1.01 D 4.00 D 3.89 D
Excited 1.17 D 4.66 D 4.94 D
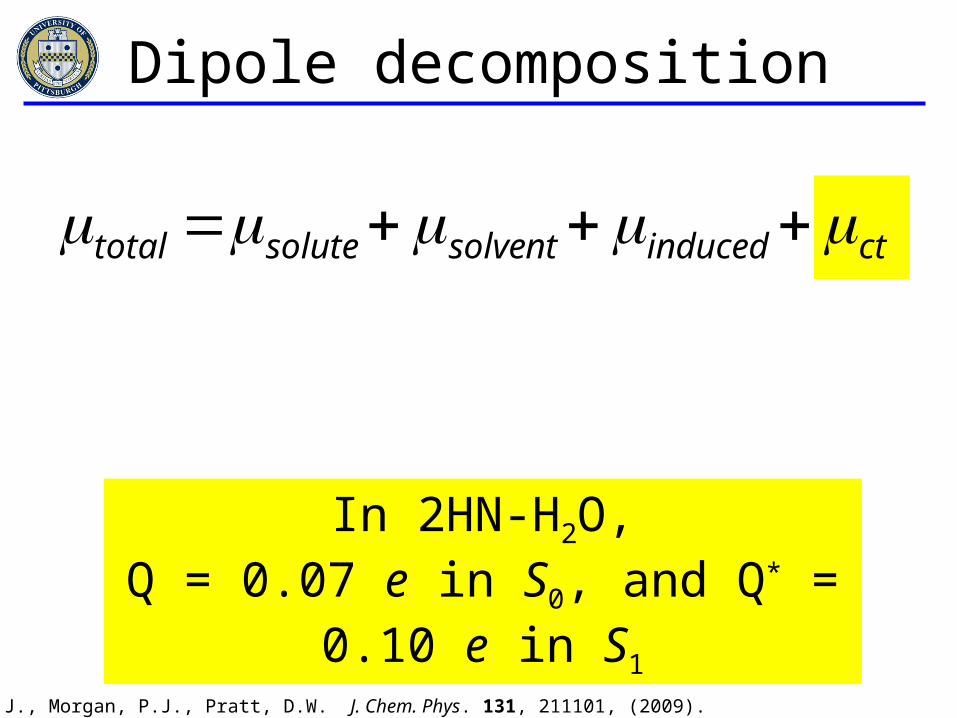
Qdct ctinducedsolventsolutetotal
In 2HN-H2O,Q = 0.07 e in S0, and Q* = 0.10 e in S1
Dipole decomposition
Fleisher, A.J., Morgan, P.J., Pratt, D.W. J. Chem. Phys. 131, 211101, (2009).
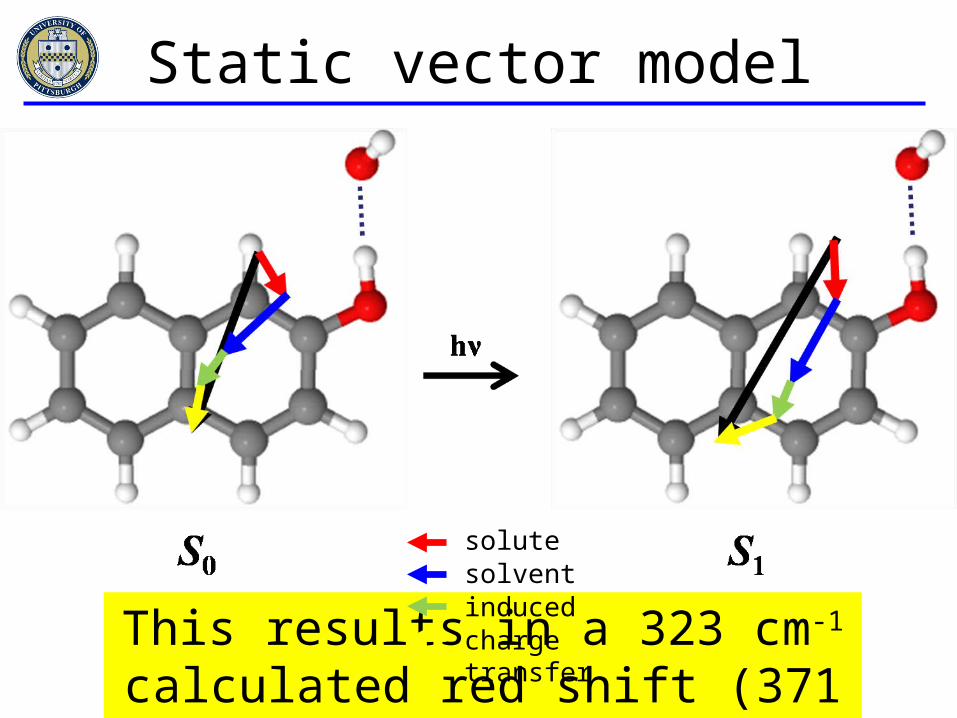
This results in a 323 cm-1 calculated red shift (371 cm-1 in experiment).
Static vector model
solutesolventinducedcharge transfer

BLW-ED method
Scheme 1 in Mo, Y., Gao, J., Peyerimhoff, S.D. J. Chem. Phys., 112, 5530 (2000).BLW-ED reported using B3LYP/6-31+G* (geometries were optimized using M06-2X/6-31+G*).
S0 c2HNA(cm-1)
BLW|%|
static|%|
c2HNW(cm-1)
BLW|%|
static|%|
ΔEr +420 ?
ΔEstat -730 20 15 ? ? 22
ΔEpol -980 27 5 ? ? 14
ΔEct -1900 53 80 ? ? 64
ΔEint -3200 ?
ammonia, water
β-naphthol
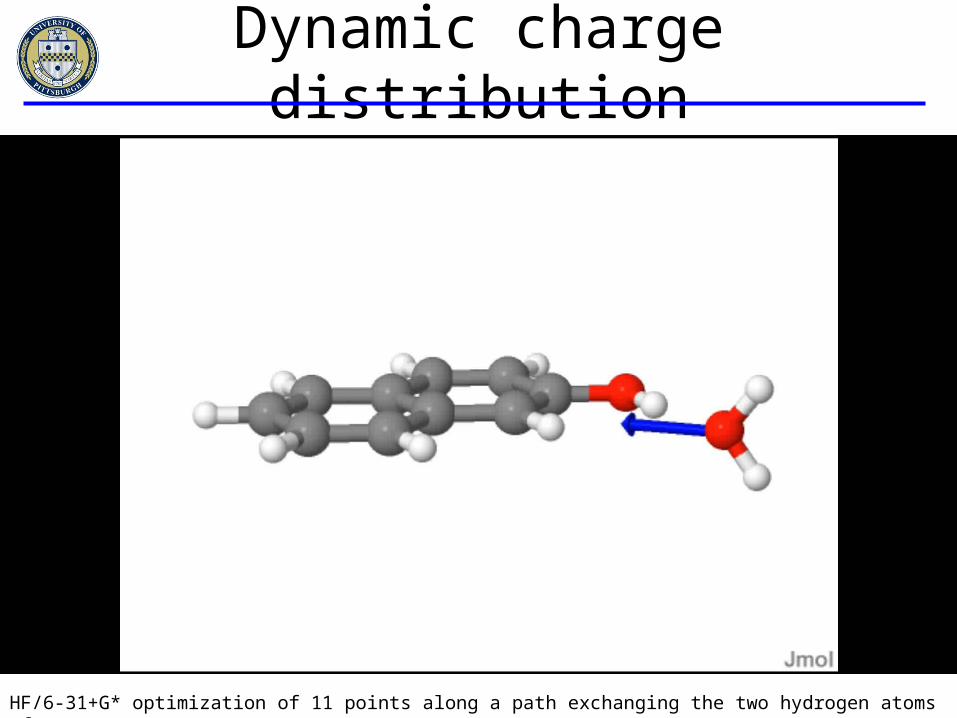
Dynamic charge distribution
HF/6-31+G* optimization of 11 points along a path exchanging the two hydrogen atoms of water.
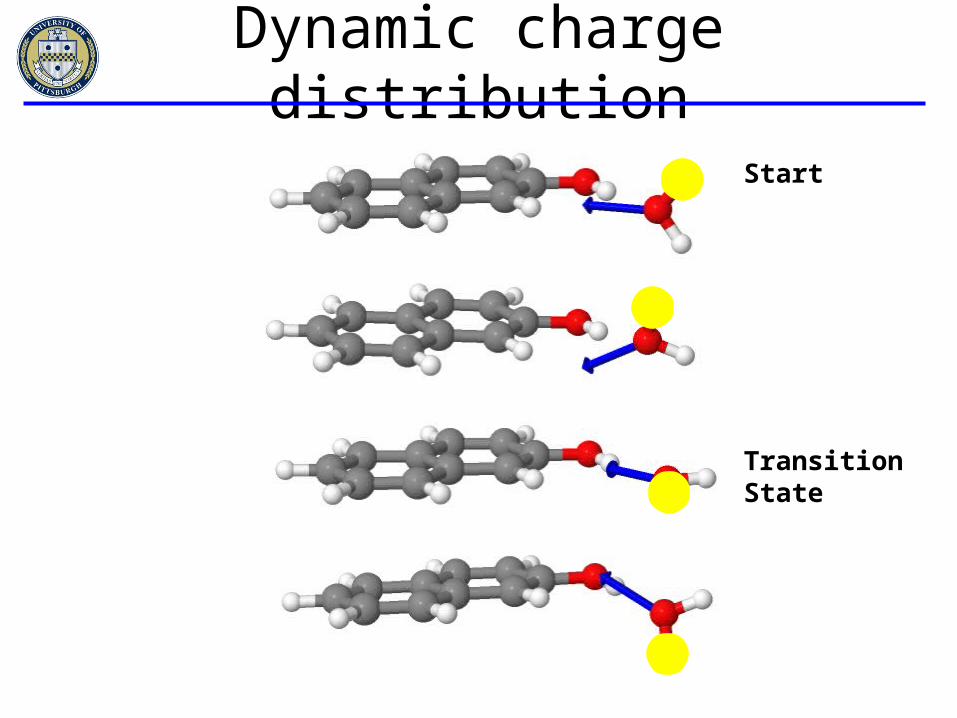
Dynamic charge distribution
Start
Transition State
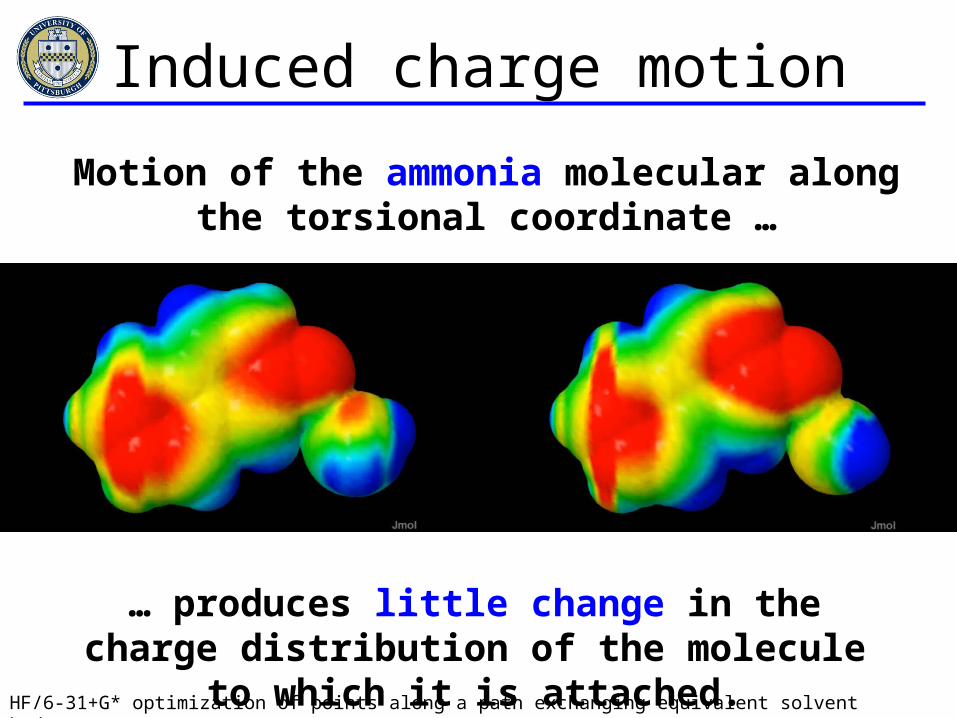
Induced charge motion
… produces a large change in the charge distribution of the molecule to which it is attached.
Motion of the water molecular along the torsional coordinate …
Motion of the ammonia molecular along the torsional coordinate …
… produces little change in the charge distribution of the molecule to which it is attached.
HF/6-31+G* optimization of points along a path exchanging equivalent solvent hydrogens.
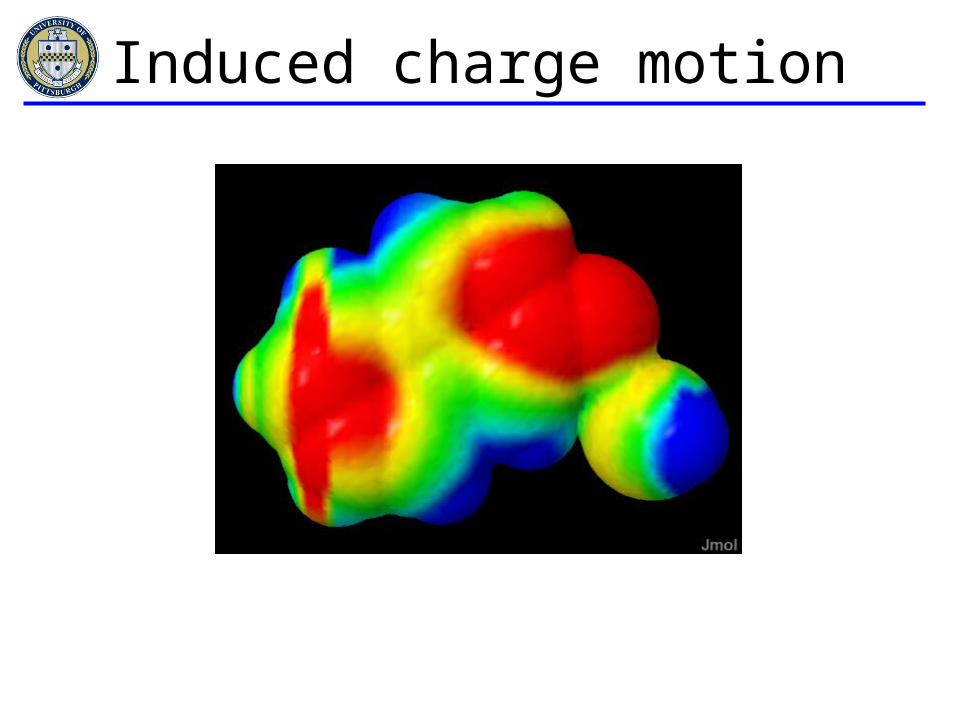
Induced charge motion

Time-varying dipole field (II)
2
0
2 V
V
2
0
2
)coordinate (torsional

• A static model of energy and dipole moment decomposition based on electrostatic contributions was used to explain the experimentally observed red shift in 2HNW.
• The block-localized wavefunction energy decomposition (BLW-ED) method was used to investigate electrostatic, induced, and charge transfer interactions.
• Future work on understanding the importance of the time varying nature of the water dipole must be included.– Important to the understanding of condensed phase water systems.
Summary

• Justin Young
• Philip Morgan• Diane Miller
Marquette University
• Ryan Bird• Jessica Thomas• Casey Clements• Patrick Walsh
Acknowledgments
• Dr. David W. PrattUniversity of Pittsburgh
• Dr. David PlusquellicNIST, jb95 development
• Dr. David BorstIntel, Stark development

2
0
2b
a
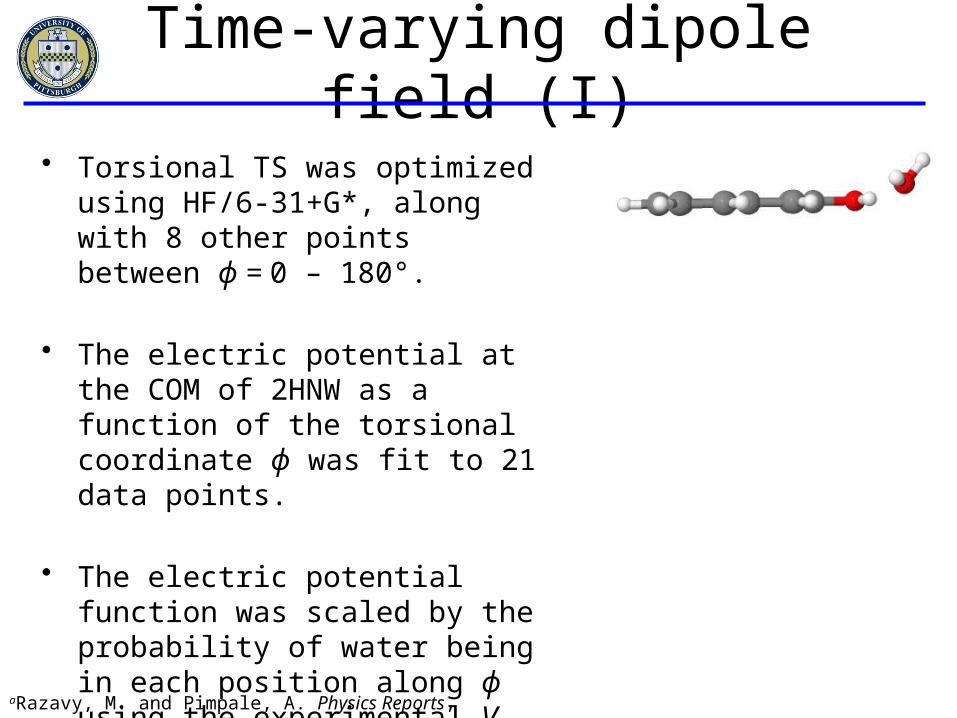
Time-varying dipole field (I)
2cos12
1cos12
2
1
c
cV
• Torsional TS was optimized using HF/6-31+G*, along with 8 other points between ϕ = 0 – 180°.
• The electric potential at the COM of 2HNW as a function of the torsional coordinate ϕ was fit to 21 data points.
• The electric potential function was scaled by the probability of water being in each position along ϕ using the experimental V2 = 206 cm-1, compared to a barrierless torsion.a
aRazavy, M. and Pimpale, A. Physics Reports, 168, 305 (1988).

H-bond ‘jumps’ in bulk water
Fig. 1 in Ji, M., Odelius, M., Gaffney, K.J. Science. 328, 1003, (2010).
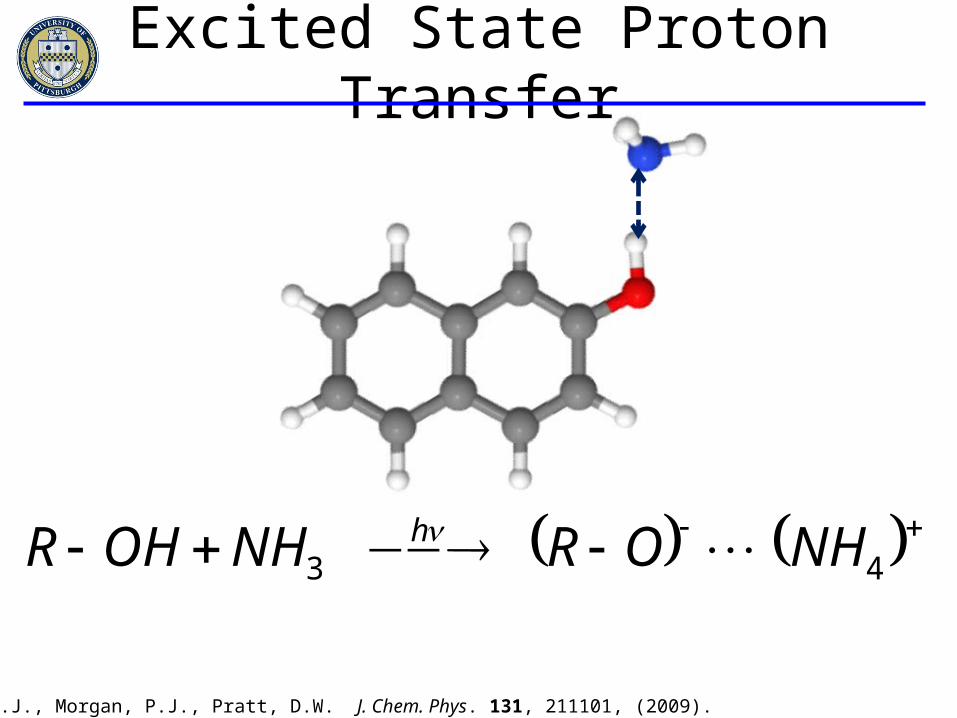
43 NHORNHOHR h
Fleisher, A.J., Morgan, P.J., Pratt, D.W. J. Chem. Phys. 131, 211101, (2009).
Excited State Proton Transfer
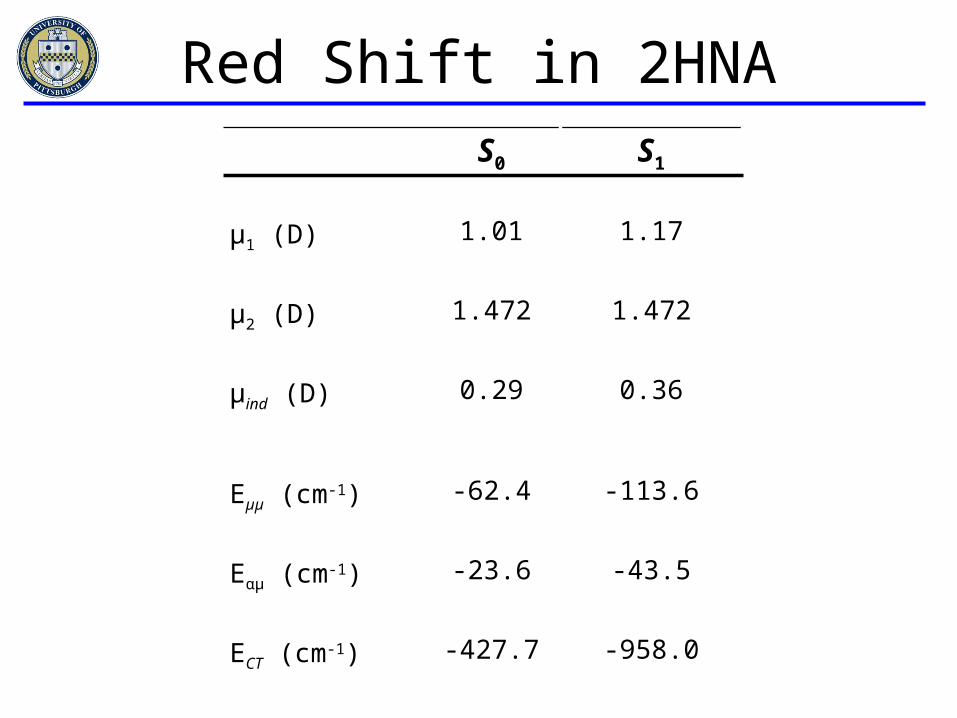
S0 S1
µ1 (D) 1.01 1.17
µ2 (D) 1.472 1.472
µind (D) 0.29 0.36
Eµµ (cm-1) -62.4 -113.6
Eαµ (cm-1) -23.6 -43.5
ECT (cm-1) -427.7 -958.0
Ecomplex,rel (cm-1) -513.7 -1115.1
Red Shift in 2HNA
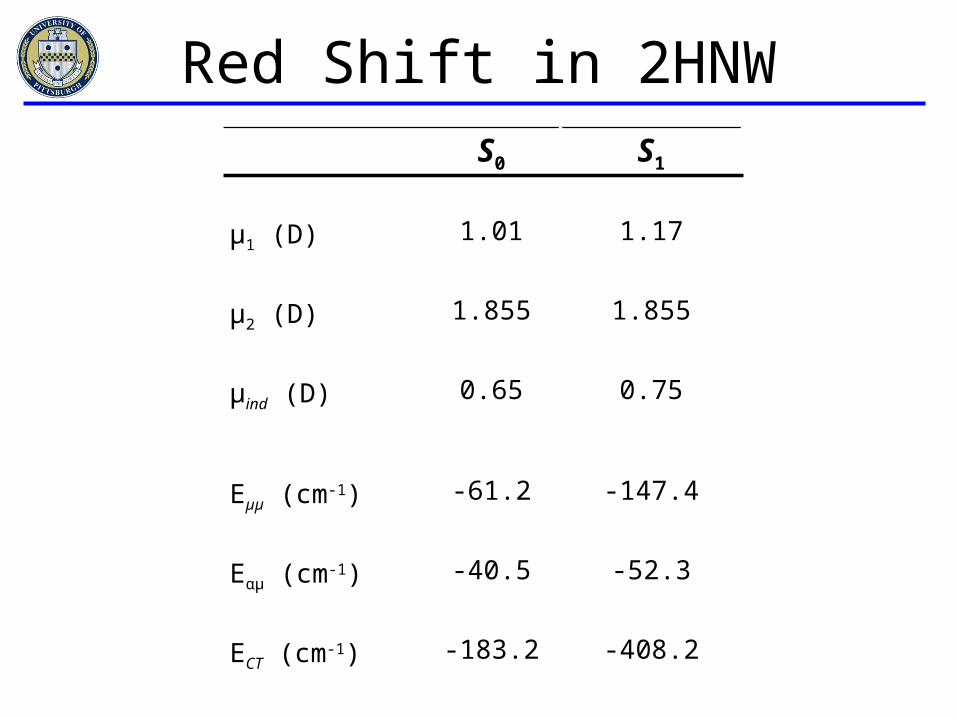
S0 S1
µ1 (D) 1.01 1.17
µ2 (D) 1.855 1.855
µind (D) 0.65 0.75
Eµµ (cm-1) -61.2 -147.4
Eαµ (cm-1) -40.5 -52.3
ECT (cm-1) -183.2 -408.2
Ecomplex,rel (cm-1) -284.9 -607.9
Red Shift in 2HNW

0.04 cm-1
30315.4 30318.6 cm-1
E A
0 V/cm
1269 V/cm
423 V/cm
Stark Effect in 2-Naphthol-Ammonia
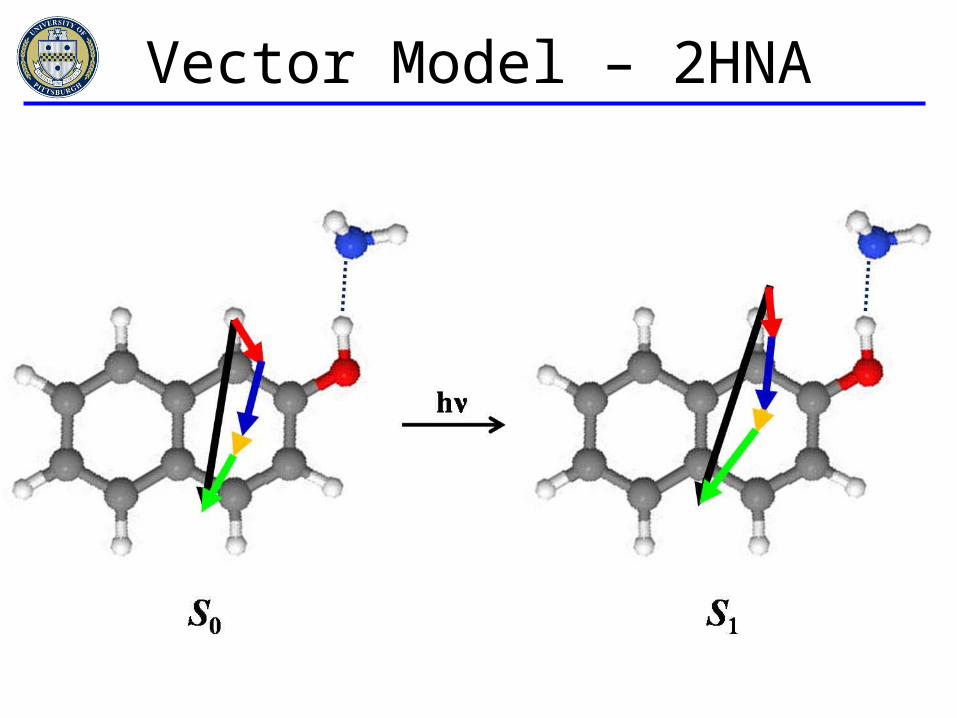
Vector Model – 2HNA
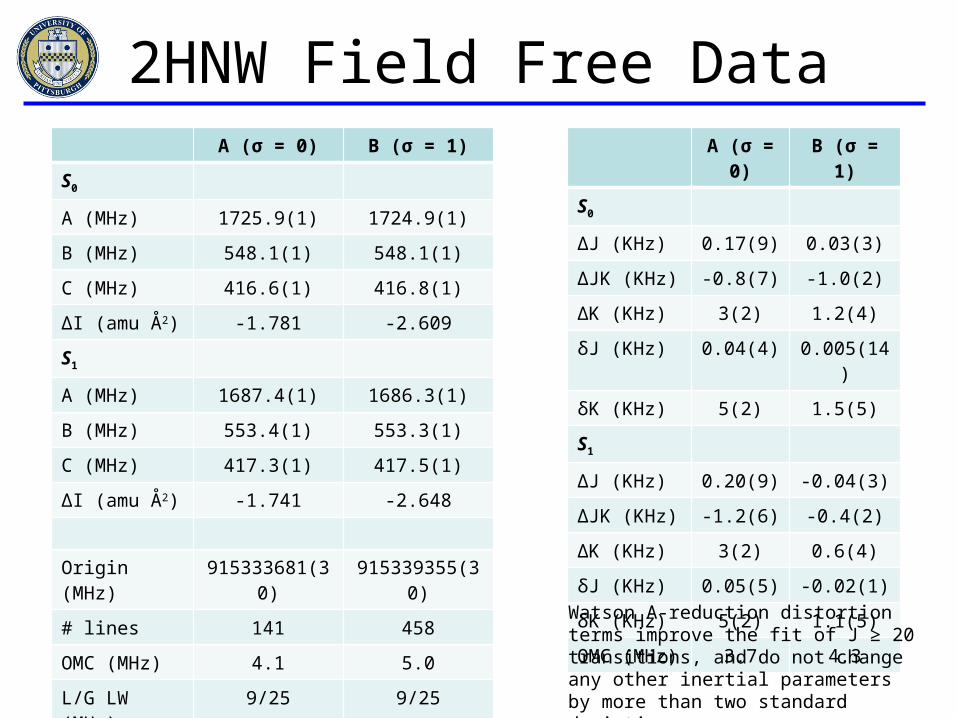
2HNW Field Free DataA (σ = 0) B (σ = 1)
S0
A (MHz) 1725.9(1) 1724.9(1)
B (MHz) 548.1(1) 548.1(1)
C (MHz) 416.6(1) 416.8(1)
ΔI (amu Å2) -1.781 -2.609
S1
A (MHz) 1687.4(1) 1686.3(1)
B (MHz) 553.4(1) 553.3(1)
C (MHz) 417.3(1) 417.5(1)
ΔI (amu Å2) -1.741 -2.648
Origin (MHz) 915333681(30) 915339355(30)
# lines 141 458
OMC (MHz) 4.1 5.0
L/G LW (MHz) 9/25 9/25
Rel. Intensity 1 3
A (σ = 0) B (σ = 1)
S0
ΔJ (KHz) 0.17(9) 0.03(3)
ΔJK (KHz) -0.8(7) -1.0(2)
ΔK (KHz) 3(2) 1.2(4)
δJ (KHz) 0.04(4) 0.005(14)
δK (KHz) 5(2) 1.5(5)
S1
ΔJ (KHz) 0.20(9) -0.04(3)
ΔJK (KHz) -1.2(6) -0.4(2)
ΔK (KHz) 3(2) 0.6(4)
δJ (KHz) 0.05(5) -0.02(1)
δK (KHz) 5(2) 1.1(5)
OMC (MHz) 3.7 4.3
Watson A-reduction distortion terms improve the fit of J ≥ 20 transitions, and do not change any other inertial parameters by more than two standard deviations.
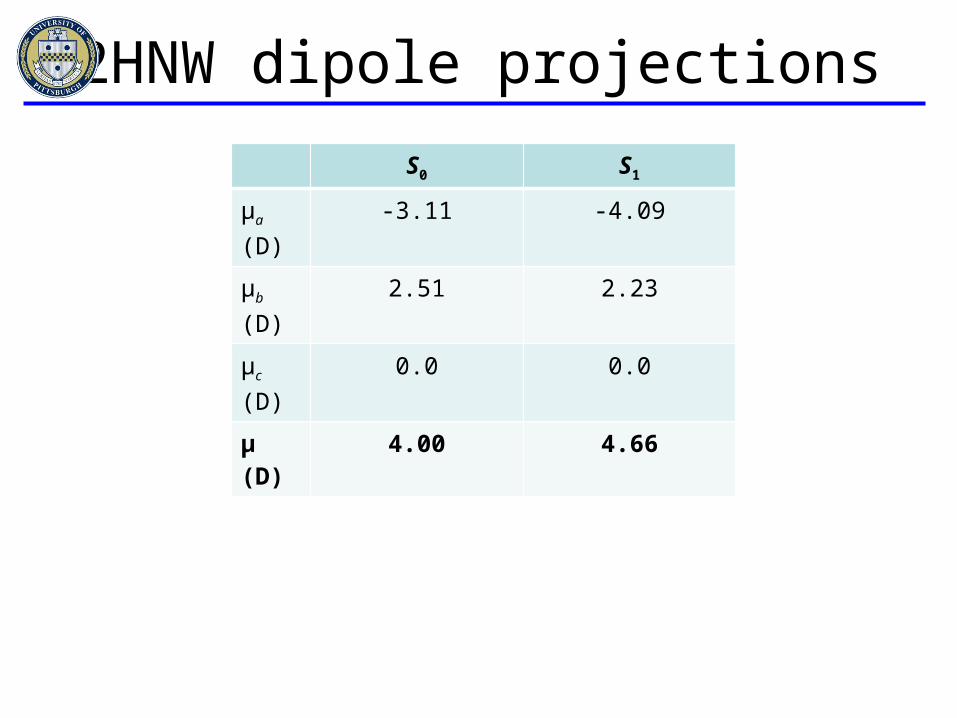
2HNW dipole projectionsS0 S1
μa (D) -3.11 -4.09
μb (D) 2.51 2.23
μc (D) 0.0 0.0
μ (D) 4.00 4.66
Top Related