Adam J. Fleisher David W. Pratt University of Pittsburgh Alessandro Cembran Jiali Gao University of...
29
Adam J. Fleisher David W. Pratt University of Pittsburgh Alessandro Cembran Jiali Gao University of Minnesota Charge redistribution in the β-naphthol-water complex as measured by high resolution Stark spectroscopy in the gas phase. MG- 04
-
Upload
mercy-stokes -
Category
Documents
-
view
225 -
download
0
Transcript of Adam J. Fleisher David W. Pratt University of Pittsburgh Alessandro Cembran Jiali Gao University of...

Adam J. FleisherDavid W. Pratt
University of Pittsburgh
Alessandro CembranJiali Gao
University of Minnesota
Charge redistribution in theβ-naphthol-water complex as measured by high resolution Stark spectroscopy in the gas phase.
MG-04
Condensed phase H-bonds
S0
S1
S2
RO-H RO– + H+?
LE CT
Fig. 5 in Schütz, M., Bürgi, T., Leutwyler, S., Fischer, T. J. Chem. Phys. 99, 1469, (1993).
In the gas phase, the cis-2HN-water origin is red shifted by 371 cm-1 from the 2HN origin.
cm-1
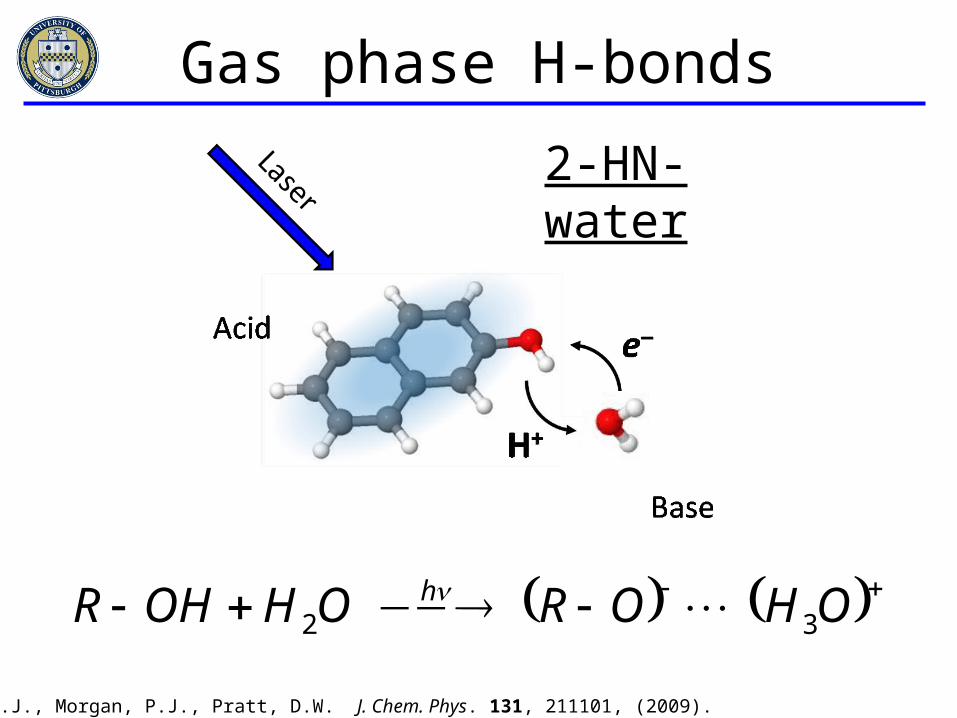
OHOROHOHR h32
Fleisher, A.J., Morgan, P.J., Pratt, D.W. J. Chem. Phys. 131, 211101, (2009).
Gas phase H-bonds
2-HN-water
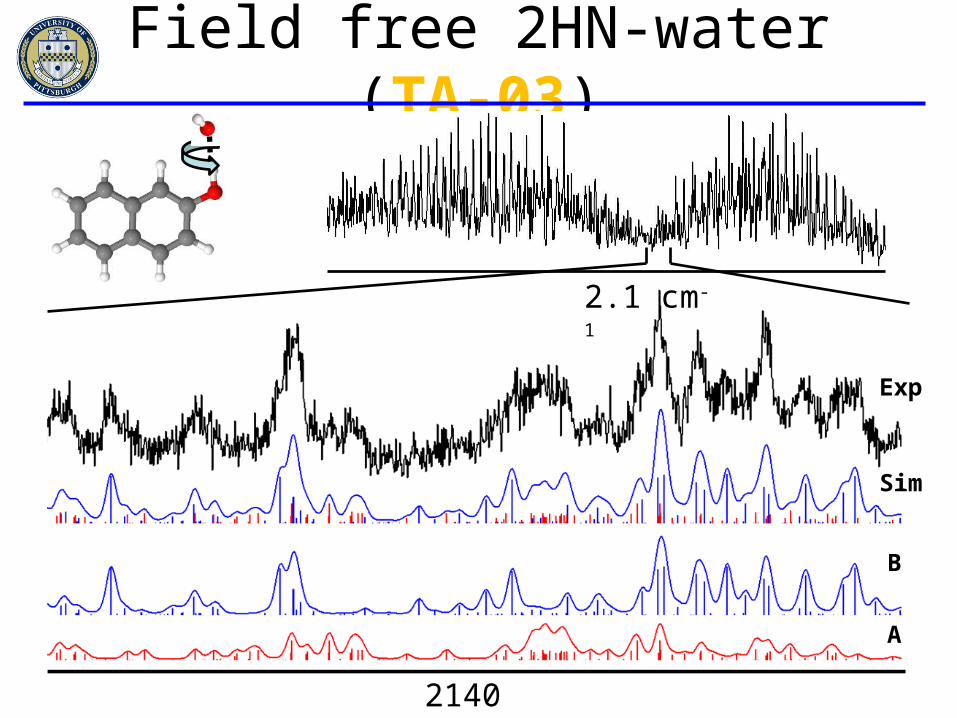
Field free 2HN-water (TA-03)
B
A
Sim
Exp
2.1 cm-1
2140 MHz
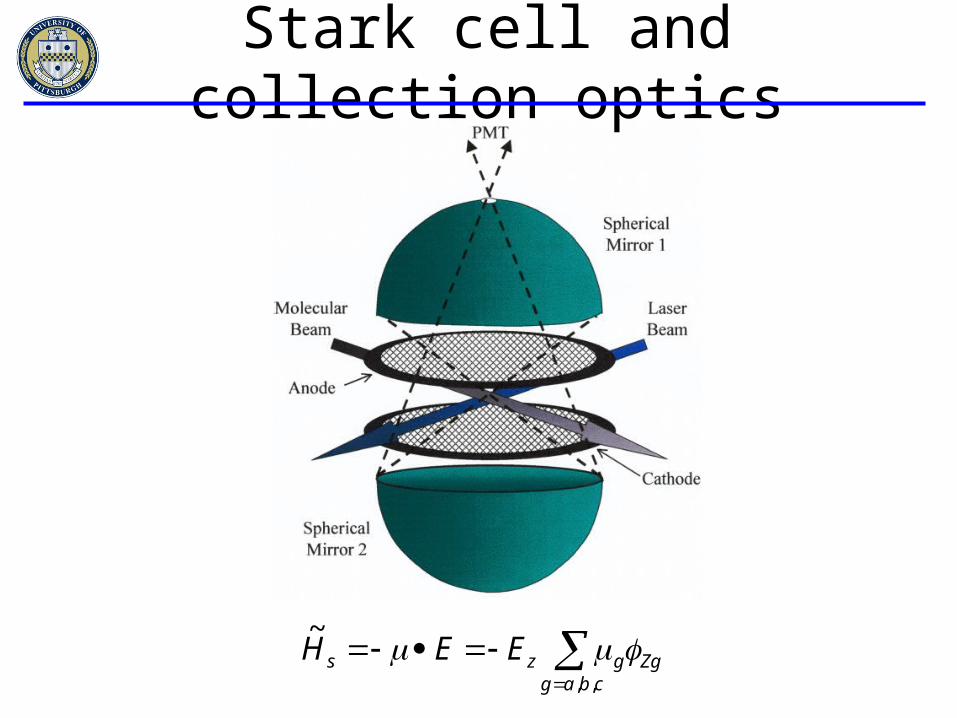
Stark cell and collection optics
cbag
Zggzs EEH,,
~

30901.4 30904.7 cm-1
0.04 cm-1
0 V/cm
846 V/cm
1776 V/cm
Stark effect in 2-naphthol
Fleisher, A.J., Morgan, P.J., Pratt, D.W. J. Chem. Phys. 131, 211101, (2009).

2-HN-water Stark spectra
2 cm-1
0 V/cm
169 V/cm
846 V/cm
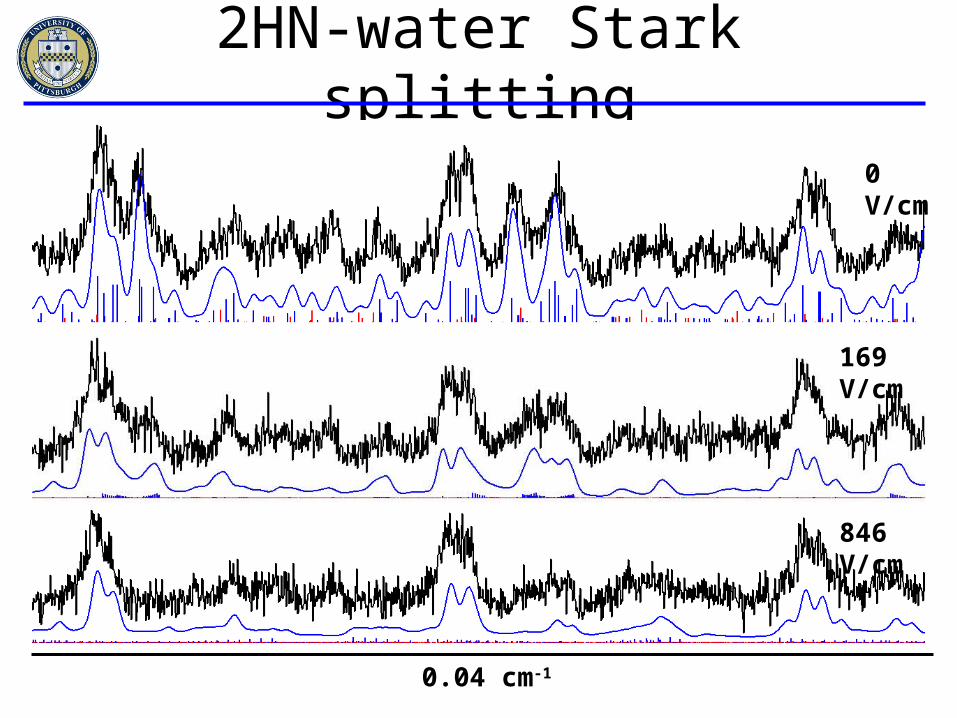
2HN-water Stark splitting
0 V/cm
169 V/cm
846 V/cm
0.04 cm-1
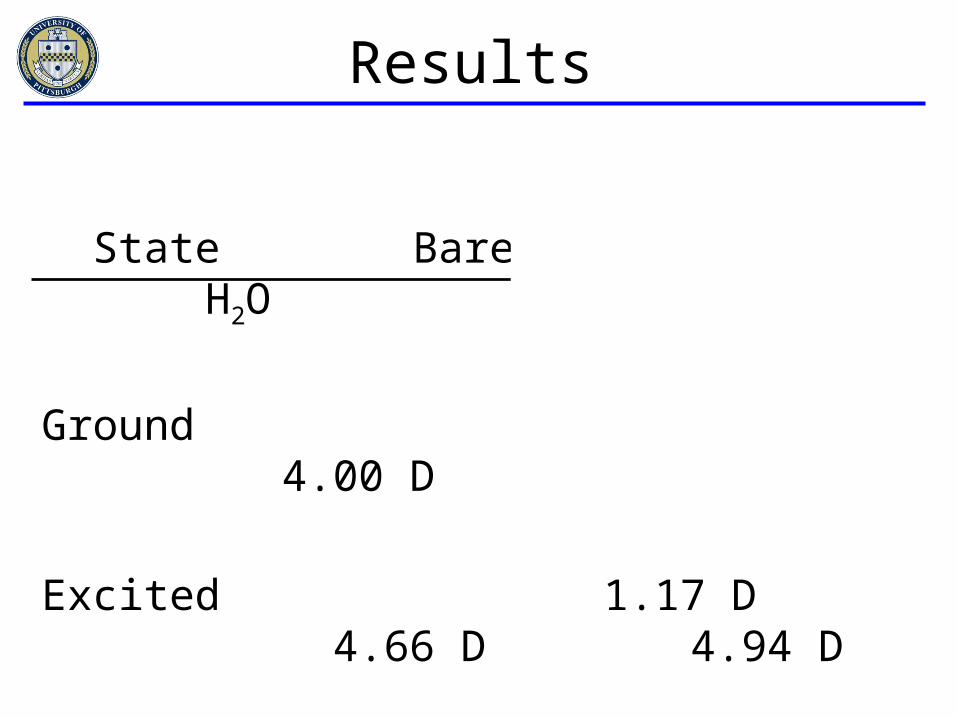
Results
State Bare Molecule H2O NH3
Ground 1.01 D 4.00 D 3.89 D
Excited 1.17 D 4.66 D 4.94 D
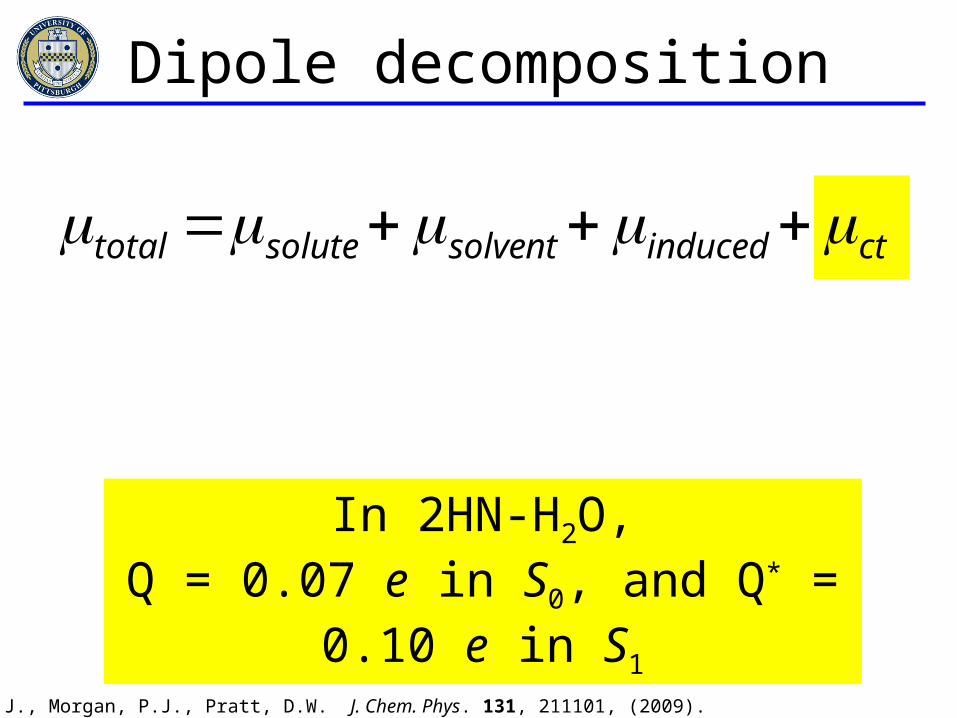
Qdct ctinducedsolventsolutetotal
In 2HN-H2O,Q = 0.07 e in S0, and Q* = 0.10 e in S1
Dipole decomposition
Fleisher, A.J., Morgan, P.J., Pratt, D.W. J. Chem. Phys. 131, 211101, (2009).
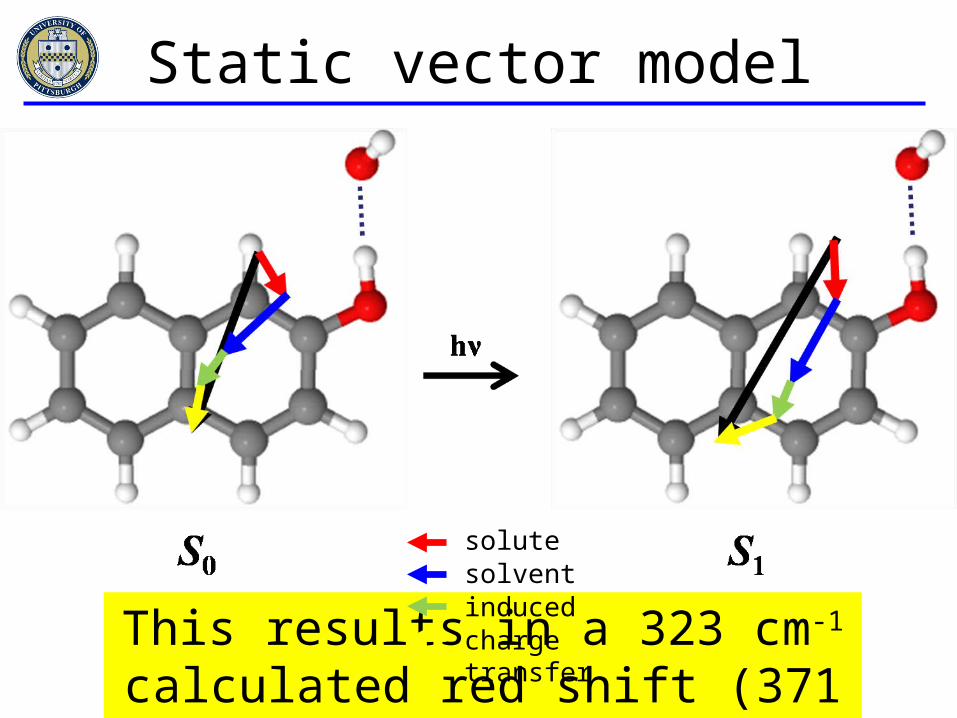
This results in a 323 cm-1 calculated red shift (371 cm-1 in experiment).
Static vector model
solutesolventinducedcharge transfer

BLW-ED method
Scheme 1 in Mo, Y., Gao, J., Peyerimhoff, S.D. J. Chem. Phys., 112, 5530 (2000).BLW-ED reported using B3LYP/6-31+G* (geometries were optimized using M06-2X/6-31+G*).
S0 c2HNA(cm-1)
BLW|%|
static|%|
c2HNW(cm-1)
BLW|%|
static|%|
ΔEr +420 ?
ΔEstat -730 20 15 ? ? 22
ΔEpol -980 27 5 ? ? 14
ΔEct -1900 53 80 ? ? 64
ΔEint -3200 ?
ammonia, water
β-naphthol
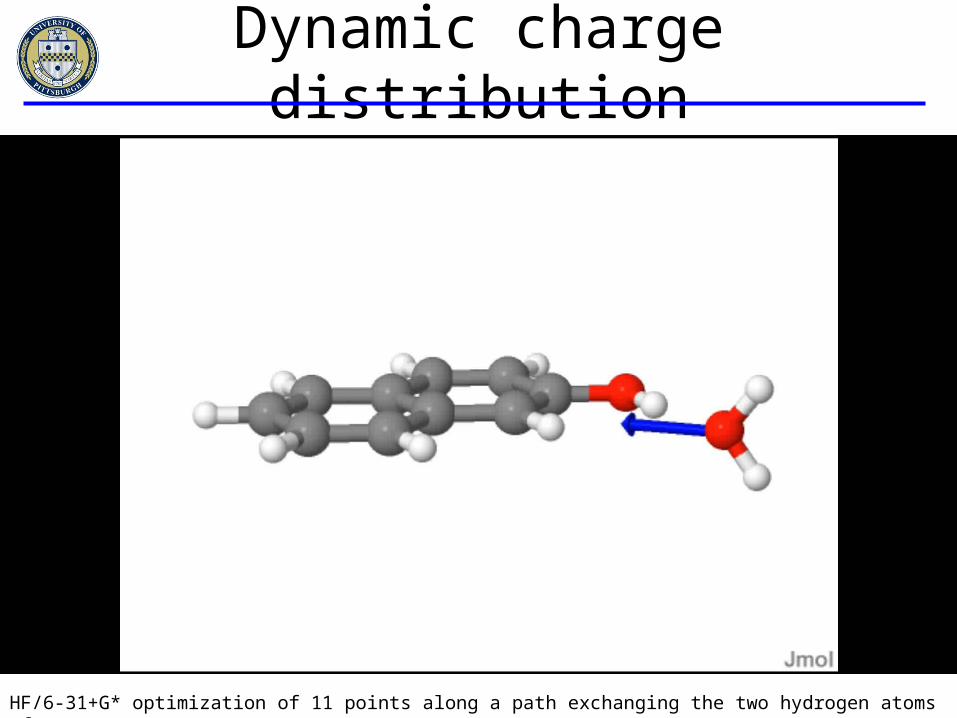
Dynamic charge distribution
HF/6-31+G* optimization of 11 points along a path exchanging the two hydrogen atoms of water.
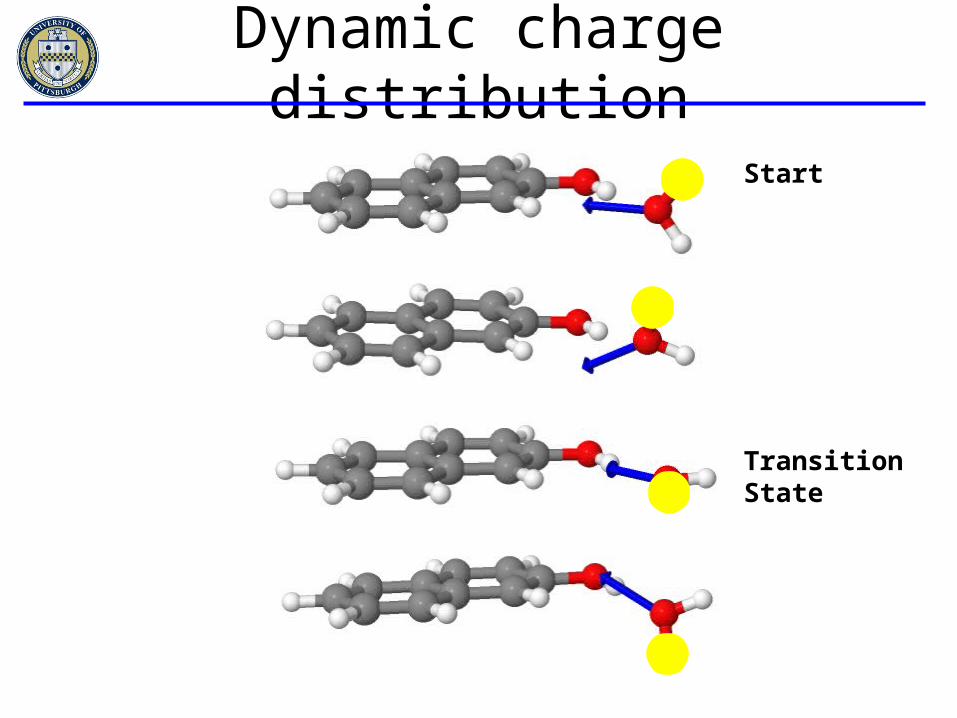
Dynamic charge distribution
Start
Transition State
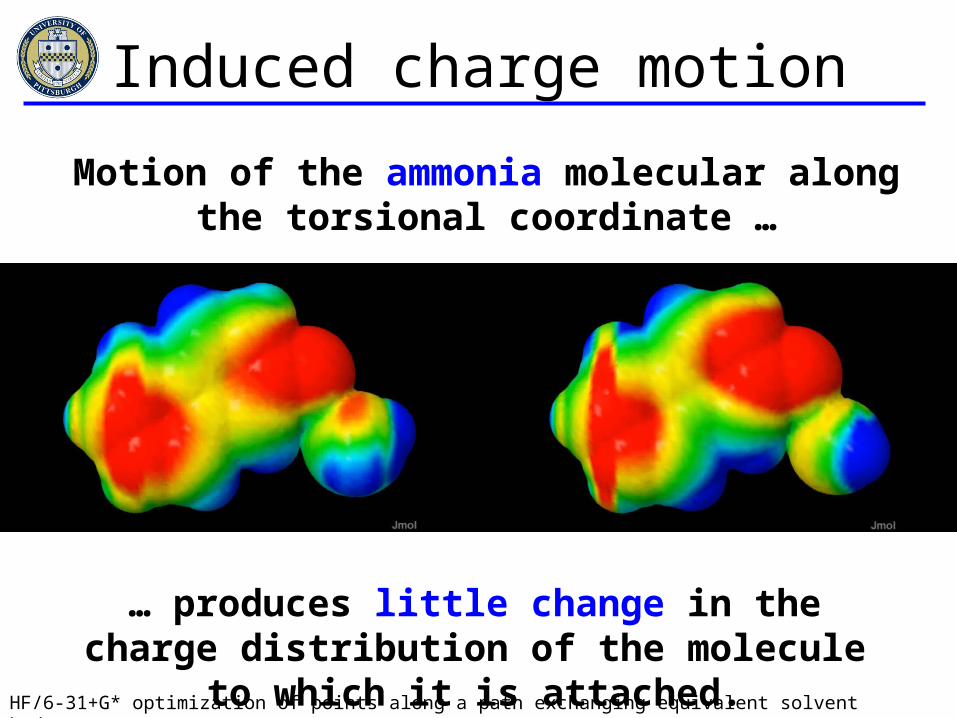
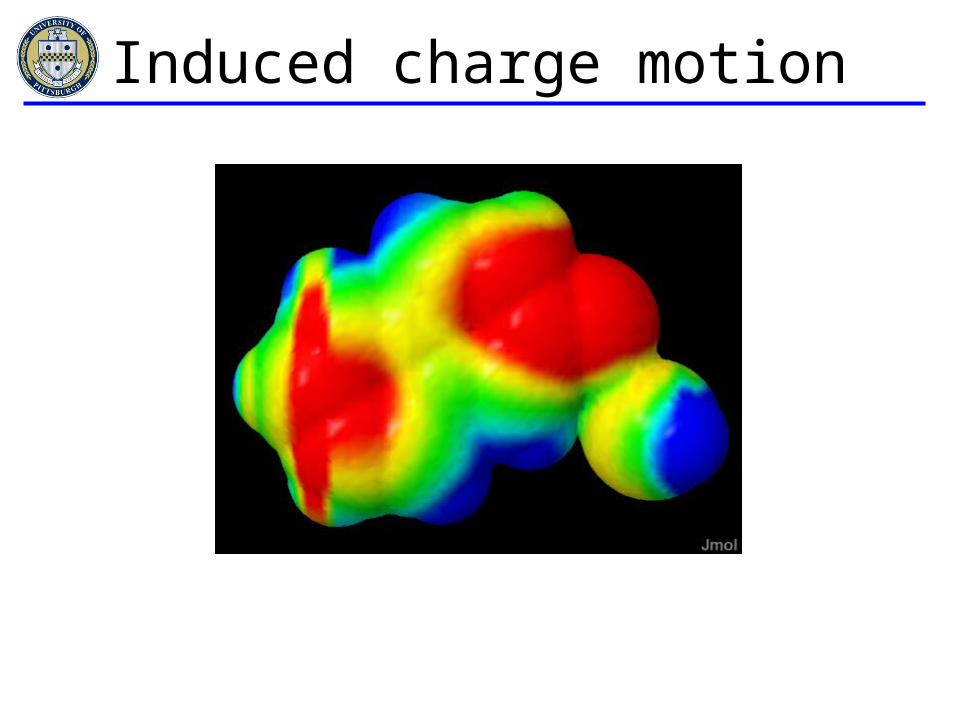
Induced charge motion
… produces a large change in the charge distribution of the molecule to which it is attached.
Motion of the water molecular along the torsional coordinate …
Motion of the ammonia molecular along the torsional coordinate …
… produces little change in the charge distribution of the molecule to which it is attached.
HF/6-31+G* optimization of points along a path exchanging equivalent solvent hydrogens.
Induced charge motion

Time-varying dipole field (II)
2
0
2 V
V
2
0
2
)coordinate (torsional

• A static model of energy and dipole moment decomposition based on electrostatic contributions was used to explain the experimentally observed red shift in 2HNW.
• The block-localized wavefunction energy decomposition (BLW-ED) method was used to investigate electrostatic, induced, and charge transfer interactions.
• Future work on understanding the importance of the time varying nature of the water dipole must be included.– Important to the understanding of condensed phase water systems.
Summary

• Justin Young
• Philip Morgan• Diane Miller
Marquette University
• Ryan Bird• Jessica Thomas• Casey Clements• Patrick Walsh
Acknowledgments
• Dr. David W. PrattUniversity of Pittsburgh
• Dr. David PlusquellicNIST, jb95 development
• Dr. David BorstIntel, Stark development

2
0
2b
a
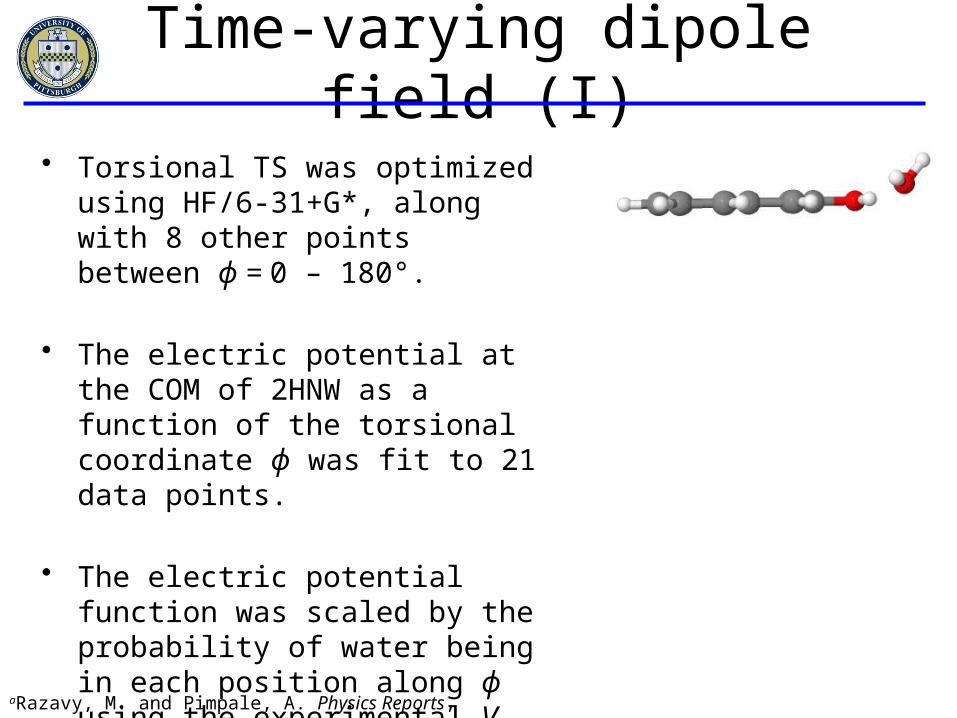
Time-varying dipole field (I)
2cos12
1cos12
2
1
c
cV
• Torsional TS was optimized using HF/6-31+G*, along with 8 other points between ϕ = 0 – 180°.
• The electric potential at the COM of 2HNW as a function of the torsional coordinate ϕ was fit to 21 data points.
• The electric potential function was scaled by the probability of water being in each position along ϕ using the experimental V2 = 206 cm-1, compared to a barrierless torsion.a
aRazavy, M. and Pimpale, A. Physics Reports, 168, 305 (1988).

H-bond ‘jumps’ in bulk water
Fig. 1 in Ji, M., Odelius, M., Gaffney, K.J. Science. 328, 1003, (2010).
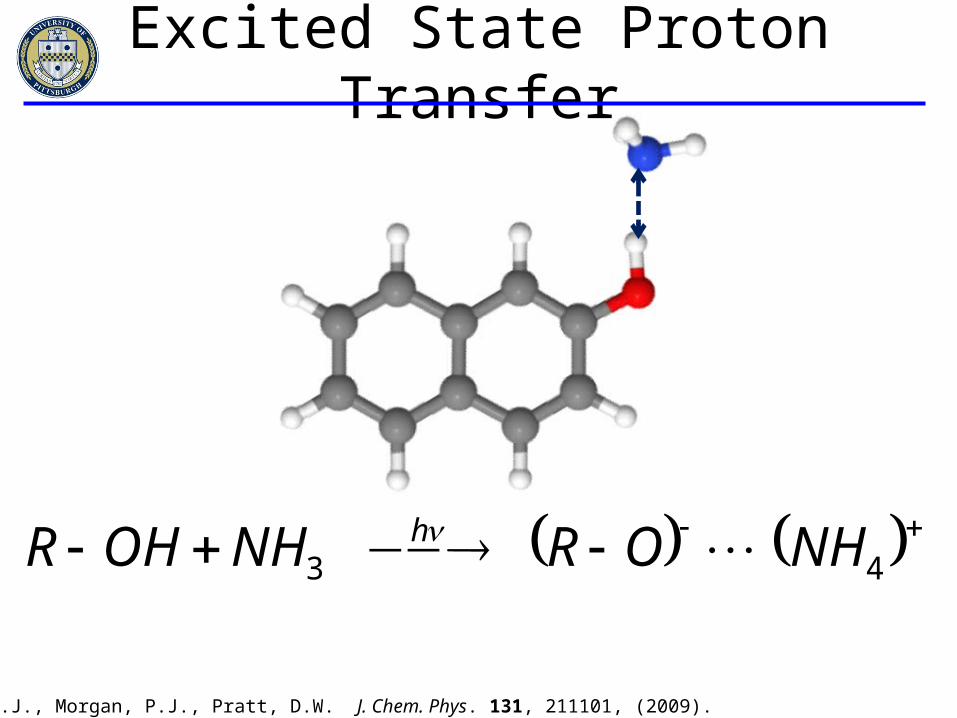
43 NHORNHOHR h
Fleisher, A.J., Morgan, P.J., Pratt, D.W. J. Chem. Phys. 131, 211101, (2009).
Excited State Proton Transfer
S0 S1
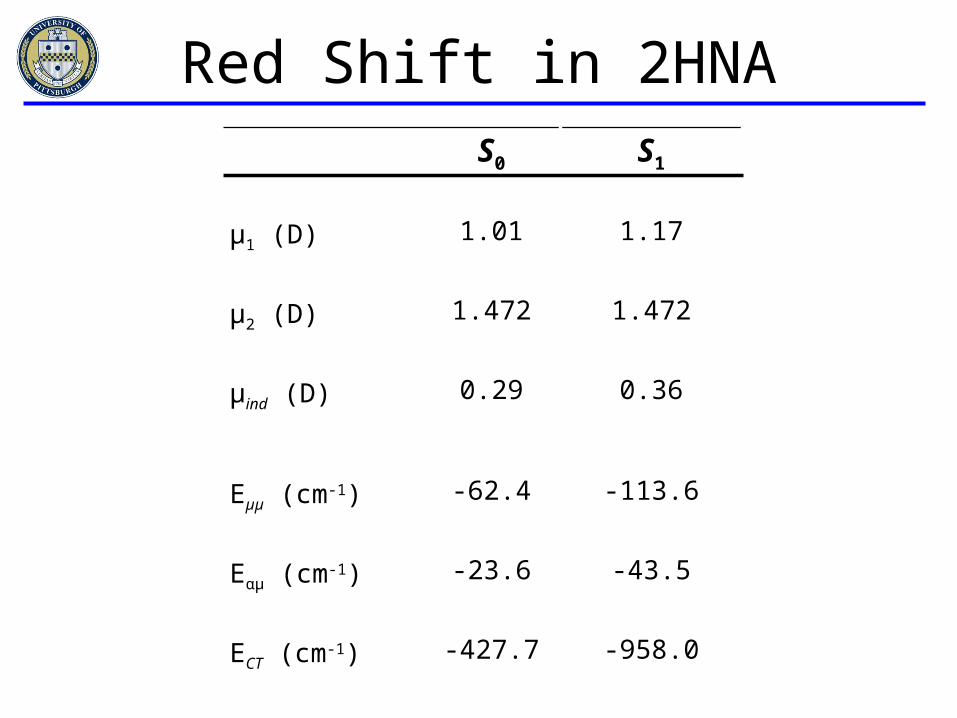
µ1 (D) 1.01 1.17
µ2 (D) 1.472 1.472
µind (D) 0.29 0.36
Eµµ (cm-1) -62.4 -113.6
Eαµ (cm-1) -23.6 -43.5
ECT (cm-1) -427.7 -958.0
Ecomplex,rel (cm-1) -513.7 -1115.1
Red Shift in 2HNA
S0 S1
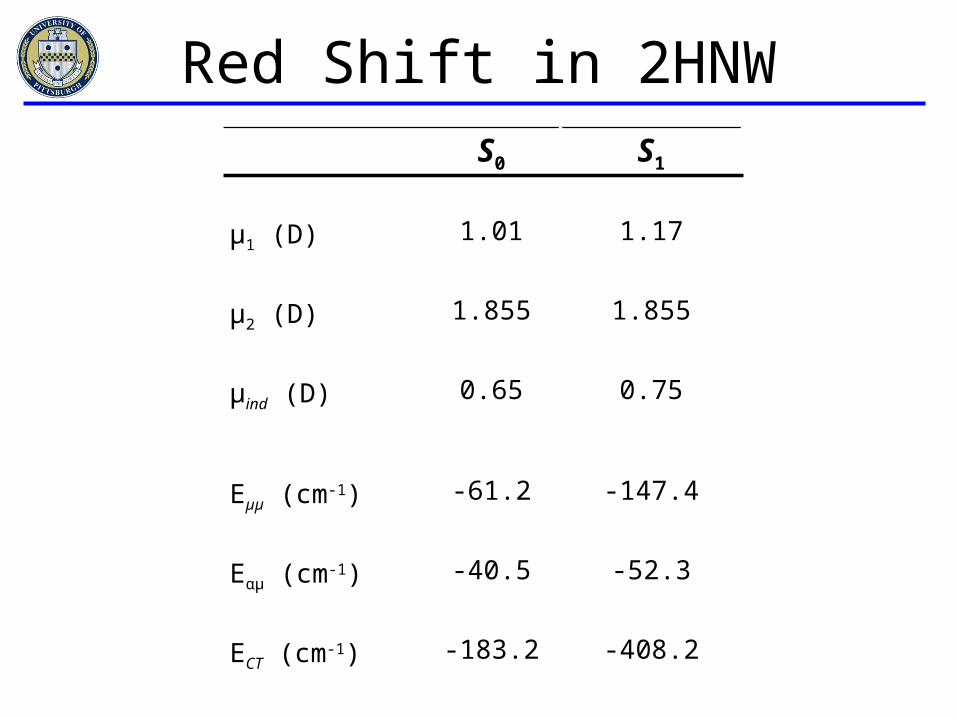
µ1 (D) 1.01 1.17
µ2 (D) 1.855 1.855
µind (D) 0.65 0.75
Eµµ (cm-1) -61.2 -147.4
Eαµ (cm-1) -40.5 -52.3
ECT (cm-1) -183.2 -408.2
Ecomplex,rel (cm-1) -284.9 -607.9
Red Shift in 2HNW

0.04 cm-1
30315.4 30318.6 cm-1
E A
0 V/cm
1269 V/cm
423 V/cm
Stark Effect in 2-Naphthol-Ammonia
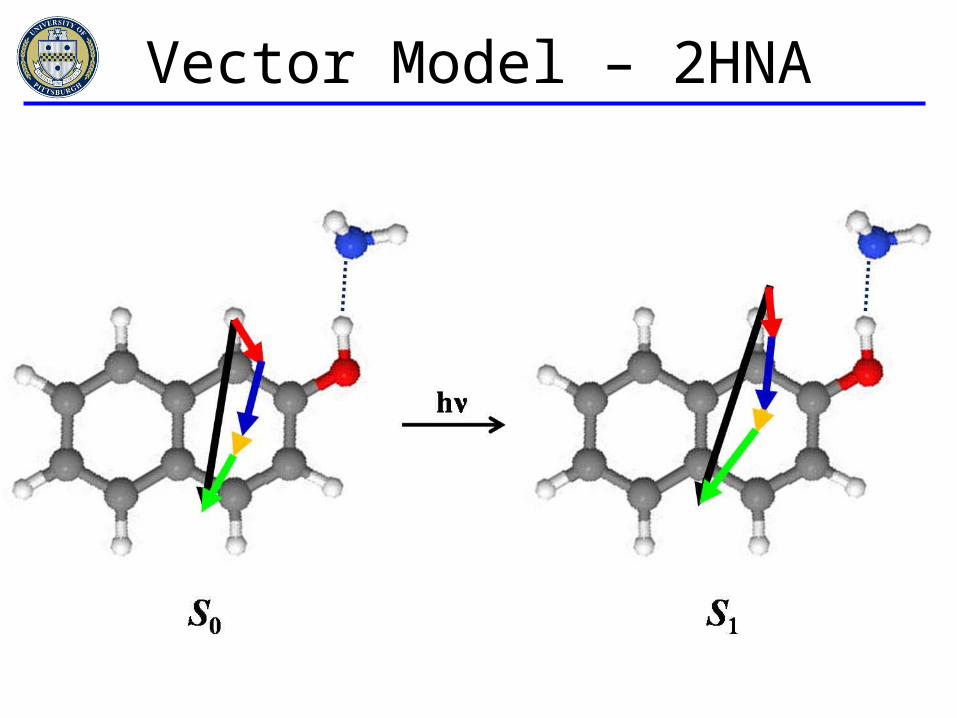
Vector Model – 2HNA
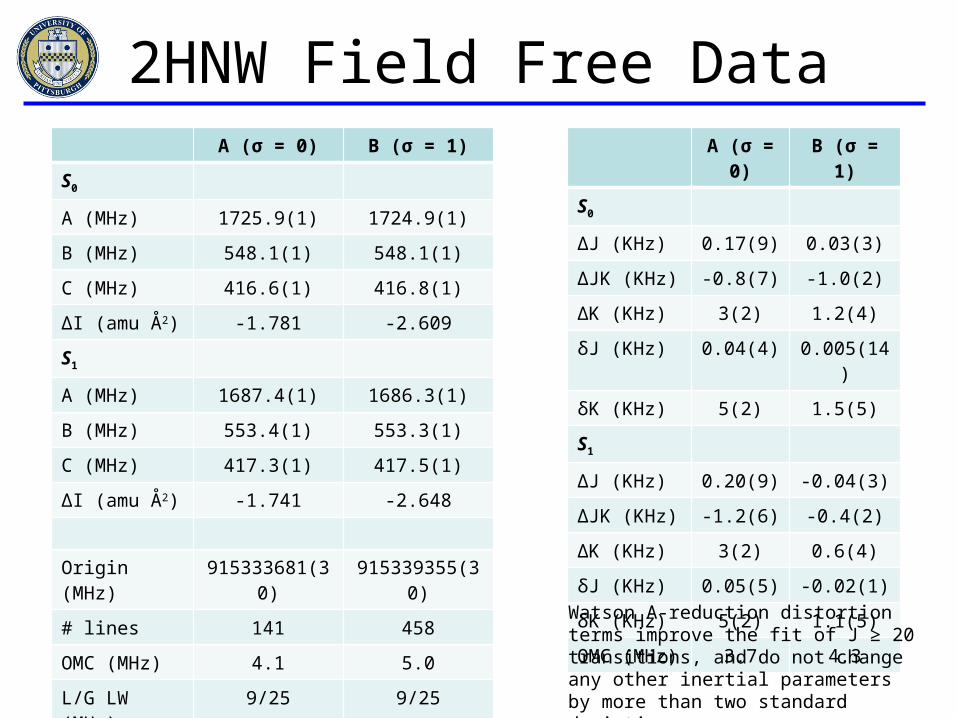
2HNW Field Free DataA (σ = 0) B (σ = 1)
S0
A (MHz) 1725.9(1) 1724.9(1)
B (MHz) 548.1(1) 548.1(1)
C (MHz) 416.6(1) 416.8(1)
ΔI (amu Å2) -1.781 -2.609
S1
A (MHz) 1687.4(1) 1686.3(1)
B (MHz) 553.4(1) 553.3(1)
C (MHz) 417.3(1) 417.5(1)
ΔI (amu Å2) -1.741 -2.648
Origin (MHz) 915333681(30) 915339355(30)
# lines 141 458
OMC (MHz) 4.1 5.0
L/G LW (MHz) 9/25 9/25
Rel. Intensity 1 3
A (σ = 0) B (σ = 1)
S0
ΔJ (KHz) 0.17(9) 0.03(3)
ΔJK (KHz) -0.8(7) -1.0(2)
ΔK (KHz) 3(2) 1.2(4)
δJ (KHz) 0.04(4) 0.005(14)
δK (KHz) 5(2) 1.5(5)
S1
ΔJ (KHz) 0.20(9) -0.04(3)
ΔJK (KHz) -1.2(6) -0.4(2)
ΔK (KHz) 3(2) 0.6(4)
δJ (KHz) 0.05(5) -0.02(1)
δK (KHz) 5(2) 1.1(5)
OMC (MHz) 3.7 4.3
Watson A-reduction distortion terms improve the fit of J ≥ 20 transitions, and do not change any other inertial parameters by more than two standard deviations.
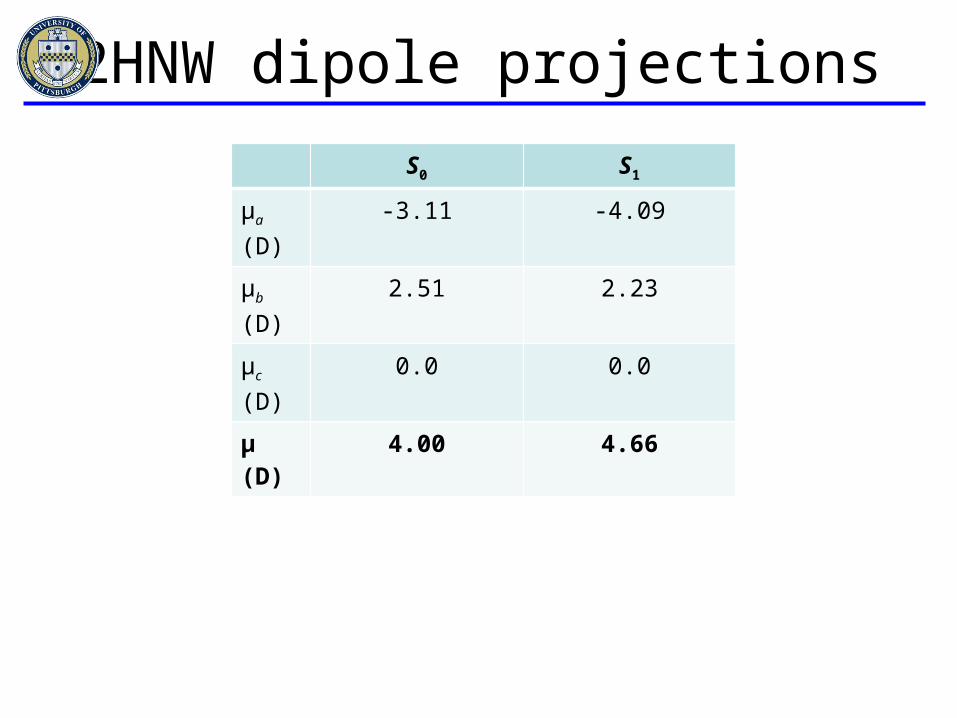
2HNW dipole projectionsS0 S1
μa (D) -3.11 -4.09
μb (D) 2.51 2.23
μc (D) 0.0 0.0
μ (D) 4.00 4.66