


γλώσσες
Σελίδες
Νομικός

48
Submitted: 30/8/2020
Accepted : 10/9/2020 Pages:84- 96
Effect of N-Acetylcysteine on Total Oxidant Status in
Children With β-Thalassemia Major
Amany A. Ahmed .
Bany Sweif Specialized Hospital.
Mohamed H. Meabed Pediatrics Department, Faculty of Medicine,
Beni-Suef University, Egypt
Yasmeen A. Mohamed Pediatrics Department, Faculty of Medicine,
Beni-Suef University, Egypt
Rehab M. Abd-Elkareem Pediatrics Department, Faculty of
Medicine, Beni-Suef University, Egypt
Abstract
ABSTRACT: β-Thalassemias are due to β-globin gene mutation leading to the
absence or reduction of β-globin chains formation. Numerous studies are showing the
rising of oxidative stress in β-thalassemia major patients. The study aims to evaluate
the effects of N-acetylcysteine (NAC) on total oxidant status and Hb levels in children
with β-thalassemia major. This study is a randomized clinical trial in the department
of pediatrics, Beni-Suef University during the period between May 2019 and October
2019. The subjects of the study were beta-thalassemia major, the study was conducted
on 44 patients that were divided into two groups, 22 patients took NAC at a dose of
10 mg/kg (solvymist syrup or, NAC sachet) orally, for 3 months, and the second
group as a non-treatment group. Article results show a significant increase in HB for
Medicine Updates
Faculty of medicine
October 2020,volume 3,
issue 3
https://muj.journals.ekb.eg
DOI 10.21608/muj.2020.41090.1023
ISSN : 2682-2741

48
the treatment group between form the first measurement until the 3rd
month. There
was a significant decrease between Total Oxidant Status before and after three months
in the treatment group. Therefore, NAC may be effective in reducing serum Total
oxidant status and increase pre-transfusion Hb levels in children with β-thalassemia
major.
Keywords: TOS, Acetylcysteine, Β-Thalassemia, Oxidant, Children, Randomized
Abbreviations:
Hb: hemoglobin TOS: Total oxidant status
NAC: N-acetylcysteine SD: Standard deviation s
INTRODUCTION
β-thalassemias are characterized by the presence of mutations on the β- globin gene,
resulting in the absence or reduced synthesis of β-globin chains of the hemoglobin
(Hb) tetramer (Cao & Galanello, 2010). Thalassemias are a group of inherited
hematological disorders caused by defects in the synthesis of one or more of the
hemoglobin chains (Muncie Jr & Campbell, 2009). Imbalances of globin chains
cause hemolysis and impair erythropoiesis. Beta thalassemia major causes hemolytic
anemia, poor growth, and skeletal abnormalities during infancy. Affected children
will require regular lifelong blood transfusions. (Origa, 2017).Transfusion-dependent
patients will develop iron overload and require chelation therapy to remove excess
iron. Persons with thalassemia should be referred for preconception genetic
counseling. Persons with beta-thalassemia major often die from cardiac complications
of iron overload by 30 years of age (Muncie Jr & Campbell, 2009). Early and
regular blood transfusion therapy decreases the complications of severe anemia and
prolongs survival. In the long term, however, the beneficial effects of transfusions are
limited by the organ damage resulting from cumulative iron burden (Prati, 2000)
When body iron is excessive, increased non-transferrin-bound iron induces free
radicals (Hershko, 2010). Reactive oxygen species cause damage to macromolecules,
oxidation of amino acid side, and polypeptide chains with the result of DNA damage
(Zastawny et al., 1995). Therefore, we need iron chelation in the management of this
fatal disease. The choice of effective chelation therapy protocols that decrease the iron
load of patients to near ordinary physiological ranges is needed (Kolnagou,
Economides, Eracleous, & Kontoghiorghes, 2008). Antioxidants help to eradicate
toxic oxygen radicals (Kolnagou et al., 2008). NAC entered the cells and converted
to l-cysteine, which gives the aminothiol Glutathione (GSH). GSH is a major
48
intracellular antioxidant (Faintuch, Aguilar, & Nadalin, 1999). It is said that
treatment by combinations of antioxidants such as NAC plus iron chelators could
mollify the damaging effects of Reactive Oxygen Species (ROS) (Rachmilewitz,
WEIZER‐STERN et al. 2005). In order to fulfill the objectives of this study.
AIM OF THE STUDY
The present study aims to evaluate the effects of N-acetylcysteine (NAC) on total
oxidant status and Hemoglobin (Hb) levels in children with a β-thalassemia major
within 3 months. The Study type is a randomized clinical trial and setting all patients
of the study were subjected to the following after approval of the internal ethical
committee:
(1) Careful histories are Age and sex of the patient, Age of patient at 1st diagnosis
of the disease, Age of first blood transfusion, Frequency of blood transfusion,
history of operations, and Family history.
(2) Complete clinical examination every month
(3) Laboratory investigations are Hemoglobin level, Serum ferritin level measurement
before giving NAC and after treatment for 3 months, Liver functions (Alanine
transaminase, Aspartate transaminase) before giving NAC and after treatment for 3
months, and Serum level of total oxidant status before giving NAC and after treatment
for 3 months.
Subjects and Methods:
Subjects: This study was performed in an outpatient hematology pediatric clinic in
Beni-Suef university hospital. Subjects of the study were beta-thalassemia major
patients with age ranged from 2 to 13 years on iron chelators, transfusion-dependent,
and not suffering from any complication (respiratory, cardiac, or endocrine). The
criterion for sample size is a sample of 44 subjects. The subject of the study was
divided into two groups: The first group Included 22 patients with beta-thalassemia
major received NAC at a dose of 10 mg/kg/day (solvymist syrup or, NAC sachet)
orally, for 3 months and the second group included 22 patients with beta-thalassemia
major did not receive NAC
The inclusion criteria are patients receiving iron chelators and transfusion-
dependent thalassemia patients. The exclusion criteria are the patients are not
receiving an iron chelator and on regular transfusion. Patient with any complication
(respiratory, cardiac or endocrine) Operational design: The study had been explained
to all participants with the informed written consent by the parents of the patients after
approval of the local ethical committee.
48
Protocol Approval by Ethical Committee Before the beginning of the study and in
accordance with the local regulation followed the protocol and all corresponding
documents were declared for Ethical and Research approval by Beni-Suef university
hospital and Institutional Review Broad (IRB).
METHODS:
All patients of the study were subjected to the following after approval of internal
ethical committees: (1) History taking stressing upon the Age and sex of the patient,
Age of patient at 1st diagnosis of the disease, Age of first blood transfusion,
Frequency of blood transfusion and history of operations and Family history. (2)
Complete clinical examination. (3). The general examination includes the Clinical
picture of thalassemia, vital signs, weight in (kg), and any complications (chest,
cardiac or hepatic) and any organometallic. (4) Laboratory investigations including
Hemoglobin level, serum ferritin level, liver functions, and Serum level of total
oxidant status.
Statistics Methods
All data are analyzed, represented, and summarized by using appropriate statistical
tests using statistical package for the Social Sciences(SPSS) version 25 (IBM Corp.,
Armonk, NY, USA). Tests of significance (Mann-Whitney test Friedman test,
Wilcoxon signed-rank test, Chi-Square (2) test, and spearman correlation
coefficient) were used (Chan, 2003a, 2003b)
RESULTS
The studying of demographic data of patients in our study shows that the percentage
of male patients was 52.3%and the percentage of female patients was 47.7%. With a
mean age of 8.05 and standard deviation (SD) ± 3.35 years and the percentage of
patients with positive family history was 50% for total patients of 44. The percentage
of positive consanguinity of patients was 50%. The percentage of patients with
hepatomegaly was 84.1% of the 44 patients. The percentage of patients with
splenomegaly was 61.4%, the percentage of patients without splenomegaly was
18.20% and the percentage of patients with splenectomy was 20.5% given by table
(1).

44
Table (1): Number and percentage of splenomegaly or Splenectomy in studied
patients
Splenectomy No Yes Splenomegaly
9 8 27 Number
20.5% 18.20% 61.4% Percentage
Table (2): Comparison between two groups concerning laboratory data:
Treatment (No= 22) No Treatment (No=22 )
P-Value Mean± SD Range Mean± SD Range
Hb 1 5.96±1.06 3.60-
7.20 5.75±0.74
4.00-
7.00 0.296
Hb 2 6.37±1.06 4.00-
8.10 5.83±0.88
4.00-
8.00 0.040
Hb 3 6.79±1.05 4.50-
8.80 5.84±0.88
4.00-
7.90 0.002
serum
ferritin
before
2215.05±1378.47 680.00- 1603.77±938.91 189.00-
4379.00 0.189
Serum
ferritin
After
2341.12±1434.33 586.00- 1886.33±1352.90 366.00-
5661.00 0.260
AST 51.37±80.92 14.00- 38.30±21.77 17.00-
115.00 0.879
ALT 43.84±64.85 9.00- 34.13±19.59 12.80-
102.00 0.972
TOS
before 8.88±2.21 4.10- 7.93±2.05
4.50-
13.50 0.065
TOS
after 6.84±2.18 1.20- 8.66±2.02
5.80-
13.70 0.014
The Hb 1 represents the level of hemoglobin measured at the end of the first month
after starting the clinical trial , Hb2 represents level of hemoglobin at the end of the
second month, Hb3 represents level of hemoglobin at the end of the third month,
serum ferritin before represent level of ferritin at the beginning of the clinical trial for
48
both groups, Serum ferritin after represents level of ferritin after 3 months, Total
Oxidant Status (TOS) before represents the level of TOS at the beginning of the
clinical trial for both group and TOS after represents the level of TOS after 3 months
of the clinical trial. Hb 1 in the treatment group ranged from 3.60 to 7.20 (g/dl) with a
mean of 5.96 ± 1.06(SD) and Hb 1 in the non-treatment group ranged from 4.00 to
7.00(g/dl) with a mean of 5.75± 0.88 (SD). The difference was not statistically
significant, the p-value was 0.296.
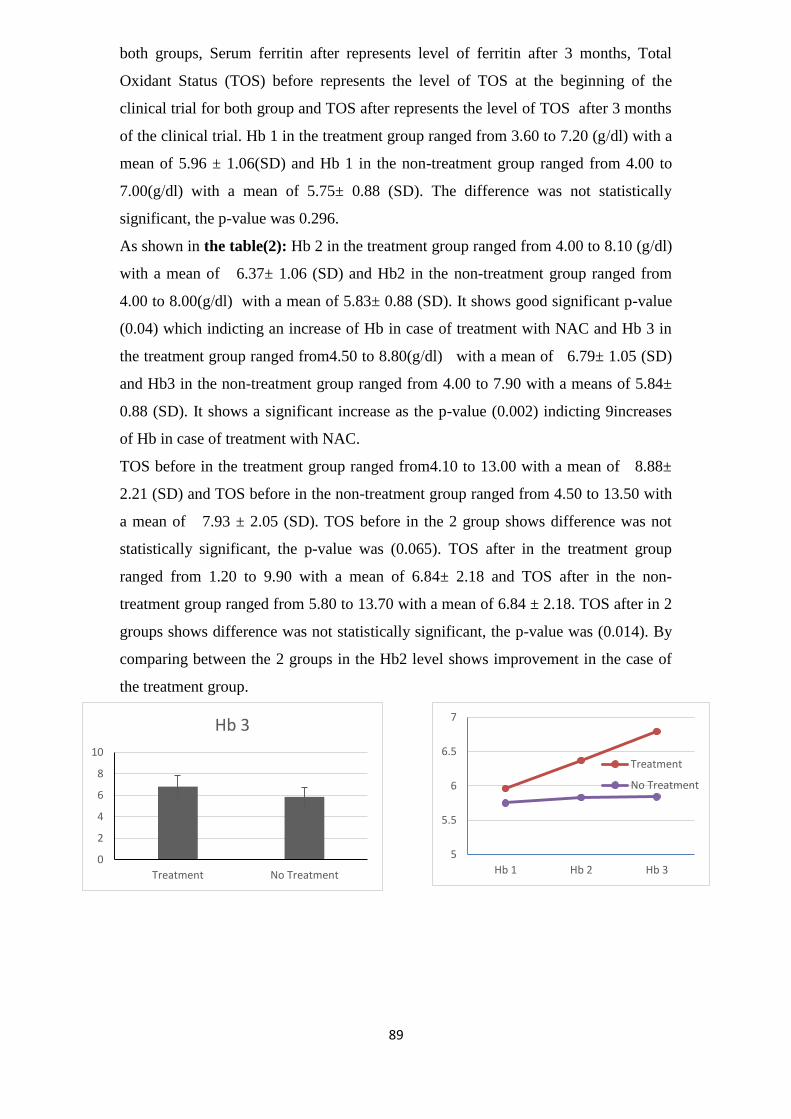
As shown in the table(2): Hb 2 in the treatment group ranged from 4.00 to 8.10 (g/dl)
with a mean of 6.37± 1.06 (SD) and Hb2 in the non-treatment group ranged from
4.00 to 8.00(g/dl) with a mean of 5.83± 0.88 (SD). It shows good significant p-value
(0.04) which indicting an increase of Hb in case of treatment with NAC and Hb 3 in
the treatment group ranged from4.50 to 8.80(g/dl) with a mean of 6.79± 1.05 (SD)
and Hb3 in the non-treatment group ranged from 4.00 to 7.90 with a means of 5.84±
0.88 (SD). It shows a significant increase as the p-value (0.002) indicting 9increases
of Hb in case of treatment with NAC.
TOS before in the treatment group ranged from4.10 to 13.00 with a mean of 8.88±
2.21 (SD) and TOS before in the non-treatment group ranged from 4.50 to 13.50 with
a mean of 7.93 ± 2.05 (SD). TOS before in the 2 group shows difference was not
statistically significant, the p-value was (0.065). TOS after in the treatment group
ranged from 1.20 to 9.90 with a mean of 6.84± 2.18 and TOS after in the non-
treatment group ranged from 5.80 to 13.70 with a mean of 6.84 ± 2.18. TOS after in 2
groups shows difference was not statistically significant, the p-value was (0.014). By
comparing between the 2 groups in the Hb2 level shows improvement in the case of
the treatment group.
0
2
4
6
8
10
Treatment No Treatment
Hb 3
5
5.5
6
6.5
7
Hb 1 Hb 2 Hb 3
Treatment
No Treatment
89
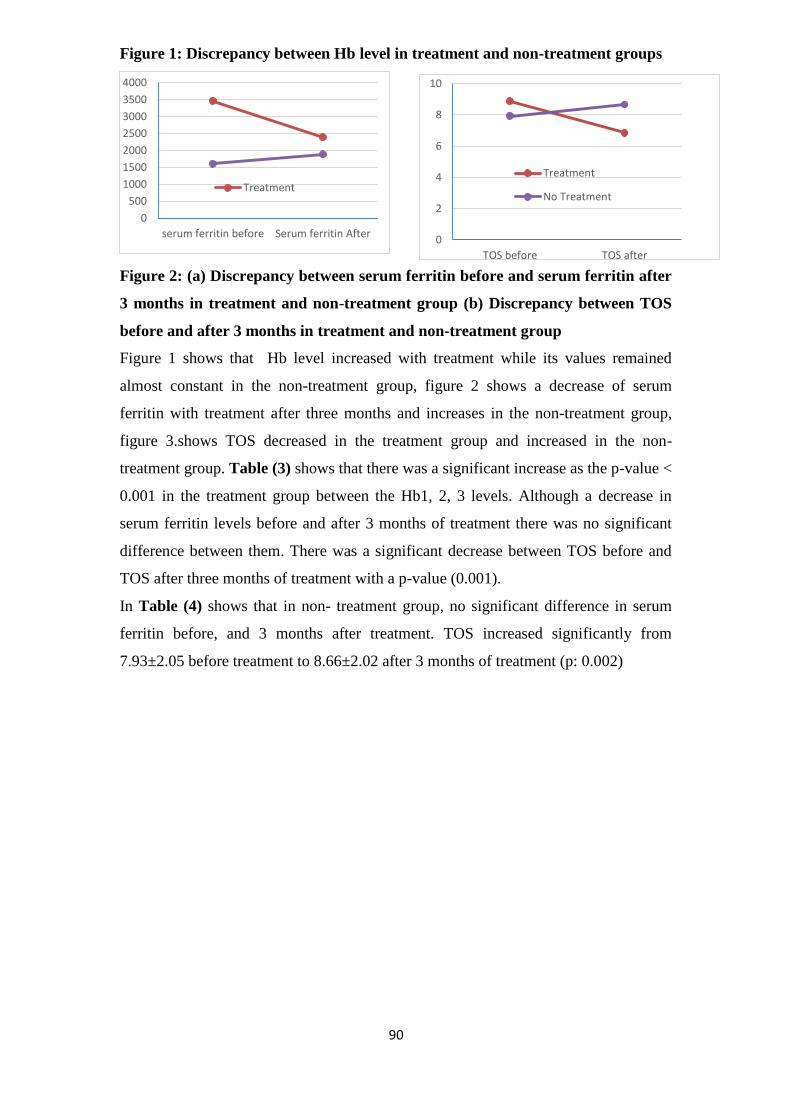
Figure 1: Discrepancy between Hb level in treatment and non-treatment groups
Figure 2: (a) Discrepancy between serum ferritin before and serum ferritin after
3 months in treatment and non-treatment group (b) Discrepancy between TOS
before and after 3 months in treatment and non-treatment group
Figure 1 shows that Hb level increased with treatment while its values remained
almost constant in the non-treatment group, figure 2 shows a decrease of serum
ferritin with treatment after three months and increases in the non-treatment group,
figure 3.shows TOS decreased in the treatment group and increased in the non-
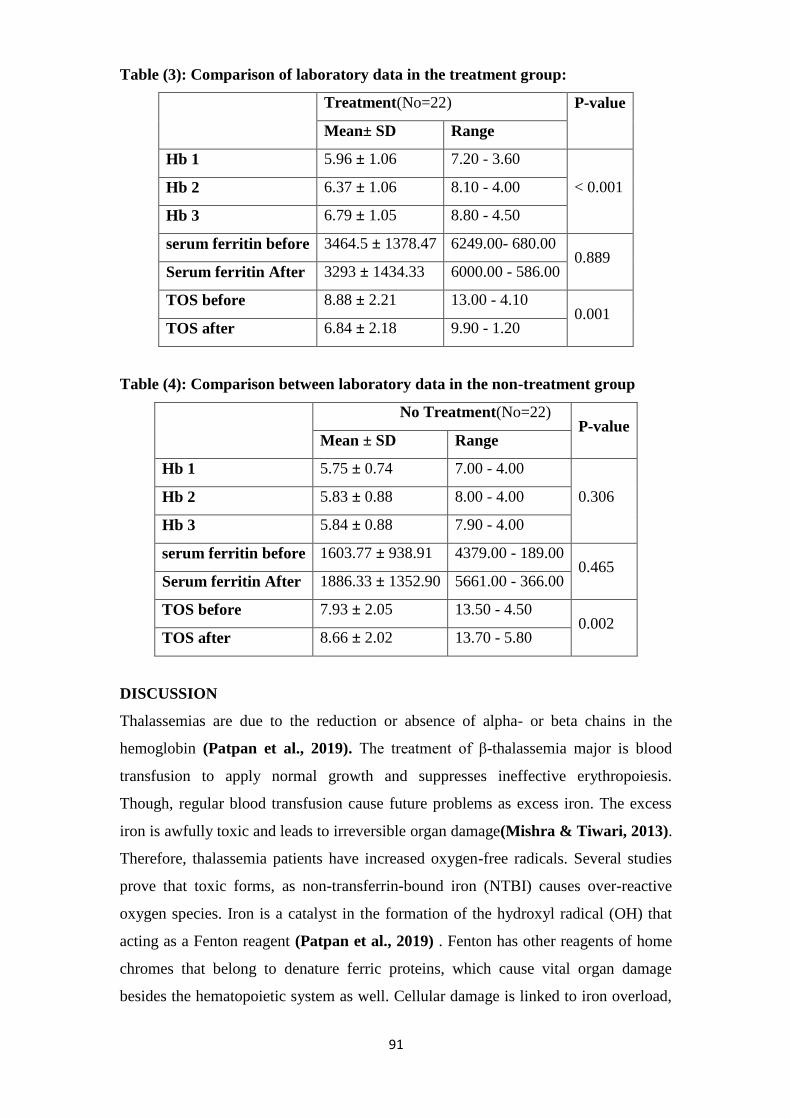
treatment group. Table (3) shows that there was a significant increase as the p-value <
0.001 in the treatment group between the Hb1, 2, 3 levels. Although a decrease in
serum ferritin levels before and after 3 months of treatment there was no significant
difference between them. There was a significant decrease between TOS before and
TOS after three months of treatment with a p-value (0.001).
In Table (4) shows that in non- treatment group, no significant difference in serum
ferritin before, and 3 months after treatment. TOS increased significantly from
7.93±2.05 before treatment to 8.66±2.02 after 3 months of treatment (p: 0.002)
0
500
1000
1500
2000
2500
3000
3500
4000
serum ferritin before Serum ferritin After
Treatment
0
2
4
6
8
10
TOS before TOS after
Treatment
No Treatment
89
Table (3): Comparison of laboratory data in the treatment group:
Treatment(No=22) P-value
Mean± SD Range
Hb 1 5.96 ± 1.06 7.20 - 3.60
< 0.001 Hb 2 6.37 ± 1.06 8.10 - 4.00
Hb 3 6.79 ± 1.05 8.80 - 4.50
serum ferritin before 3464.5 ± 1378.47 6249.00- 680.00 0.889
Serum ferritin After 3293 ± 1434.33 6000.00 - 586.00
TOS before 8.88 ± 2.21 13.00 - 4.10 0.001
TOS after 6.84 ± 2.18 9.90 - 1.20
Table (4): Comparison between laboratory data in the non-treatment group
No Treatment(No=22)
P-value Mean ± SD Range
Hb 1 5.75 ± 0.74 7.00 - 4.00
0.306 Hb 2 5.83 ± 0.88 8.00 - 4.00
Hb 3 5.84 ± 0.88 7.90 - 4.00
serum ferritin before 1603.77 ± 938.91 4379.00 - 189.00 0.465
Serum ferritin After 1886.33 ± 1352.90 5661.00 - 366.00
TOS before 7.93 ± 2.05 13.50 - 4.50 0.002
TOS after 8.66 ± 2.02 13.70 - 5.80
DISCUSSION
Thalassemias are due to the reduction or absence of alpha- or beta chains in the
hemoglobin (Patpan et al., 2019). The treatment of β-thalassemia major is blood
transfusion to apply normal growth and suppresses ineffective erythropoiesis.
Though, regular blood transfusion cause future problems as excess iron. The excess
iron is awfully toxic and leads to irreversible organ damage(Mishra & Tiwari, 2013).
Therefore, thalassemia patients have increased oxygen-free radicals. Several studies
prove that toxic forms, as non-transferrin-bound iron (NTBI) causes over-reactive
oxygen species. Iron is a catalyst in the formation of the hydroxyl radical (OH) that
acting as a Fenton reagent (Patpan et al., 2019) . Fenton has other reagents of home
chromes that belong to denature ferric proteins, which cause vital organ damage
besides the hematopoietic system as well. Cellular damage is linked to iron overload,
89
which causes production excess of ROS above the cellular defense abilities. Reactive
oxygen species lead to macromolecules damage, lipid peroxidation, oxidation of
amino acid and polypeptide chains causing cell death(Cappellini, Cohen, Porter,
Taher, & Viprakasit, 2014). The main objective of this study was to evaluate the
effects of NAC on total oxidant status and on Hb levels in children with β-thalassemia
major. A randomized clinical trial was adopted including 44 β-thalassemia major
patients from the regular attendants of the pediatric Hematology Clinic, Beni Suef
University Hospital as 22 patients received NAC for 3 months and 22 did not receive
NAC. The duration of the study ranged from 3 to 6 months.
Our study showed that the patient's age was 8.05 ± 3.35. But in (Ozdemir, Koc,
Aycicek, & Kocyigit, 2014), the mean age of their participants was 9.6 ±4.15. The
tested samples in our studies were 47.7 % females and 52.3% males. They were
divided 50 % with family history and the other half without a family history. Positive
consanguinity was found in 50 %, which indicates the role of genetic counseling in
the premarital stage.
Our study shows that 84.1 % of our patients had hepatomegaly, 61.4 % of them had
splenomegaly, and 20.5 % of them had a splenectomy. Patpan et al., 2019 reported
that most of the patients had beta-thalassemia/hemoglobin E (41 patients, 59.42%)
and most were splenectomies (49 patients, 71.01%) (Patpan et al., 2019). But
Ozdemir et al., 2014 reported that the percentage of splenectomy in the NAC group
was 40% for 10 patients(Ozdemir et al., 2014) .In the study in our hands, the samples
are divided for treated and non-treated. Our results are supported by the study of
Hamdy et al., 2015 as they reported that 56.7% of their patients were males, 43.3% of
them were females. 36.6% of them had a family history and 66.7% of them had
positive consanguinity. In our study female-to-male ratio 21:23 but in Yanpanitch et
al., 2015, the female-to-male ratio was 14: 11 in their patients(Hamdy, Mosallam,
Jamal, & Rabie, 2015). In our study, the patient's weight in kg was about 22.16 ±
6.81 but in Ozdemir et al., 2014, the mean of their weight was 28.5 ± 11.7 Kg
(Ozdemir et al., 2014). In our study, there was no significant difference for treated
and non-treated samples regarding age, age of first blood transfusion, frequency of
transfusion, and their weight. Our results are supported by the study of Patpan et al.,
2019 as they reported that there were no significant effects among studied groups as
regards: age and age of first transfusion (Patpan et al., 2019). Our study involved a
follow-up of Hb level every month and in our search no study follows up Hb level
after giving NAC to children with beta-thalassemia major in Egypt. As regard
89
comparison between treatment and the non-treatment group, there was a significant
difference between them in Hb2 as p-value 0.040 and also there was a significant
difference between them in Hb3 as a p-value of 0.002 which indicate improvement in
the treatment group with NAC. There was a significant increase in treatment group
Hb1, Hb2, and Hb3 with a p-value less than 0.001. Also in Hb1 and Hb2, there was a
significant increase with P-value 0.025. Also in Hb1 and Hb3, there was a significant
increase as P value < 0.001 and a significant increase between Hb2 and Hb3 as P-
value 0.013. But in the non-treatment group no significant difference between Hb1,
Hb2, and Hb3 as P-value 0.306. This indicates that, hemoglobin improved with NAC
for the treatment group and it increased with the follow-up. Our results are in
agreement with the study of Ozdemir et al., 2014. As they reported that pre-
transfusion hemoglobin (Hb) levels were significantly increased after 3 months
(p≤0.002) (Ozdemir et al., 2014). Serum ferritin is a hallmark of inadequate iron
chelation and vulnerability to develop iron-overloaded complications (Mishra &
Tiwari, 2013). Although, serum ferritin was decreased within three months in the
treatment group form 3464.5± 1378.47 to 3293± 1434.33. It was not a significant
factor for our experiment as its p-value had a higher value of more than 0.005, as the
serum ferritin levels in the treatment group started with higher levels. While in the
non-treatment group serum ferritin level was non-significantly increased from
1603.77± 938.91 to 1886.33± 1352.90 than non-treatment. Also our study was agreed
with previous studies reported that antioxidant and chelation therapy for thalassemia
shown efficacy of the decrease in oxidative stress, improvement of antioxidant
defense systems, and decrease in iron load (Hamdy et al., 2015). Our results show,
positive correlation between TOS and serum ferritin after 3 months with correlation
coefficient of 0.382 and with significant p-value of 0.01. Our results agreed with
Naithani et al., 2006, as parameters of oxidative stress were positively correlated
with ferritin suggesting the role of excess iron in generating free radicals and the
resultant tissue injury. These findings were somewhat compromised by the fact that
we used serum ferritin as the sole marker of iron overload, which is an imprecise
marker of total body iron burden ( Naithani et al., 2006).
In our study by comparison between 2 groups in serum TOS level before starting
treatment, there was no significant difference between them. But by comparison
between 2 groups in serum TOS after treatment for 3 months, there was a significant
difference as p-value 0.014. This indicates there was a decrease of oxidants in the
treatment group in reverse of the non-treatment group. In our study, there was a
88
significant decrease as the p-value of less than 0.001 between TOS before starting
treatment and after continuous on treatment for 3 months which indicates the role of
NAC in decreasing oxidants. Effect of iron chelator and NAC (as antioxidants) in
decrease serum ferritin level which is an indicator of the decrease in the iron load that
is responsible for the formation of reactive oxygen species.
In an experimental study, Amer et al., 2008 examined the effects of various oxidants
and antioxidants on lipid peroxidation in normal and thalassemia erythrocytes, and
they found lipid peroxidation was higher in the thalassemia erythrocytes and these
effects were reversed by NAC which coincides with our results and also coincides
with Ozdemir et al., 2014 [22,18]
Rodriguez et al., 2018 reported that, increased oxidative stress as well as iron
overload in the liver led to use of glutathione and might contribute to decreased levels
of glutathione in thalassemia patients. Therefore, NAC use in these patients, by
increasing intracellular glutathione, may be expected to have a positive influence on
oxidative effects (Rodriguez et al., 2018). In our study, there was a significant
increase as p-value 0.002 between TOS before and after 3 months in the non-
treatment group which indicates an increase of oxidants could be due to increase in
iron load and its effect. Our results are coinciding with the study of Kassab-Chekir et
al., 2003 as they reported that there was an increase Oxidant marker which indicates
the ongoing oxidative stress in beta-thalassemia, plasma antioxidant defenses were
overwhelmed and organs were no longer adequately protected and undergo oxidation
(Kassab-Chekir et al., 2003).
Finally, we concluded that in β-thalassemia major there is an increase in serum
oxidant status (TOS) level and we recommend giving NAC as antioxidants to
overcome this effect. In this study serum, TOS level decreased in the treatment group
besides the improvement of hemoglobin level.
CONCLUSION
N-acetylcysteine may be effective in reducing serum oxidative stress and increase
pre-transfusion Hb levels in children with β-thalassemia.
88
REFERENCES
Cao, A., & Galanello, R. (2010). Beta thalassemia. Genetics in medicine,
12(2), 61-76 .
Cappellini, M. D., Cohen, A., Porter, J., Taher, A., & Viprakasit, V. (Eds.).
(2014). Guidelines for the management of transfusion dependent thalassemia
(TDT) (pp. 148-9). Nicosia, Cyprus: Thalassaemia International Federation.
Chan, Y. (2003a). Biostatistics 102: quantitative data–parametric &
nonparametric tests. Blood press, 140(24.08), 79 .
Chan, Y. (2003b). Biostatistics 103: qualitative data tests of independence.
Singapore Med J, 44(10), 498-503 .
Faintuch, J., Aguilar, P. B., & Nadalin, W. (1999). Relevance of N-
acetylcysteine in clinical practice: fact, myth or consequence?-does added
glutamine change the effect? Nutrition, 2(15), 177-179 .
Hamdy, M. M., Mosallam, D. S., Jamal, A. M., & Rabie, W. A. (2015).
Selenium and Vitamin E as antioxidants in chronic hemolytic anemia: Are
they deficient? A case-control study in a group of Egyptian children. Journal
of advanced research, 6(6), 1071-1077 .
Hershko, C. (2010). Pathogenesis and management of iron toxicity in
thalassemia. Annals of the New York Academy of Sciences, 1202(1), 1-9 .
Kassab-Chekir, A., Laradi, S., Ferchichi, S., Khelil, A. H., Feki, M., Amri, F.,
. . . Miled, A. (2003). Oxidant, antioxidant status and metabolic data in
patients with beta thalassemia. Clinica Chimica Acta, 338(1-2), 79-86 .
Kolnagou, A., Economides, C., Eracleous, E., & Kontoghiorghes, G. J. (2008).
Long term comparative studies in thalassemia patients treated with
deferoxamine or a deferoxamine/deferiprone combination. Identification of
effective chelation therapy protocols. Hemoglobin, 32(1-2), 41-47 .
Mishra, A. K., & Tiwari, A. (2013). Iron overload in beta thalassemia major
and intermedia patients. Maedica, 8(4), 328 .
Muncie Jr, H. L., & Campbell, J. S. (2009). Alpha and beta thalassemia.
American family physician, 80(4), 339-344 .
Naithani, R., Chandra, J., Bhattacharjee, J., Verma, P., & Narayan, S. (2006).
Peroxidative stress and antioxidant enzymes in children with β‐thalassemia
major. Pediatric blood & cancer, 46(7), 780-785 .
Origa, R. (2017). β-thalassemia. Genetics in medicine, 19(6), 609-619 .
88
Ozdemir, Z. C., Koc, A., Aycicek, A., & Kocyigit, A. (2014). N-acetylcysteine
supplementation reduces oxidative stress and DNA damage in children with β-
thalassemia. Hemoglobin, 38(5), 359-364 .
Patpan, N., Banjerdpongchai, R., Tantiworawit, A., Poofery, J., Komonrit, P.,
Fanhchaksai, K.,. Norasetthada, L. (2019). The Effect of Transfusion-
Dependent Thalassemia Patient’s Serum on Peripheral Blood Mononuclear
Cell Viability. Journal of Cell Death, 12, 1179066018823534 .
Prati, D. (2000). Benefits and complications of regular blood transfusion in
patients with beta-thalassemia major. Vox sanguinis, 79(3), 129-137 .
Rodriguez, B. M., Khouzami, L., Decostre, V., Varnous, S., Pekovic-
Vaughan, V., Hutchison, C. J., . . . Muchir, A. (2018). N-acetyl cysteine
alleviates oxidative stress and protects mice from dilated cardiomyopathy
caused by mutations in nuclear A-type lamins gene. Human molecular
genetics, 27(19), 3353-3360 .
Zastawny, T. H., Altman, S. A., Randers-Eichhorn, L., Madurawe, R.,
Lumpkin, J. A., Dizdaroglu, M., & Rao, G. (1995). DNA base modifications
and membrane damage in cultured mammalian cells treated with iron ions.
Free Radical Biology and Medicine, 18(6), 1013-1022 .
Top Related