X-ray Diffraction Data for Refinement and DepositionIn macromolecular x-ray crystallography,...
19
X-ray Diffraction Data for Refinement and Deposition Xinhua Ji
Transcript of X-ray Diffraction Data for Refinement and DepositionIn macromolecular x-ray crystallography,...
X-ray Diffraction Data for
Refinement and Deposition
Xinhua Ji
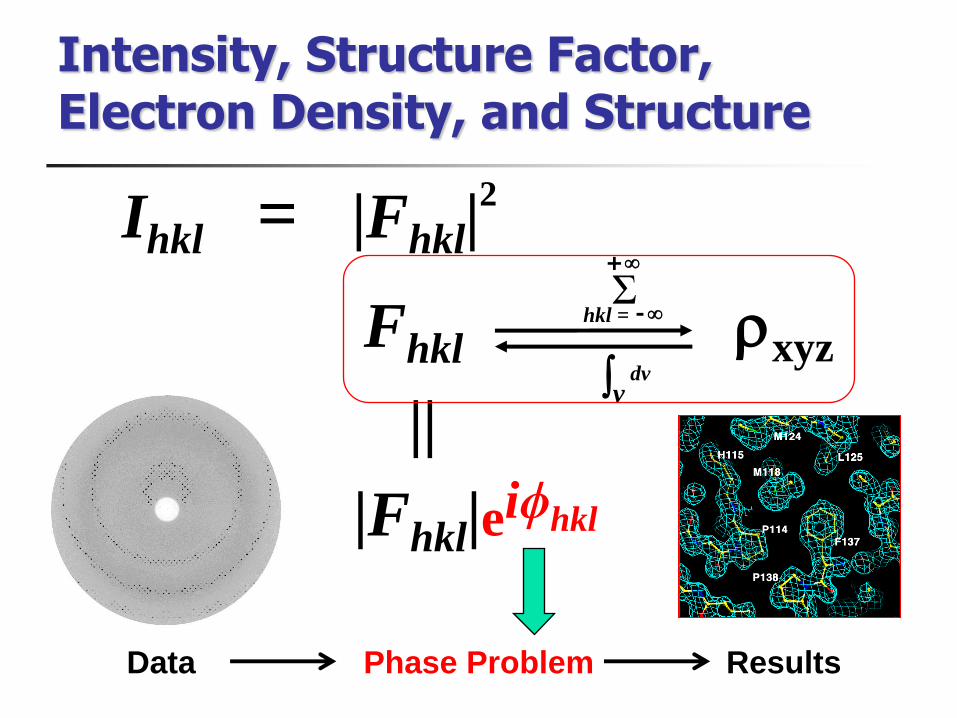
Intensity Structure Factor Electron Density and Structure
Ihkl = |Fhkl|2
Fhkl rxyz dv v
Σ hkl = -
+
Data Phase Problem Results
|Fhkl|e
iϕhkl
||
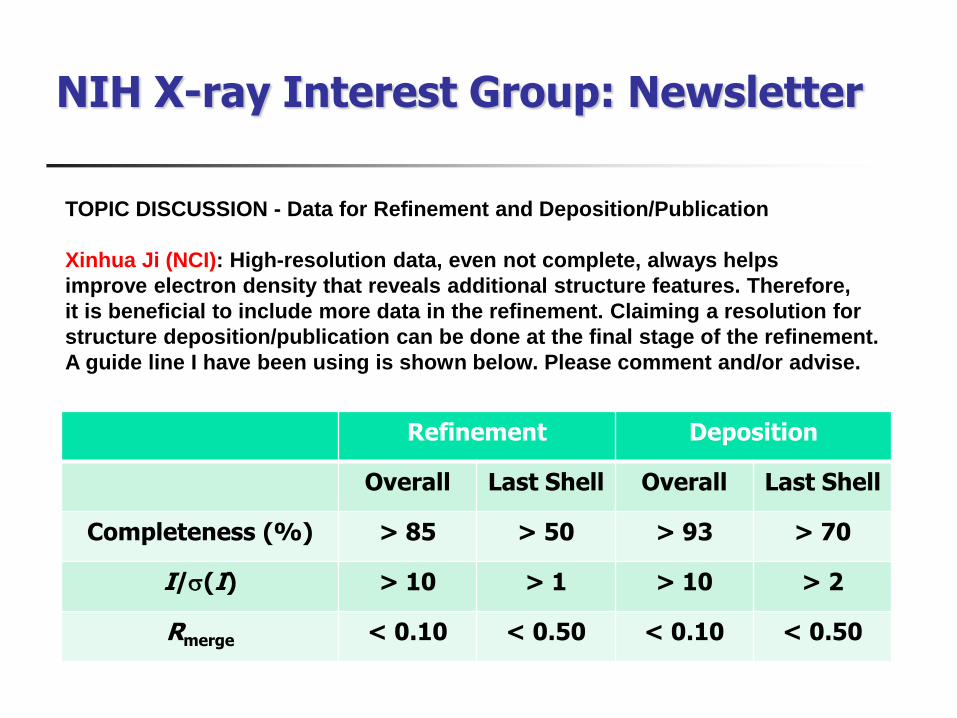
NIH X-ray Interest Group Newsletter
TOPIC DISCUSSION - Data for Refinement and DepositionPublication
Xinhua Ji (NCI) High-resolution data even not complete always helps
improve electron density that reveals additional structure features Therefore
it is beneficial to include more data in the refinement Claiming a resolution for
structure depositionpublication can be done at the final stage of the refinement
A guide line I have been using is shown below Please comment andor advise
Refinement Deposition
Overall Last Shell Overall Last Shell
Completeness () gt 85 gt 50 gt 93 gt 70
Is(I) gt 10 gt 1 gt 10 gt 2
Rmerge lt 010 lt 050 lt 010 lt 050
Mark Mayer NICHD
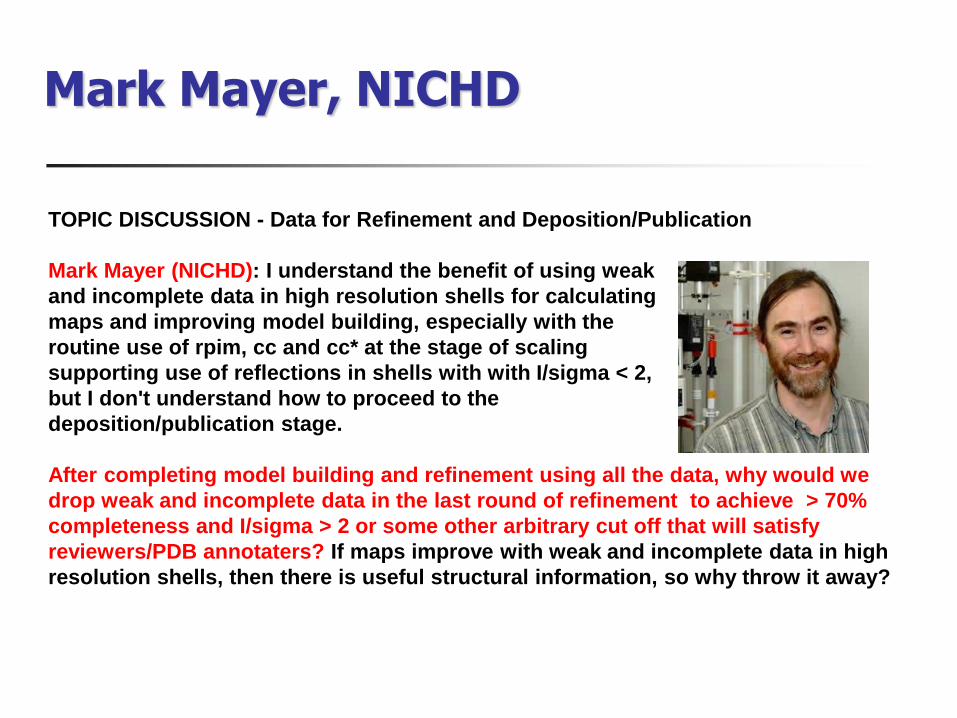
TOPIC DISCUSSION - Data for Refinement and DepositionPublication
Mark Mayer (NICHD) I understand the benefit of using weak
and incomplete data in high resolution shells for calculating
maps and improving model building especially with the
routine use of rpim cc and cc at the stage of scaling
supporting use of reflections in shells with with Isigma lt 2
but I dont understand how to proceed to the
depositionpublication stage
After completing model building and refinement using all the data why would we
drop weak and incomplete data in the last round of refinement to achieve gt 70
completeness and Isigma gt 2 or some other arbitrary cut off that will satisfy
reviewersPDB annotaters If maps improve with weak and incomplete data in high
resolution shells then there is useful structural information so why throw it away
Mariusz Jaskolski PAC
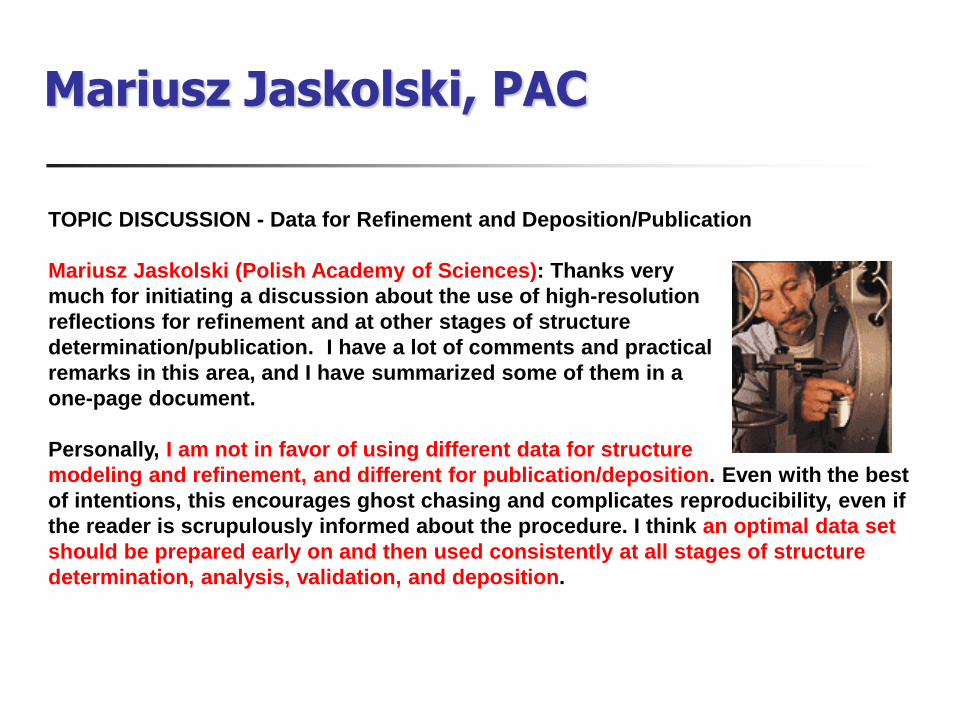
TOPIC DISCUSSION - Data for Refinement and DepositionPublication
Mariusz Jaskolski (Polish Academy of Sciences) Thanks very
much for initiating a discussion about the use of high-resolution
reflections for refinement and at other stages of structure
determinationpublication I have a lot of comments and practical
remarks in this area and I have summarized some of them in a
one-page document
Personally I am not in favor of using different data for structure
modeling and refinement and different for publicationdeposition Even with the best
of intentions this encourages ghost chasing and complicates reproducibility even if
the reader is scrupulously informed about the procedure I think an optimal data set
should be prepared early on and then used consistently at all stages of structure
determination analysis validation and deposition
Weak Data Do No Harm
How good are my data and what is the resolution Philip R Evansa and Garib N Murshudova aMRC Laboratory of Molecular Biology Hills Road Cambridge CB2 0QH England
Acta D 691204-1214 2013
At the very least adding these weak data seems to do no harm for the purposes of
either automatic or manual model building
From our limited tests here it seems that changing the resolution cutoff over a
considerable range (eg from 22 to 19 Aring) makes only a small difference so the exact
cutoff point is not a question to agonize over but it seems sensible to set a generous
limit so as not to exclude data containing real (if weak) information
Weak Data Contain Real Information
Better models by discarding data K Diederichsa and P A Karplusb A Faculty of Biology University of Konstanz M647 78457 Konstanz Germany B Department of Biochemistry and Biophysics Oregon State University Corvallis OR 97331 USA
Acta D 691215-1222 2013
Using experimental data sets the behavior of CC12 and the more conventional indicators were compared in two situations of practical importance merging data sets from different crystals and selectively rejecting weak observations or (merged) unique reflections from a data set In these situations controlled lsquopaired-refinementrsquo tests show that even though discarding the weaker data leads to improvements in the merging R values the refined models based on these data are of lower quality These results show the folly of such data-filtering practices aimed at improving the merging R values
High-Resolution Weak Data Are Important
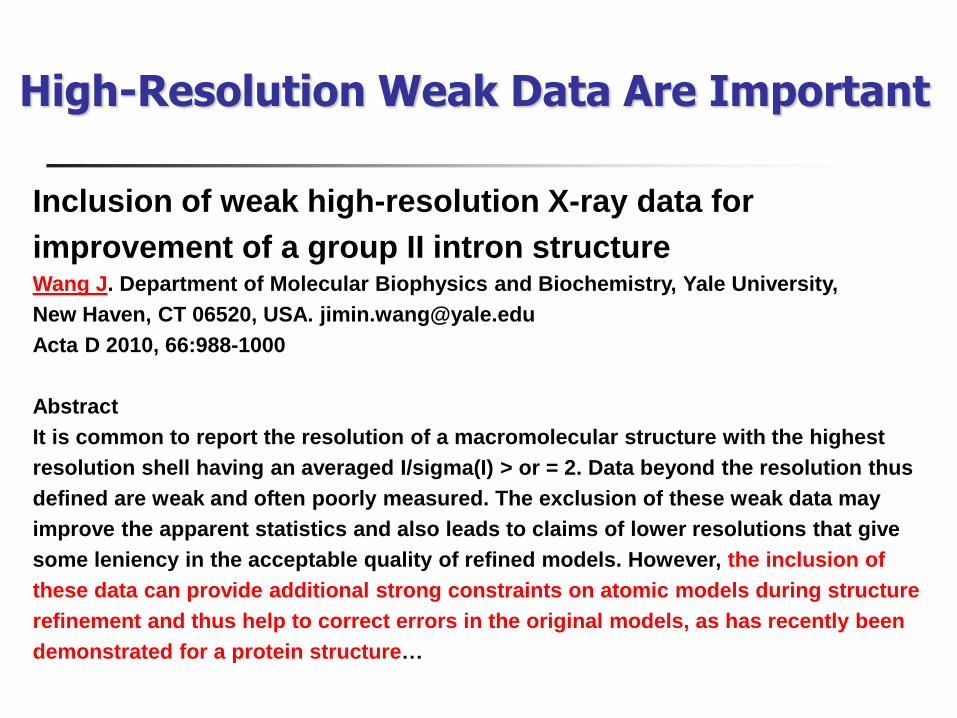
Inclusion of weak high-resolution X-ray data for
improvement of a group II intron structure Wang J Department of Molecular Biophysics and Biochemistry Yale University
New Haven CT 06520 USA jiminwangyaleedu
Acta D 2010 66988-1000
Abstract
It is common to report the resolution of a macromolecular structure with the highest
resolution shell having an averaged Isigma(I) gt or = 2 Data beyond the resolution thus
defined are weak and often poorly measured The exclusion of these weak data may
improve the apparent statistics and also leads to claims of lower resolutions that give
some leniency in the acceptable quality of refined models However the inclusion of
these data can provide additional strong constraints on atomic models during structure
refinement and thus help to correct errors in the original models as has recently been
demonstrated for a protein structurehellip
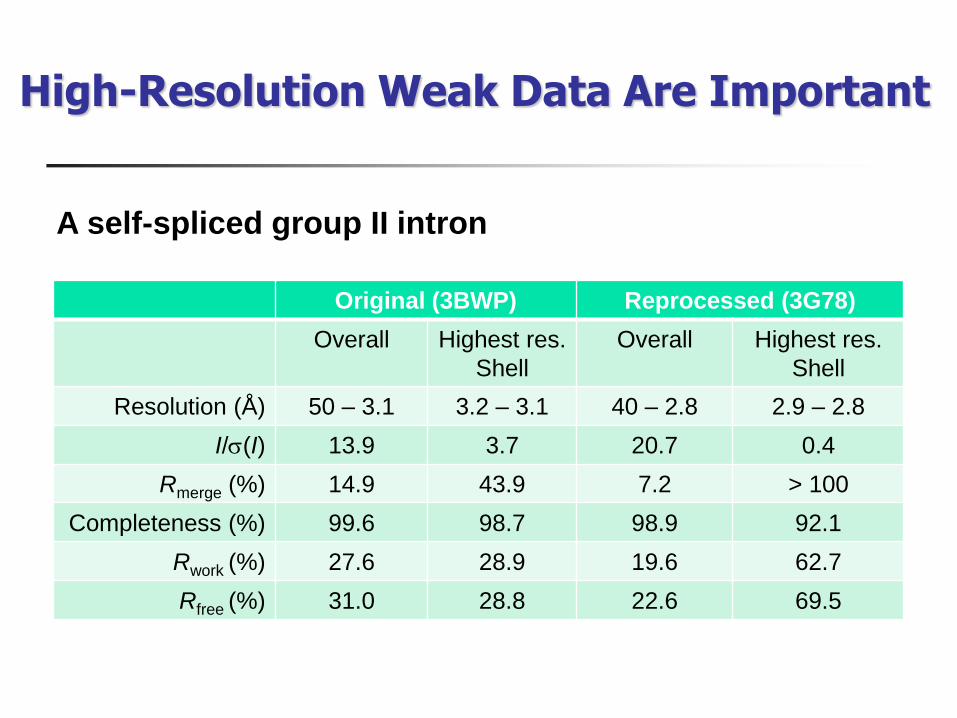
Original (3BWP) Reprocessed (3G78)
Overall Highest res
Shell
Overall Highest res
Shell
Resolution (Aring) 50 ndash 31 32 ndash 31 40 ndash 28 29 ndash 28
Is(I) 139 37 207 04
Rmerge () 149 439 72 gt 100
Completeness () 996 987 989 921
Rwork () 276 289 196 627
Rfree () 310 288 226 695
A self-spliced group II intron
High-Resolution Weak Data Are Important
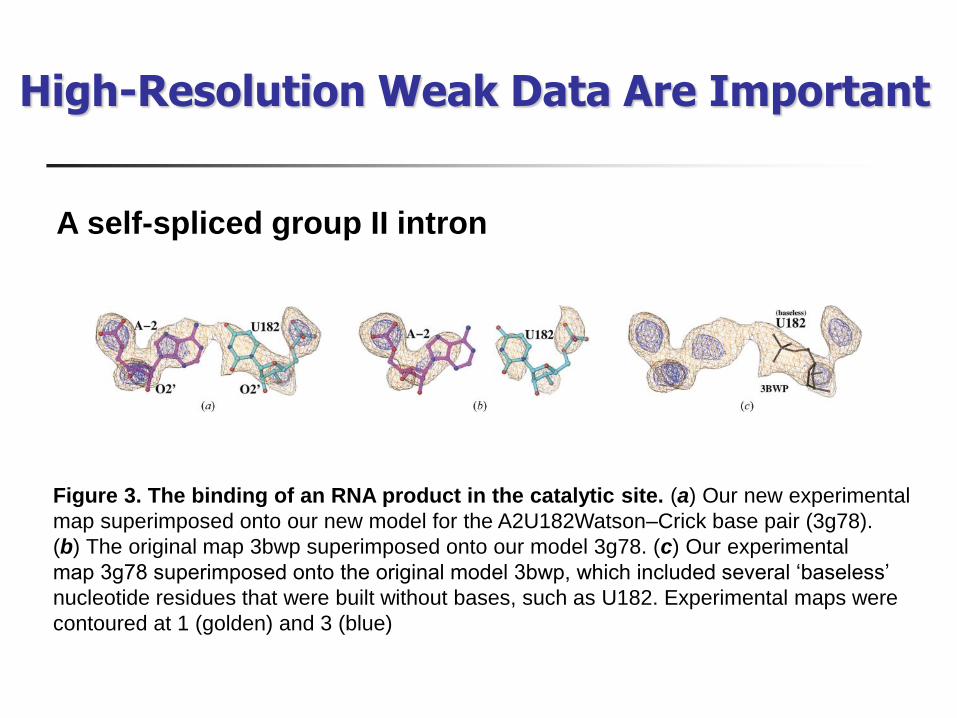
A self-spliced group II intron
Figure 3 The binding of an RNA product in the catalytic site (a) Our new experimental
map superimposed onto our new model for the A2U182WatsonndashCrick base pair (3g78)
(b) The original map 3bwp superimposed onto our model 3g78 (c) Our experimental
map 3g78 superimposed onto the original model 3bwp which included several lsquobaselessrsquo
nucleotide residues that were built without bases such as U182 Experimental maps were
contoured at 1 (golden) and 3 (blue)
High-Resolution Weak Data Are Important
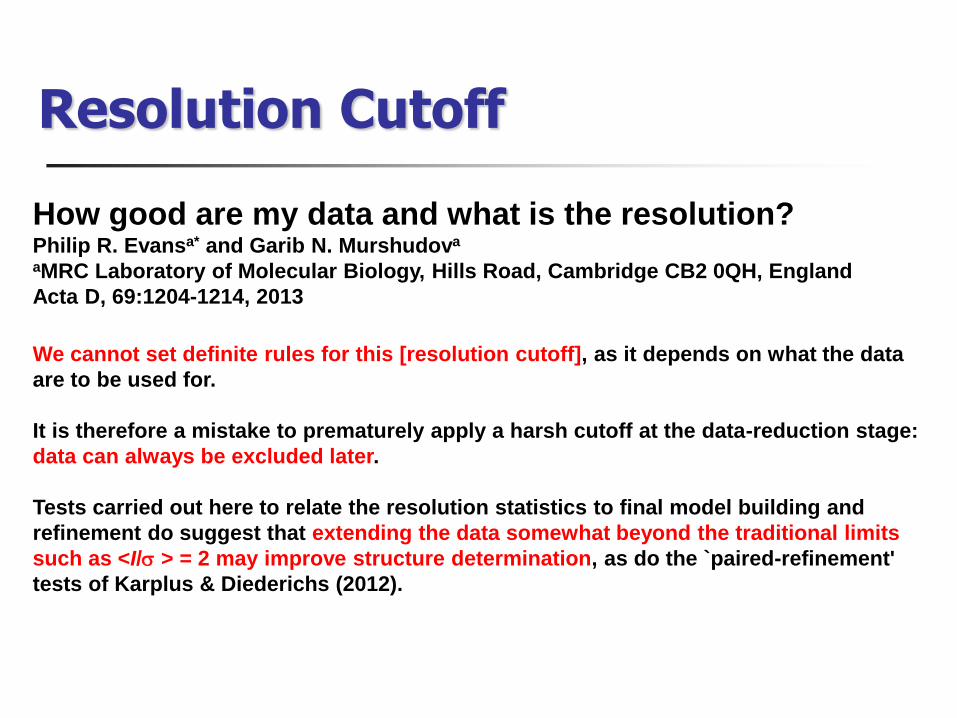
Resolution Cutoff
How good are my data and what is the resolution Philip R Evansa and Garib N Murshudova
aMRC Laboratory of Molecular Biology Hills Road Cambridge CB2 0QH England
Acta D 691204-1214 2013
We cannot set definite rules for this [resolution cutoff] as it depends on what the data
are to be used for
It is therefore a mistake to prematurely apply a harsh cutoff at the data-reduction stage
data can always be excluded later
Tests carried out here to relate the resolution statistics to final model building and
refinement do suggest that extending the data somewhat beyond the traditional limits
such as ltIs gt = 2 may improve structure determination as do the `paired-refinement
tests of Karplus amp Diederichs (2012)
Acta D Recommendations
Notes for Authors 2012
111 Resolution
The effective resolution should be described clearly Values
of the internal agreement of the data Rmerge together with
the multiplicity the mean value of Is and the percentage
completeness of the data are required for the overall data set
and the highest resolution shell together with the limits of that
shell in Aring For high-quality data obtained with synchrotron
radiation completeness gt 93 and observable data gt 70
should be achievable for the highest resolution shell
Acta F Requirements
Notes for Authors 2014
51 Structural data
Table 3 Data collection and processing
If completeness lt93 or completeness in outer shell lt70
please provide an explanation [as a footnote here] dagger If mean Iσ(I) in outer shell is lt20 please provide an explanation
[as a footnote here] and provide resolution at which it falls below 20 Dagger Only the redundancy-independent merging R factor Rrim or Rmeas
should be reported If these values are not available they may be
estimated by multiplying the conventional Rmerge value by the
factor [N(N - 1)]12 where N is the data multiplicity [in such cases
provide a footnote here]
Redundancy-independent Rrim
Precision-indicating Rpim
Recommendations
What about the Pearson correlation coefficient
Scaled Data Structure (Aring)
Overall Last Shell Overall Last Shell
Completeness () gt 85 gt 50 gt 93 gt 70
Is(I) gt 1 gt 2
Rmerge lt 1 lt 1
Rrim or Rpim
Pearson Correlation Coefficient
Linking crystallographic model and data quality Karplus PA1 Diederichs K 1 Department of Biochemistry and Biophysics Oregon State University Corvallis OR 97331 USA
Science 2012 May 25336(6084)1030-3
Abstract In macromolecular x-ray crystallography refinement R values measure the agreement between observed and calculated data Analogously R(merge) values reporting on the agreement between multiple measurements of a given reflection are used to assess data quality Here we show that despite their widespread use R(merge) values are poorly suited for determining the high-resolution limit and that current standard protocols discard much useful data We introduce a statistic that estimates the correlation of an observed data set with the underlying (not measurable) true signal this quantity CC provides a single statistically valid guide for deciding which data are useful CC also can be used to assess model and data quality on the same scale and this reveals when data quality is limiting model improvement
CC12 CC CCwork and CCfree
Diederichs K amp Karplus P A (2013) In Advancing Methods for Biomolecular Crystallography edited by
R Read A G Urzhumtsev amp V Y Lunin New York Springer-Verlag
Recommendations
Scaled Data Structure (Aring)
Overall Last Shell Overall Last Shell
Completeness () gt 85 gt 50 gt 93 gt 70
Is(I) gt 1 gt 2
Rmerge lt 1 lt 1
Rrim or Rpim
CC12 or CC NA NA
Intensity Structure Factor Electron Density and Structure
Ihkl = |Fhkl|2
Fhkl rxyz dv v
Σ hkl = -
+
Data Phase Problem Results
|Fhkl|e
iϕhkl
||
NIH X-ray Interest Group Newsletter
TOPIC DISCUSSION - Data for Refinement and DepositionPublication
Xinhua Ji (NCI) High-resolution data even not complete always helps
improve electron density that reveals additional structure features Therefore
it is beneficial to include more data in the refinement Claiming a resolution for
structure depositionpublication can be done at the final stage of the refinement
A guide line I have been using is shown below Please comment andor advise
Refinement Deposition
Overall Last Shell Overall Last Shell
Completeness () gt 85 gt 50 gt 93 gt 70
Is(I) gt 10 gt 1 gt 10 gt 2
Rmerge lt 010 lt 050 lt 010 lt 050
Mark Mayer NICHD
TOPIC DISCUSSION - Data for Refinement and DepositionPublication
Mark Mayer (NICHD) I understand the benefit of using weak
and incomplete data in high resolution shells for calculating
maps and improving model building especially with the
routine use of rpim cc and cc at the stage of scaling
supporting use of reflections in shells with with Isigma lt 2
but I dont understand how to proceed to the
depositionpublication stage
After completing model building and refinement using all the data why would we
drop weak and incomplete data in the last round of refinement to achieve gt 70
completeness and Isigma gt 2 or some other arbitrary cut off that will satisfy
reviewersPDB annotaters If maps improve with weak and incomplete data in high
resolution shells then there is useful structural information so why throw it away
Mariusz Jaskolski PAC
TOPIC DISCUSSION - Data for Refinement and DepositionPublication
Mariusz Jaskolski (Polish Academy of Sciences) Thanks very
much for initiating a discussion about the use of high-resolution
reflections for refinement and at other stages of structure
determinationpublication I have a lot of comments and practical
remarks in this area and I have summarized some of them in a
one-page document
Personally I am not in favor of using different data for structure
modeling and refinement and different for publicationdeposition Even with the best
of intentions this encourages ghost chasing and complicates reproducibility even if
the reader is scrupulously informed about the procedure I think an optimal data set
should be prepared early on and then used consistently at all stages of structure
determination analysis validation and deposition
Weak Data Do No Harm
How good are my data and what is the resolution Philip R Evansa and Garib N Murshudova aMRC Laboratory of Molecular Biology Hills Road Cambridge CB2 0QH England
Acta D 691204-1214 2013
At the very least adding these weak data seems to do no harm for the purposes of
either automatic or manual model building
From our limited tests here it seems that changing the resolution cutoff over a
considerable range (eg from 22 to 19 Aring) makes only a small difference so the exact
cutoff point is not a question to agonize over but it seems sensible to set a generous
limit so as not to exclude data containing real (if weak) information
Weak Data Contain Real Information
Better models by discarding data K Diederichsa and P A Karplusb A Faculty of Biology University of Konstanz M647 78457 Konstanz Germany B Department of Biochemistry and Biophysics Oregon State University Corvallis OR 97331 USA
Acta D 691215-1222 2013
Using experimental data sets the behavior of CC12 and the more conventional indicators were compared in two situations of practical importance merging data sets from different crystals and selectively rejecting weak observations or (merged) unique reflections from a data set In these situations controlled lsquopaired-refinementrsquo tests show that even though discarding the weaker data leads to improvements in the merging R values the refined models based on these data are of lower quality These results show the folly of such data-filtering practices aimed at improving the merging R values
High-Resolution Weak Data Are Important
Inclusion of weak high-resolution X-ray data for
improvement of a group II intron structure Wang J Department of Molecular Biophysics and Biochemistry Yale University
New Haven CT 06520 USA jiminwangyaleedu
Acta D 2010 66988-1000
Abstract
It is common to report the resolution of a macromolecular structure with the highest
resolution shell having an averaged Isigma(I) gt or = 2 Data beyond the resolution thus
defined are weak and often poorly measured The exclusion of these weak data may
improve the apparent statistics and also leads to claims of lower resolutions that give
some leniency in the acceptable quality of refined models However the inclusion of
these data can provide additional strong constraints on atomic models during structure
refinement and thus help to correct errors in the original models as has recently been
demonstrated for a protein structurehellip
Original (3BWP) Reprocessed (3G78)
Overall Highest res
Shell
Overall Highest res
Shell
Resolution (Aring) 50 ndash 31 32 ndash 31 40 ndash 28 29 ndash 28
Is(I) 139 37 207 04
Rmerge () 149 439 72 gt 100
Completeness () 996 987 989 921
Rwork () 276 289 196 627
Rfree () 310 288 226 695
A self-spliced group II intron
High-Resolution Weak Data Are Important
A self-spliced group II intron
Figure 3 The binding of an RNA product in the catalytic site (a) Our new experimental
map superimposed onto our new model for the A2U182WatsonndashCrick base pair (3g78)
(b) The original map 3bwp superimposed onto our model 3g78 (c) Our experimental
map 3g78 superimposed onto the original model 3bwp which included several lsquobaselessrsquo
nucleotide residues that were built without bases such as U182 Experimental maps were
contoured at 1 (golden) and 3 (blue)
High-Resolution Weak Data Are Important
Resolution Cutoff
How good are my data and what is the resolution Philip R Evansa and Garib N Murshudova
aMRC Laboratory of Molecular Biology Hills Road Cambridge CB2 0QH England
Acta D 691204-1214 2013
We cannot set definite rules for this [resolution cutoff] as it depends on what the data
are to be used for
It is therefore a mistake to prematurely apply a harsh cutoff at the data-reduction stage
data can always be excluded later
Tests carried out here to relate the resolution statistics to final model building and
refinement do suggest that extending the data somewhat beyond the traditional limits
such as ltIs gt = 2 may improve structure determination as do the `paired-refinement
tests of Karplus amp Diederichs (2012)
Acta D Recommendations
Notes for Authors 2012
111 Resolution
The effective resolution should be described clearly Values
of the internal agreement of the data Rmerge together with
the multiplicity the mean value of Is and the percentage
completeness of the data are required for the overall data set
and the highest resolution shell together with the limits of that
shell in Aring For high-quality data obtained with synchrotron
radiation completeness gt 93 and observable data gt 70
should be achievable for the highest resolution shell
Acta F Requirements
Notes for Authors 2014
51 Structural data
Table 3 Data collection and processing
If completeness lt93 or completeness in outer shell lt70
please provide an explanation [as a footnote here] dagger If mean Iσ(I) in outer shell is lt20 please provide an explanation
[as a footnote here] and provide resolution at which it falls below 20 Dagger Only the redundancy-independent merging R factor Rrim or Rmeas
should be reported If these values are not available they may be
estimated by multiplying the conventional Rmerge value by the
factor [N(N - 1)]12 where N is the data multiplicity [in such cases
provide a footnote here]
Redundancy-independent Rrim
Precision-indicating Rpim
Recommendations
What about the Pearson correlation coefficient
Scaled Data Structure (Aring)
Overall Last Shell Overall Last Shell
Completeness () gt 85 gt 50 gt 93 gt 70
Is(I) gt 1 gt 2
Rmerge lt 1 lt 1
Rrim or Rpim
Pearson Correlation Coefficient
Linking crystallographic model and data quality Karplus PA1 Diederichs K 1 Department of Biochemistry and Biophysics Oregon State University Corvallis OR 97331 USA
Science 2012 May 25336(6084)1030-3
Abstract In macromolecular x-ray crystallography refinement R values measure the agreement between observed and calculated data Analogously R(merge) values reporting on the agreement between multiple measurements of a given reflection are used to assess data quality Here we show that despite their widespread use R(merge) values are poorly suited for determining the high-resolution limit and that current standard protocols discard much useful data We introduce a statistic that estimates the correlation of an observed data set with the underlying (not measurable) true signal this quantity CC provides a single statistically valid guide for deciding which data are useful CC also can be used to assess model and data quality on the same scale and this reveals when data quality is limiting model improvement
CC12 CC CCwork and CCfree
Diederichs K amp Karplus P A (2013) In Advancing Methods for Biomolecular Crystallography edited by
R Read A G Urzhumtsev amp V Y Lunin New York Springer-Verlag
Recommendations
Scaled Data Structure (Aring)
Overall Last Shell Overall Last Shell
Completeness () gt 85 gt 50 gt 93 gt 70
Is(I) gt 1 gt 2
Rmerge lt 1 lt 1
Rrim or Rpim
CC12 or CC NA NA
High-Resolution Weak Data Are Important
Inclusion of weak high-resolution X-ray data for
improvement of a group II intron structure Wang J Department of Molecular Biophysics and Biochemistry Yale University
New Haven CT 06520 USA jiminwangyaleedu
Acta D 2010 66988-1000
Abstract
It is common to report the resolution of a macromolecular structure with the highest
resolution shell having an averaged Isigma(I) gt or = 2 Data beyond the resolution thus
defined are weak and often poorly measured The exclusion of these weak data may
improve the apparent statistics and also leads to claims of lower resolutions that give
some leniency in the acceptable quality of refined models However the inclusion of
these data can provide additional strong constraints on atomic models during structure
refinement and thus help to correct errors in the original models as has recently been
demonstrated for a protein structurehellip
Original (3BWP) Reprocessed (3G78)
Overall Highest res
Shell
Overall Highest res
Shell
Resolution (Aring) 50 ndash 31 32 ndash 31 40 ndash 28 29 ndash 28
Is(I) 139 37 207 04
Rmerge () 149 439 72 gt 100
Completeness () 996 987 989 921
Rwork () 276 289 196 627
Rfree () 310 288 226 695
A self-spliced group II intron
High-Resolution Weak Data Are Important
A self-spliced group II intron
Figure 3 The binding of an RNA product in the catalytic site (a) Our new experimental
map superimposed onto our new model for the A2U182WatsonndashCrick base pair (3g78)
(b) The original map 3bwp superimposed onto our model 3g78 (c) Our experimental
map 3g78 superimposed onto the original model 3bwp which included several lsquobaselessrsquo
nucleotide residues that were built without bases such as U182 Experimental maps were
contoured at 1 (golden) and 3 (blue)
High-Resolution Weak Data Are Important
Resolution Cutoff
How good are my data and what is the resolution Philip R Evansa and Garib N Murshudova
aMRC Laboratory of Molecular Biology Hills Road Cambridge CB2 0QH England
Acta D 691204-1214 2013
We cannot set definite rules for this [resolution cutoff] as it depends on what the data
are to be used for
It is therefore a mistake to prematurely apply a harsh cutoff at the data-reduction stage
data can always be excluded later
Tests carried out here to relate the resolution statistics to final model building and
refinement do suggest that extending the data somewhat beyond the traditional limits
such as ltIs gt = 2 may improve structure determination as do the `paired-refinement
tests of Karplus amp Diederichs (2012)
Acta D Recommendations
Notes for Authors 2012
111 Resolution
The effective resolution should be described clearly Values
of the internal agreement of the data Rmerge together with
the multiplicity the mean value of Is and the percentage
completeness of the data are required for the overall data set
and the highest resolution shell together with the limits of that
shell in Aring For high-quality data obtained with synchrotron
radiation completeness gt 93 and observable data gt 70
should be achievable for the highest resolution shell
Acta F Requirements
Notes for Authors 2014
51 Structural data
Table 3 Data collection and processing
If completeness lt93 or completeness in outer shell lt70
please provide an explanation [as a footnote here] dagger If mean Iσ(I) in outer shell is lt20 please provide an explanation
[as a footnote here] and provide resolution at which it falls below 20 Dagger Only the redundancy-independent merging R factor Rrim or Rmeas
should be reported If these values are not available they may be
estimated by multiplying the conventional Rmerge value by the
factor [N(N - 1)]12 where N is the data multiplicity [in such cases
provide a footnote here]
Redundancy-independent Rrim
Precision-indicating Rpim
Recommendations
What about the Pearson correlation coefficient
Scaled Data Structure (Aring)
Overall Last Shell Overall Last Shell
Completeness () gt 85 gt 50 gt 93 gt 70
Is(I) gt 1 gt 2
Rmerge lt 1 lt 1
Rrim or Rpim
Pearson Correlation Coefficient
Linking crystallographic model and data quality Karplus PA1 Diederichs K 1 Department of Biochemistry and Biophysics Oregon State University Corvallis OR 97331 USA
Science 2012 May 25336(6084)1030-3
Abstract In macromolecular x-ray crystallography refinement R values measure the agreement between observed and calculated data Analogously R(merge) values reporting on the agreement between multiple measurements of a given reflection are used to assess data quality Here we show that despite their widespread use R(merge) values are poorly suited for determining the high-resolution limit and that current standard protocols discard much useful data We introduce a statistic that estimates the correlation of an observed data set with the underlying (not measurable) true signal this quantity CC provides a single statistically valid guide for deciding which data are useful CC also can be used to assess model and data quality on the same scale and this reveals when data quality is limiting model improvement
CC12 CC CCwork and CCfree
Diederichs K amp Karplus P A (2013) In Advancing Methods for Biomolecular Crystallography edited by
R Read A G Urzhumtsev amp V Y Lunin New York Springer-Verlag
Recommendations
Scaled Data Structure (Aring)
Overall Last Shell Overall Last Shell
Completeness () gt 85 gt 50 gt 93 gt 70
Is(I) gt 1 gt 2
Rmerge lt 1 lt 1
Rrim or Rpim
CC12 or CC NA NA
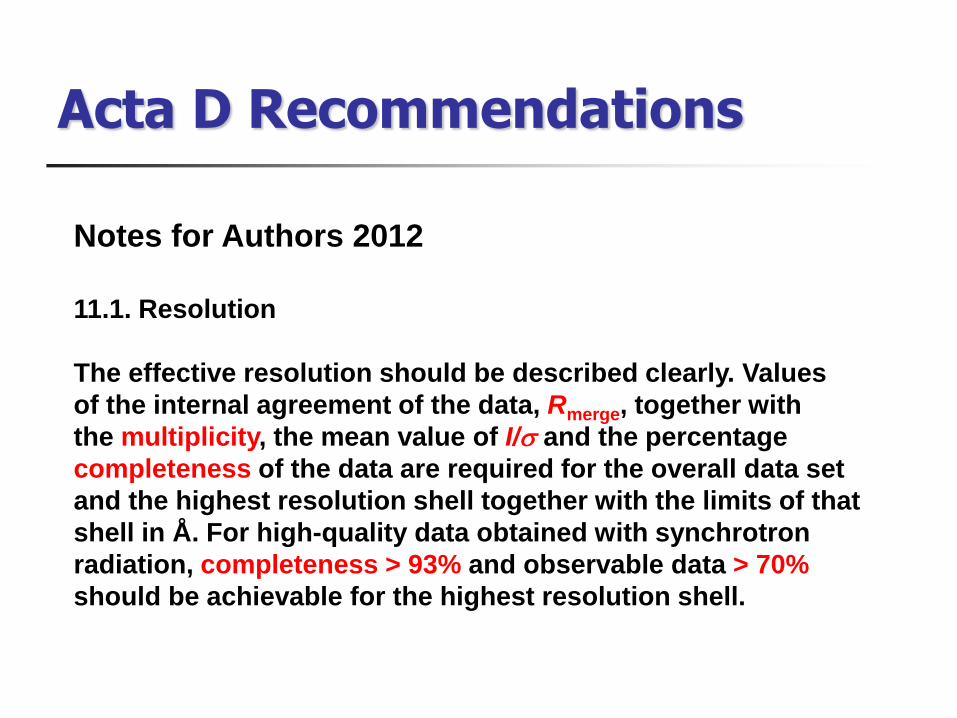
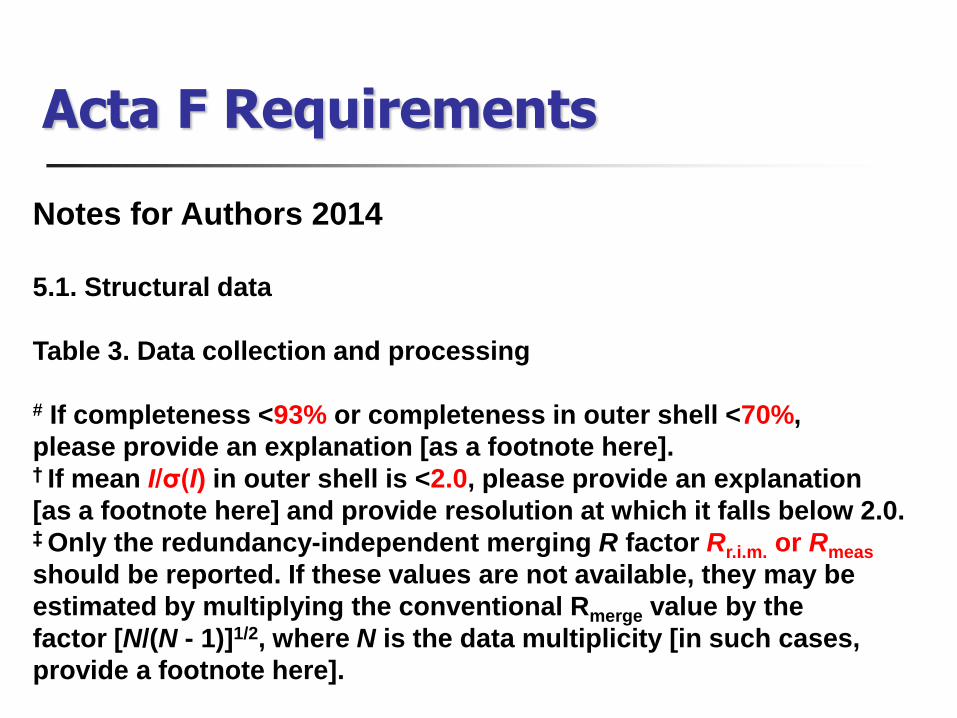
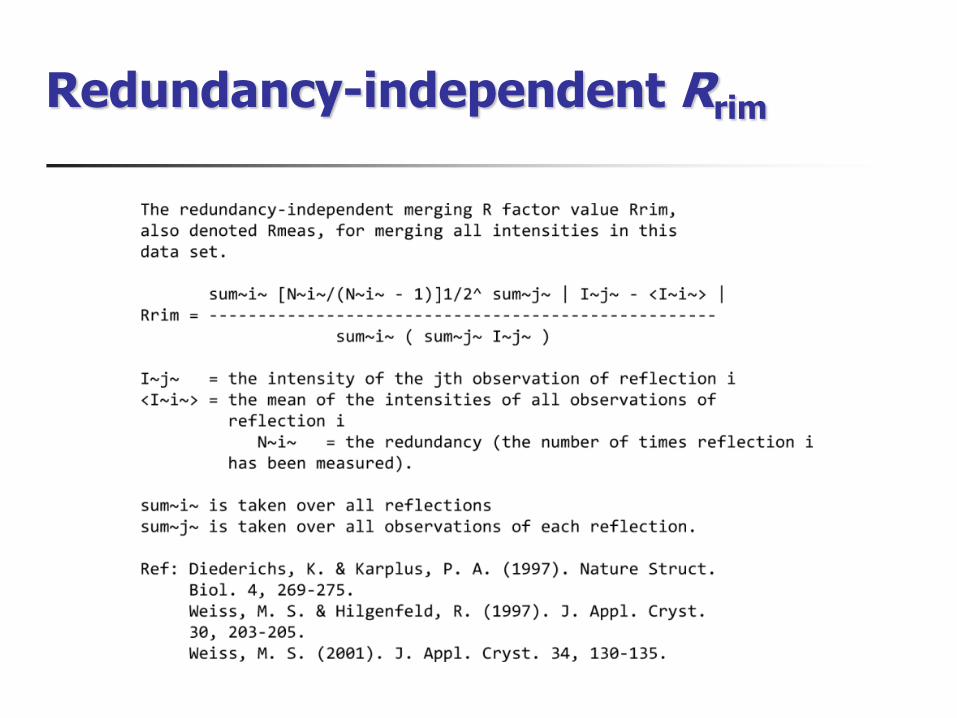
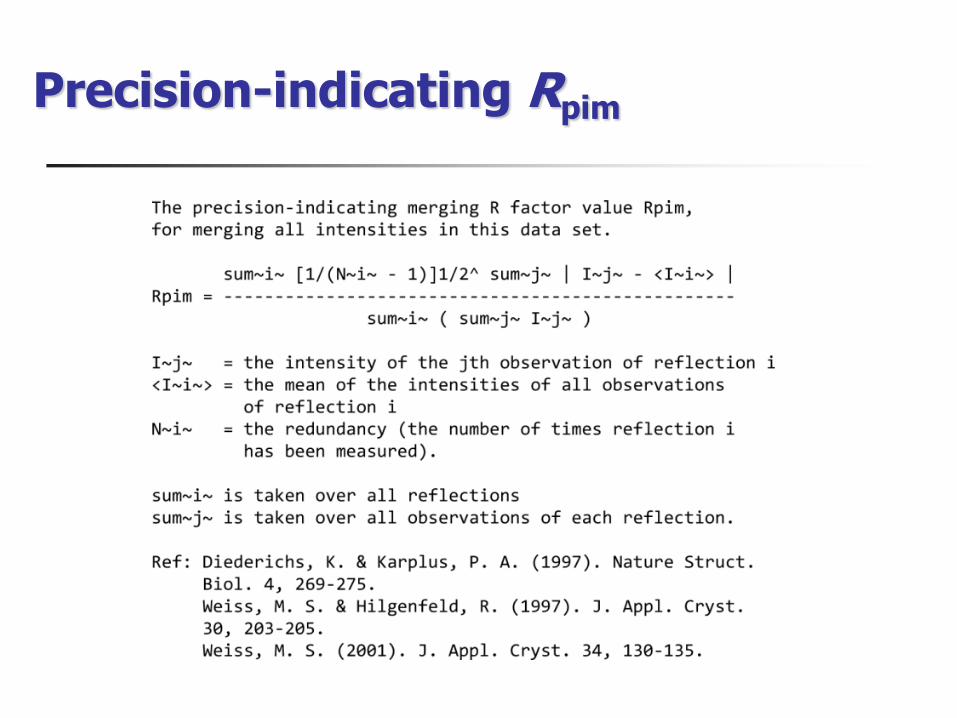
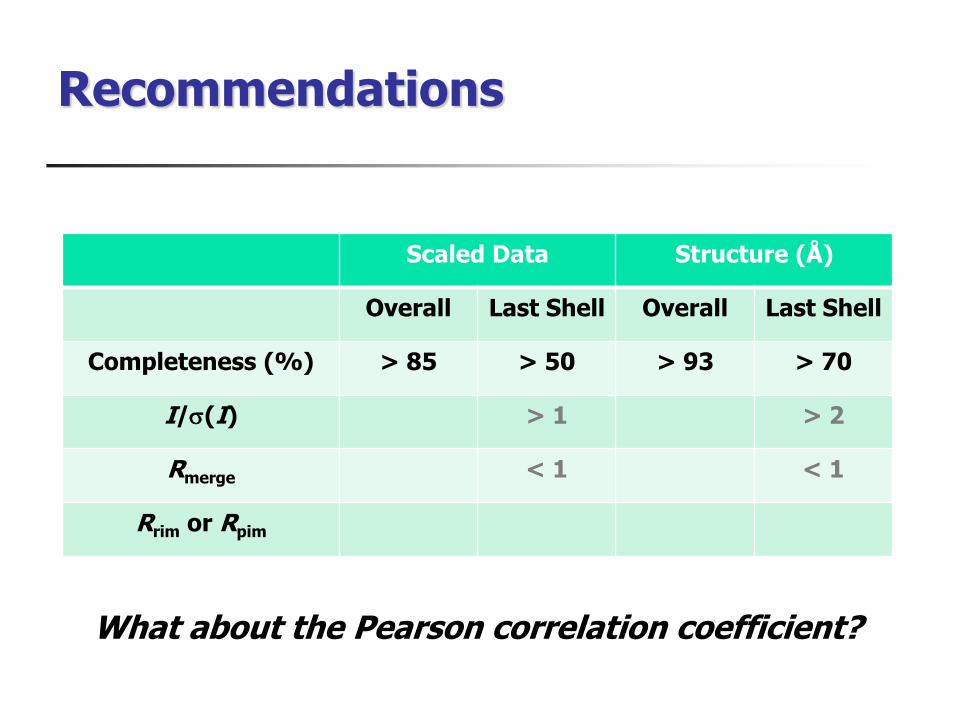
Recommendations
What about the Pearson correlation coefficient
Scaled Data Structure (Aring)
Overall Last Shell Overall Last Shell
Completeness () gt 85 gt 50 gt 93 gt 70
Is(I) gt 1 gt 2
Rmerge lt 1 lt 1
Rrim or Rpim
Pearson Correlation Coefficient
Linking crystallographic model and data quality Karplus PA1 Diederichs K 1 Department of Biochemistry and Biophysics Oregon State University Corvallis OR 97331 USA
Science 2012 May 25336(6084)1030-3
Abstract In macromolecular x-ray crystallography refinement R values measure the agreement between observed and calculated data Analogously R(merge) values reporting on the agreement between multiple measurements of a given reflection are used to assess data quality Here we show that despite their widespread use R(merge) values are poorly suited for determining the high-resolution limit and that current standard protocols discard much useful data We introduce a statistic that estimates the correlation of an observed data set with the underlying (not measurable) true signal this quantity CC provides a single statistically valid guide for deciding which data are useful CC also can be used to assess model and data quality on the same scale and this reveals when data quality is limiting model improvement
CC12 CC CCwork and CCfree
Diederichs K amp Karplus P A (2013) In Advancing Methods for Biomolecular Crystallography edited by
R Read A G Urzhumtsev amp V Y Lunin New York Springer-Verlag
Recommendations
Scaled Data Structure (Aring)
Overall Last Shell Overall Last Shell
Completeness () gt 85 gt 50 gt 93 gt 70
Is(I) gt 1 gt 2
Rmerge lt 1 lt 1
Rrim or Rpim
CC12 or CC NA NA
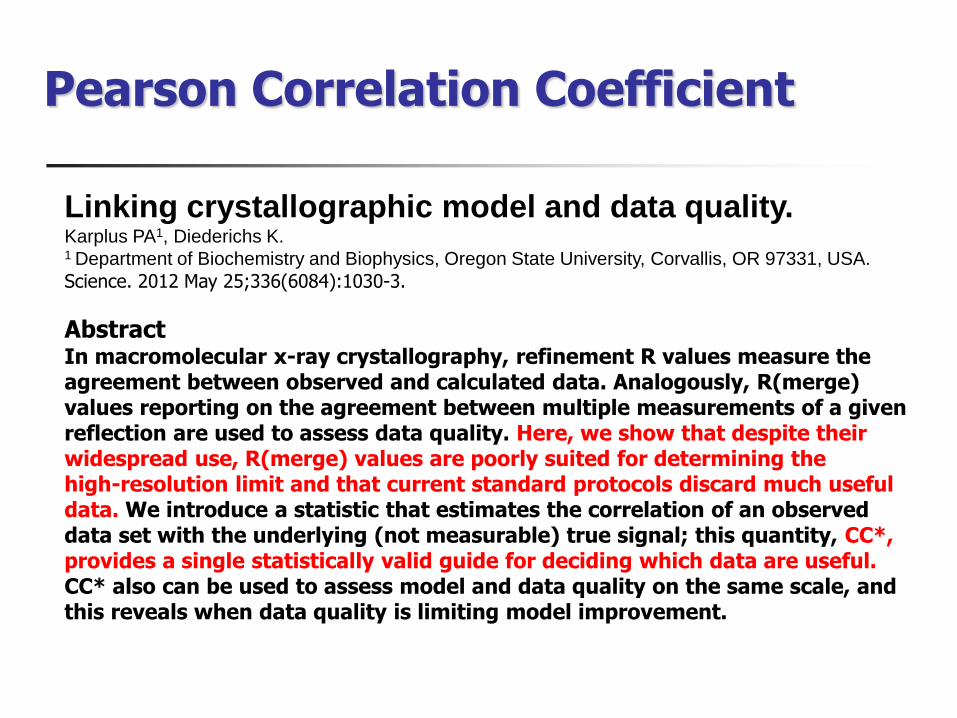
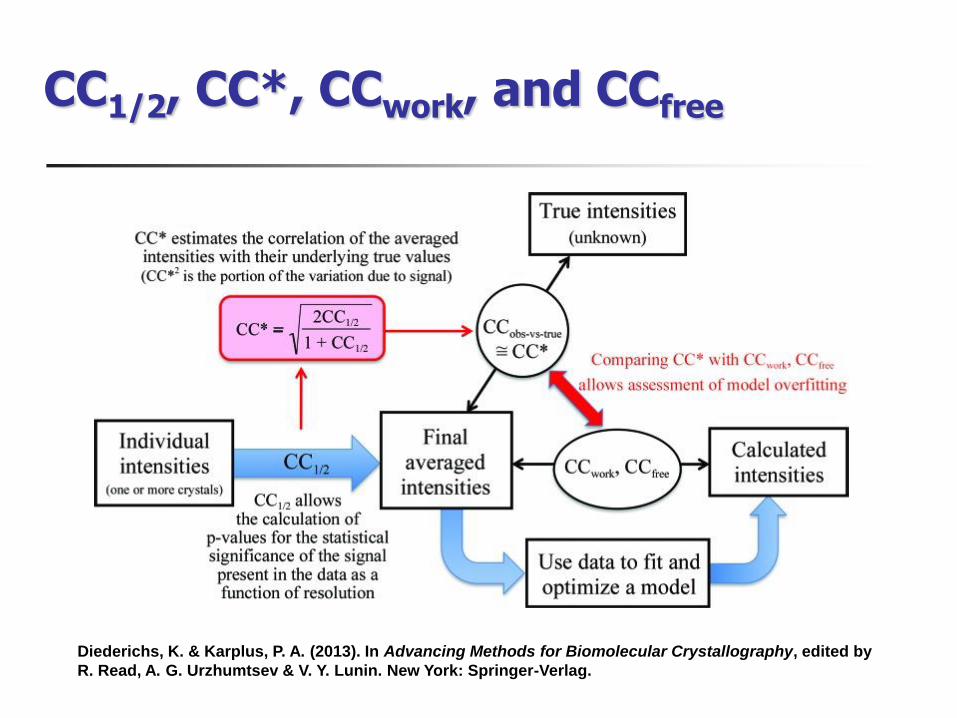
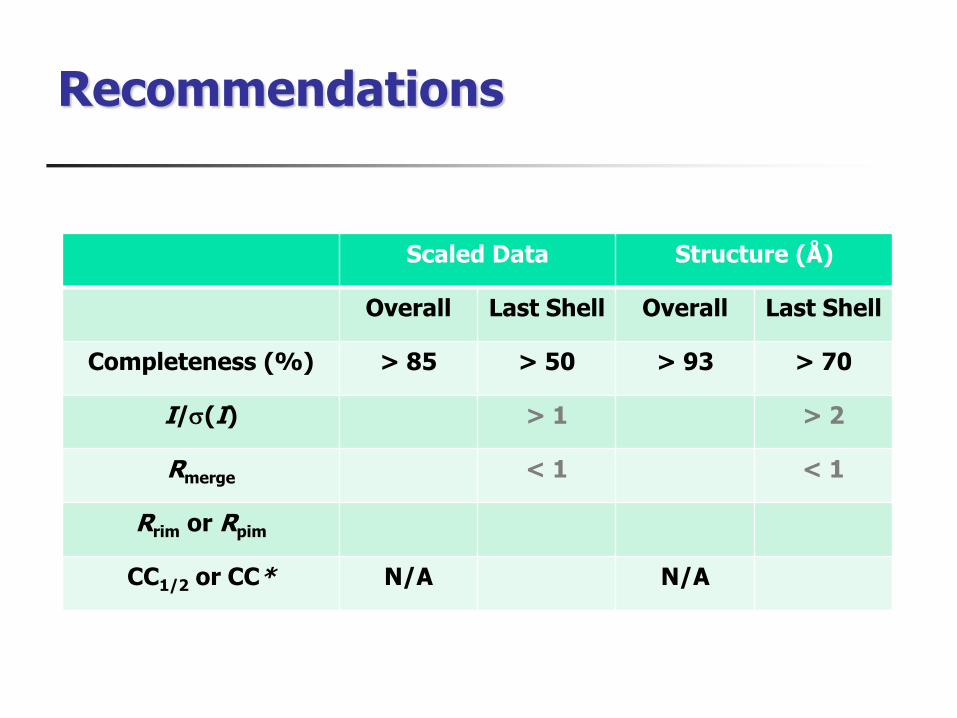
Recommendations
Scaled Data Structure (Aring)
Overall Last Shell Overall Last Shell
Completeness () gt 85 gt 50 gt 93 gt 70
Is(I) gt 1 gt 2
Rmerge lt 1 lt 1
Rrim or Rpim
CC12 or CC NA NA