Wellness Fasting-induced Hyperketosis and Interaction by ...
12
Wellness Fasting-induced Hyperketosis and Interaction by Intestinal Microbiota Shaw Watanabe, Izumi Utada, Takayoshi Hisada, Jun Mochizuki, Shoichi Mizuno, Satsuki Moriyama, Azusa Hirakawa, Seichiro Aoe Abstract—β-hydrobutyrate (BHB), one of representative ketone bodies, increases by fasting. Fasting endogenously produces ketone bodies in the liver, kidney and astrocytes in the brain. We reported the case in whom increased BHB would come from intestinal microbiota by Koda’s fasting diet. Relationship between plasma BHB and intestinal microbiota has not well known. Sixty subjects were admitted in the ARSOA Wellness Fasting program. During a 4-day fasting period, they received a combination of very low-energy vegetarian diet, physical exercise, meditation, and lectures about healthy lifestyles. Peripheral blood was collected on days 1 and 4 for routine biochemical analyses and for the determination of serum levels of insulin, glucagon and other hormones. Glucose and BHB were measured every morning by finger tip blood. The stools were collected pre-,mid- and post-fasting, and profiles of microbiota were analyzed by the metanalytic cytotechnicon. All data were collated in an Excel file, and transferred to SPSS for statistical analysis. BHB in the blood increased from 0.3±0.2 mM at the day 1 to 2.0±1.2 mM at the day 4 of fasting, while the glucose level decreased from 5.6±1.6 mM to 3.9±1.3 mM. Increases in plasma BHB were assigned to 4 groups (less than 1.0 mM, 1.0-1.99 mM, 2.0-2.99 mM and more than 3.0 mM). Highest group of BHB showed significant association with family Enterobacteriaceae of prefasting microbiota profile. Further analysis of bacterial profile at the species level clarified that 15 species were directly or indirectly related to BHB level, such as Providencia vermicola, P. rustigianii, P. sneebia, Morganel- la morganii, M. psychrotolerans, Proteus hauseri, Butyricimonas virosa,.etc. Five cases with very low Enterobacter presence showed lowest plasma BHB increase. Only one case with high BHB level did not show any attributable bacteria. Plasma concentration of BHB was related to Enterobacteriaceae directly or indirectly. The latter suggested syntrophic effects on Enterobacteriaceae. Known butyrate producing bacteria were suppressed by competitive interaction. It suggested that the meta- bolic pathway of butyrate synthesis and BHB production seemed to be done by different microbiota. Absorption of BHB from intestinal microbiota could be considered like the BHB supplement use, so dietary effects should be clarified more. Four days of fasting induced hyperketonemia with some metabolic changes. The possible absorption of BHB through intestinal wall could be accepted independent from butyrate production. Index Terms—β-hydroxybutyrate, Enterobacteriaceae, fasting, intestinal microbiota, ketone bodies, metabolism, physiology —————————— u —————————— 1.Introduction The importance of ketone body metabolism in dia- betic patients has been well known since 1970s, but recently, β-hydroxybutyrate (BHB) has been identified as a key compo- nent of a metabolic signaling pathway. [1-3] However, many questions remain unanswered what determined individual differences in the production and excretion of ketone bodies [4]. Recently, hyperketonemia induced by fasting or ketogenic diet calls attention because of the possibilities for various clini- cal pharmaceutical effects [5,6]. We hypothesized that 3-β-hydroxybutyrate (BHB) could be the fuel for the basic engine that produces energy in all terres- trial species [7]. However, ATP production from glucose- pyruvic acid pathway seems to be later added as a dominant system in human. We hypothesize the establishment of TCA cycle in mitochondria and enough oxygen supply since two billion years ago would be the key events to promote this change. The efficacy of ATP production from β-oxidation product is 10 ATP molecules, while it is 12.5 molecules from pyruvic acid. So, evolution should select glucose burning sys- tem as a booster engine for energy production [7]. The liver and kidney are considered to be the major ke- tone body producing organs which contain abundant glyco- gen particles. So, a close relationship between ketone and glu- cose burning system may be present. This explains why cer- tain level of glucose burning system may be present. This ex- plains why certain level of glucose is steadlily maintained even in the hyper ketogenic state.[8] BHB shows various pharmacological effects on disease prevention, such as cardiovascular disease, Alzheimer’s dis- ease, epilepsy, etc. [9-12] Inhibition of histone deacetylase, stimulation of FOXO, resistance to oxidative stress, protection of mitochondria, stimulation of adiponectin release, suppres- sion of inflammasome, etc. are reported [10-16]. We found that a lady who had lived 18 years by only one glass of vegetable juice a day could live by high BHB which seemed to be produced by the intestinal bacteria.[17] Howev- er, individual differences in ketone production and the dy- namics of ketogenesis are still unclear. Possibility of BHB ab- sorption from intestinal lumen like butyrate is not known. Therefore, we tried to clarify the occurrence of ketogenesis during fasting by measuring concurrent changes in glucose, ketone bodies, fatty metabolism and various hormonal chang- es in both blood and urine in relation to the intestinal micarobiota. We recruited volunteer subjects among partici- pants in a comprehensive fasting program, which included a balanced diet, physical activity, and mind exercises to achieve a healthy spiritual life. Author is currently the president of lifescience promoting association, E-mail: [email protected], Co-Authors; IU & SM are working at AOB Arsoa Group, TH & JM at Techno Suruga Co. Ltd. SM & AZ at Lifescience Promoting Association. AZ & SA at Otsuma Women’s University International Journal of Scientific & Engineering Research Volume 9, Issue 7, July-2018 ISSN 2229-5518 1,833 IJSER © 2018 http://www.ijser.org IJSER
Transcript of Wellness Fasting-induced Hyperketosis and Interaction by ...
Wellness Fasting-induced Hyperketosis and Interactionby Intestinal Microbiota
Shaw Watanabe, Izumi Utada, Takayoshi Hisada, Jun Mochizuki, Shoichi Mizuno, Satsuki Moriyama, AzusaHirakawa, Seichiro Aoe
Abstract—β-hydrobutyrate (BHB), one of representative ketone bodies, increases by fasting. Fasting endogenously produces ketone bodies in the liver, kidney andastrocytes in the brain. We reported the case in whom increased BHB would come from intestinal microbiota by Koda’s fasting diet. Relationship between plasma BHBand intestinal microbiota has not well known. Sixty subjects were admitted in the ARSOA Wellness Fasting program. During a 4-day fasting period, they received acombination of very low-energy vegetarian diet, physical exercise, meditation, and lectures about healthy lifestyles. Peripheral blood was collected on days 1 and 4 forroutine biochemical analyses and for the determination of serum levels of insulin, glucagon and other hormones. Glucose and BHB were measured every morning byfinger tip blood. The stools were collected pre-,mid- and post-fasting, and profiles of microbiota were analyzed by the metanalytic cytotechnicon. All data were collatedin an Excel file, and transferred to SPSS for statistical analysis. BHB in the blood increased from 0.3±0.2 mM at the day 1 to 2.0±1.2 mM at the day 4 of fasting, whilethe glucose level decreased from 5.6±1.6 mM to 3.9±1.3 mM. Increases in plasma BHB were assigned to 4 groups (less than 1.0 mM, 1.0-1.99 mM, 2.0-2.99 mM andmore than 3.0 mM). Highest group of BHB showed significant association with family Enterobacteriaceae of prefasting microbiota profile. Further analysis of bacterialprofile at the species level clarified that 15 species were directly or indirectly related to BHB level, such as Providencia vermicola, P. rustigianii, P. sneebia, Morganel-la morganii, M. psychrotolerans, Proteus hauseri, Butyricimonas virosa,.etc. Five cases with very low Enterobacter presence showed lowest plasma BHB increase.Only one case with high BHB level did not show any attributable bacteria. Plasma concentration of BHB was related to Enterobacteriaceae directly or indirectly. Thelatter suggested syntrophic effects on Enterobacteriaceae. Known butyrate producing bacteria were suppressed by competitive interaction. It suggested that the meta-bolic pathway of butyrate synthesis and BHB production seemed to be done by different microbiota. Absorption of BHB from intestinal microbiota could be consideredlike the BHB supplement use, so dietary effects should be clarified more. Four days of fasting induced hyperketonemia with some metabolic changes. The possibleabsorption of BHB through intestinal wall could be accepted independent from butyrate production.
Index Terms—β-hydroxybutyrate, Enterobacteriaceae, fasting, intestinal microbiota, ketone bodies, metabolism,physiology
—————————— u ——————————1.Introduction
The importance of ketone body metabolism in dia-betic patients has been well known since 1970s, but recently,β-hydroxybutyrate (BHB) has been identified as a key compo-nent of a metabolic signaling pathway. [1-3] However, manyquestions remain unanswered what determined individualdifferences in the production and excretion of ketone bodies[4]. Recently, hyperketonemia induced by fasting or ketogenicdiet calls attention because of the possibilities for various clini-cal pharmaceutical effects [5,6].We hypothesized that 3-β-hydroxybutyrate (BHB) could bethe fuel for the basic engine that produces energy in all terres-trial species [7]. However, ATP production from glucose-pyruvic acid pathway seems to be later added as a dominantsystem in human. We hypothesize the establishment of TCAcycle in mitochondria and enough oxygen supply since twobillion years ago would be the key events to promote thischange. The efficacy of ATP production from β-oxidationproduct is 10 ATP molecules, while it is 12.5 molecules frompyruvic acid. So, evolution should select glucose burning sys-tem as a booster engine for energy production [7].
The liver and kidney are considered to be the major ke-tone body producing organs which contain abundant glyco-gen particles. So, a close relationship between ketone and glu-cose burning system may be present. This explains why cer-
tain level of glucose burning system may be present. This ex-plains why certain level of glucose is steadlily maintainedeven in the hyper ketogenic state.[8]
BHB shows various pharmacological effects on diseaseprevention, such as cardiovascular disease, Alzheimer’s dis-ease, epilepsy, etc. [9-12] Inhibition of histone deacetylase,stimulation of FOXO, resistance to oxidative stress, protectionof mitochondria, stimulation of adiponectin release, suppres-sion of inflammasome, etc. are reported [10-16].
We found that a lady who had lived 18 years by only oneglass of vegetable juice a day could live by high BHB whichseemed to be produced by the intestinal bacteria.[17] Howev-er, individual differences in ketone production and the dy-namics of ketogenesis are still unclear. Possibility of BHB ab-sorption from intestinal lumen like butyrate is not known.Therefore, we tried to clarify the occurrence of ketogenesisduring fasting by measuring concurrent changes in glucose,ketone bodies, fatty metabolism and various hormonal chang-es in both blood and urine in relation to the intestinalmicarobiota. We recruited volunteer subjects among partici-pants in a comprehensive fasting program, which included abalanced diet, physical activity, and mind exercises to achievea healthy spiritual life.
Author is currently the president of lifescience promoting association,E-mail: [email protected], Co-Authors; IU & SM are working at AOBArsoa Group, TH & JM at Techno Suruga Co. Ltd. SM & AZ at LifesciencePromoting Association. AZ & SA at Otsuma Women’s University
International Journal of Scientific & Engineering Research Volume 9, Issue 7, July-2018ISSN 2229-5518 1,833
IJSER © 2018http://www.ijser.org
IJSER
2.Subjects and MehodsPersons who wanted to participate in the program of
ARSOA wellness fasting were telephone-interviewed by theexpert staff about their health and willing to join the program.All participants were requested to send 1 week dietary recordand health sheet, including past medical history, abnormallaboratory data at a health check-up, habitual foods and/orsupplements, and any question to the counselor. [18] All par-ticipants signed the agreement sheet after precise explanationof the program.
Each participant took 50 ml fermented vegetable juice(ko-so), CellEnergy (multivitamins), and mineral tablet perday. Water and tea were freely available. On the last day, theattention to return to normal diet was taught, and the sub-jects ate half volume of boiled brown rice and vegetable soupas a brunch. All participants were requested to report theirhealth condition after returning home (6th day and 1 monthlater).
Every morning participants measured their body com-position using the Body Composition Analyzer® (Tanita,Tokyo, Japan), which determines body weight, fat volume,muscle volume, water contents, estimated bone weight, basalmetabolic rate and body mass index (BMI), based upon theelectric impedance.[19] Blood pressure and pulse rate weremeasured with the Omron HEM-7021® monitor (Kyoto, Ja-pan).
Blood glucose and BHB were measured every morningwith the Freestyle Precision Neo® meter (Abott, Chicago, IL,USA). Daily first urine was checked for urinary pH, glucose,BHB, urobilinogen, proteins, occult blood, bilirubin, nitrate,and relative gravity using the Uropaper III® (Eiken, Tokyo,Japan). A sample of about 10 ml of urine was stored in a fro-zen tube for quantitative analysis of creatinine, acetoacetate(AcAc), BHB and catecholamines by the Serum Research La-boratory (SRL).[20]
On the 1st and 4th day morning, 7ml venous blood wascollected and the frozen sera were sent to the Serum ResearchLaboratory (SRL, Tokyo) for biological analysis, such as totalprotein, triacylglyceride (TG) and free fatty acid, glucose andketone bodies, insulin, glucagon, creatinine, γGTP, asparaticacid aminotransferase (AST) and alanine aminotransferase(ALT) .Intestinal Bacteria
Fresh feces were collected 3 times; a few days before(pre-) fasting, during (mid-) fasting and about 1 week after(post-) fasting. Fecal samples (approximately 50-100 mg)were sent to Techno Suruga Laboratory , Shizuoka, for thesequence amplicon analysis.[21-27] The stools were suspend-ed in a solution containing100 mM Tris-HCI, pH 9.0, 40 mMTris-EDTA, pH8.0, and 4 M guanidine thiocyanate and0.001% bromothymol blue. An aliquot of 0.8 ml of the sus-pension was homogenized with zirconia beads in a 2.0 ml
screw cap tube by FastPrep24 Instrument (MP Biomedicals,Santa Ana, CA) at 5 m/s for 2 min and placed on ice for 5min. After centrifugation at 5000 × g for 1 min, DNA was ex-tracted from 200 µL of the suspension using an automaticnucleic acid extractor (Precision System Science, Chiba, Ja-pan). MagDEA DNA 200 (GC) (Precision System Science)was used as the reagent for automatic nucleic acid extraction,as previously described.[21]
NGS analysis of microbial community structure in feceswas performed using a MiSeq (Illumina, San Diego, CA), aspreviously described. [25-27] The V3-V4 region of 16S rDNAwas amplified using the forward primer Pro341 F 5′ -AATGATACGGCGACCACCGA-GATCTACACXXXXXXXXACACTCTTTCCCTACACGAC-GCTCTTCCGATCTCCTACGGGNBGCASCAG-3 ′ , whereXs represent the sample-specific 8-bp barcode sequences(CTCTCTAT, TATCCTCT, GTAAGGAG, ACTGCATA,AAGGAGTA, CTAAGCCT, CGTCTAAT, TCTCTCCG,TCGACTAG, TTCTAGCT, CCTAGAGT, GCGTAAGA,CTATTAAG, AAGGCTAT, GAGCCTTA and TTATGCGA) )and the reverse primer Pro806R 5’-CAAGCAGAAGACGGCATACGA-GATZZZZZZZZGTGACTGGAGTTCAGAC-GTGTGCTCTTCCGATCTGACTACNVGGGTATCTAATCC-3’, where Zs represent the sample-specific 8-bp barcode se-quences (TCGCCTTA, CTAGTACG, TTCTGCCT,GCTCAGGA, AGGAGTCC, CATGCCTA, GTAGAGAG,CAGCCTCG, TGCCTCTT, TCCTCTAC, TCATGAGC,CCTGAGAT, TAGCGAGT and GTAGCTCC). The touch-down PCR method for thermal cycling was used with a Ge-neAmp PCR system 9700 (ABI, Foster City, CA). The PCRreaction mixture (25 µL) contained 20 ng genomic DNA, 2×MightyAmp Buffer Ver.2 (Takara, Otsu, Japan), 0.25 µM ofeach primer, and 1.25 units of MightyAmp DNA Polymerase(Takara). The PCR reaction and preparation of amplicon poolwere performed by the method of Takahashi et al. [27]Bioinformatics analysis
The determined 16S rDNA sequences were subjected tohomology searching using Metagenome@KIN software(World Fusion Co., Ltd., Tokyo, Japan) against the Techno-SurugaLab Microbial Identification Database DB-BA10.0 (Techno-Suruga Laboratory), which contains only bacteria with stand-ing in the taxonomic nomenclature. [21]Statistical analysis
The information obtained from the questionnaire wasmade into the Excel database. Analysis was carried out as faras possible on the point whether the microbiota influencedketone production in this study. The complete data of 57people were provided for analysis
Four groups were categorized by the 4th day serumBHB levels; less than 1 mM, 1.0-1.9 mM, 2.0-2.9 mM, more
International Journal of Scientific & Engineering Research Volume 9, Issue 7, July-2018ISSN 2229-5518 1,834
IJSER © 2018http://www.ijser.org
IJSER
than 3.0 mM. It roughly corresponded to the quartile value.Laboratory data at the day 1 and 4 were compared by thepaired analysis. Data were checked using an unpaired t-testwith Welch’s correction for continuous variables or theMann-Whitney test (two-sided) and Fisher’s exact test forcategorical variables. Correlation analysis was carried outbetween BHB level and each profile of microbiota at the phy-lum level, family level, and species level.The IBM SPSS software Ver. 24 was used for calculation, andP values less than 0.05 were considered significant. The statis-tical significance of the decision was shown as * p < 0.05, * * p< 0.01, * * * p <0.001.
3.Results The number of participants was 60, and 3 of them were
excluded from the analysis due to insufficient data. About 20participants stayed in a mountaneous resort hotel in eachtime, and received a combination of low-energy vegetariandiet (about 380 kcal intake by fermented vegetable juice perday), physical exercise (2-hour walking, slow training andstretch), meditation, and lectures about healthy life habits inthe 4-day program, as previously reported. [18]
Average age of participants was 53.7±18.7 in 3 men and47.8±11.8 in 54 women. Height and body weight were116.7±3.2 cm and 64.3±4.1 kg in men and 158.1±5.6 cm and
53.1±8.0 kg in women. Body weight decreased about 1.5±1.3kg(median 1.7kg), and fat percent and muscle volume alsodecreased during 4 day fasting.
The changes of basal metabolic rate (BMR), blood pres-sure, pulse rate and body temperature are shown in Table 1.Most participants were women, who were working in comet-ic shops as a sales lady or owners. There were no currentsmokers. Their lifestyle was healthy and about half of themwere ovo- and fish-vegetarians. Although headache, hungry,GI tract distress, emesis, depressive and cold feeling occurredtoward the 2nd day, these symptoms dramatically disap-peared at the 3rd day, and active and vivid feeling increasedon the 4th day and after. Skin condition also became good byfasting.
Glucose decreased, and BHB and acetoacetate (AcAc) in-creased toward 4th day. Systolic blood pressure decreased 8mmHg in both males and females, and 4 mmHg in diastolicpressure, which continued at least one month later. On thecontrary, the pulse rate increased 9 at median. Body tempera-ture and BMR decreased in both sex. (Table 1). However,
BHB difference only correlated to the body temperatureand pulse rate, and glucose decrease correlated with lowereddiastolic pressure.
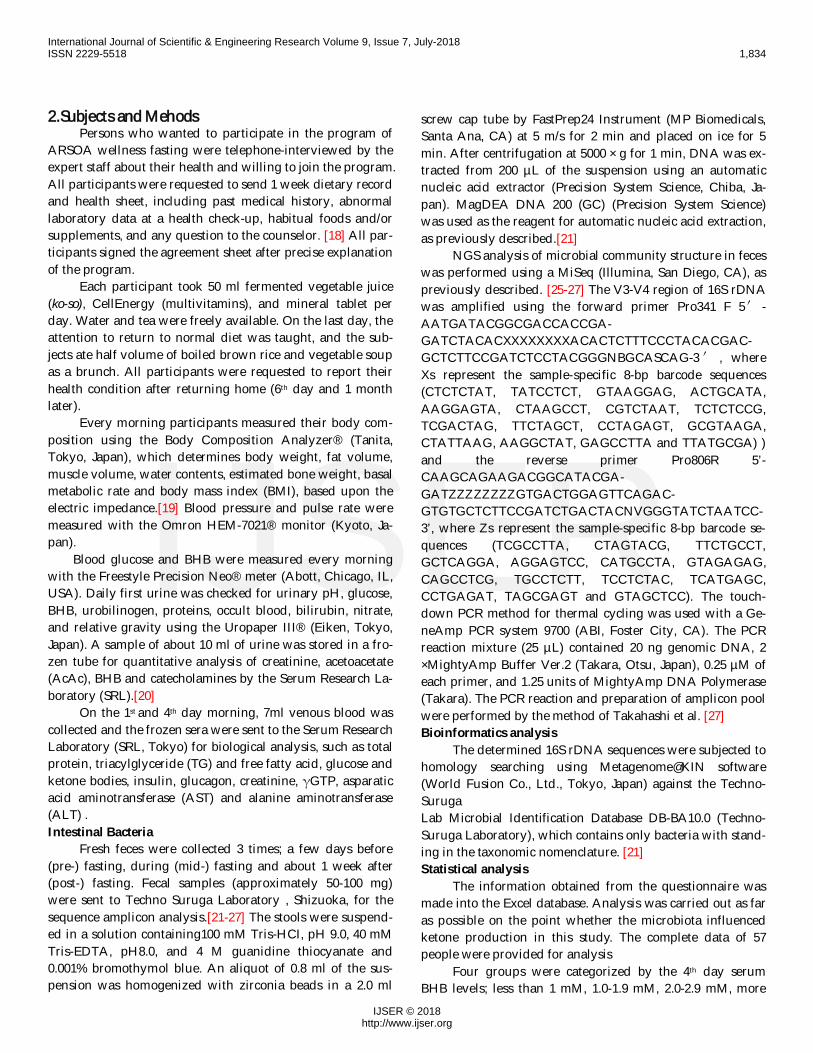
Table 1. Anthropometric, physiological, glucose and BHB change during 4 day-fasting
BHB in the plasma increased from 0.3±0.2 mM at theday 1 to 2.0±1.2 mM at the day 4 of fasting, while the glucoselevel decreased from 5.8±1.9 mM to 4.5±1.5 mM. Increases inplasma BHB were assigned to 4 groups (less than 1.0 mM,1.0-1.9 mM, 2.0-2.9 mM, and more than 3 mM). The BHB/
AcAc ratio in the blood was 5.4±1.3, regardless of the BHBconcentration, but the range varied from 3.5 to 11.0. Thesevalues returned to the normal range on the 14th day (10 daysafter fasting).
Day 1 Day 2 Day 3 Day 4 p After 1 w After 1 mos
body weight (kg) 54.9 ± 8.3 54.4 ± 8.2 53.6 ± 8.1 53.5 ± 8.1 *** 53.5 ± 8.1 53.1 ± 7.6BMI 21.5 ± 4.2 21.5 ± 3.1 21.5 ± 3.2 21.3 ± 3.2 0.502 21.5 ± 3.4 21.4 ± 3.2
fat % 29.6 ± 6.8 30.3 ± 6.7 30.0 ± 6.6 29.4 ± 6.8 0.454 28.1 ± 6.5 28.2 ± 5.9
waist circumfer-ence
84.9 ± 8.3 84.2 ± 8.2 83.1 ± 8.4 82.1 ± 8.7 *** 82.2 ± 8.6 81.3 ± 7.9
BMR (kcal/day) 1107.0 ± 101.9 1090.1 ± 100.0 1087.4 ± 95.5 1092.4 ± 117.2 *** na na
body temp (℃) 36.5 ± 0.4 36.3 ± 0.4 36.4 ± 0.3 36.3 ± 0.3 * 36.3 ± 0.4 36.3 ± 0.4
puls (n/min) 74.5 ± 12.0 79.4 ± 11.7 81.1 ± 13.6 83.5 ± 11.5 *** 70.6 ± 8.6 70.7 ± 9.8
systolic BP(mmHg)
121.5 ± 19.2 117.5 ± 17.9 113.0 ± 16.6 110.9 ± 14.4 *** 117.1 ± 15.7 117.6 ± 24.1
diastolic BP(mmHg)
80.4 ± 12.7 79.1 ± 12.0 76.7 ± 11.8 75.9 ± 10.9 *** 76.9 ± 12.7 75.3 ± 9.1
b_glucose (mM) 5.0 ± 1.6 4.6 ± 1.1 4.1 ± 1.2 3.9 ± 1.3 *** na na
b_bHB (mM) 0.3 ± 0.2 0.4 ± 0.3 1.2 ± 0.7 2.0 ± 1.2 *** na na
International Journal of Scientific & Engineering Research Volume 9, Issue 7, July-2018ISSN 2229-5518 1,835
IJSER © 2018http://www.ijser.org
IJSER
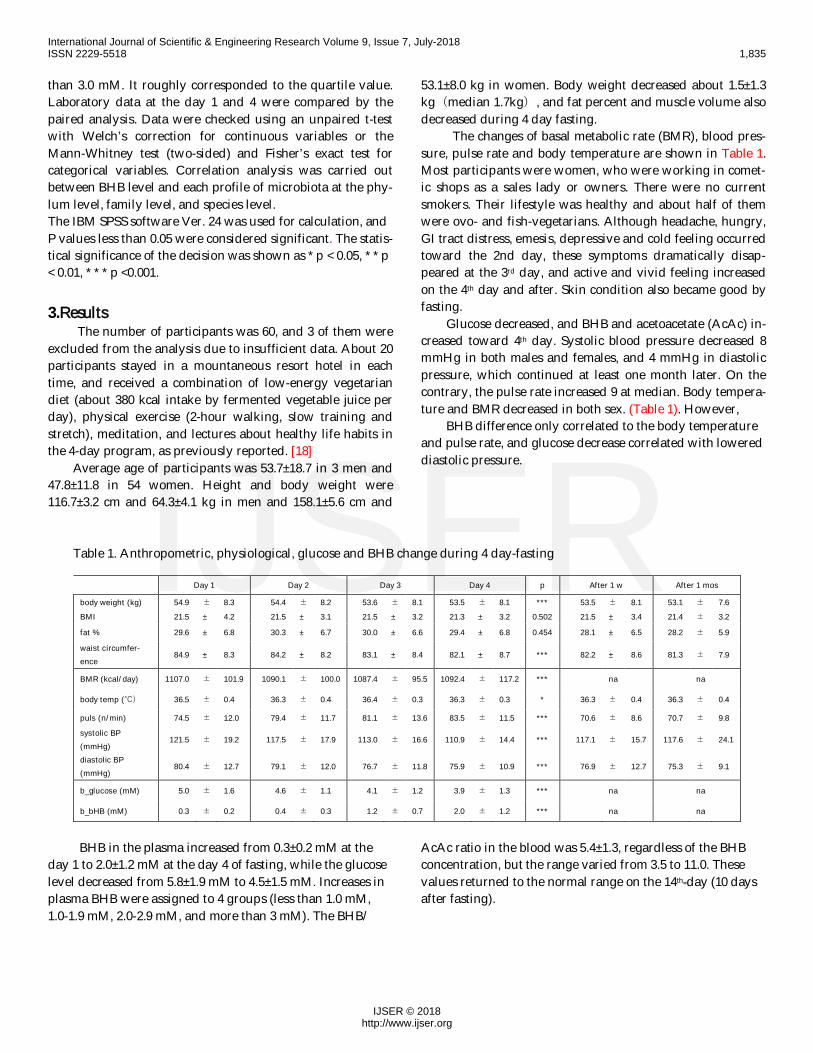
Changes of plasma biochemical markersChanges of biochemical markers between Day 1 and
Day 4 are shown in Table 2. Marked increase of free fattyacids and decrease of triacylglycerol, decrease of glucose and
insulin, increase of glucagon, slight increase of AST, ALT andcreatinine were observed. Increased AcAc and BHB negative-ly correlated to glucagon and glucose.
Table 2 Changes of serum biochemical markers on day 1 and 4th day of fastingday 1 day 4 dif
n=53 mean sd mean sd mean sd p
TG (mg/dl) 99.8 ± 60.2 56.0 ± 20.9 -45.5 ± 58.0 ***
FFA (mg/dl) 736.2 ± 344.8 1900.2 ± 535. 1181.4 ± 607.3 ***
glucose (mg/dl) 5.0 ± 1.2 3.9 ± 1.2 1.1 ± 1.0 ***
insulin (uUI/ml) 6.2 ± 5.3 2.8 ± 1.7 -3.5 ± 5.2 ***
glucagon (pg/ml) 153.7 ± 33.6 183.1 ± 60.0 26.0 ± 63.7 ***
AST (U/L) 21.4 ± 5.2 31.5 ± 8.9 10.0 ± 6.5 ***
ALT (U/L) 14.3 ± 6.8 16.1 ± 7.5 1.8 ± 3.3 **
γ_GTP (U/L) 28.3 ± 32.1 27.1 ± 28.3 -1.6 ± 5.4 0.113
Cre (mg/dl) 0.6 ± 0.1 0.7 ± 0.1 0.1 ± 0.1 ***
eGFR (ml/min/1.73m2) 84.4 ± 14.8 74.0 ± 15.0 -10.1 ± 10.3 ***
AcAc (mM) 0.0 ± 0.0 0.3 ± 0.2 -0.3 ± 0.2 ***
BHB (mM) 0.1 ± 0.1 1.8 ± 1.1 -1.7 ± 1.1 ***
total keton (mM) 0.0 ± 0.0 2.2 ± 1.3 -2.1 ± 1.3 ***
TG; tryglyceride, FFA; free fatty acids, AST; ALT γ_GTP, Cr; creatinine, eGFR; estimated glomelular filtration rae,AcAc; acetoacetate, BHB; β-hydroxybutyrate
Changes of microbiota profiles by fastingOur analyzing system of microbiota profile recognized
600 species from about more than 24000 taxons. Number ofspecies more than 0.01% was 129 species. Rejected hits were29.6% and undetermined rate was 9.4%. These were summa-rized to 60 genus, 29 families, 14 orders, 11 classes and 5 phy-lum. (Supplementary Table 1) We selected bacteria whichpresented more than 0.01% or maximum value of 0.1% for
further analysis. Most common bacteria in phylum was Fer-micutes (36-40%), next Bacteroidetes (24%), Actinobacteria (11-16%), and then Proteobacteria (0.7-1.9) and Verrucomicrobia(0.602%.). When compared bacterial profiles in 3 differenttimes, pre-, mid- and post-fasting, Actinobacteria, Proteobacte-ria and Verrucomicrobia showed significant changes by fasting(Table3).
Table 3. Phylum profile of microbiota before, during and after fasting
time Pre Mid Post ANOVA
phylum mean sd median mean sd median mean sd median p
Firmicutes 40.31 8.12 40.57 36.88 11.03 38.61 41.09 9.38 40.71 0.057
Bacteroidetes 24.06 10.93 23.19 24.11 11.17 24.80 24.05 7.99 23.86 0.999
Actinobacteria 11.70 7.59 10.04 16.63 12.52 13.85 11.87 10.73 8.73 0.024*
Proteobacteria 6.65 6.51 3.94 3.90 4.77 1.58 7.04 7.74 3.61 0.026*
Verrucomicrobia 0.69 1.71 0.02 1.93 3.88 0.01 0.70 1.84 0.01 0.024*
Fusobacteria 0.38 1.46 0.00 0.31 1.16 0.00 0.18 0.69 0.00 0.68
Lentisphaerae 0.00 0.00 0.00 0.00 0.00 0.00 0.00 0.00 0.00 nd
Spirochaetes 0.00 0.00 0.00 0.00 0.00 0.00 0.00 0.00 0.00 nd
Synergistetes 0.00 0.01 0.00 0.01 0.03 0.00 0.00 0.02 0.00 nd
Rejected hit 16.20 7.76 15.80 16.24 9.70 14.36 15.06 6.69 15.43 0.699
International Journal of Scientific & Engineering Research Volume 9, Issue 7, July-2018ISSN 2229-5518 1,836
IJSER © 2018http://www.ijser.org
IJSER
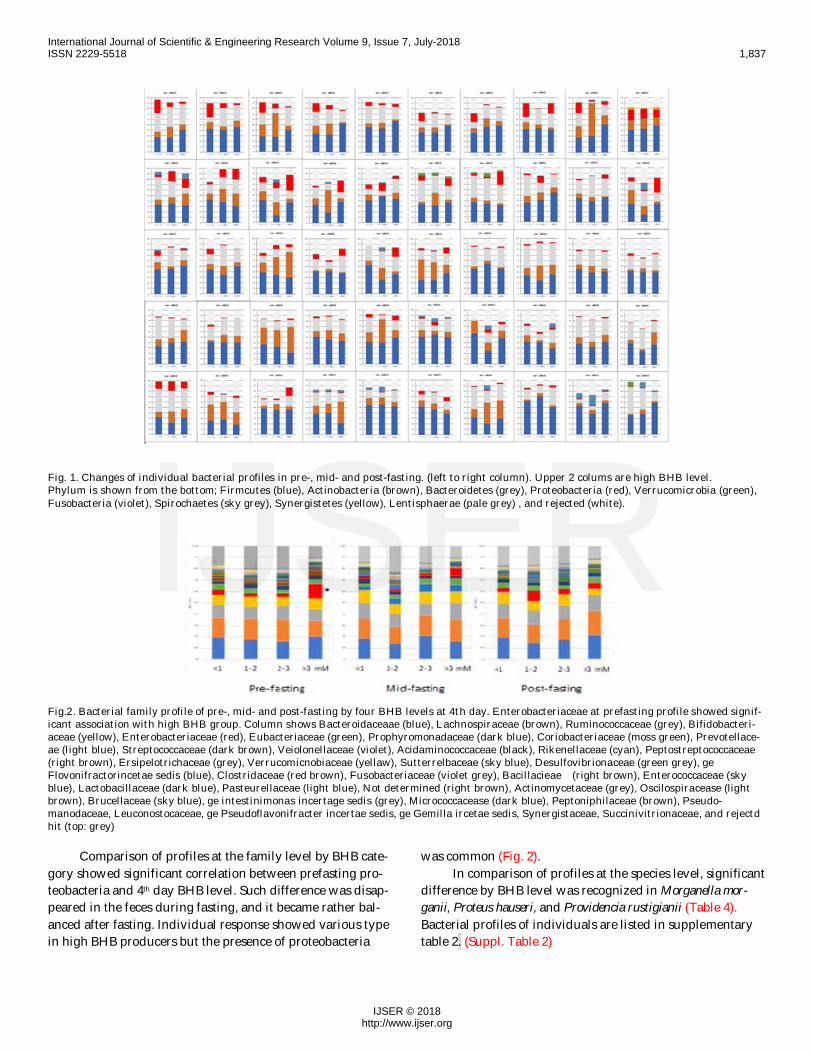
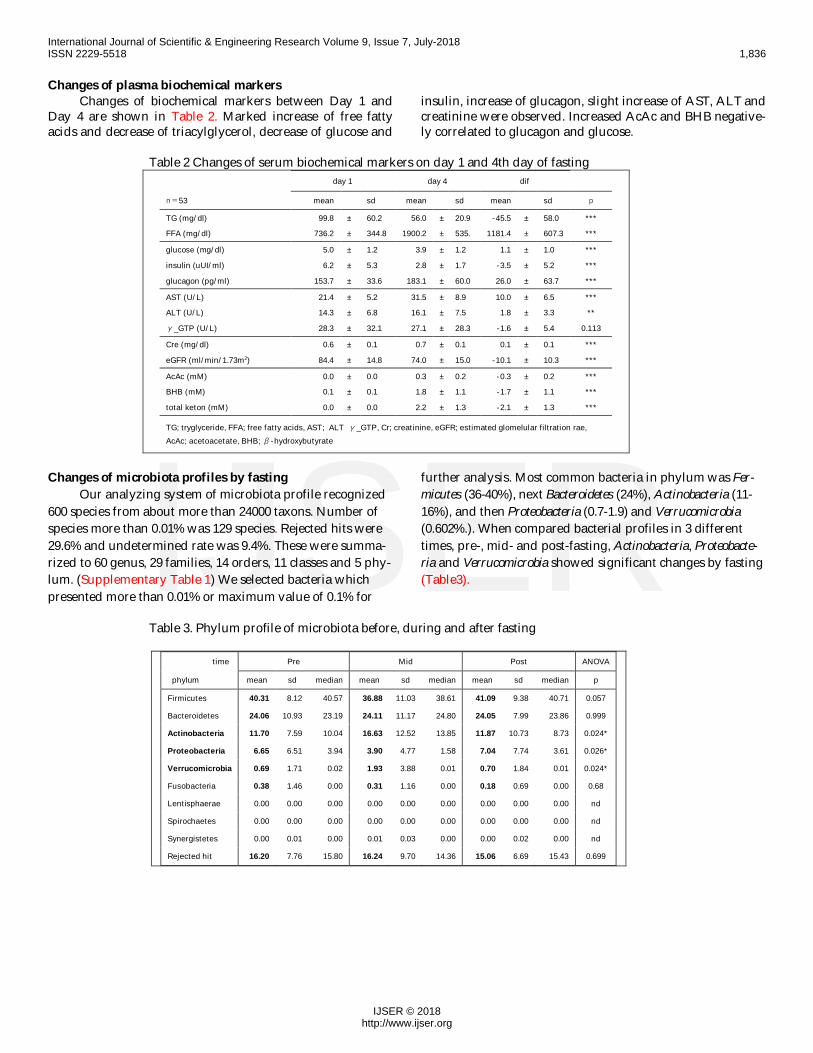
Fig. 1. Changes of individual bacterial profiles in pre-, mid- and post-fasting. (left to right column). Upper 2 colums are high BHB level.Phylum is shown from the bottom; Firmcutes (blue), Actinobacteria (brown), Bacteroidetes (grey), Proteobacteria (red), Verrucomicrobia (green),Fusobacteria (violet), Spirochaetes (sky grey), Synergistetes (yellow), Lentisphaerae (pale grey) , and rejected (white).
Fig.2. Bacterial family profile of pre-, mid- and post-fasting by four BHB levels at 4th day. Enterobacteriaceae at prefasting profile showed signif-icant association with high BHB group. Column shows Bacteroidaceaae (blue), Lachnospiraceae (brown), Ruminococcaceae (grey), Bifidobacteri-aceae (yellow), Enterobacteriaceae (red), Eubacteriaceae (green), Prophyromonadaceae (dark blue), Coriobacteriaceae (moss green), Prevotellace-ae (light blue), Streptococcaceae (dark brown), Veiolonellaceae (violet), Acidaminococcaceae (black), Rikenellaceae (cyan), Peptostreptococcaceae(right brown), Ersipelotrichaceae (grey), Verrucomicnobiaceae (yellaw), Sutterrelbaceae (sky blue), Desulfovibrionaceae (green grey), geFlovonifractorincetae sedis (blue), Clostridaceae (red brown), Fusobacteriaceae (violet grey), Bacillacieae (right brown), Enterococcaceae (skyblue), Lactobacillaceae (dark blue), Pasteurellaceae (light blue), Not determined (right brown), Actinomycetaceae (grey), Oscilospiracease (lightbrown), Brucellaceae (sky blue), ge intestinimonas incertage sedis (grey), Micrococcacease (dark blue), Peptoniphilaceae (brown), Pseudo-manodaceae, Leuconostocaceae, ge Pseudoflavonifracter incertae sedis, ge Gemilla ircetae sedis, Synergistaceae, Succinivitrionaceae, and rejectdhit (top: grey)
Comparison of profiles at the family level by BHB cate-gory showed significant correlation between prefasting pro-teobacteria and 4th day BHB level. Such difference was disap-peared in the feces during fasting, and it became rather bal-anced after fasting. Individual response showed various typein high BHB producers but the presence of proteobacteria
was common (Fig. 2).In comparison of profiles at the species level, significant
difference by BHB level was recognized in Morganella mor-ganii, Proteus hauseri, and Providencia rustigianii (Table 4).Bacterial profiles of individuals are listed in supplementarytable 2. (Suppl. Table 2)
International Journal of Scientific & Engineering Research Volume 9, Issue 7, July-2018ISSN 2229-5518 1,837
IJSER © 2018http://www.ijser.org
IJSER
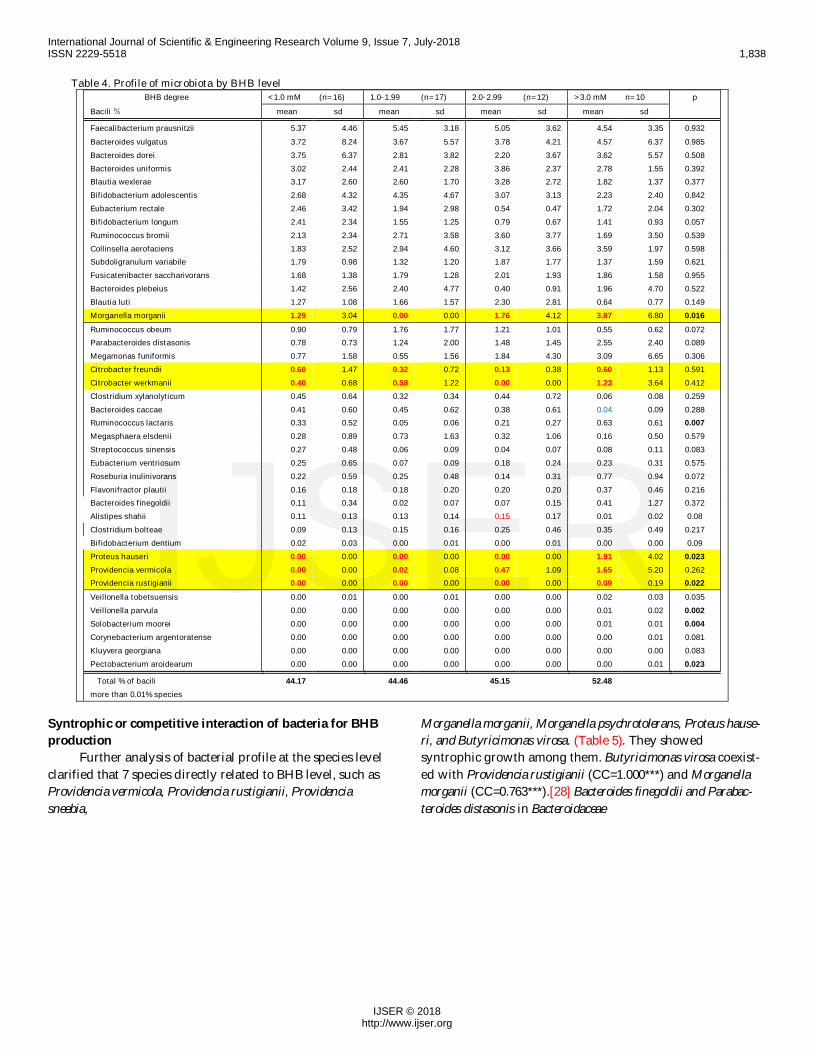
Table 4. Profile of microbiota by BHB level BHB degree <1.0 mM (n=16) 1.0-1.99 (n=17) 2.0-2.99 (n=12) >3.0 mM n=10 pBacili % mean sd mean sd mean sd mean sd
Faecalibacterium prausnitzii 5.37 4.46 5.45 3.18 5.05 3.62 4.54 3.35 0.932Bacteroides vulgatus 3.72 8.24 3.67 5.57 3.78 4.21 4.57 6.37 0.985Bacteroides dorei 3.75 6.37 2.81 3.82 2.20 3.67 3.62 5.57 0.508Bacteroides uniformis 3.02 2.44 2.41 2.28 3.86 2.37 2.78 1.55 0.392Blautia wexlerae 3.17 2.60 2.60 1.70 3.28 2.72 1.82 1.37 0.377Bifidobacterium adolescentis 2.68 4.32 4.35 4.67 3.07 3.13 2.23 2.40 0.842Eubacterium rectale 2.46 3.42 1.94 2.98 0.54 0.47 1.72 2.04 0.302Bifidobacterium longum 2.41 2.34 1.55 1.25 0.79 0.67 1.41 0.93 0.057Ruminococcus bromii 2.13 2.34 2.71 3.58 3.60 3.77 1.69 3.50 0.539Collinsella aerofaciens 1.83 2.52 2.94 4.60 3.12 3.66 3.59 1.97 0.598Subdoligranulum variabile 1.79 0.98 1.32 1.20 1.87 1.77 1.37 1.59 0.621Fusicatenibacter saccharivorans 1.68 1.38 1.79 1.28 2.01 1.93 1.86 1.58 0.955Bacteroides plebeius 1.42 2.56 2.40 4.77 0.40 0.91 1.96 4.70 0.522Blautia luti 1.27 1.08 1.66 1.57 2.30 2.81 0.64 0.77 0.149Morganella morganii 1.29 3.04 0.00 0.00 1.76 4.12 3.87 6.80 0.016Ruminococcus obeum 0.90 0.79 1.76 1.77 1.21 1.01 0.55 0.62 0.072Parabacteroides distasonis 0.78 0.73 1.24 2.00 1.48 1.45 2.55 2.40 0.089Megamonas funiformis 0.77 1.58 0.55 1.56 1.84 4.30 3.09 6.65 0.306Citrobacter freundii 0.60 1.47 0.32 0.72 0.13 0.38 0.60 1.13 0.591Citrobacter werkmanii 0.40 0.68 0.58 1.22 0.00 0.00 1.23 3.64 0.412Clostridium xylanolyticum 0.45 0.64 0.32 0.34 0.44 0.72 0.06 0.08 0.259Bacteroides caccae 0.41 0.60 0.45 0.62 0.38 0.61 0.04 0.09 0.288Ruminococcus lactaris 0.33 0.52 0.05 0.06 0.21 0.27 0.63 0.61 0.007Megasphaera elsdenii 0.28 0.89 0.73 1.63 0.32 1.06 0.16 0.50 0.579Streptococcus sinensis 0.27 0.48 0.06 0.09 0.04 0.07 0.08 0.11 0.083Eubacterium ventriosum 0.25 0.65 0.07 0.09 0.18 0.24 0.23 0.31 0.575Roseburia inulinivorans 0.22 0.59 0.25 0.48 0.14 0.31 0.77 0.94 0.072Flavonifractor plautii 0.16 0.18 0.18 0.20 0.20 0.20 0.37 0.46 0.216Bacteroides finegoldii 0.11 0.34 0.02 0.07 0.07 0.15 0.41 1.27 0.372Alistipes shahii 0.11 0.13 0.13 0.14 0.15 0.17 0.01 0.02 0.08Clostridium bolteae 0.09 0.13 0.15 0.16 0.25 0.46 0.35 0.49 0.217Bifidobacterium dentium 0.02 0.03 0.00 0.01 0.00 0.01 0.00 0.00 0.09Proteus hauseri 0.00 0.00 0.00 0.00 0.00 0.00 1.91 4.02 0.023Providencia vermicola 0.00 0.00 0.02 0.08 0.47 1.09 1.65 5.20 0.262Providencia rustigianii 0.00 0.00 0.00 0.00 0.00 0.00 0.09 0.19 0.022Veillonella tobetsuensis 0.00 0.01 0.00 0.01 0.00 0.00 0.02 0.03 0.035Veillonella parvula 0.00 0.00 0.00 0.00 0.00 0.00 0.01 0.02 0.002Solobacterium moorei 0.00 0.00 0.00 0.00 0.00 0.00 0.01 0.01 0.004Corynebacterium argentoratense 0.00 0.00 0.00 0.00 0.00 0.00 0.00 0.01 0.081Kluyvera georgiana 0.00 0.00 0.00 0.00 0.00 0.00 0.00 0.00 0.083Pectobacterium aroidearum 0.00 0.00 0.00 0.00 0.00 0.00 0.00 0.01 0.023
Total % of bacili 44.17 44.46 45.15 52.48more than 0.01% species
Syntrophic or competitive interaction of bacteria for BHBproduction
Further analysis of bacterial profile at the species levelclarified that 7 species directly related to BHB level, such asProvidencia vermicola, Providencia rustigianii, Providenciasneebia,
Morganella morganii, Morganella psychrotolerans, Proteus hause-ri, and Butyricimonas virosa. (Table 5). They showedsyntrophic growth among them. Butyricimonas virosa coexist-ed with Providencia rustigianii (CC=1.000***) and Morganellamorganii (CC=0.763***).[28] Bacteroides finegoldii and Parabac-teroides distasonis in Bacteroidaceae
International Journal of Scientific & Engineering Research Volume 9, Issue 7, July-2018ISSN 2229-5518 1,838
IJSER © 2018http://www.ijser.org
IJSER
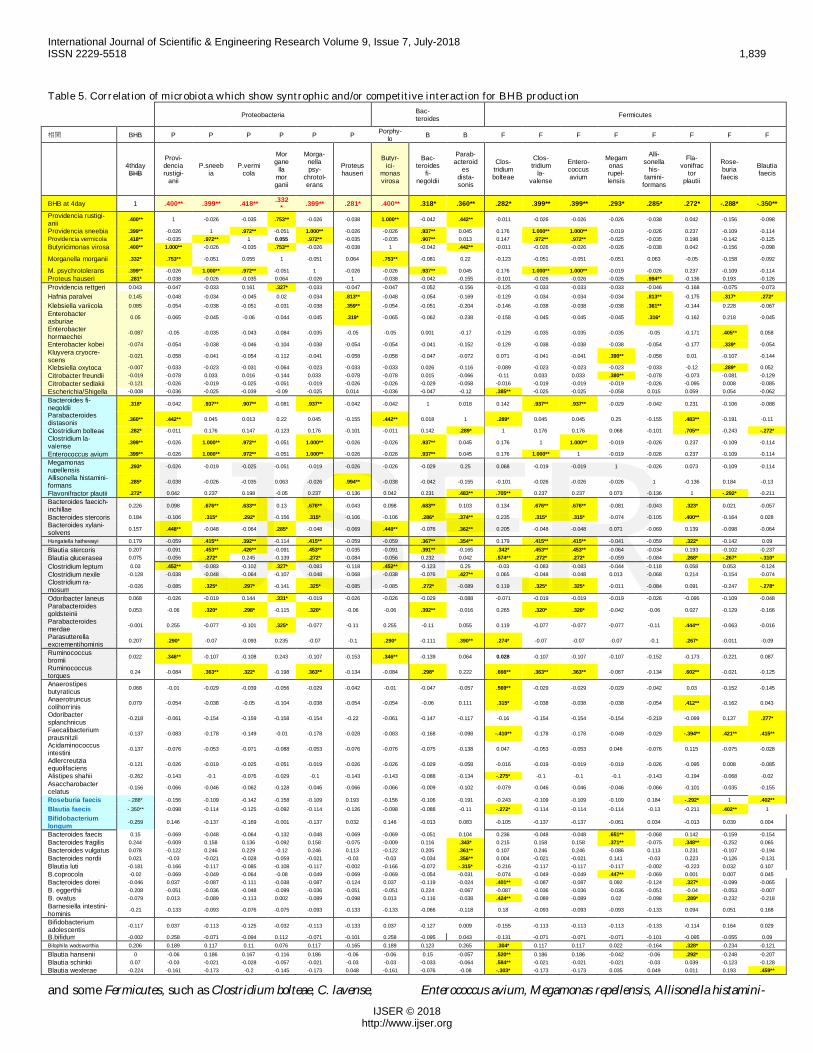
Table 5. Correlation of microbiota which show syntrophic and/or competitive interaction for BHB productionProteobacteria Bac-
teroides Fermicutes
相関 BHB P P P P P P Porphy-lo B B F F F F F F F F
4thdayBHB
Provi-denciarustigi-
anii
P.sneebia
P.vermicola
Morgane
llamorganii
Morga-nellapsy-
chrotol-erans
Proteushauseri
Butyr-ici-
monasvirosa
Bac-teroides
fi-negoldii
Parab-acteroid
esdista-sonis
Clos-tridiumbolteae
Clos-tridium
la-valense
Entero-coccusavium
Megamonasrupel-lensis
Alli-sonella
his-tamini-
formans
Fla-vonifrac
torplautii
Rose-buriafaecis
Blautiafaecis
BHB at 4day 1 .400** .399** .418** .332* .399** .281* .400** .318* .360** .282* .399** .399** .293* .285* .272* -.288* -.350**
Providencia rustigi-anii .400** 1 -0.026 -0.035 .753** -0.026 -0.038 1.000** -0.042 .442** -0.011 -0.026 -0.026 -0.026 -0.038 0.042 -0.156 -0.098
Providencia sneebia .399** -0.026 1 .972** -0.051 1.000** -0.026 -0.026 .937** 0.045 0.176 1.000** 1.000** -0.019 -0.026 0.237 -0.109 -0.114Providencia vermicola .418** -0.035 .972** 1 0.055 .972** -0.035 -0.035 .907** 0.013 0.147 .972** .972** -0.025 -0.035 0.198 -0.142 -0.125Butyricimonas virosa .400** 1.000** -0.026 -0.035 .753** -0.026 -0.038 1 -0.042 .442** -0.011 -0.026 -0.026 -0.026 -0.038 0.042 -0.156 -0.098
Morganella morganii .332* .753** -0.051 0.055 1 -0.051 0.064 .753** -0.081 0.22 -0.123 -0.051 -0.051 -0.051 0.063 -0.05 -0.158 -0.092
M. psychrotolerans .399** -0.026 1.000** .972** -0.051 1 -0.026 -0.026 .937** 0.045 0.176 1.000** 1.000** -0.019 -0.026 0.237 -0.109 -0.114Proteus hauseri .281* -0.038 -0.026 -0.035 0.064 -0.026 1 -0.038 -0.042 -0.155 -0.101 -0.026 -0.026 -0.026 .994** -0.136 0.193 -0.126Providencia rettgeri 0.043 -0.047 -0.033 0.161 .327* -0.033 -0.047 -0.047 -0.052 -0.156 -0.125 -0.033 -0.033 -0.033 -0.046 -0.168 -0.075 -0.073
Hafnia paralvei 0.145 -0.048 -0.034 -0.045 0.02 -0.034 .813** -0.048 -0.054 -0.169 -0.129 -0.034 -0.034 -0.034 .813** -0.175 .317* .272*Klebsiella variicola 0.085 -0.054 -0.038 -0.051 -0.031 -0.038 .359** -0.054 -0.051 -0.204 -0.146 -0.038 -0.038 -0.038 .361** -0.144 0.228 -0.067Enterobacterasburiae 0.05 -0.065 -0.045 -0.06 -0.044 -0.045 .319* -0.065 -0.062 -0.238 -0.158 -0.045 -0.045 -0.045 .316* -0.162 0.218 -0.045
Enterobacterhormaechei -0.087 -0.05 -0.035 -0.043 -0.084 -0.035 -0.05 -0.05 0.001 -0.17 -0.129 -0.035 -0.035 -0.035 -0.05 -0.171 .405** 0.058
Enterobacter kobei -0.074 -0.054 -0.038 -0.046 -0.104 -0.038 -0.054 -0.054 -0.041 -0.152 -0.129 -0.038 -0.038 -0.038 -0.054 -0.177 .339* -0.054Kluyvera cryocre-scens -0.021 -0.058 -0.041 -0.054 -0.112 -0.041 -0.058 -0.058 -0.047 -0.072 0.071 -0.041 -0.041 .390** -0.058 0.01 -0.107 -0.144
Klebsiella oxytoca -0.007 -0.033 -0.023 -0.031 -0.064 -0.023 -0.033 -0.033 0.026 -0.116 -0.089 -0.023 -0.023 -0.023 -0.033 -0.12 .289* 0.052Citrobacter freundii -0.019 -0.078 0.033 0.016 -0.144 0.033 -0.078 -0.078 0.015 -0.066 -0.11 0.033 0.033 .380** -0.078 -0.073 -0.081 -0.129Citrobacter sedlakii -0.121 -0.026 -0.019 -0.025 -0.051 -0.019 -0.026 -0.026 -0.029 -0.058 -0.016 -0.019 -0.019 -0.019 -0.026 -0.095 0.008 -0.085Escherichia/Shigella -0.008 -0.036 -0.025 -0.039 -0.09 -0.025 0.014 -0.036 -0.047 -0.12 .385** -0.025 -0.025 -0.058 0.015 0.059 0.054 -0.062Bacteroides fi-negoldii .318* -0.042 .937** .907** -0.081 .937** -0.042 -0.042 1 0.018 0.142 .937** .937** -0.029 -0.042 0.231 -0.106 -0.088
Parabacteroidesdistasonis .360** .442** 0.045 0.013 0.22 0.045 -0.155 .442** 0.018 1 .289* 0.045 0.045 0.25 -0.155 .483** -0.191 -0.11
Clostridium bolteae .282* -0.011 0.176 0.147 -0.123 0.176 -0.101 -0.011 0.142 .289* 1 0.176 0.176 0.068 -0.101 .705** -0.243 -.272*Clostridium la-valense .399** -0.026 1.000** .972** -0.051 1.000** -0.026 -0.026 .937** 0.045 0.176 1 1.000** -0.019 -0.026 0.237 -0.109 -0.114
Enterococcus avium .399** -0.026 1.000** .972** -0.051 1.000** -0.026 -0.026 .937** 0.045 0.176 1.000** 1 -0.019 -0.026 0.237 -0.109 -0.114Megamonasrupellensis .293* -0.026 -0.019 -0.025 -0.051 -0.019 -0.026 -0.026 -0.029 0.25 0.068 -0.019 -0.019 1 -0.026 0.073 -0.109 -0.114
Allisonella histamini-formans .285* -0.038 -0.026 -0.035 0.063 -0.026 .994** -0.038 -0.042 -0.155 -0.101 -0.026 -0.026 -0.026 1 -0.136 0.184 -0.13
Flavonifractor plautii .272* 0.042 0.237 0.198 -0.05 0.237 -0.136 0.042 0.231 .483** .705** 0.237 0.237 0.073 -0.136 1 -.292* -0.211Bacteroides faecich-inchillae 0.226 0.098 .676** .633** 0.13 .676** -0.043 0.098 .683** 0.103 0.134 .676** .676** -0.081 -0.043 .323* 0.021 -0.057
Bacteroides stercoris 0.184 -0.106 .315* .292* -0.156 .315* -0.106 -0.106 .286* .374** 0.235 .315* .315* -0.074 -0.105 .400** -0.164 0.028Bacteroides xylani-solvens 0.157 .448** -0.048 -0.064 .285* -0.048 -0.069 .448** -0.076 .362** 0.205 -0.048 -0.048 0.071 -0.069 0.139 -0.098 -0.064
Hungatella hathewayi 0.179 -0.059 .415** .392** -0.114 .415** -0.059 -0.059 .367** .354** 0.179 .415** .415** -0.041 -0.059 .322* -0.142 0.09Blautia stercoris 0.207 -0.091 .453** .426** -0.091 .453** -0.035 -0.091 .391** -0.165 .342* .453** .453** -0.064 -0.034 0.193 -0.102 -0.237Blautia glucerasea 0.075 -0.056 .272* 0.245 -0.139 .272* -0.084 -0.056 0.232 0.042 .574** .272* .272* -0.059 -0.084 .268* -.267* -.310*Clostridium leptum 0.03 .452** -0.083 -0.102 .327* -0.083 -0.118 .452** -0.123 0.25 -0.03 -0.083 -0.083 -0.044 -0.118 0.058 0.053 -0.124Clostridium nexile -0.128 -0.038 -0.048 -0.064 -0.107 -0.048 -0.068 -0.038 -0.076 .427** 0.065 -0.048 -0.048 0.013 -0.068 0.214 -0.154 -0.074Clostridium ra-mosum -0.026 -0.085 .325* .297* -0.141 .325* -0.085 -0.085 .272* -0.089 0.119 .325* .325* -0.011 -0.084 0.091 -0.247 -.278*
Odoribacter laneus 0.068 -0.026 -0.019 0.144 .331* -0.019 -0.026 -0.026 -0.029 -0.088 -0.071 -0.019 -0.019 -0.019 -0.026 -0.095 -0.109 -0.048Parabacteroidesgoldsteinii 0.053 -0.06 .320* .298* -0.115 .320* -0.06 -0.06 .392** -0.016 0.265 .320* .320* -0.042 -0.06 0.027 -0.129 -0.166
Parabacteroidesmerdae -0.001 0.255 -0.077 -0.101 .325* -0.077 -0.11 0.255 -0.11 0.055 0.119 -0.077 -0.077 -0.077 -0.11 .444** -0.063 -0.016
Parasutterellaexcrementihominis 0.207 .290* -0.07 -0.093 0.235 -0.07 -0.1 .290* -0.111 .390** .274* -0.07 -0.07 -0.07 -0.1 .267* -0.011 -0.09
Ruminococcusbromii 0.022 .346** -0.107 -0.108 0.243 -0.107 -0.153 .346** -0.139 0.064 0.028 -0.107 -0.107 -0.107 -0.152 -0.173 -0.221 0.087
Ruminococcustorques 0.24 -0.084 .363** .322* -0.198 .363** -0.134 -0.084 .298* 0.222 .666** .363** .363** -0.067 -0.134 .602** -0.021 -0.125
Anaerostipesbutyraticus 0.068 -0.01 -0.029 -0.039 -0.056 -0.029 -0.042 -0.01 -0.047 -0.057 .569** -0.029 -0.029 -0.029 -0.042 0.03 -0.152 -0.145
Anaerotruncuscolihominis 0.079 -0.054 -0.038 -0.05 -0.104 -0.038 -0.054 -0.054 -0.06 0.111 .315* -0.038 -0.038 -0.038 -0.054 .412** -0.162 0.043
Odoribactersplanchnicus -0.218 -0.061 -0.154 -0.159 -0.158 -0.154 -0.22 -0.061 -0.147 -0.117 -0.16 -0.154 -0.154 -0.154 -0.219 -0.099 0.137 .277*
Faecalibacteriumprausnitzii -0.137 -0.083 -0.178 -0.149 -0.01 -0.178 -0.028 -0.083 -0.168 -0.098 -.410** -0.178 -0.178 -0.049 -0.029 -.394** .421** .415**
Acidaminococcusintestini -0.137 -0.076 -0.053 -0.071 -0.088 -0.053 -0.076 -0.076 -0.075 -0.138 0.047 -0.053 -0.053 0.046 -0.076 0.115 -0.075 -0.028
Adlercreutziaequolifaciens -0.121 -0.026 -0.019 -0.025 -0.051 -0.019 -0.026 -0.026 -0.029 -0.058 -0.016 -0.019 -0.019 -0.019 -0.026 -0.095 0.008 -0.085
Alistipes shahii -0.262 -0.143 -0.1 -0.076 -0.029 -0.1 -0.143 -0.143 -0.088 -0.134 -.275* -0.1 -0.1 -0.1 -0.143 -0.194 -0.068 -0.02Asaccharobactercelatus -0.156 -0.066 -0.046 -0.062 -0.128 -0.046 -0.066 -0.066 -0.009 -0.102 -0.079 -0.046 -0.046 -0.046 -0.066 -0.101 -0.035 -0.155
Roseburia faecis -.288* -0.156 -0.109 -0.142 -0.158 -0.109 0.193 -0.156 -0.106 -0.191 -0.243 -0.109 -0.109 -0.109 0.184 -.292* 1 .402**Blautia faecis -.350** -0.098 -0.114 -0.125 -0.092 -0.114 -0.126 -0.098 -0.088 -0.11 -.272* -0.114 -0.114 -0.114 -0.13 -0.211 .402** 1
Bifidobacteriumlongum -0.259 0.146 -0.137 -0.169 -0.001 -0.137 0.032 0.146 -0.013 0.083 -0.105 -0.137 -0.137 -0.061 0.034 -0.013 0.039 0.004
Bacteroides faecis 0.15 -0.069 -0.048 -0.064 -0.132 -0.048 -0.069 -0.069 -0.051 0.104 0.236 -0.048 -0.048 .651** -0.068 0.142 -0.159 -0.154Bacteroides fragilis 0.244 -0.009 0.158 0.136 -0.092 0.158 -0.075 -0.009 0.116 .343* 0.215 0.158 0.158 .371** -0.075 .348** -0.252 0.065Bacteroides vulgatus 0.078 -0.122 0.246 0.229 -0.12 0.246 0.113 -0.122 0.205 .361** 0.107 0.246 0.246 -0.086 0.113 0.231 -0.107 -0.194Bacteroides nordii 0.021 -0.03 -0.021 -0.028 -0.059 -0.021 -0.03 -0.03 -0.034 .356** 0.004 -0.021 -0.021 0.141 -0.03 0.223 -0.126 -0.131Blautia luti -0.181 -0.166 -0.117 -0.085 -0.108 -0.117 -0.002 -0.166 -0.072 -.315* -0.216 -0.117 -0.117 -0.117 -0.002 -0.223 0.032 0.107B.coprocola -0.02 -0.069 -0.049 -0.064 -0.08 -0.049 -0.069 -0.069 -0.054 -0.031 -0.074 -0.049 -0.049 .447** -0.069 0.001 0.007 0.045Bacteroides dorei -0.046 0.037 -0.087 -0.111 -0.038 -0.087 -0.124 0.037 -0.119 -0.024 .401** -0.087 -0.087 0.092 -0.124 .327* -0.099 -0.065B. eggerthii -0.208 -0.051 -0.036 -0.048 -0.099 -0.036 -0.051 -0.051 0.224 -0.067 -0.087 -0.036 -0.036 -0.036 -0.051 -0.04 -0.053 -0.007B. ovatus -0.079 0.013 -0.089 -0.113 0.002 -0.089 -0.098 0.013 -0.116 -0.038 .424** -0.089 -0.089 0.02 -0.098 .289* -0.232 -0.218Barnesiella intestini-hominis -0.21 -0.133 -0.093 -0.076 -0.075 -0.093 -0.133 -0.133 -0.066 -0.118 0.18 -0.093 -0.093 -0.093 -0.133 0.094 0.051 0.168
Bifidobacteriumadolescentis -0.117 0.037 -0.113 -0.125 -0.032 -0.113 -0.133 0.037 -0.127 0.009 -0.155 -0.113 -0.113 -0.113 -0.133 -0.114 0.164 0.029
B.bifidum -0.002 0.258 -0.071 -0.094 0.112 -0.071 -0.101 0.258 -0.095 0.043 -0.131 -0.071 -0.071 -0.071 -0.101 -0.095 -0.055 0.09Bilophila wadsworthia 0.206 0.189 0.117 0.11 0.076 0.117 -0.165 0.189 0.123 0.265 .304* 0.117 0.117 0.022 -0.164 .328* -0.234 -0.121Blautia hansenii 0 -0.06 0.186 0.167 -0.116 0.186 -0.06 -0.06 0.15 -0.057 .520** 0.186 0.186 -0.042 -0.06 .292* -0.248 -0.207Blautia schinkii 0.07 -0.03 -0.021 -0.028 -0.057 -0.021 -0.03 -0.03 -0.033 -0.064 .584** -0.021 -0.021 -0.021 -0.03 0.039 -0.123 -0.128Blautia wexlerae -0.224 -0.161 -0.173 -0.2 -0.145 -0.173 0.048 -0.161 -0.076 -0.08 -.303* -0.173 -0.173 0.035 0.049 0.011 0.193 .459**
and some Fermicutes, such as Clostridium bolteae, C. lavense, Enterococcus avium, Megamonas repellensis, Allisonella histamini-
International Journal of Scientific & Engineering Research Volume 9, Issue 7, July-2018ISSN 2229-5518 1,839
IJSER © 2018http://www.ijser.org
IJSER
formans and Flavonifractor plautii were indirectly associatedwith Enterobacter families, except for Flavonifractor plauti. (Ta-ble 5)
Roseburia faecis and Blautia faecis were negatively associ-ated with BHB concentration, but they showed syntrophiccorrelation with Providencia rettgeri, Hafnia paralvei, and otherenterobacters. Five cases with very low Enterobacter profileshowed lowest BHB level. Only one case with high BHB levelshowed no positive association to proteobacteriae, but broadassociation was pre-sent, such as Megamonas funiformis, Prevotella copri and P. ster-corea, Bifidobacterium adolescentis, Faecalibacterium prausnizii,etc. (Table 5)
These association was confirmed by individual level(Suppl. Table 2). Enterobactereciae species were recognized in20/22 high bHB producers, 13/17 moderate bHB producersand 15/16 low producers. Two in high BHB, 4 in middle BHB,and 1 in low BHB did not have enterobacteriacea species, andin these cases, Clostridium bolteae, C. lavalense, Enterococcusavium, Hunatella hathewayi, Megamonas rupellensis and Rumino-coccus bromii seemed to be related to BHB production.
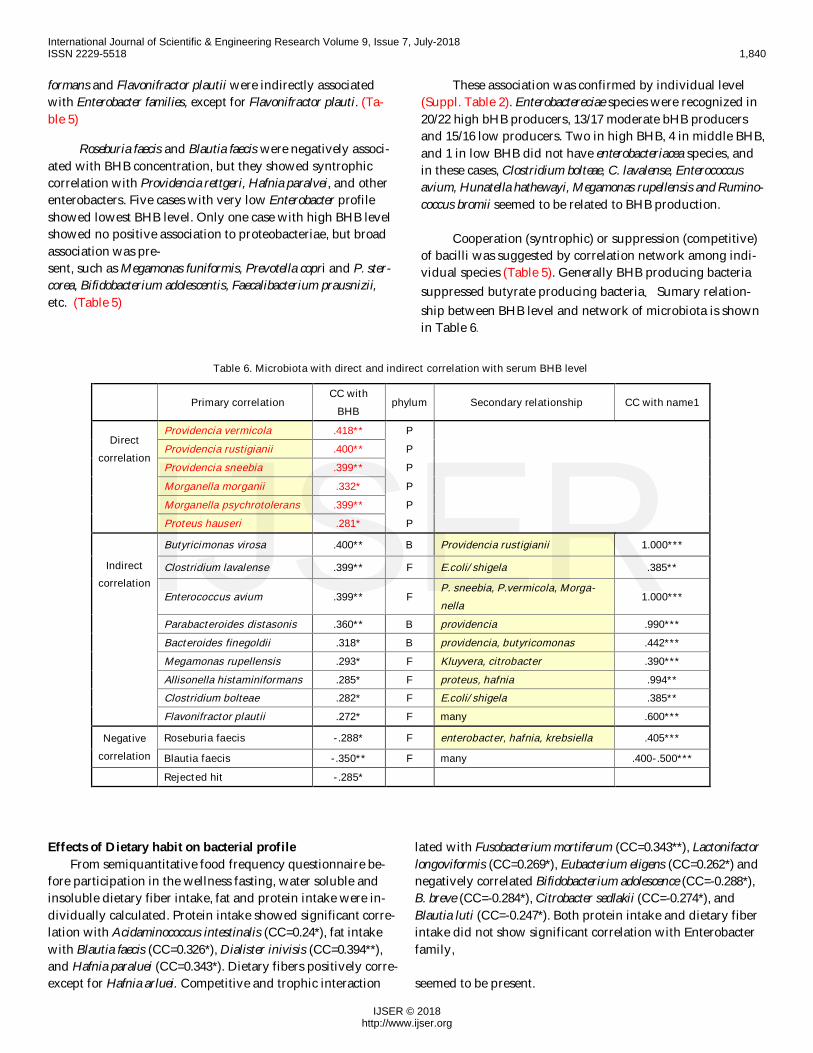
Cooperation (syntrophic) or suppression (competitive)of bacilli was suggested by correlation network among indi-vidual species (Table 5). Generally BHB producing bacteriasuppressed butyrate producing bacteria.Sumary relation-ship between BHB level and network of microbiota is shownin Table 6.
Table 6. Microbiota with direct and indirect correlation with serum BHB level
Primary correlationCC with
BHBphylum Secondary relationship CC with name1
Directcorrelation
Providencia vermicola .418** PProvidencia rustigianii .400** PProvidencia sneebia .399** PMorganella morganii .332* PMorganella psychrotolerans .399** PProteus hauseri .281* P
Indirectcorrelation
Butyricimonas virosa .400** B Providencia rustigianii 1.000***
Clostridium lavalense .399** F E.coli/shigela .385**
Enterococcus avium .399** FP. sneebia, P.vermicola, Morga-nella
1.000***
Parabacteroides distasonis .360** B providencia .990***Bacteroides finegoldii .318* B providencia, butyricomonas .442***Megamonas rupellensis .293* F Kluyvera, citrobacter .390***Allisonella histaminiformans .285* F proteus, hafnia .994**Clostridium bolteae .282* F E.coli/shigela .385**Flavonifractor plautii .272* F many .600***
Negativecorrelation
Roseburia faecis -.288* F enterobacter, hafnia, krebsiella .405***
Blautia faecis -.350** F many .400-.500***Rejected hit -.285*
Effects of Dietary habit on bacterial profile From semiquantitative food frequency questionnaire be-fore participation in the wellness fasting, water soluble andinsoluble dietary fiber intake, fat and protein intake were in-dividually calculated. Protein intake showed significant corre-lation with Acidaminococcus intestinalis (CC=0.24*), fat intakewith Blautia faecis (CC=0.326*), Dialister inivisis (CC=0.394**),and Hafnia paraluei (CC=0.343*). Dietary fibers positively corre-
lated with Fusobacterium mortiferum (CC=0.343**), Lactonifactorlongoviformis (CC=0.269*), Eubacterium eligens (CC=0.262*) andnegatively correlated Bifidobacterium adolescence (CC=-0.288*),B. breve (CC=-0.284*), Citrobacter sedlakii (CC=-0.274*), andBlautia luti (CC=-0.247*). Both protein intake and dietary fiberintake did not show significant correlation with Enterobacterfamily,
except for Hafnia arluei. Competitive and trophic interaction seemed to be present.
International Journal of Scientific & Engineering Research Volume 9, Issue 7, July-2018ISSN 2229-5518 1,840
IJSER © 2018http://www.ijser.org
IJSER
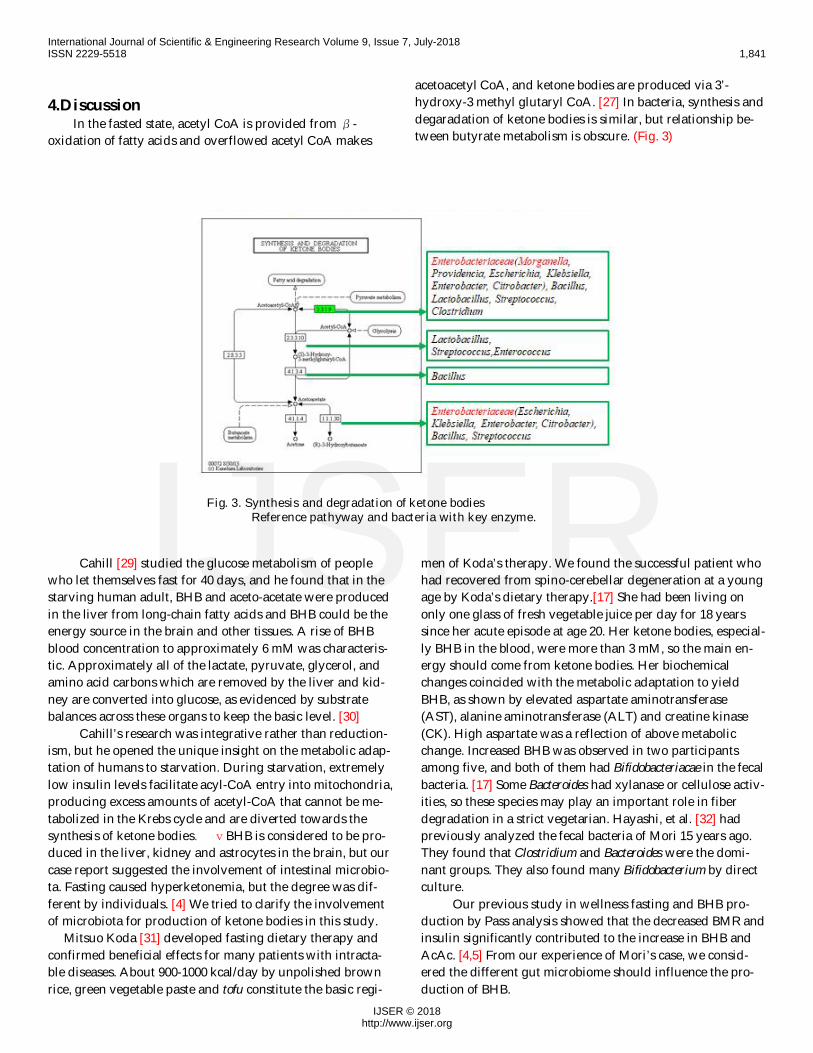
4.DiscussionIn the fasted state, acetyl CoA is provided from β-
oxidation of fatty acids and overflowed acetyl CoA makes
acetoacetyl CoA, and ketone bodies are produced via 3’-hydroxy-3 methyl glutaryl CoA. [27] In bacteria, synthesis anddegaradation of ketone bodies is similar, but relationship be-tween butyrate metabolism is obscure. (Fig. 3)
Fig. 3. Synthesis and degradation of ketone bodiesReference pathyway and bacteria with key enzyme.
Cahill [29] studied the glucose metabolism of peoplewho let themselves fast for 40 days, and he found that in thestarving human adult, BHB and aceto-acetate were producedin the liver from long-chain fatty acids and BHB could be theenergy source in the brain and other tissues. A rise of BHBblood concentration to approximately 6 mM was characteris-tic. Approximately all of the lactate, pyruvate, glycerol, andamino acid carbons which are removed by the liver and kid-ney are converted into glucose, as evidenced by substratebalances across these organs to keep the basic level. [30]
Cahill’s research was integrative rather than reduction-ism, but he opened the unique insight on the metabolic adap-tation of humans to starvation. During starvation, extremelylow insulin levels facilitate acyl-CoA entry into mitochondria,producing excess amounts of acetyl-CoA that cannot be me-tabolized in the Krebs cycle and are diverted towards thesynthesis of ketone bodies. vBHB is considered to be pro-duced in the liver, kidney and astrocytes in the brain, but ourcase report suggested the involvement of intestinal microbio-ta. Fasting caused hyperketonemia, but the degree was dif-ferent by individuals. [4] We tried to clarify the involvementof microbiota for production of ketone bodies in this study. Mitsuo Koda [31] developed fasting dietary therapy andconfirmed beneficial effects for many patients with intracta-ble diseases. About 900-1000 kcal/day by unpolished brownrice, green vegetable paste and tofu constitute the basic regi-
men of Koda’s therapy. We found the successful patient whohad recovered from spino-cerebellar degeneration at a youngage by Koda’s dietary therapy.[17] She had been living ononly one glass of fresh vegetable juice per day for 18 yearssince her acute episode at age 20. Her ketone bodies, especial-ly BHB in the blood, were more than 3 mM, so the main en-ergy should come from ketone bodies. Her biochemicalchanges coincided with the metabolic adaptation to yieldBHB, as shown by elevated aspartate aminotransferase(AST), alanine aminotransferase (ALT) and creatine kinase(CK). High aspartate was a reflection of above metabolicchange. Increased BHB was observed in two participantsamong five, and both of them had Bifidobacteriacae in the fecalbacteria. [17] Some Bacteroides had xylanase or cellulose activ-ities, so these species may play an important role in fiberdegradation in a strict vegetarian. Hayashi, et al. [32] hadpreviously analyzed the fecal bacteria of Mori 15 years ago.They found that Clostridium and Bacteroides were the domi-nant groups. They also found many Bifidobacterium by directculture.
Our previous study in wellness fasting and BHB pro-duction by Pass analysis showed that the decreased BMR andinsulin significantly contributed to the increase in BHB andAcAc. [4,5] From our experience of Mori’s case, we consid-ered the different gut microbiome should influence the pro-duction of BHB.
International Journal of Scientific & Engineering Research Volume 9, Issue 7, July-2018ISSN 2229-5518 1,841
IJSER © 2018http://www.ijser.org
IJSER
Comparison of our cases with other Japanese microbiotaNishijima et al. [33] analyzed gut microbiota of the Jap-
anese by comparing the metagenomic data obtained from 106Japanese individuals with those from 11 other nations. Theyfound that the composition of the Japanese gut microbiomeshowed more abundant in the phylum Actinobacteria, in par-ticular in the genus Bifidobacterium, than other nations. Hisa-da et al. [22] reported predominance of Fermicutes and ourcase showed the similar proportion. However, Proteobacteriaand Verrucobacteria may be influenced by fasting and theirdietary habit as vegetalian.
Numerous animal models and human studies consist-ently demonstrated that gut microbiota can modulate hostenergy homeostasis and adiposity through different mecha-nisms. [34-39] Dietary change or fasting could change micro-biota quickly within a short period [40,41]. Some peoplecould not raise ketone concentration in the blood as expectedeven by the ketogenic diet. A metabolic homeostasis wouldbe different in these people, and need further study.
Relationship with butyrate producing bacteria:Butyrate-producing bacteria may represent a functional
group, rather than a coherent phylogenetic group, within themicrobial community of the human large intestine. Butyrateformation can play a special role in bacterial energy metabo-lism [42-46] and this implies that certain features of energymetabolism and microbial ecology may be shared betweenphylogenetically distinct groups of butyrate-producing bac-teria. Numerically, two of the most important groups appearto be Faecalibacterium prausnitzii, which belongs to the Clos-tridium leptum cluster, and Eubacterium rectale/Roseburia spp.,which belong to the Clostridium coccoides cluster of firmicutebacteria. After reduction to butyryl-CoA, butyrate can beformed either with the enzymes phosphotransbutyrylase andbutyrate-kinase via butyry-l-phosphate or with the enzymebutyryl-CoA : acetate CoA-transferase, which utilizes acetateas a co-substrate and generates acetyl-CoA. (Fig. 4)
Butyrate-producing human gut isolates, covering aphylogenetically wide range of representatives of clostridialcluster XIVa and some cluster IV and XVI strains, indicatedthat the butyryl-CoA : acetate CoA-transferase route is farmore prevalent in this ecosystem than the butyrate kinase
route.[44]Could synthesis of BHB come from butyrate? The cur-
rent data suggested Enterobactericeae mainly correlated to theBHB production, but several other species in Clostridium andBacteroides that had correlation with BHB were indirectly re-lated to Enterobactericeae. Enterobacter seemed to suppressFermicutes, so butyrate producing bacteria would be sup-pressed in the colon. Possibility of metabolism by intestinalmicrobiota from butyrate to BHB in the body seemed to beindependent.
In addition, there are many bacteria that can synthesizepoly(3-hydroxy butyrate-co-3 hydroxyvalerate) oly-beta hy-droxyl butyrate.[47-50] These bacteria are capable of using abroad range of carbon sources for their growth and for theproduction of polyhydroxyalkanoates (PHAs). They can usemonosaccharides (glucose and fructose), disaccharides (su-crose), pentoses (xylose and arabinose), various organic acids(acetic acid, propionic acid and octanoic acid) for growth andthe production of polyhydroxyalkanoates (PHAs). PHAs andBHB could be hydrolyzed inside and outside of the bacilli.
One case who did not show the direct or indirect correla-tion with Enterobacteriaceae could be related to such un-known bacteria.
4 . Conclusion1. Wellness fasting caused metabolic and physiological
changes , and induced hyperketonemia which showedcorrelation with prefasting microbiota profile.
2. High BHB level showed association with family Entero-bacteriaceae directly or indirectly.
3. The dominance of Enterobacteriaceae seemed to suppressbutyrate producing bacteria. So, the BHB productionseemed to be independent from butyrate pathway in thegut.
4. The rout of BHB synthesis would be multiple bysyntrophic and/or competitive growth of bacteria.
Acknowledgment The authors appreciate the participants in this study.The authors appreciate Dr. Teruyuki Kobayashi, Chiba Sci-ence University, for review and discussion on this paper, andDr. Philippe Calain, MSF, for his kind English revision anddiscussion.COI: This research was supported by the Life Science Pro-moting Association, AOB Keio Group and TechnoSurugaLaboratory.
International Journal of Scientific & Engineering Research Volume 9, Issue 7, July-2018ISSN 2229-5518 1,842
IJSER © 2018http://www.ijser.org
IJSER
References[1] A.M.Robinson and D.H.Williamson, “Physiological role of
ketone bodies as substrates and signals in mammalian tis-sues.” Physiol Rev. 1980; 60(1): 143-187. Web site.http://physrev.physiology. org/content/60/1/143.long.
[2] J.C.Newman and E.Verdin, “β-hydroxybutyrate: Muchmore than a metabolite.” Diabetes Res Clin Prac. 2014;106(2): 173-181.doi: 10.1016/j.diabres.2014.08.009
[3] R.L.Veech, “The therapeutic implications of ketone bodies:the effects of ketone bodies in pathological conditions: Ke-tosis, ketogenic diet, redox states, insulin resistance, and
mitochondirial metabolism.” Prostaglandins Leukot EssentFatty Acids. 2004; 70(3): 309-319. doi:10.1016/j.plefa.2003.09.007
[4] S.Watanabe, “Wellness fasting and hyperketosis.” Diabe-tes Res Open J. 2016; 2(2): e10-e13. doi: 10.17140/DROJ-2-e007
[5] S.Watanabe, A. Hirakawa, I.Utada, S.Aoe, S.Moriyama,and R.Takiguchi, “Ketone body production and excretionduring wellness fasting,” Diabetes Res Open J 2017; 3(1):1-8. doi: 10.17140/DROJ-3-129
[6] P.J.Cox, T.Kirk, T.Ashmore, K.Willerton and R.Evans,“Nutritional ketosis alters fuel preference and thereby en-durance performance in athlete.” Cell Metabolism. 2016;24(2): 1-13. doi: 10.1016/j.cmet.2016.07.010
[7] S.Watanabe, A.Hirakawa, S.Aoe, K.Fukuda andT.Muneta,”Basic ketone engine and booster glucose enginefor energy production.“”Diabetes Res Open J. 2016: 2(1):14-23. doi: 10.17140/DROJ-2-125
[8] R.N.Heitmann, D.J.Dawes and S.C.Sensenig, “Hepaticketogenesis and peripheral ketone body utilization in thenutrient.” J Nutr.1987; 117(6): 1174-1180. Web site.http://europepmc.org/abstract/med/3298582. Accessed December 29, 2016.
[9] S.Phinney and J.Volek,https://nutritionalketosisforhealth.com/what-is
[10] J.Zhang, Q.Cao and S.Li,” 3-Hydroxybutyrate methylester as a potential drug against Alzheimer’s disease viamitochondria protection mechanism.” Biomaterials. 2013;34(30): 7552-7562. doi: 10.1016/j.biomaterials.2013.06.043
[11] H.C.Kang, D.E.Chung, D.W.Kim and H,D.Kim,”Early-and late- onset complications of the ketogenic diet for in-tractable epilepsy.” Epilepsia 2004; 45(9): 1116-1123. doi:10.1111/j.0013-9580.2004.10004.
[12] G.P.Delcuve, D.H.Khan and J.R.Davi. ”Roles of histonedeacetylases in epigenetic regulation: Emerging para-digms from studies with inhibitors.” Clin Epigenetics.2012; 4(1): 5. doi: 10.1186/1868-7083-4-5
[13] T.Shimazu, M.D.Hirschey, J.Newman et al. “Suppressionof oxidative stress by β-hydroxybutyrate, an endogenoushistone deacetylase inhibitor.” Science. 2013; 339(6116):211-214. doi: 10.1126/science.1227166
[14] J.M.Miles, M.W.Haymond and J.E.Gerich. “Effects of freefatty acids, insulin, glucagon and adrenaline on ketonebody production in humans.” Ciba Found Symp. 1982; 87:192-213. doi: 10.1002/9780470720691.ch11
[15] R.Felty and E.O. Balasse,” Ketone body production anddisposal in diabetic ketosis. A comparison with fasting ke-
tosis.” Diabetes.1985; 34(4): 326-332. doi:10.2337/diab.34.4.326
[16] U.Keller, M.Lustenberger, J.Müller-Brand, P.P.Gerber andW.Stauffacher,”Human ketone body production and utili-zation studied using tracer techniques: Regulation by freefatty acids, insulin, catecholamines, and thyroid hor-mones.” Diabetes Metab Rev. 1989; 5(3): 285-298. doi:10.1002/dmr.5610050306
[17] A.Hirakawa, S.Watanabe and H.Tanaka,” Koda’s fastingtherapy: Energy balance and intestinal bacteria flora.”Adv Food Technol Nutr Sci Open J. 2015; 1(5): 112-123.doi: 10.17140/AFTNSOJ-1-120
[18] I.Utada, S.Moriyama, S.Hitomi, H.Honda, R.Takiguchiand S.Watamabe, “Wellness fasting for healthy longevity.”Adv Food Technol Nutr Sci Open J. 2016;2(3):103-109. doi:10.17140/AFTNSOJ-2-136
[19] Y.Sakamoto, M.Nishizawa, T.Sato, M/Ohno andY.Ikeda,”Availability of body composition instrument bybio-inpedance method.” Proc Japan Obesity Society. 1992;12: 244-246.
[20] S.Watanabe, M.Noboru, M.Yasunari, T.Ideura, “A cross-sectional study on the effects of long term very low pro-tein diets in patients with chronic kidney disease: Serumand urine, DEXA and amino acid profiles”. Anti AgingMed. 2010; 7(2):7-13. doi: 10.3793/jaam.7.7
[21] T.Hisada, K.Endoh and K.Kuriki, “Inter- and in-tra-individual variations in seasonal and daily stabilitiesof the human gut microbiota in Japanese.” Arch Microbiol(2015) 197:919–934 DOI 10.1007/s00203-015-1125-020
[22] M.A.Quail, M.Smith, P.Coupland, T.D.Otto andS.R.Harris,”A tale of three next generation sequencingplatforms: comparison of Ion Torrent, Pacific Biosciencesand Illumina MiSeq sequencers.” BMC Genom 2012;13:341. doi:10.1186/1471-2164-13-341
[23] J.Qin, R.Li, J.RaesJ, M.Arumugam, K.S.Burgdorf andC.Manichanh, “A human gut microbial gene catalogue es-tablished by metagenomic sequencing.” Nature2012;464:59–65. doi:10.1038/nature08821
[24] L.A.David, C.F.Maurice, R.N.Carmody, D.B.Gootenbergand J.E.Button,” Diet rapidly and reproducibly alters thehuman gut microbiome.” Nature 2014; 505:559-563.Doi:10.1038/nature12820
[25] P.Gillevet, M.Sikaroodi, A.Keshavarzian and E.A.Mutlu.”Quantitative assessment of the human gut microbiomeusing multitag pyrosequencing.” Chem Biodivers2010;7:1065–1075. doi:10.1002/cbdv.200900322
[26] Y.D.Nam, M.J. Jung, S.W.Roh, M.S.Kim and J.W.Bae JW, “Comparative analysis of Korean human gut microbiota bybarcoded pyrosequencing. ” PLoS One 2011; 6:e22109.doi:10.1371/journal.pone.0022109
[27] S.Takahashi, J.Tomita, K.Nishioka, T.Hisada andN.Nishijima, “Development of a Prokaryotic UniversalPrimer for Simultaneous Analysis of Bacteria and ArchaeaUsing Next-Generation Sequencing.” PLoS ONE 2014;9(8): e105592. doi:10.1371/journal.pone.0105592
[28] M.Sakamoto, A.Takagaki, K.Matsumoto, Y.Kato andK.Goto, “ Butyricimonas synergistica gen. nov., sp. nov.and Butyricimonas virosa sp. nov., butyric acid-producingbacteria in the family ‘Porphyromonadaceae’ isolated
International Journal of Scientific & Engineering Research Volume 9, Issue 7, July-2018ISSN 2229-5518 1,843
IJSER © 2018http://www.ijser.org
IJSER
from rat faeces.” Int J Systemat Evolut Microbiol 2009;59:1748–1753 DOI 10.1099/ijs.0.007674-0
[29] G.F.Cahill Jr,” Starvation in man.” New Engl J Med. 1970;282:668-675. doi: 10.1056/NEJM197003192821209
[30] E.O.Blasse,” Kinetics of ketone body metabolism in fast-ing humans.” Metabolism. 1979; 28(1): 41-50. doi:10.1016/0026-0495(79)90166-5
[31] M.Koda, “Science of the Fasting Therapy,” Shunju-sha,Tokyo, Japan ISBN4-393-71301-X
[32] H.Hayashi, M.Sakamoto and Y.Benno,” Fecal microbialdiversity in a strict vegetarian as detemined by molecu-lar analysis and cultivation.” Microbiol Immunol. 2002;46: 819-831. doi: 10.1111/j.1348-0421.2002.tb02769.
[33] S.Nishijima, W.Suda, K.Oshima, S.W.Kim and Y.Hirose,“The gut microbiome of healthy Japanese and its microbi-al and functional uniqueness.” DNA Research, 2016;23(2),125-133. DOI: 10.1093/dnares/dsw002
[34] The Human Microbiome Project Consortium Structure,function and diversity of the healthy human microbiome.Nature 2012; 486:207–214. doi:10.1038/nature11234
[35] M.Arumugam, J.Raes, E.Pelletier, D.L.Paslier andT.Yamada, “Enterotypes of the human gut microbiome.”Nature 2011; 473:174–180. doi:10.1038/nature09944
[36] J.J.Faith, J.L.Guruge, M.Charbonneau, S.Subramanianand H.Seedorf, “The long-term stability of the human gutmicrobiota.” Science 2013; 341:1237439.doi:10.1126/science.1237439
[37] I.Martınez, C.E.Muller and J.Walter,” Long-term tem-poral analysis of the human fecal microbiota revealed astable core of dominant bacterial species.” PLoS One2013;8:e69621. doi:10.1371/journal. pone.0069621
[38] A.Schwiertz, D.Taras, K.Schafer, S.Beijer and N.A.Bos,”Microbiota and SCFA in lean and overweight healthy sub-jects.” Obesity. 2010;18(1):190–5.https://doi.org/10.1038/oby.2009.167
[39] S.H.Duncan, G.E.Lobley, G.Holtrop, J.Ince,A.M.Johnstone and P.Louis,” Human colonic microbiotaassociated with diet, obesity and weight loss.” Int J Obes(Lond). 2008;32(11):1720–4.
[40] M.Remely, E.Aumueller, C.Merold, S.Dworzak, B.Hippeand J.Zanner,” Effects of short chain fatty acid producingbacteria on epigenetic regulation of FFAR3 in type 2 dia-betes and obesity.” Gene. 2014;537(1):85–92.
[41] I.Marlinez, J.M.Lattimer, K.L.Hubach, J.A.Case andJ.Yang,” Gut microbiome composition is linked to wholegrain-induced immunological improvements.” The ISMEJournal 2003; 7:269-280. Doi=10.1038/ismej 2012.104
[42] P.Louis and H.J.Flint,”Diversity, metabolism and micro-bial ecology of butyrate-producing bacteria from the hu-man large intestine.” FEMS Microbiology Letters, Volume294, Issue 1, 1 May 2009, Pages 1–8,https://doi.org/10.1111/j.1574-6968.2009.01514.
[43] S.H.Duncan, G.Holtrop, G.E.Lobley, A.G.Calder,C.S.Stewart and H.J.Flint, “Contribution of acetate to bu-tyrate formation by human faecal bacteria.” Brit J Nutr2004;91: 915–923.
[44] P.Louis, S.H.Duncan, S.I.McCrae, J.Millar, M.S.Jacksonand H.J.Flint HJ,” Restricted distribution of the butyratekinase pathway among butyrate-producing bacteria fromthe human colon.” J Bacteriol 2004; 186: 2099-2106.
[45] P.Louis, H.J.Flint, “Diversity, metabolism and microbialecology of butyrate-producing bacteria from the humanlarge intestine”. FEMS Microbiol Lett 2009; 294:1-8.
[46] G.Herrmann, E.Jayamani, G.Mai and W.Buckel, “Energyconservation via electron-transferring flavoprotein in an-aerobic bacteria.” J Bacteriol. 2008;190: 784–791.
[47] K.Uchino, M.Shiraki and T.Saito,”Metabolism of Poly-3-Hydroxybutyrate.” Sci J Kanagawa Univ 2009; 20(2):283-286
[48] K.Uchino, T.Saito, B.Gebauer and D.Jendrossek, “Isolatedpoly(3-hydroxybutyrate) (PHB) granules are complex bac-terial organelles catalyzing formation of PHB from acetylcoenzyme A (CoA) and degradation of PHB to acetyl-CoA.” J. Bacteriol. 2007;189:8250-6.
[49] A.Sugiyama, T.Kobayashi, M.Shiraki and T.Saito,”Rolesof poly(3-hydroxybutyrate) de- polymerase and 3HB-oligomer hydrolase in bacterial PHB metabolism.”Curr.Microbiol. 2004; 48: 424-7.
[50] T.Hisano, K.Kasuya, Y.Tezuka, N.Ishii and T.Kobayashi,” The crystal structure of polyhydroxybutyrate depolymer-ase from Penicillium funiculosum provides insights intothe recognition and degradation of biopolyesters.” J. Mol.Biol. 2006; 356: 993-1004
International Journal of Scientific & Engineering Research Volume 9, Issue 7, July-2018ISSN 2229-5518 1,844
IJSER © 2018http://www.ijser.org
IJSER