Tunable diode laser spectroscopy in the infrared: some practical considerations of techniques and...
5
Tunable diode laser spectroscopy in the infrared: some practical considerations of techniques and calibration with V 2 lines of HCN S. Paddi Reddy, W. Ivancic, V. Malathy Devi, A. Baldacci, K. Narahari Rao, A. W. Mantz, and R. S. Eng A tunable diode laser has been incorporated as a source in an operating high resolution vacuum grating spec- trometer. The advantages of such a system for recording molecular spectra have been elaborated. In the process of developing this system, several practical problems came about, and it has been considered useful to document the manner in which they have been resolved. In particular, for work in the region of 15 Am, it was advantageous to develop an air-spaced Fabry-Perot etalon to record fringes simultaneously with the scanning of molecular spectra. This was successfully done, and the 2 band lines of the HCN molecule at 14 zm have proved to be ideally suited for determining the fringe spacing spectroscopically. 1. Introduction In recent years, the technological advances made with tunable lasers have enabled us to achieve Dop- pler-limited spectral resolution in the ir. For instance, half value widths of 0.002 cm- 1 have been clearly rec- ognized in the spectra observed at 15 Am.' This is at least a factor-of-10 improvement over the best available grating data 2 recorded by using large echelles with di- mensions of 40 cm X 20 cm. Over the years, several laboratories have concentrated their technology in de- veloping high resolution vacuum ir spectrometers equipped with precision gratings. Much molecular spectroscopy continues to be done with such instru- ments. While the significance of the experimental data obtained in this manner may not completely disappear, the question does arise as to how the efforts should be directed for modernizing the technology quickly to take advantage of the superior spectral resolution attainable with tunable lasers. A brief description of an attempt at such a modernization is a principal objective of the present paper. A. W. Mantz and R. S. Eng are with Laser Analytics, Inc., Bedford, Massachusetts 01730; the other authors are with Ohio State Univer- sity, Physics Department, Columbus, Ohio 43210. Received 27 July 1978. 0003-6935/79/091350-00$00.50/0. C 1979 Optical Society of America. 11. Tunable Diode Laser Spectrometer Assembly A. Optical Arrangement In the ir laboratories at Ohio State University ex- tensive use has been made of modern precison gratings as dispersive elements. In fact, to undertake work in diffexent spectral regions simultaneously, three large vacuum ir grating spectrometers have been constructed. It was therefore possible to modify one of these facilities without disrupting research programs drastically and use it in conjunction with a tunable diode laser as a tunable source of monochromatic ir radiation. Figure 1 gives the schematics of the optical system that has become evolved in fulfilling this objective. The ra- diation from the diode laser PbSnTe is focused by means of a system of KRS-5 lenses (L 3 and L 4 ) and front surfaced mirrors (M 2 to M 6 ) on the entrance slit S 1 of a 2-m focal length Czerny-Turner vacuum grating spectrometer. The grating position can be readily set to match one of the laser modes. After passing through the exit slit S 2 the beam is split by a wedge-shaped ZnSe beam splitter (BS). The radiation passing through the beam splitter is focused on to a liquid-nitrogen-cooled HgCdTe detector D 1 after being reflected by several flat and concave mirrors (M 9 -M 22 ). The optical configu- ration with different vacuum boxes, as indicated, has allowed the capabilities of using the absorption from a number of molecules simultaneously if necessary. The absorption area marked C 1 has a pathlength of 6 m, the 1.5-m path C 2 can be heated, if necessary, and C 3 is a 20-cm cell. The cell C 4 , which is located outside the vacuum boxes, is 1 m long. The beam, after emerging 1350 APPLIED OPTICS / Vol. 18, No. 9 / 1 May 1979 e
Transcript of Tunable diode laser spectroscopy in the infrared: some practical considerations of techniques and...
Tunable diode laser spectroscopy in the infrared: somepractical considerations of techniques and calibrationwith V2 lines of HCN
S. Paddi Reddy, W. Ivancic, V. Malathy Devi, A. Baldacci, K. Narahari Rao, A. W. Mantz, and R. S. Eng
A tunable diode laser has been incorporated as a source in an operating high resolution vacuum grating spec-trometer. The advantages of such a system for recording molecular spectra have been elaborated. In theprocess of developing this system, several practical problems came about, and it has been considered usefulto document the manner in which they have been resolved. In particular, for work in the region of 15 Am,it was advantageous to develop an air-spaced Fabry-Perot etalon to record fringes simultaneously with thescanning of molecular spectra. This was successfully done, and the 2 band lines of the HCN molecule at14 zm have proved to be ideally suited for determining the fringe spacing spectroscopically.
1. Introduction
In recent years, the technological advances madewith tunable lasers have enabled us to achieve Dop-pler-limited spectral resolution in the ir. For instance,half value widths of 0.002 cm-1 have been clearly rec-ognized in the spectra observed at 15 Am.' This is atleast a factor-of-10 improvement over the best availablegrating data2 recorded by using large echelles with di-mensions of 40 cm X 20 cm. Over the years, severallaboratories have concentrated their technology in de-veloping high resolution vacuum ir spectrometersequipped with precision gratings. Much molecularspectroscopy continues to be done with such instru-ments. While the significance of the experimental dataobtained in this manner may not completely disappear,the question does arise as to how the efforts should bedirected for modernizing the technology quickly to takeadvantage of the superior spectral resolution attainablewith tunable lasers. A brief description of an attemptat such a modernization is a principal objective of thepresent paper.
A. W. Mantz and R. S. Eng are with Laser Analytics, Inc., Bedford,Massachusetts 01730; the other authors are with Ohio State Univer-sity, Physics Department, Columbus, Ohio 43210.
Received 27 July 1978.0003-6935/79/091350-00$00.50/0.C 1979 Optical Society of America.
11. Tunable Diode Laser Spectrometer Assembly
A. Optical ArrangementIn the ir laboratories at Ohio State University ex-
tensive use has been made of modern precison gratingsas dispersive elements. In fact, to undertake work indiffexent spectral regions simultaneously, three largevacuum ir grating spectrometers have been constructed.It was therefore possible to modify one of these facilitieswithout disrupting research programs drastically anduse it in conjunction with a tunable diode laser as atunable source of monochromatic ir radiation. Figure1 gives the schematics of the optical system that hasbecome evolved in fulfilling this objective. The ra-diation from the diode laser PbSnTe is focused bymeans of a system of KRS-5 lenses (L3 and L4) andfront surfaced mirrors (M2 to M6) on the entrance slitS1 of a 2-m focal length Czerny-Turner vacuum gratingspectrometer. The grating position can be readily setto match one of the laser modes. After passing throughthe exit slit S2 the beam is split by a wedge-shaped ZnSebeam splitter (BS). The radiation passing through thebeam splitter is focused on to a liquid-nitrogen-cooledHgCdTe detector D1 after being reflected by several flatand concave mirrors (M9-M22). The optical configu-ration with different vacuum boxes, as indicated, hasallowed the capabilities of using the absorption from anumber of molecules simultaneously if necessary. Theabsorption area marked C1 has a pathlength of 6 m, the1.5-m path C2 can be heated, if necessary, and C3 is a20-cm cell. The cell C4, which is located outside thevacuum boxes, is 1 m long. The beam, after emerging
1350 APPLIED OPTICS / Vol. 18, No. 9 / 1 May 1979
e.
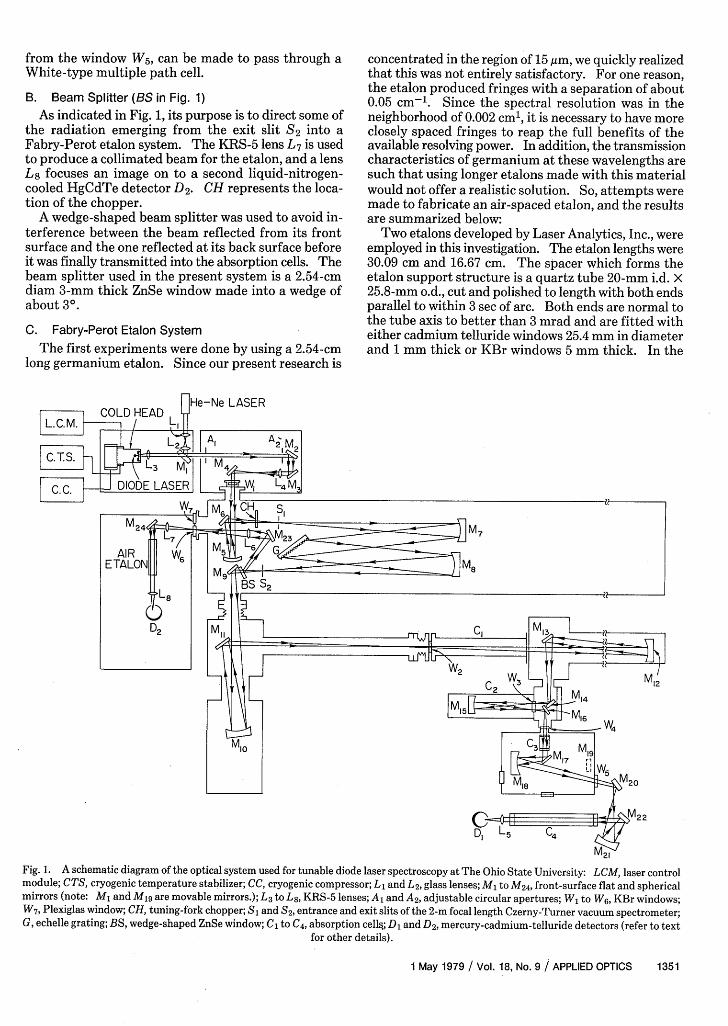
from the window W5 , can be made to pass through aWhite-type multiple path cell.
B. Beam Splitter (BS in Fig. 1)
As indicated in Fig. 1, its purpose is to direct some ofthe radiation emerging from the exit slit S2 into aFabry-Perot etalon system. The KRS-5 lens L7 is usedto produce a collimated beam for the etalon, and a lensL8 focuses an image on to a second liquid-nitrogen-cooled HgCdTe detector D2. CH represents the loca-tion of the chopper.
A wedge-shaped beam splitter was used to avoid in-terference between the beam reflected from its frontsurface and the one reflected at its back surface beforeit was finally transmitted into the absorption cells. Thebeam splitter used in the present system is a 2.54-cmdiam 3-mm thick ZnSe window made into a wedge ofabout 30.
C. Fabry-Perot Etalon System
The first experiments were done by using a 2.54-cmlong germanium etalon. Since our present research is
concentrated in the region of 15 gm, we quickly realizedthat this was not entirely satisfactory. For one reason,the etalon produced fringes with a separation of about0.05 cm-l. Since the spectral resolution was in theneighborhood of 0.002 cm', it is necessary to have moreclosely spaced fringes to reap the full benefits of theavailable resolving power. In addition, the transmissioncharacteristics of germanium at these wavelengths aresuch that using longer etalons made with this materialwould not offer a realistic solution. So, attempts weremade to fabricate an air-spaced etalon, and the resultsare summarized below:
Two etalons developed by Laser Analytics, Inc., wereemployed in this investigation. The etalon lengths were30.09 cm and 16.67 cm. The spacer which forms theetalon support structure is a quartz tube 20-mm i.d. X25.8-mm o.d., cut and polished to length with both endsparallel to within 3 sec of arc. Both ends are normal tothe tube axis to better than 3 mrad and are fitted witheither cadmium telluride windows 25.4 mm in diameterand 1 mm thick or KBr windows 5 mm thick. In the
h-Ne LASER
'22
'21
Fig. 1. A schematic diagram of the optical system used for tunable diode laser spectroscopy at The Ohio State University: LCM, laser controlmodule; CTS, cryogenic temperature stabilizer; CC, cryogenic compressor; L1 and L2 , glass lenses; M1 to M 24 , front-surface flat and sphericalmirrors (note: M1 and M19 are movable mirrors.); L 3 to L 8 , KRS-5 lenses; A1 and A2, adjustable circular apertures; W1 to W6, KBr windows;W 7 , Plexiglas window; CH, tuning-fork chopper; S and S2, entrance and exit slits of the 2-m focal length Czerny-Turner vacuum spectrometer;G, echelle grating; BS, wedge-shaped ZnSe window; C to C 4 , absorption cells.; D and D 2, mercury-cadmium-telluride detectors (refer to text
for other details).
1 May 1979 / Vol. 18, No. 9 APPLIED OPTICS 1351
9
AVERAGEFRINGE SEPARATIONAt-0. 016548cm-
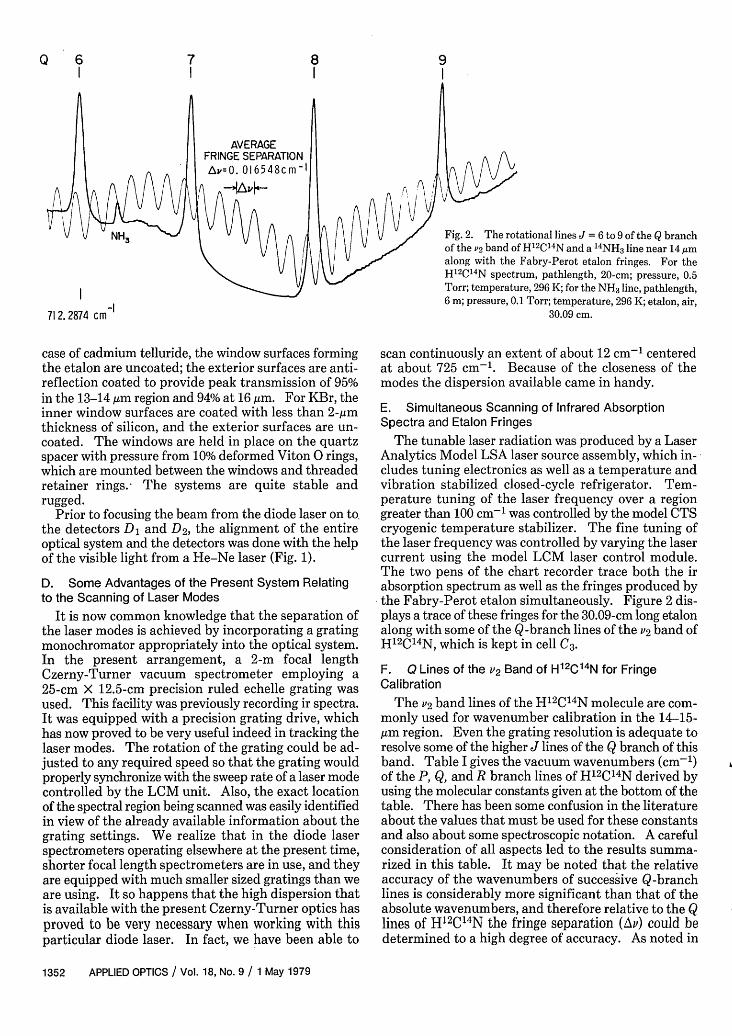
Fig. 2. The rotational lines J = 6 to 9 of the Q branchof the V2 band of H12C14N and a 14NH 3 line near 14,umalong with the Fabry-Perot etalon fringes. For theH12 C1 4N spectrum, pathlength, 20-cm; pressure, 0.5Torr; temperature, 296 K; for the NH 3 line, pathlength,6 m; pressure, 0.1 Torr; temperature, 296 K; etalon, air,
30.09 cm.
case of cadmium telluride, the window surfaces formingthe etalon are uncoated; the exterior surfaces are anti-reflection coated to provide peak transmission of 95%in the 13-14 gm region and 94% at 16 gim. For KBr, theinner window surfaces are coated with less than 2-gmthickness of silicon, and the exterior surfaces are un-coated. The windows are held in place on the quartzspacer with pressure from 10% deformed Viton 0 rings,which are mounted between the windows and threadedretainer rings.- The systems are quite stable andrugged.
Prior to focusing the beam from the diode laser on to.the detectors D1 and D2, the alignment of the entireoptical system and the detectors was done with the helpof the visible light from a He-Ne laser (Fig. 1).
D. Some Advantages of the Present System Relatingto the Scanning of Laser Modes
It is now common knowledge that the separation ofthe laser modes is achieved by incorporating a gratingmonochromator appropriately into the optical system.In the present arrangement, a 2-m focal lengthCzerny-Turner vacuum spectrometer employing a25-cm X 12.5-cm precision ruled echelle grating wasused. This facility was previously recording ir spectra.It was equipped with a precision grating drive, whichhas now proved to be very useful indeed in tracking thelaser modes. The rotation of the grating could be ad-justed to any required speed so that the grating wouldproperly synchronize with the sweep rate of a laser modecontrolled by the LCM unit. Also, the exact locationof the spectral region being scanned was easily identifiedin view of the already available information about thegrating settings. We realize that in the diode laserspectrometers operating elsewhere at the present time,shorter focal length spectrometers are in use, and theyare equipped with much smaller sized gratings than weare using. It so happens that the high dispersion thatis available with the present Czerny-Turner optics hasproved to be very necessary when working with thisparticular diode laser. In fact, we have been able to
scan continuously an extent of about 12 cm-' centeredat about 725 cm-'. Because of the closeness of themodes the dispersion available came in handy.
E. Simultaneous Scanning of Infrared AbsorptionSpectra and Etalon Fringes
The tunable laser radiation was produced by a LaserAnalytics Model LSA laser source assembly, which in-,cludes tuning electronics as well as a temperature andvibration stabilized closed-cycle refrigerator. Tem-perature tuning of the laser frequency over a regiongreater than 100 cm-l was controlled by the model CTScryogenic temperature stabilizer. The fine tuning ofthe laser frequency was controlled by varying the lasercurrent using the model LCM laser control module.The two pens of the chart recorder trace both the irabsorption spectrum as well as the fringes produced bythe Fabry-Perot etalon simultaneously. Figure 2 dis-plays a trace of these fringes for the 30.09-cm long etalonalong with some of the Q-branch lines of the V2 band ofH12 C14 N, which is kept in cell C 3.
F. Q Lines of the v2 Band of H1 2C14 N for FringeCalibration
The v2 band lines of the H12C1 4N molecule are com-monly used for wavenumber calibration in the 14-15-gim region. Even the grating resolution is adequate toresolve some of the higher J lines of the Q branch of thisband. Table I gives the vacuum wavenumbers (cm-')of the P, Q, and R branch lines of H12C14N derived byusing the molecular constants given at the bottom of thetable. There has been some confusion in the literatureabout the values that must be used for these constantsand also about some spectroscopic notation. A carefulconsideration of all aspects led to the results summa-rized in this table. It may be noted that the relativeaccuracy of the wavenumbers of successive Q-branchlines is considerably more significant than that of theabsolute wavenumbers, and therefore relative to the Qlines of H12C' 4N the fringe separation (Av) could bedetermined to a high degree of accuracy. As noted in
1352 APPLIED OPTICS / Vol. 18, No. 9 / 1 May 1979
7Q 6 8
712.2874 cm
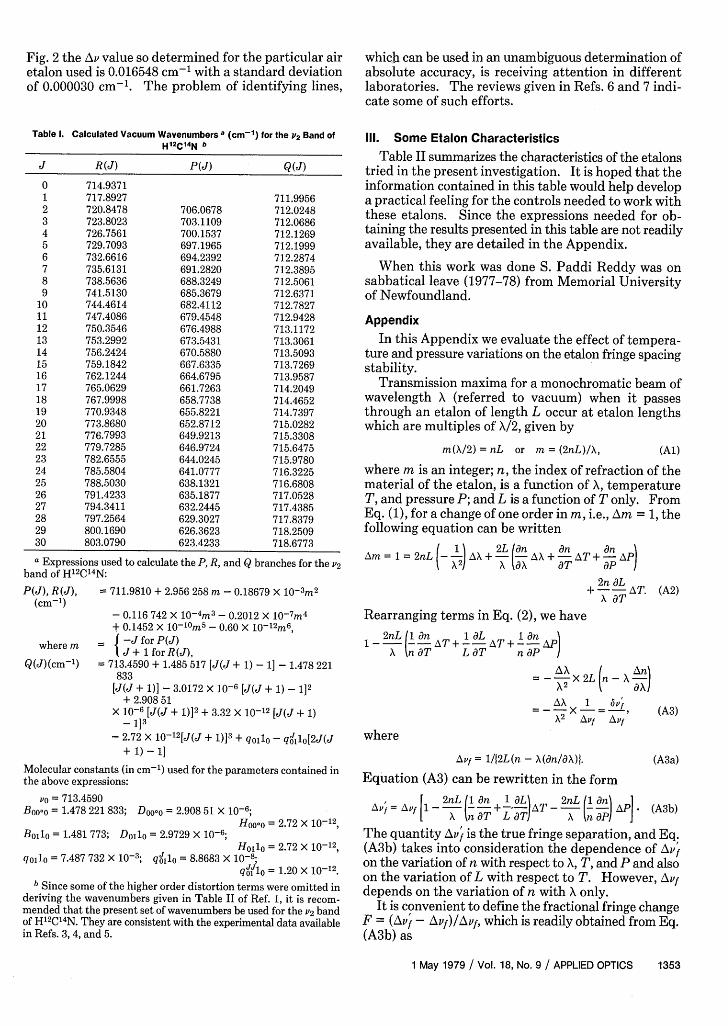
Fig. 2 the Ai, value so determined for the particular airetalon used is 0.016548 cm- 1 with a standard deviationof 0.000030 cm- 1 . The problem of identifying lines,
Table 1. Calculated Vacuum Wavenumbers a (cm-1 ) for the 2 Band ofH12C14N b
J R(J) P(J) Q(J)0 714.93711 717.8927 711.99562 720.8478 706.0678 712.02483 723.8023 703.1109 712.06864 726.7561 700.1537 712.12695 729.7093 697.1965 712.19996 732.6616 694.2392 712.28747 735.6131 691.2820 712.38958 738.5636 688.3249 712.50619 741.5130 685.3679 712.6371
10 744.4614 682.4112 712.782711 747.4086 679.4548 712.942812 750.3546 676.4988 713.117213 753.2992 673.5431 713.306114 756.2424 670.5880 713.509315 759.1842 667.6335 713.726916 762.1244 664.6795 713.958717 765.0629 661.7263 714.204918 767.9998 658.7738 714.465219 770.9348 655.8221 714.739720 773.8680 652.8712 715.028221 776.7993 649.9213 715.330822 779.7285 646.9724 715.647523 782.6555 644.0245 715.978024 785.5804 641.0777 716.322525 788.5030 638.1321 716.680826 791.4233 635.1877 717.052827 794.3411 632.2445 717.438528 797.2564 629.3027 717.837929 800.1690 626.3623 718.250930 803.0790 623.4233 718.6773
a Expressions used to calculate the P, R, and Q branches for the v2band of H12C 4 N:
P(J), R(J), 711.9810 + 2.956 258 m - 0.18679 X 10- 3m
2
(cm-')- 0.116 742 X 10-
4m3 - 0.2012 X 10- 7
m4
+ 0.1452 X o-1m 5- 0.60 X 0-12m6,
where m -J for P(J)J + for R(J),Q(J)(cm-1) 713.4590 + 1.485 517 [J(J + 1) - 1] - 1.478 221
833[J(J + 1)] - 3.0172 X 10⁻⁶ [J(J + 1) - 1]2
+ 2.908 51X 10-6 [J( + 1)]2 + 3.32 X 10⁻¹² [J(J + 1)
- 113
- 2.72 X 10⁻¹² [J(J + 1)]3 + qlo - q 110[2J(J+ 1) - 1]
Molecular constants (in cm-') used for the parameters contained inthe above expressions:
V = 713.4590Boo- = 1.478 221 833; Dooo = 2.908 51 X 10-6;
Hoo-o = 2.72 X 10⁻¹²,
B = 1.481 773; Do1lo = 2.9729 X 10⁻⁶;Hollo = 2.72 X 10⁻¹²,
qo1o = 7.487 732 X 10-3; qo = 8.8683 X 0-8;qj'j1 = 1.20 X 10⁻¹².
b Since some of the higher order distortion terms were omitted inderiving the wavenumbers given in Table II of Ref. 1, it is recom-mended that the present set of wavenumbers be used for the 2 bandof H12 C14N. They are consistent with the experimental data availablein Refs. 3, 4, and 5.
which can be used in an unambiguous determination ofabsolute accuracy, is receiving attention in differentlaboratories. The reviews given in Refs. 6 and 7 indi-cate some of such efforts.
111. Some Etalon Characteristics
Table II summarizes the characteristics of the etalonstried in the present investigation. It is hoped that theinformation contained in this table would help developa practical feeling for the controls needed to work withthese etalons. Since the expressions needed for ob-taining the results presented in this table are not readilyavailable, they are detailed in the Appendix.
When this work was done S. Paddi Reddy was onsabbatical leave (1977-78) from Memorial Universityof Newfoundland.
Appendix
In this Appendix we evaluate the effect of tempera-ture and pressure variations on the etalon fringe spacingstability.
Transmission maxima for a monochromatic beam ofwavelength X (referred to vacuum) when it passesthrough an etalon of length L occur at etalon lengthswhich are multiples of X/2, given by
m(/2) = nL or m = (2nL)/X, (Al)
where m is an integer; n, the index of refraction of thematerial of the etalon, is a function of X, temperatureT, and pressure P; and L is a function of T only. FromEq. (1), for a change of one order in m, i.e., Am = 1, thefollowing equation can be written
Am = = 2nL X2(1 A +-(n On On +- \ APA2X + T +P
2n O9L+--AT.X T
Rearranging terms in Eq. (2), we have
1 2nL (ian T+1O(L T+I n 1--I --A\T+--A\T+ --APX n9T LOT nOP I
=-XX2L n-X An
AX 1 bv'
X2 Avf Avf
where
Avf = 1/2L(n - X(an/aX)J.
Equation (A3) can be rewritten in the form[ 2nL 11 dn 1 iTl 9nT /1 n.11
(A2)
(A3)
(A3a)
f = [X nT L X X AnOPI j
The quantity Avf is the true fringe separation, and Eq.(A3b) takes into consideration the dependence of Avton the variation of n with respect to X, T, and P and alsoon the variation of L with respect to T. However, Avfdepends on the variation of n with X only.
It is convenient to define the fractional fringe changeF = (Avf - Avf)/Af, which is readily obtained from Eq.(A3b) as
1 May 1979 / Vol. 18, No. 9 / APPLIED OPTICS 1353
Table 11. Etalon Characteristics at 230C and 1 atm
No. of fringes CalculatedFringe spacing dynamic rate Length fringe separation
Material static rate fringes/C or Torr (cm) (cm-1)
Ge, solid (OAvf)/OT = -5.1 X 10⁻⁶ cm-l/oCa OF/OT = -21/X(Am)c 2.54 0.0491eAir, quartz (OAvf)/OT = 2.4 X 10⁻⁸ cm-l/oCa OF/OT = 0.096/X(,4m)c 10 0.049987f
(OAv1)/OP = -1.7 X 10⁻⁸ cm-l/Torrb OF/OP = -0.07/X (,4m)d 10 0.049987f
Ge: = 5.7 X 10⁻⁶ /0 C (Ref. 9), Air: n = 1.00026523 (Ref. 10), Quartz: = 4.2 X 10- 6/OC (Ref. 9).
n = 4.0016145 (Ref. 11), -X[(On)/(aX)] = 2.9888 X 10⁻⁸ (Ref. 10),-X[(On)/(OX)] = 6.98398 X 10⁻³ (Ref. 11), On/OT = -8.98 X 10- 6 /0 C (Ref. 10),
On/dT = 3.9 X 10- 4 /°C. On/OP = 3.49 X 10- 7 /Torr (Ref. 10).
a Calculated by using Ec. (A5a).b Calculated by using Eq. (A5b).c Calculated by using Eq. (A6a).d Calculated by using Eq. (A6b).e Wavelength dependent, value is for 10 m.f Nearly wavelength independent from 3,um to 20 m. We measured 0.016548 + 0.000030 cm- 1 for a 30.09-cm etalon and 0.029851 d 0.000034
cm-1 for a 16.67-cm etalon at 712 cm-1 , which correspond to 0.04973 cm-1 and 0.049762 cm-1 , respectively, when normalized to a 10-cm airpath.
-2nL 1 On 1 L 2nL 1 n -F -_+-- - AT-- -- AP. (A4)X nOT LTI X nP
Changes in the fringe spacings owing to changes intemperature and pressure can be obtained by differ-entiating Eq. (A3a) with respect to T and P, respec-tively. These are
[ 1 L 1 (On]
0T IvJ = AVf L T n (cm-'/C), (A5a)
-1 (Onii
a(Av 1 ) =p Av - X On' kOP) (cm'l/Torr). (AWb
OP[( OX) ]As L does not change with P, the aL/OP term does notoccur in Eq. (A5b). Similarly, variations in fractionalfringe changes on account of changes in T and P areobtained by differentiating Eq. (A4) with respect to Tand P, respectively (neglecting small higher orderterms), as
OF -2nL (i dn 1lOL\F A n- + L -I (fringes/aC), (A6a)
OT X nT L n
OF - 2nL dn (fringes/Torr). (A6b)
The quantities on the left sides of Eqs. (A5a)-(A6b)were numerically estimated for a 2.54-cm long germa-nium etalon and a 10-cm long air etalon at X = 10 ,gm,and the details of the calculations are given below. Thecoefficients of linear expansion for germanium andquartz were taken from the American Institute ofPhysics Handbook.8 The index of refraction of air and
its variations with temperature and pressure were ob-tained from Edl6n.9 Similarly, the index of refractionof germanium was calculated from the relation given byHerzberger and Salzberg,10 and its temperature coef-ficient was taken from Edwin, et al. 11 The results ofthese calculations are presented in Table II. A com-parison of the values of (Avf/(OT) and (F)/(dT) forgermanium and air etalons indicates that the air etalonis more stable than the germanium etalon by 2 ordersof magnitude, when one considers the environmentaleffects on the stability of an air etalon compared withthe germanium etalon.
References1. See, for example, J. S. Knoll, G. L. Tettemer, W. G. Planet, K.
Narahari Rao, Da-Wun Chen, and L. A. Pugh, Appl. Opt. 15,2973(1976).
2. K. Narahari Rao, in Molecular Spectroscopy: Modern Research,K. Narahari Rao and C. W. Mathews, Eds. (Academic, New York,1972), Chap. 7.3.
3. P. K. L. Yin and K. Narahari Rao, J. Mol. Spectrosc. 42, 385(1972).
4. A. G. Maki, J. Mol. Spectrosc. 58, 308 (1975).5. A. G. Maki, J. Phys. Chem. Ref. Data 3, 221 (1974).6. K. Narahari Rao, C. J. Humphreys, and D. H. Rank, Wavelength
Standards in the Infrared (Academic, New York, 1966).7. K. Narahari Rao, in Physical Chemistry Series Two, Vol. 3
Spectroscopy, D. A. Ramsay, Ed. (Butterworths, Boston, 1976),Chap. 8.
8. D. E. Gray, Ed., American Institute of Physics Handbook,(McGraw-Hill, New York, 1972).
9. B. Edlen, Metrologia 2, 71 (1966).10. M. Herzberger and C. D. Salzberg, J. Opt. Soc. Am. 52, 420
(1962).11. R. P. Edwin, M. T. Dudermel, and M. Lamare, Appl. Opt. 17,1066
(1978).
1354 APPLIED OPTICS / Vol. 18, No. 9 / 1 May 1979


![OPEN ACCESS Indonesian Journal of Human Nutritionrepository.unika.ac.id/17823/1/97-139-4-PB.pdf · zat antigizi HCN (asam sianida) yang berbahaya bagi kesehatan [7]. Perebusan daun](https://static.fdocument.org/doc/165x107/607cd7e29e2c346d3437b594/open-access-indonesian-journal-of-human-zat-antigizi-hcn-asam-sianida-yang-berbahaya.jpg)