Title Formation of Metastable δ-Form of 6Bi₂O₃・Sio₂...
11
Title Formation of Metastable δ-Form of 6Bi₂O₃・Sio₂ Crystal from Its Melt Author(s) Ito, Setsuro; Kokubo, Tadashi; Tashiro, Megumi Citation Bulletin of the Institute for Chemical Research, Kyoto University (1978), 55(5): 447-456 Issue Date 1978-01-17 URL http://hdl.handle.net/2433/76749 Right Type Departmental Bulletin Paper Textversion publisher Kyoto University
Transcript of Title Formation of Metastable δ-Form of 6Bi₂O₃・Sio₂...
Title Formation of Metastable δ-Form of 6Bi₂O₃・Sio₂Crystal from Its Melt
Author(s) Ito, Setsuro; Kokubo, Tadashi; Tashiro, Megumi
Citation Bulletin of the Institute for Chemical Research, KyotoUniversity (1978), 55(5): 447-456
Issue Date 1978-01-17
URL http://hdl.handle.net/2433/76749
Right
Type Departmental Bulletin Paper
Textversion publisher
Kyoto University
Bull. Inst. Chem. Res., Kyoto Univ., Vol. 55, No. 5, 1977
Formation of Metastable 8-Form of 6Bi2O3 • Si02
Crystal from Its Melt
Setsuro ITO, Tadashi KOKUBO, and Megumi TASHIRO
Received October 4, 1977
Levin at al. reported that the y-form of 6Bi203•Si02 has an equilibrium melting temperature of 900°C, being most stable at least down to 600°C. The present authors, however, have found that
the 7-form never precipitates from a thoroughly homogenized melt of the same composition even when the melt is cooled slowly, e.g. at a rate as low as 0.2°C/min: The melt is supercooled down to 740°C,
where a metastable 8-form of 6Bi20s• Si02 precipitates in the supercooled melt in place of the y-form. The high energy barrier for formation of the y-form as well as the low energy barrier for formation
of the 8-form were explained in terms of similarity in microstructure of the y- and 3-form with their melt: The 8-form has a more open, defective and symmetric structure which is similar to that of the melt than that of the y-form. Stability relationships of the y- and 8-form with their melt were determined
detail.
I. INTRODUCTION
The y-form of 6Bi2Oa•SiO2 (mole ratio) crystal shows a high photoconductivity and
strong electro-optic effect.1,2) It can be fabricated by the pulling technique3) from its melt using a y-crystal as a seed.
According to the phase diagram of the Bi2O3-SiO2 system determined by Levin et a1.4)
(Fig. 1), the y-form of 6Bi2Oa•Si02 crystal has its melting temperature at 900°C and is most stable from 900° to at least 600°C. It belongs to a space group I23.5)
G. Gattow and H. Schroders> found that when a 6Bi2Os•SiO2 melt was quenched without using a y-crystal as a seed, the cubic 8-form of 6Bi2Oa•Si02 crystal (space group Fm3m) formed from its melt in place of the y-form. Their result suggests that the 8-form is the metastable form, into which the melt can transform much easier than the y-form. The present authors have found recently that the transformation of the 6Bi2Oa•Si02 melt into the 8-form occurs not only by quenching but also by slow cooling at a rate as low as 0.2°C/min., if the y-crystals were not present in the melt before cooling.
The purpose of the present study is to find out exact conditions for formation of the
y- and 8-form from the melt of the composition 6Bi2Os•SiO2. For this purpose, stability relationship among the y-, 8-form of 6Bi2O3•Si02 and their melt has been investigated.
II. EXPERIMENTAL PROCEDURE AND RESULTS
1. Conditions for Formation of 8- and r-Crystals from Their Melt
1. 1. Formation of 8-Crystal from a Thoroughly Homogenized Melt
About 150 g of the batch mixture of the composition, 6Bi2O3•Si02 (mole ratio), was
* 9(i, IJ\A4* : Laboratory of Ceramic Chemistry, Institute for Chemical Research, Kyoto University, Uji, Kyoto.
( 447 )
S. hro, T. KOKUBO, and M. TASHIRO
—900 900
LIQUID + I
5BI203 cc
r
w
700 0(131203 +
6BI203•SIO2
600 8 16 24 BI203 MOL % —>S102
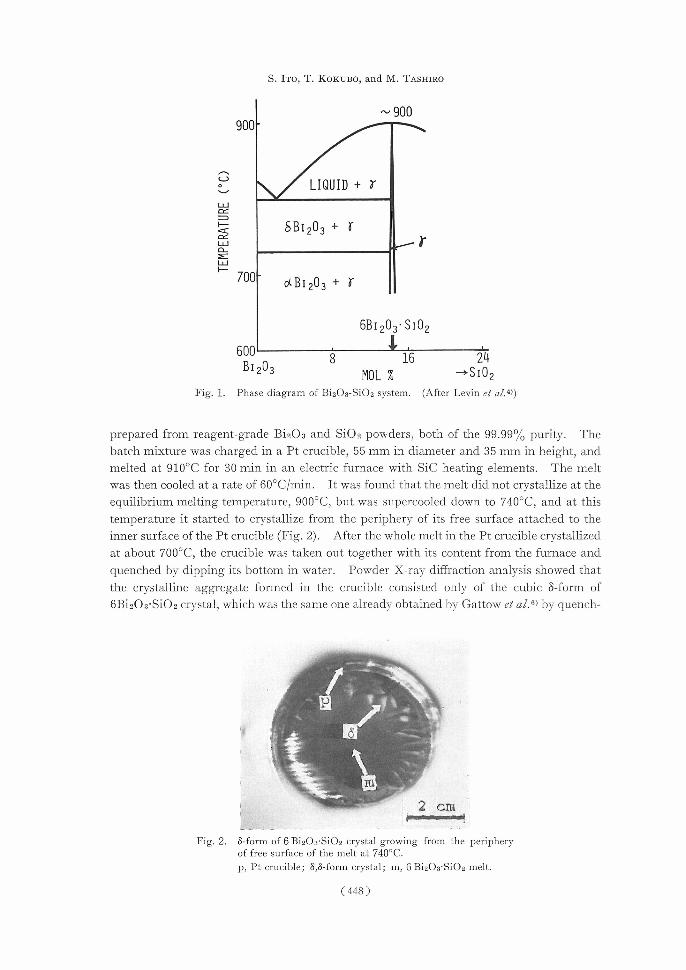
Fig. 1. Phase diagram of Bi203-SiO2 system. (After Levin et al.4))
prepared from reagent-grade Bi203 and Si02 powders, both of the 99.99% purity. The batch mixture was charged in a Pt crucible, 55 mm in diameter and 35 mm in height, and melted at 910°C for 30 min in an electric furnace with SiC heating elements. The melt was then cooled at a rate of 60°C/min. It was found that the melt did not crystallize at the equilibrium melting temperature, 900°C, but was supercooled down to 740°C, and at this temperature it started to crystallize from the periphery of its free surface attached to the inner surface of the Pt crucible (Fig. 2). After the whole melt in the Pt crucible crystallized at about 700°C, the crucible was taken out together with its content from the furnace and
quenched by dipping its bottom in water. Powder X-ray diffraction analysis showed that the crystalline aggregate formed in the crucible consisted only of the cubic 8-form of 613i203.SiO2 crystal, which was the same one already obtained by Gattow et al.6) by quench-
--
411. * V IN cS
•
411/46
2 Mm
Fig. 2. 8-form of 6 Bi203-Si02 crystal growing from the periphery of free surface of the melt at 740°C.
p, Pt crucible; 8,8-form crystal; m, 6 Bi203.SiO2 melt.
(448 )
Formation of Metastable 6Bi2O3•SiOz Crystal
ing the 6Bi2Oa•SiOs melt: Its X-ray diffraction pattern consisted only of the sharp peaks characteristic of the 8-form; no broad peaks indicating the presence of glassy phase was observed. Experiments similar to the one described above were performed, varying the melting temperature of the batch from 910° to 1000°C, the melting time from 5 to 600 min., and the cooling rate from 150° to 0.2°C/min. In some cases, SiOs crucibles were used in place of the Pt crucibles for melting the batch. In all cases, the same results as described above were obtained; i.g., the 8-form always formed from the supercooled melt at about 740°C but not the y-form.
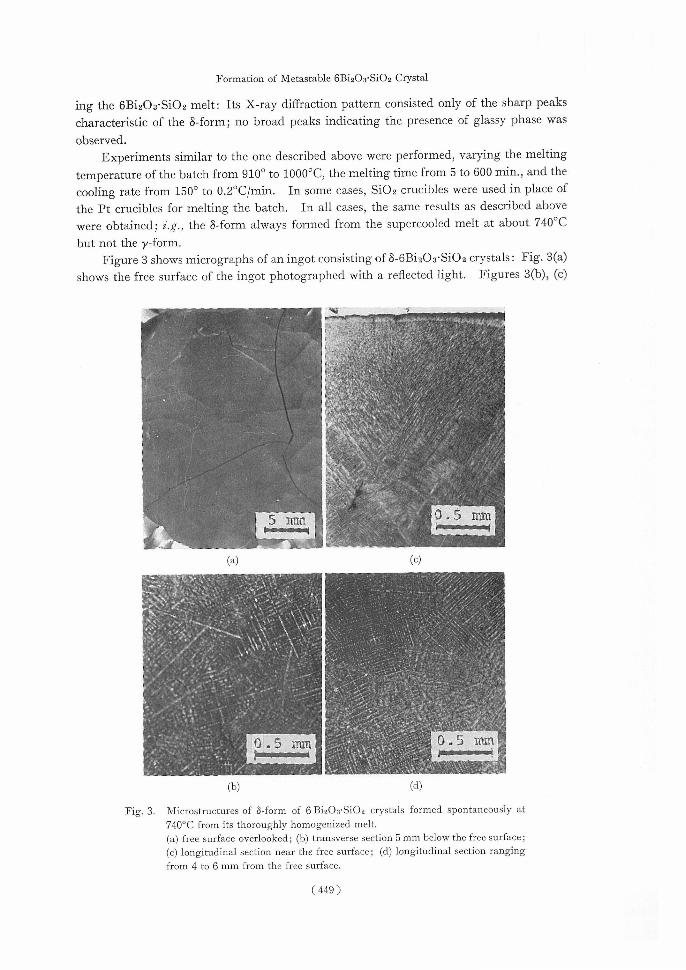
Figure 3 shows micrographs of an ingot consisting of 8-6BisO3•SiOs crystals: Fig. 3(a) shows the free surface of the ingot photographed with a reflected light. Figures 3(b), (c)
•
JA'~
, + h
Ckc_rC ~\•• •,
•
•
0.5 mm
1µ i
Ay e
(a)(c)
r
f."41..1'0.1:-.:: a t r.
•
•
M .-0 .
(b)(d)
Fig. 3. Microstructures of 8-form of 6 BisOa•SiOs crystals formed spontaneously at 740°C from its thoroughly homogenized melt.
(a) free surface overlooked; (b) transverse section 5mm below the free surface; (c) longitudinal section near the free surface; (d) longitudinal section ranging from 4 to 6 mm from the free surface.
(449)
S. ITO, T. KOKUBO, and M. TASHIRO
and (d) show microstructures of longitudinal and transverse sections of the ingot, all 0.1 mm thick, photographed with a transmitted light. These photographs indicate clearly that the crystals (8-form) grow dendritically not only from the free surface of the melt but also from many spots, which are homogeneously distributed at about 0.5 mm intervals, inside of the melt. This suggests that the crystals grew not only from the free surface of the melt, but also from many nuclei formed homogeneously inside of the melt at a fairly high rate during cooling.
1. 2. Formation of r-Crystal from a Partially Molten Batch
About 150 g of the same batch as described in 1.1 was packed in the Pt crucible and heated at 800°C, which was below the melting point of the y-form of 6Bi20a•Si02, for one hour. X-ray diffraction analysis showed that the batch transformed completely into an aggregate of the y-form of 6Bi203.Si02 crystals. The Pt crucible containing the aggregate of the y-crystals were then transferred into an electric furnace with a vertical temperature
gradient. Temperatures in the furnace were controlled, so that the temperature at the surface of the crystalline aggregate was raised up to 930°C and that at its bottom to 885°C. By this procedure the upper two-third of the crystalline aggregate was melted whereas its
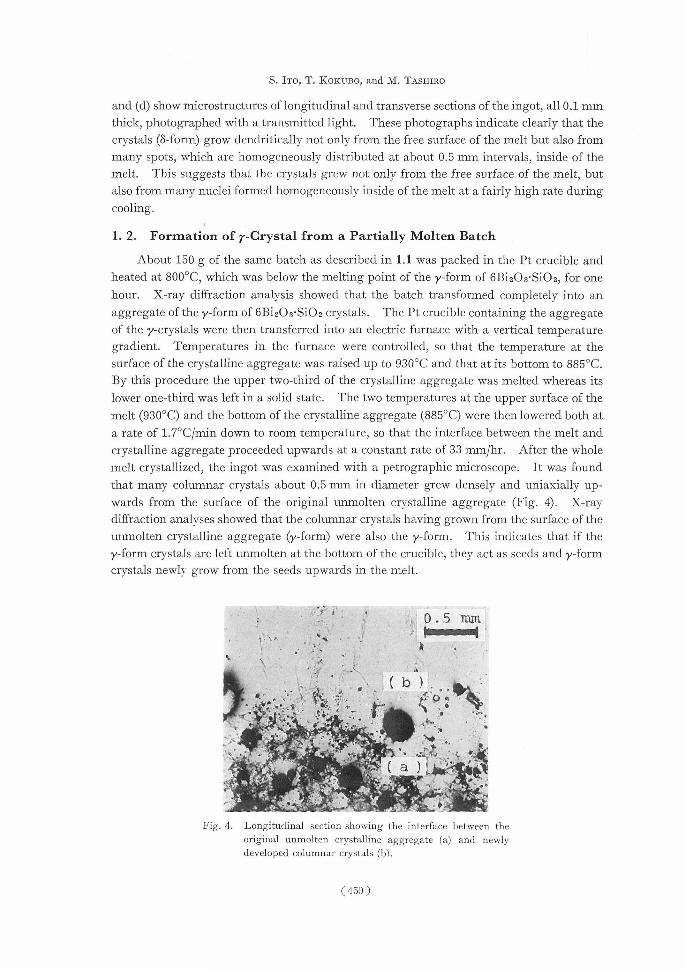
lower one-third was left in a solid state. The two temperatures at the upper surface of the melt (930°C) and the bottom of the crystalline aggregate (885°C) were then lowered both at a rate of 1.7°C/min down to room temperature, so that the interface between the melt and crystalline aggregate proceeded upwards at a constant rate of 33 mmJhr. After the whole melt crystallized, the ingot was examined with a petrographic microscope. It was found that many columnar crystals about 0.5 mm in diameter grew densely and uniaxially up-wards from the surface of the original unmolten crystalline aggregate (Fig. 4). X-ray diffraction analyses showed that the columnar crystals having grown from the surface of the unmolten crystalline aggregate (y-form) were also the y-foiin. This indicates that if the
y-form crystals are left unmolten at the bottom of the crucible, they act as seeds and y-form crystals newly grow from the seeds upwards in the melt.
0 5 ram
xi
0
iiii 'E
;i..,..r
Fig. 4. Longitudinal section showing the interface between the original unmolten crystalline aggregate (a) and newly
developed columnar crystals (b).
(450)
Formation of Metastable 6BisOs•SiOs Crystal
2. Stability of 8- and r-Crystals
The same batch mixture as described in 1.1 was compressed at 2000 kg/cm2 into disk form, 2 mm thick and 16 mm in diameter, heated at various temperatures in the range 350°
to 850°C for one hour in an electric furnace and then taken out from the furnace to be allow-ed to cool in air. The same heat-treatment as above was also given to fragments of the ingot consisting of 8-6Bi2Oa•SiOs crystals prepared by the method described in 1.1. Pow-der X-ray diffraction analyses showed that (1) the compressed batch mixture transformed into an aggregate of the y-form crystal particles when heated above 650°C, and (2) the ingot consisting of the 8-form crystal particles transformed also into an aggregate of the
y-form crystal particles when heated above 400°C.
3. Melting Temperatures of 8- and r-Crystals
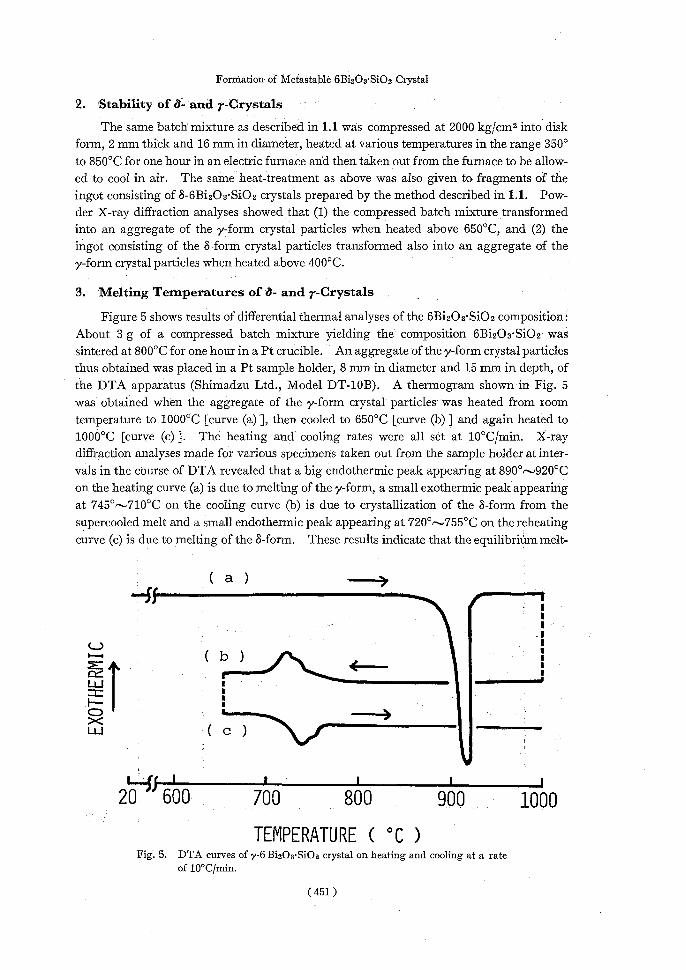
Figure 5 shows results of differential thermal analyses of the 6BisO3•SiOs composition: About 3 g of a compressed batch mixture yielding the composition 6BisO3•Si02 was sintered at 800°C for one hour in a Pt crucible. An aggregate of the y-form crystal particles thus obtained was placed in a Pt sample holder, 8 mm in diameter and 15 mm in depth, of the DTA apparatus (Shimadzu Ltd., Model DT-10B). A thermogram shown in Fig. 5 was obtained when the aggregate of the y-form crystal particles was heated from room temperature to 1000°C [curve (a) ], then cooled to 650°C [curve (b) ] and again heated to 1000°C [curve (c) ]. The heating and cooling rates were all set at 10°C/min. X-ray diffraction analyses made for various specimens taken out from the sample holder at inter-vals in the course of DTA revealed that a big endothermic peak appearing at 890°,920°C on the heating curve (a) is due to melting of the y-form, a small exothermic peak appearing at 745°,710°C on the cooling curve (b) is due to crystallization of the 8-form from the supercooled melt and a small endothermic peak appearing at 720°,755°C on the reheating curve (c) is due to melting of the 8-form. These results indicate that the equilibrium melt-
( a )
I II'; -=
CD—~
w (C )
20~5---------------------------------------------600 700 800 900 1000 TEMPERATURE ( °C )
Fig. 5. DTA curves of y-6 BisOs•SiOs crystal on heating and cooling at a rate of 10°Cimin.
(451)
S. Iro, T. KOKUBO, and M. TASHIRO
ing temperature of the 6Bi2Oa•SiOs composition is about 900°C and the melting tem-
perature of the metastable 8-form crystal is about 750°C, and furthermore the 8-form crystals once formed transform directly into its melt without transforming into the y-form when heated. Comparison of the area of the endothermic peak of the 8-crystal with that of the y-crystal suggests that the heat of fusion of the 8-crystal is about one-fifth of that of the
y-crystal.
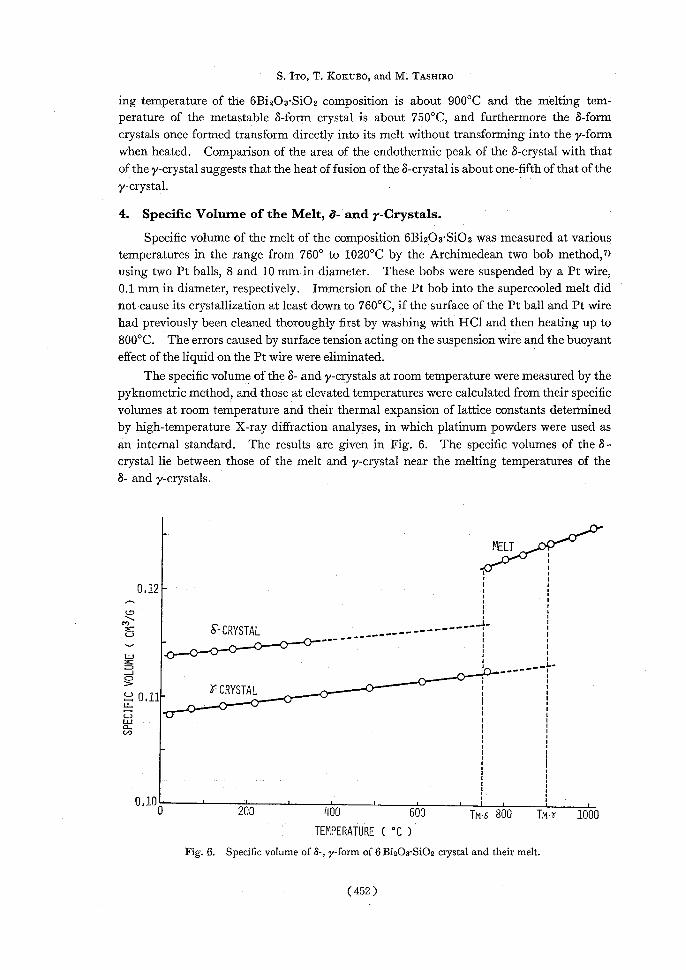
4. Specific Volume of the Melt, a- and T-Crystals.
Specific volume of the melt of the composition 6BisOa•SiOs was measured at various temperatures in the range from 760° to 1020°C by the Archimedean two bob method,7) using two Pt balls, 8 and 10 mm in diameter. These bobs were suspended by a Pt wire, 0.1 mm in diameter, respectively. Immersion of the Pt bob into the supercooled melt did not cause its crystallization at least down to 760°C, if the surface of the Pt ball and Pt wire had previously been cleaned thoroughly first by washing with HC1 and then heating up to 800°C. The errors caused by surface tension acting on the suspension wire and the buoyant effect of the liquid on the Pt wire were eliminated.
The specific volume of the 8- and y-crystals at room temperature were measured by the
pyknometric method, and those at elevated temperatures were calculated from their specific volumes at room temperature and their thermal expansion of lattice constants determined by high-temperature X-ray diffraction analyses, in which platinum powders were used as an internal standard. The results are given in Fig. 6. The specific volumes of the 8— crystal lie between those of the melt and y-crystal near the melting temperatures of the 8- and y-crystals.
MELT
0,12 -
--1- S.-CRYSTAL
w1~ J--
0,11- i'CRYSTAL ITC
0.10-------------------------------------------------------------------------------------------------- 0 200400600 TM•5 800 TM•a- 1000
TEMPERATURE ( °C )
Fig. 6. Specific volume of 8-, y-form of 6 Bi2Oa•SiO2 crystal and their melt.
( 452 )
Formation of Metastable 6Bi2Os•SiO2 Crystal
0(-B1203
w d 6B203•S102 )(Aid 6-6Bi203. S102
I ,1t1
1400 1200 1000 800 600 400 200
WAVE NUMBER ( CM-I)
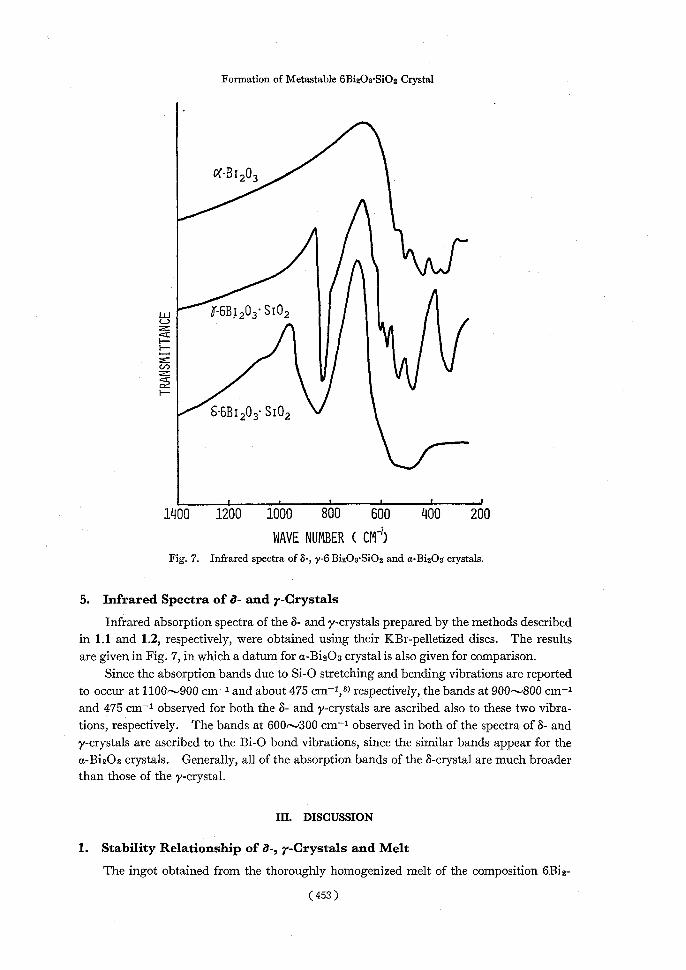
Fig. 7. Infrared spectra of 8-, y-6 Bi203-SiOa and a-BizOs crystals.
5. Infrared Spectra of d- and r-Crystals
Infrared absorption spectra of the 8- and y-crystals prepared by the methods described
in 1.1 and 1.2, respectively, were obtained using their KBr-pelletized discs. The results
are given in Fig. 7, in which a datum for a-Bi203 crystal is also given for comparison.
Since the absorption bands due to Si-0 stretching and bending vibrations are reported
to occur at 1100,900 cm-1 and about 475 cm-1,8) respectively, the bands at 900,800 cm-1
and 475 cm-1 observed for both the 8- and y-crystals are ascribed also to these two vibra-
tions, respectively. The bands at 600,300 cm-1 observed in both of the spectra of 8- and
y-crystals are ascribed to the Bi-O bond vibrations, since the similar bands appear for the a-BisOn crystals. Generally, all of the absorption bands of the 8-crystal are much broader than those of the y-crystal.
III. DISCUSSION
1. Stability Relationship of 8-, r-Crystals and Melt
The ingot obtained from the thoroughly homogenized melt of the composition 6Bi2-
(453 )
S. ITO, T. Koxuso, and M. TASHIRO
>- 1 CD
w zi w
_1 w LLI
E- CRYSTAL LI-
a-CRYSTAL
MELT
750 900
Ta Ta
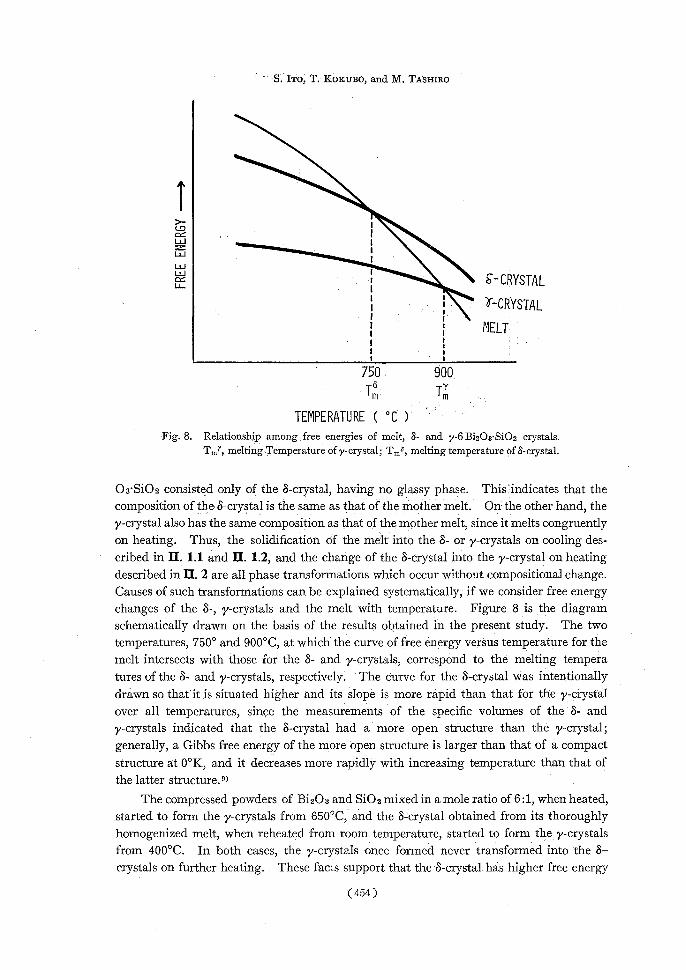
TEMPERATURE ( °C ) Fig. 8. Relationship among free energies of melt, 8- and y-6 BizOa'SiO2 crystals.
Tmr, melting Temperature of y-crystal; Tmo, melting temperature of 8-crystal.
Oa'Si02 consisted only of the 8-crystal, having no glassy phase. This indicates that the composition of the &crystal is the same as that of the mother melt. On the other hand, the
y-crystal also has the same composition as that of the mother melt, since it melts congruently on heating. Thus, the solidification of the melt into the 8- or y-crystals on cooling des-
cribed in IL 1.1 and II. 1.2, and the change of the 8-crystal into the y-crystal on heating described in IL 2 are all phase transformations which occur without compositional change. Causes of such transformations can be explained systematically, if we consider free energy changes of the 8-, y-crystals and the melt with temperature. Figure 8 is the diagram
schematically drawn on the basis of the results obtained in the present study. The two temperatures, 750° and 900°C, at which the curve of free energy versus temperature for the melt intersects with those for the 8- and y-crystals, correspond to the melting tempera
tures of the 8- and y-crystals, respectively. ' The curve for the 8-crystal was intentionally drawn so that it is situated higher and its slope is more rapid than that for the y-crystal
over all temperatures, since the measurements of the specific volumes of the 8- and
y-crystals indicated that the 8-crystal had a more open structure than the y-crystal; generally, a Gibbs free energy of the more open structure is larger than that of a compact structure at 0°K, and it decreases more rapidly with increasing temperature than that of
the latter structure.9)
The compressed powders of Bi203 and SiO2 mixed in a mole ratio of 6:1, when heated,
started to form the y-crystals from 650°C, and the 8-crystal obtained from its thoroughly
homogenized melt, when reheated from room temperature, started to form the y-crystals
from 400°C. In both cases, the y-crystals once formed never transformed into the 8—
crystals on further heating. These facs support that the 8-crystal has higher free energy
(454)
Formation of Metastable 6Bi2Os'SiOs Crystal
than the 7-crystal, being metastable over all temperatures. Using the diagram of Fig. 8, the formation of the 8- or y-crystals from the melt can be
explained as follows : When the melt is cooled to its equilibrium melting point, Tmr, the most stable 7-crystal may form. However, if the rate of nucleation of the y-crystal is low, the melt will continue to cool (supercooled), and at or below the melting temperature, Tma, the metastable 8-crystal could form. This is actually the case when the thoroughly homo-
genized melt was cooled; homogeneous nucleation of the y-crystal did not actually occur in the melt at or below Tmr, and the melt was supercooled down to Tma, where the formation of the metastable 8-crystal commenced. When the 7-crystals were left unmolten at the bottom of the melt (section II. 1.2), however, the undissolved 7-crystals acted as seeds and as a result the whole melt transformed directly into the 7-form at the equilibrium melting temperature, Tmr.
2. Energy Barriers for Formation of 8- and r-Crystals
Generally, the metastable phase is formed when the energy barrier for formation of the stable phase is much higher than that for formation of the metastable phase.'°) The energy barrier is low when the crystal is alike the mother melt in structure. The crystal with a-more open, defective and symmetric structure, therefore, would be formed from the melt much easier than the crystal with a compact, complete and asymmetric structure. The fact that the 8-form of 6Bi2Os•SiO2 has a more open structure than the y-form of 6Bi2O3•SiO2 has already been confirmed by the specific volume measurements of the
present study. According to the literatures, the 8-foim. has a defective structure in which oxygen vacancies are randomly distributed, and, furthermore, its structural unit is more symmetric than that of the y-form : The 8-form has a fluorite defect structure, in which each bithmuth atom is surrounded by eight or less oxygen atoms situated at the corner of a symmetrical cubic unit. 6) The y-form, however, has a structure of sillenite type, in which each bithmuth atom is surrounded asymmetrically by seven oxygen atoms: five oxygen atoms form an incomplete octahedron and two further oxygen atoms are more weakly bonded.5) The defective structure of the 8-form in which oxygen vacancies were reported to be randomly distributed was confirmed by the measurement of infrared absorption spectra of the 8-form in the present study; variations in bond distance and bond angle of bithmuth and oxygen atoms caused by the presence of oxygen vacancies are well represent-ed by the broad absorption bands of the 8-form. The fact that the metastable 8-form is formed more easily from the melt than the y-form is thus explained by an extraordinary similarity in structure between the 8-form and the melt and by a big difference in structure between the y-form and the melt.
ACKNOWLEDGMENT
Partial financial support of the Research Grant from the Ministry of Education, Japan
(Sogo Kenkyu A, # 135049, 1976) for our present research is gratefully acknowledged.
(455 )
S. ITO, T. KOKUBO, and M. TASHIRO
REFERENCES
(1) S. L. Hou and D. S. Oliver, Appl. Phys. Letters, 18, 325 (1971). (2) R. E. Aldrich, S. L. Hou, and M. L. Harvill, J. Appl. Phys., 42, 493 (1971). (3) J. C. Brice, T. M. Bruton, O. F. Hill, and P. A. C. Whiffin, J. Crystal Growth, 24/25, 429 (1971). (4) E. M. Levin and R. S. Roth, J. Research NBS., 68A, 197 (1964). (5) S. C. Abrahams, P. B. Jamieson, and J. L. Bernstein, J. Chem. Phys., 47, 4034 (1967). (6) G. Gattow and H. Schroder, Z. anorg. allg. Chem., 318, 197 (1962). (7) J. L. White in "Physicochemical Measurements at High Temperatures," J. O'M Bockris et al.
Ed., Butterworths, London, (1959), p. 193.
(8) P. Tarte in "Physics of Non-Crystalline Solids," J. A. Prince, Ed., North-Holland Publishing Co., Amsterdam, (1965), p. 549.
(9) V. Raghanan and M. Cohen in "Treatise on Solid State Chemistry," Vol. 5, N. B. Hannay, Ed., Plenum Press, New York, (1975), p. 71.
(10) W. D. Kingery et al, "Introduction to Ceramics," 2nd ed, John Wiley & Sons, New York, (1976), p. 314.
(456)