ThME3 - plantphysiol.org · 350 and 750 μmol.m-2.s-1 and RNA was extracted from full leaf. ......
5
Transcript of ThME3 - plantphysiol.org · 350 and 750 μmol.m-2.s-1 and RNA was extracted from full leaf. ......
GgGC1
GgGC2
GgGC3
GgME1
GgME2
GgME3
ThGC1
ThGC2
ThGC3
ThME1
ThME2
ThME3
GgG
C1
GgG
C2
GgG
C3
GgM
E1
GgM
E2
GgM
E3
ThG
C1
ThG
C2
ThG
C3
ThM
E1
ThM
E2
ThM
E3
0.6
0.7
0.8
SpearmanCorrelation
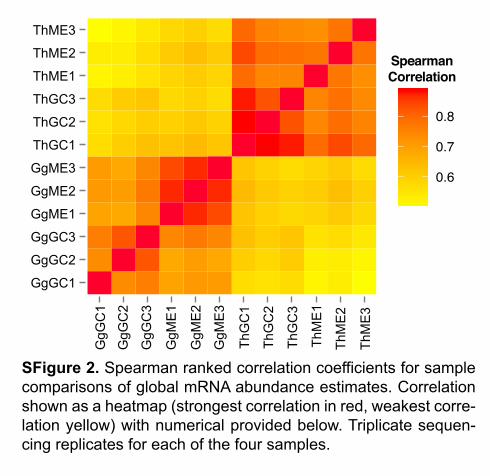
SFigure 2. Spearman ranked correlation coefficients for sample comparisons of global mRNA abundance estimates. Correlation shown as a heatmap (strongest correlation in red, weakest corre-lation yellow) with numerical provided below. Triplicate sequen-cing replicates for each of the four samples.
Irradiance (μmol m-2 s-1)
OST1
KAT1
SLAC1
HT1
0.60.91.21.5
0.04
0.08
0.12
0.16
0.050.100.150.20
0.00050.00100.0015
350 750
350 750
350 750
350 750
Rela
tive
expr
essi
on r
elat
ive
to a
ctin
7T. hassleriana
OST1
KAT1
SLAC1
HT1
0.040.080.120.16
0.010.020.030.04
0.020.030.040.050.06
0.020.030.04
350 750
350 750
350 750
350 750
G. gynandra
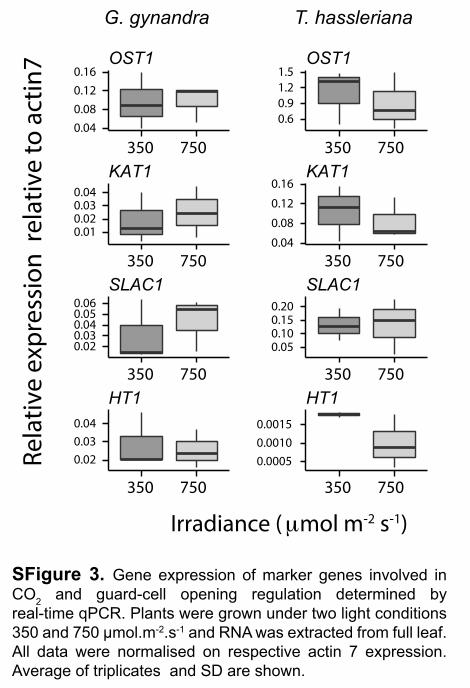
SFigure 3. Gene expression of marker genes involved in CO2 and guard-cell opening regulation determined by real-time qPCR. Plants were grown under two light conditions 350 and 750 μmol.m-2.s-1 and RNA was extracted from full leaf. All data were normalised on respective actin 7 expression. Average of triplicates and SD are shown.
AB140
CP22CP24
HCF136LHCB2LHCB3
LHCB4.1LHCB4.3
LHCB5LHCB7
LPA19LPA2
MSP−1OE23
OEC33OHP
PnsL1PnsL3PPD1PPD5PPD6PPL1PQL3
PS2_5kDa
PSB27PSB28
PsbP_like PsBP−like
PsbP−likePSBQPSBRPSBXPSBY
GgGC GgM ThGC ThM
APO4CAB4
CURT1BLHCA1LHCA2
LHCA2*1LHCA3Lhca5
PSAD−2PSAE−2
PSAFPSAG
PSAH−2PSAKPSALPSAO
FdGOGATGDC−H2GDC−H3GDC−L2GDC−P1
GDC−TGLYKGOX
HPR1SGAT
Photorespiration
Photosystem I
Photosystem II
G.g.C4
T.h.C3
0
2,000
4,000
6,000
8,000
Gene expression (TP
M)
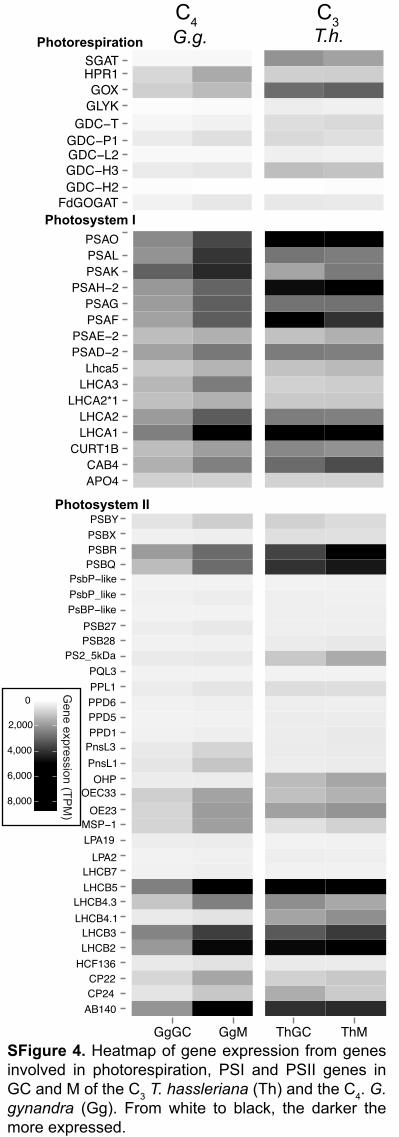
SFigure 4. Heatmap of gene expression from genes involved in photorespiration, PSI and PSII genes in GC and M of the C3 T. hassleriana (Th) and the C4. G. gynandra (Gg). From white to black, the darker the more expressed.
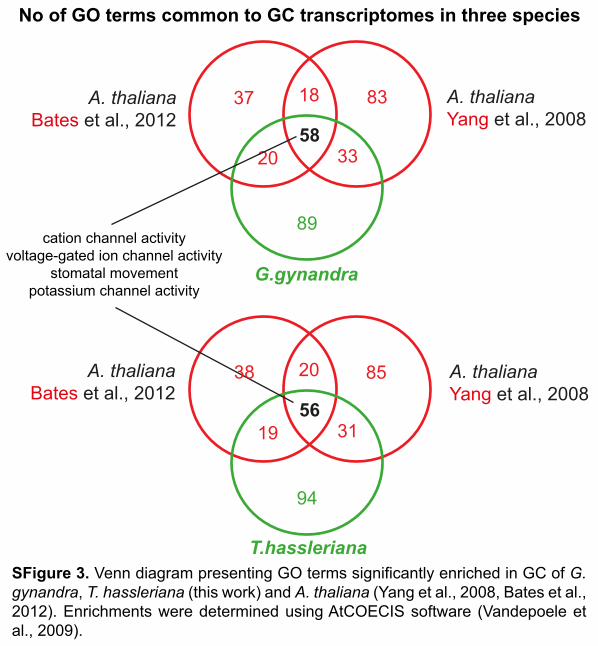
37
58
83A. thalianaBates et al., 2012
G.gynandra
A. thalianaYang et al., 2008
No of GO terms common to GC transcriptomes in three species
18
20 33
89
56
85A. thalianaBates et al., 2012
T.hassleriana
A. thalianaYang et al., 2008
20
19 31
94
cation channel activityvoltage-gated ion channel activity
stomatal movementpotassium channel activity
38
SFigure 3. Venn diagram presenting GO terms significantly enriched in GC of G. gynandra, T. hassleriana (this work) and A. thaliana (Yang et al., 2008, Bates et al., 2012). Enrichments were determined using AtCOECIS software (Vandepoele et al., 2009).