the transmission system - HRO CIGREhro-cigre.hr/downloads/SEERC_CD/papers/electric_power... ·...
34
ΑΝΕΞΑΡΤΗΤΟΣ ΔΙΑΧΕΙΡΙΣΤΗΣ ΜΕΤΑΦΟΡΑΣ ΗΛΕΚΤΡΙΚΗΣ ΕΝΕΡΓΕΙΑΣ ΔΙΕΥΘΥΝΣΗ ΣΧΕΔΙΑΣΜΟΥ ΑΝΑΠΤΥΞΗΣ ΣΥΣΤΗΜΑΤΟΣ Overview of the Greek power system Challenges and development plan for the transmission system Presentation for First SEERC Conference D . MICHOS IPTO – GREEK NC CIGRE
Transcript of the transmission system - HRO CIGREhro-cigre.hr/downloads/SEERC_CD/papers/electric_power... ·...
ΑΝΕΞΑΡΤΗΤΟΣ ΔΙΑΧΕΙΡΙΣΤΗΣ ΜΕΤΑΦΟΡΑΣ ΗΛΕΚΤΡΙΚΗΣ
ΕΝΕΡΓΕΙΑΣ
ΔΙΕΥΘΥΝΣΗ ΣΧΕΔΙΑΣΜΟΥ ΑΝΑΠΤΥΞΗΣ ΣΥΣΤΗΜΑΤΟΣ
Overview of the Greek power system
Challenges and development plan for
the transmission system
Presentation for First SEERC Conference
D. MICHOS
IPTO – GREEK NC CIGRE
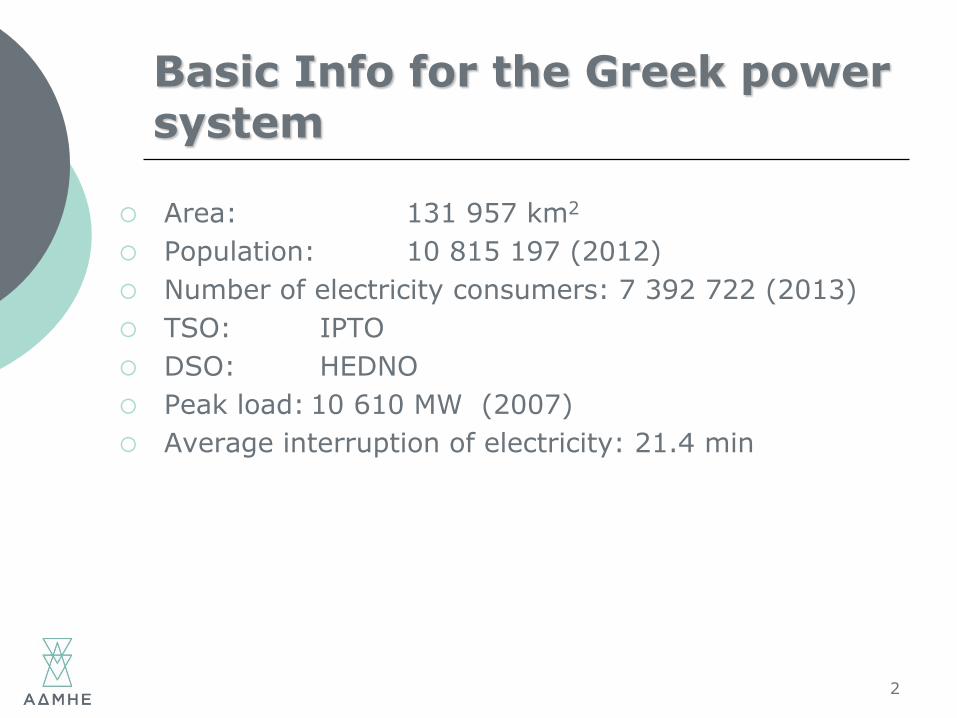
Area: 131 957 km2
Population: 10 815 197 (2012)
Number of electricity consumers: 7 392 722 (2013)
TSO: IPTO
DSO: HEDNO
Peak load: 10 610 MW (2007)
Average interruption of electricity: 21.4 min
2
Basic Info for the Greek power system
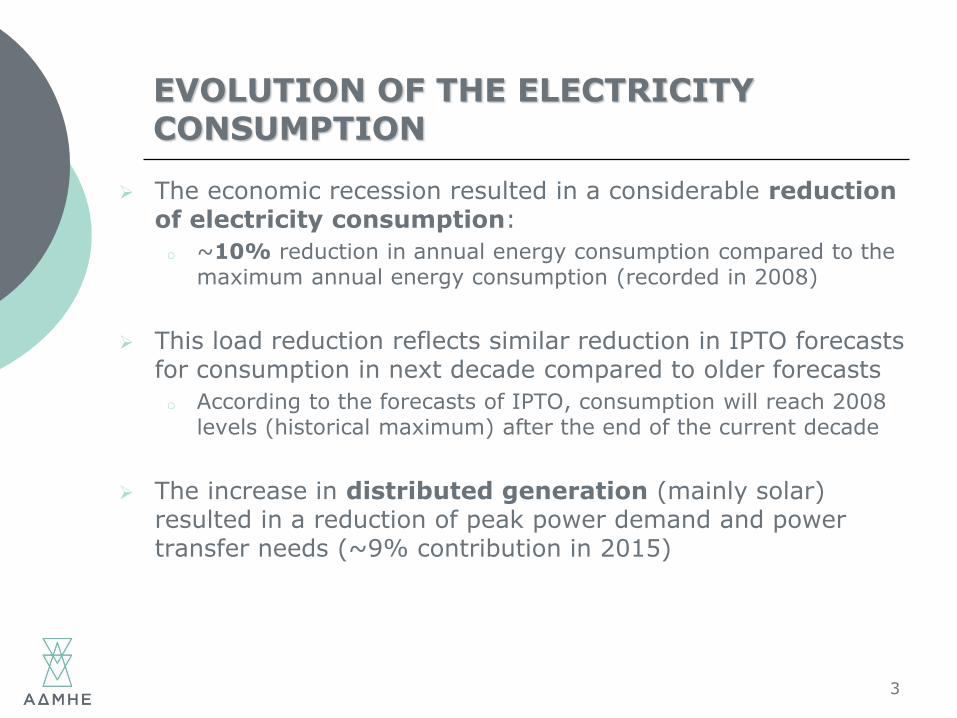
EVOLUTION OF THE ELECTRICITY CONSUMPTION
The economic recession resulted in a considerable reduction of electricity consumption:
o ~10% reduction in annual energy consumption compared to the maximum annual energy consumption (recorded in 2008)
This load reduction reflects similar reduction in IPTO forecasts for consumption in next decade compared to older forecasts
o According to the forecasts of IPTO, consumption will reach 2008 levels (historical maximum) after the end of the current decade
The increase in distributed generation (mainly solar) resulted in a reduction of peak power demand and power transfer needs (~9% contribution in 2015)
3
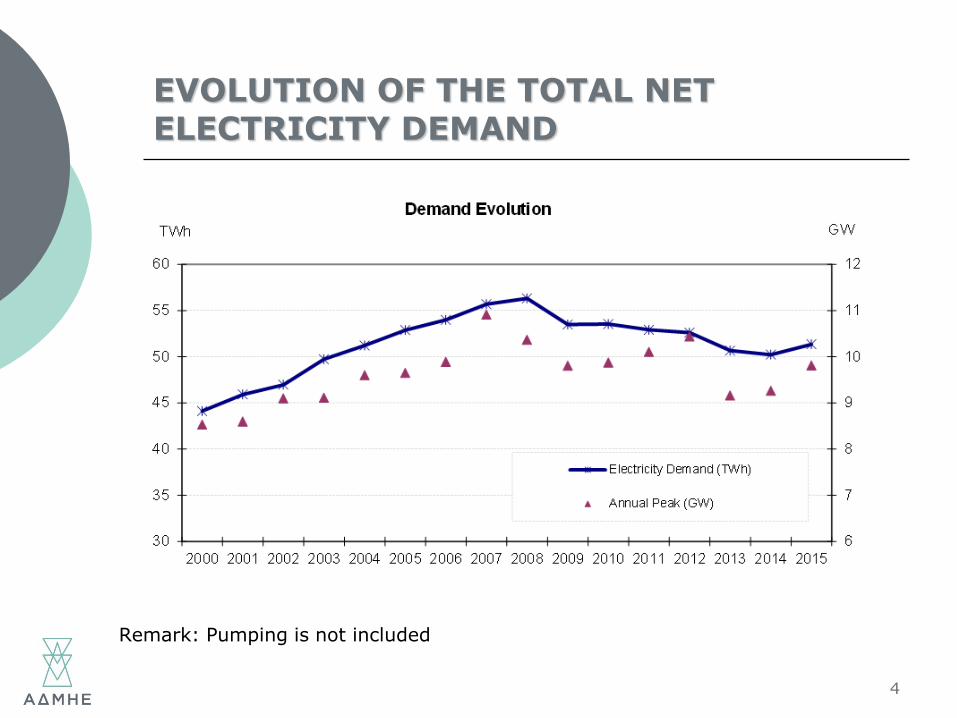
EVOLUTION OF THE TOTAL NET ELECTRICITY DEMAND
4
Remark: Pumping is not included
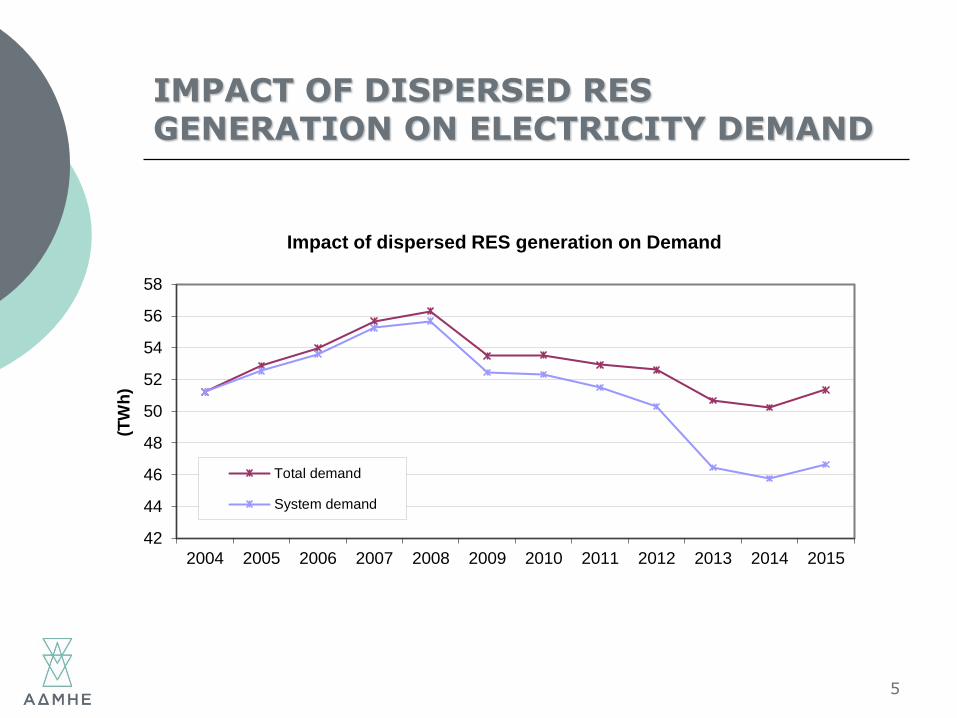
IMPACT OF DISPERSED RES GENERATION ON ELECTRICITY DEMAND
5
42
44
46
48
50
52
54
56
58
2004 2005 2006 2007 2008 2009 2010 2011 2012 2013 2014 2015
(TW
h)
Impact of dispersed RES generation on Demand
Total demand
System demand
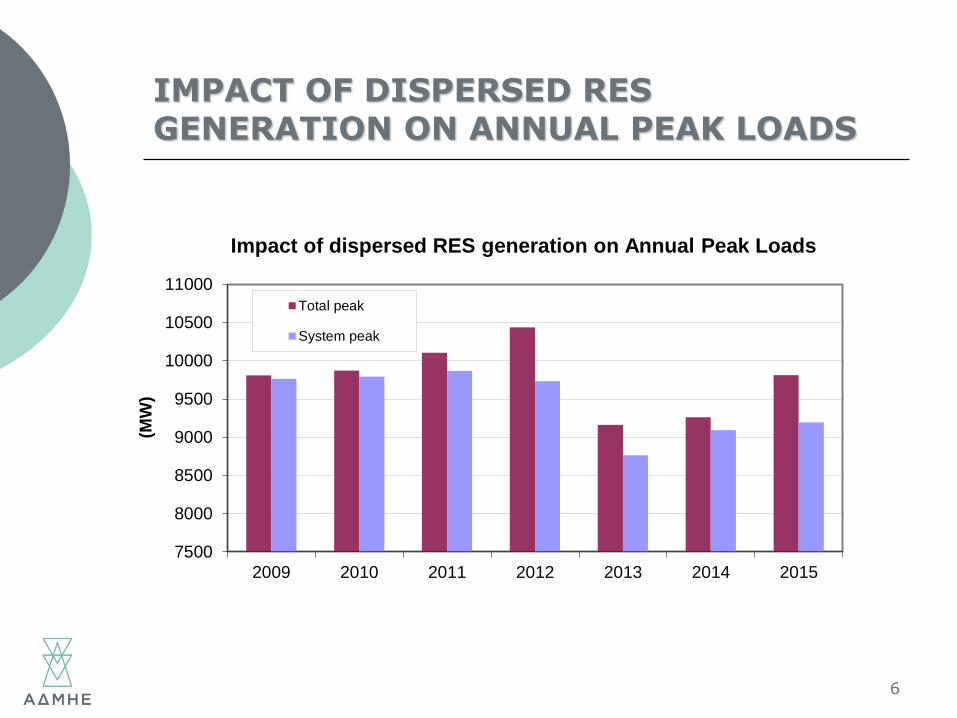
IMPACT OF DISPERSED RES GENERATION ON ANNUAL PEAK LOADS
6
7500
8000
8500
9000
9500
10000
10500
11000
2009 2010 2011 2012 2013 2014 2015
(MW
)
Impact of dispersed RES generation on Annual Peak Loads
Total peak
System peak
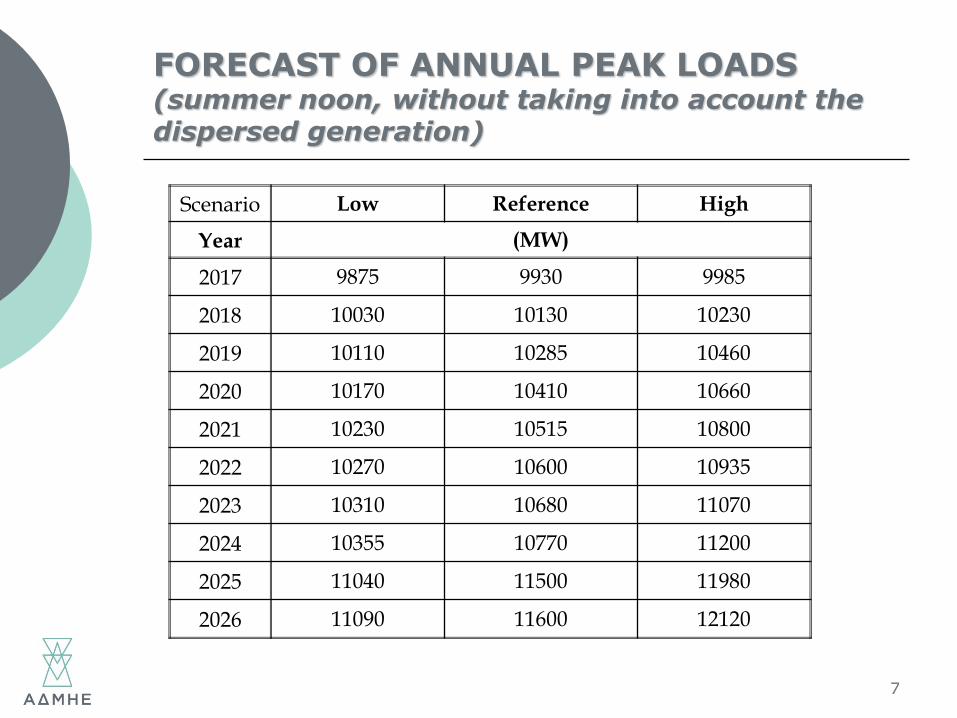
FORECAST OF ANNUAL PEAK LOADS (summer noon, without taking into account the dispersed generation)
7
Scenario Low Reference High
Year (MW)
2017 9875 9930 9985
2018 10030 10130 10230
2019 10110 10285 10460
2020 10170 10410 10660
2021 10230 10515 10800
2022 10270 10600 10935
2023 10310 10680 11070
2024 10355 10770 11200
2025 11040 11500 11980
2026 11090 11600 12120
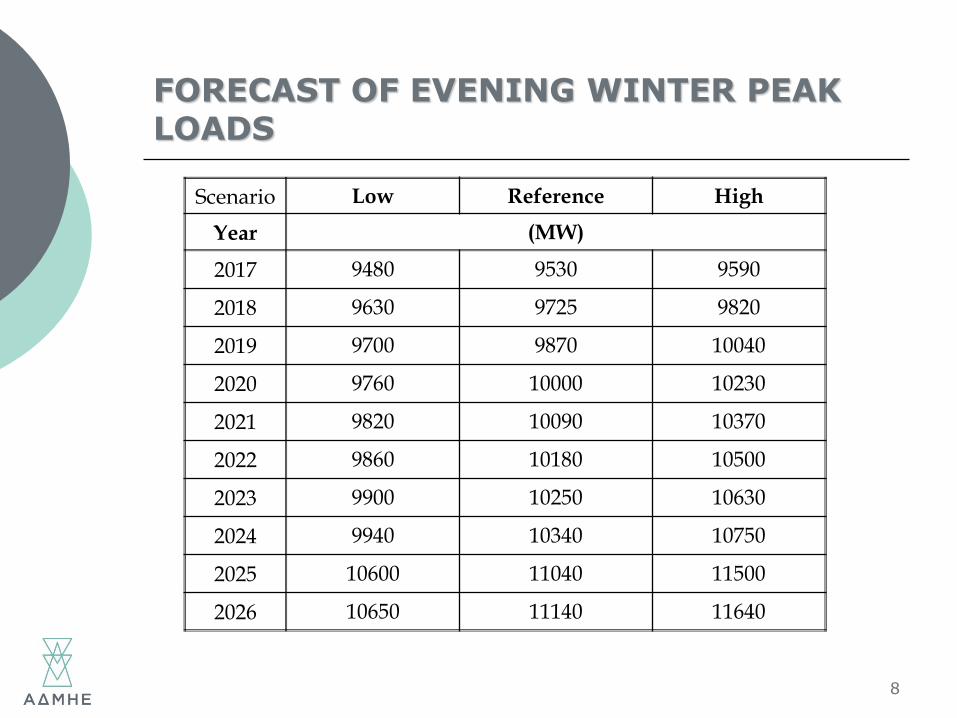
FORECAST OF EVENING WINTER PEAK LOADS
8
Scenario Low Reference High
Year (MW)
2017 9480 9530 9590
2018 9630 9725 9820
2019 9700 9870 10040
2020 9760 10000 10230
2021 9820 10090 10370
2022 9860 10180 10500
2023 9900 10250 10630
2024 9940 10340 10750
2025 10600 11040 11500
2026 10650 11140 11640
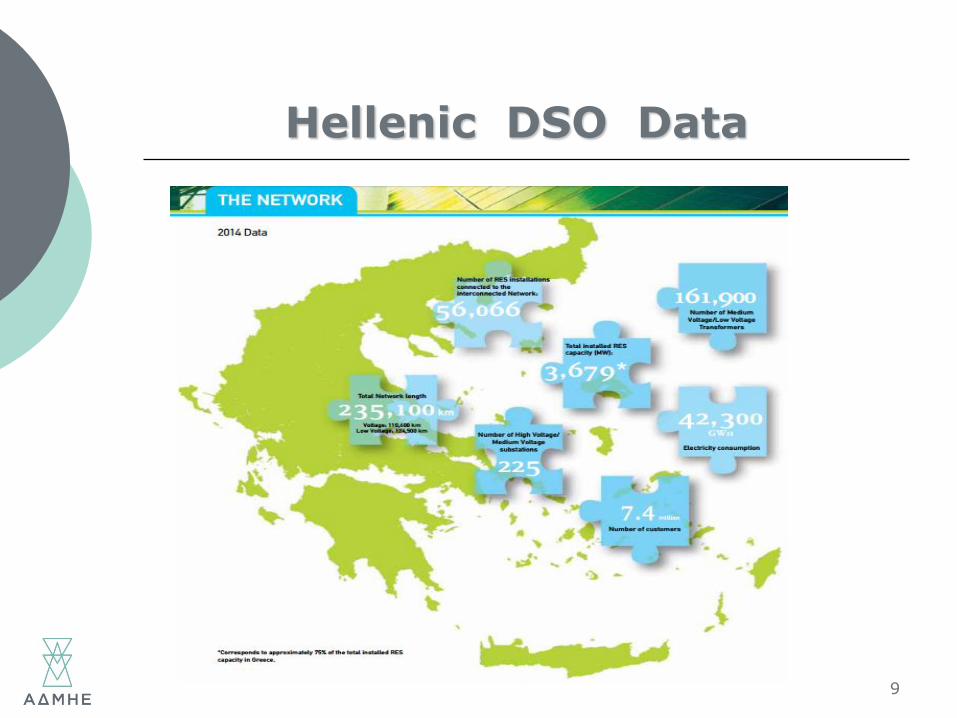
Hellenic DSO Data
9
MAIN DRIVERS FOR THE HELLENIC TRANSMISSION SYSTEM DEVELOPMENT
Besides the needs for demand supply, the main drivers for the development of the Hellenic Electricity Transmission System are:
o Interconnection of Greek islands (security of supply, reduction of the energy cost, environmental issues)
o Connection of conventional (thermal) generation
o Connection of RES generation
Major problem: Reaction of the public and delays in the permitting process.
The progress towards the National and European targets for an increased RES penetration (40% in the electricity sector) is already noticeable
10
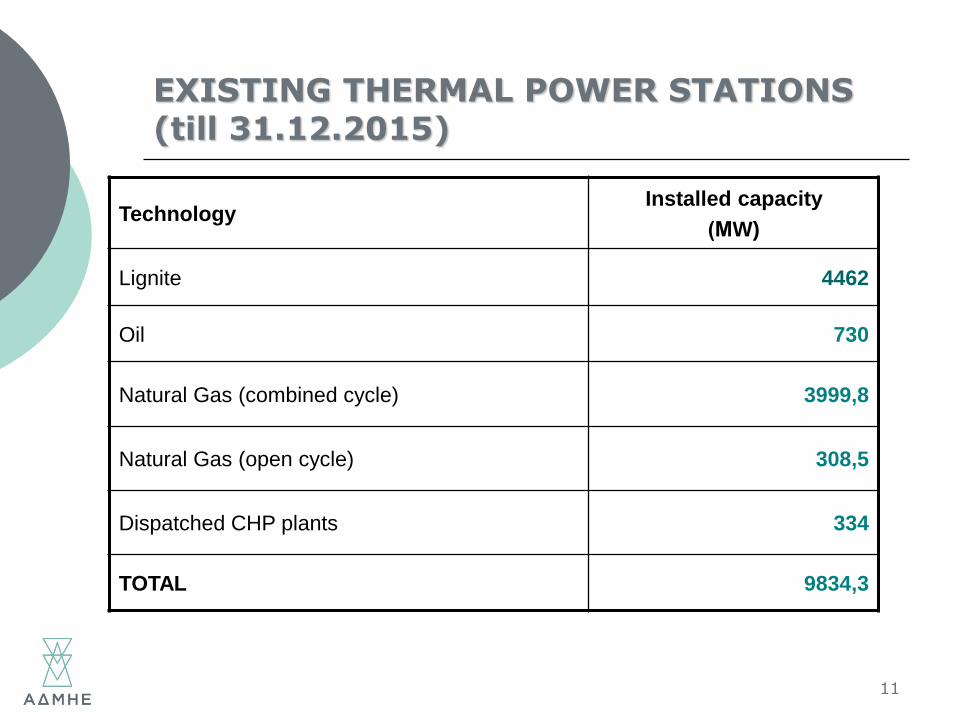
EXISTING THERMAL POWER STATIONS(till 31.12.2015)
11
TechnologyInstalled capacity
(ΜW)
Lignite 4462
Oil 730
Natural Gas (combined cycle) 3999,8
Natural Gas (open cycle) 308,5
Dispatched CHP plants 334
TOTAL 9834,3
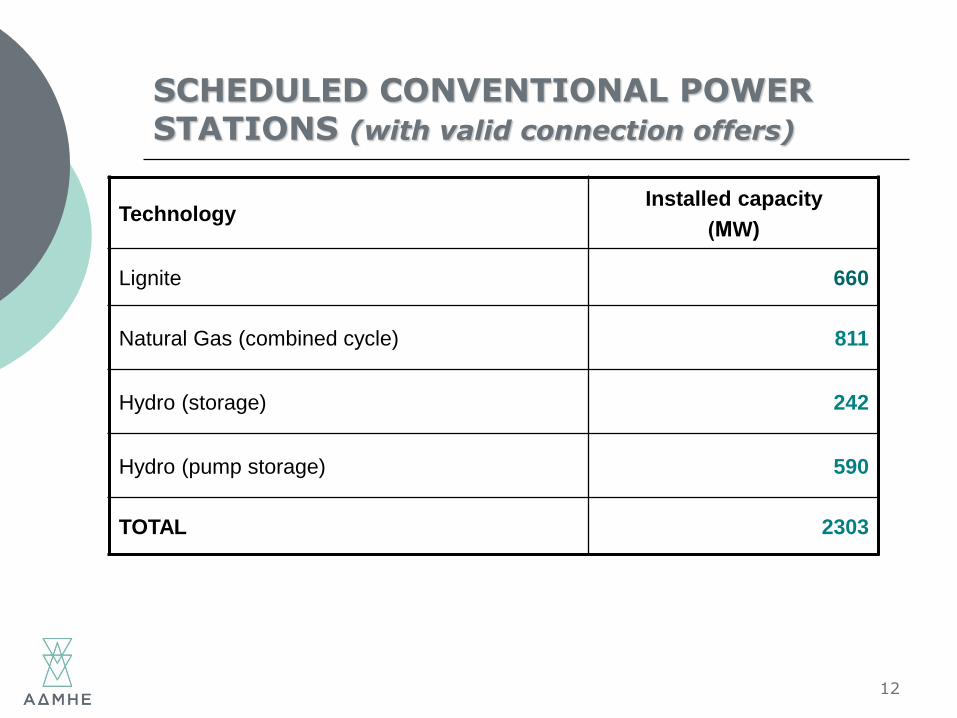
SCHEDULED CONVENTIONAL POWER STATIONS (with valid connection offers)
12
TechnologyInstalled capacity
(ΜW)
Lignite 660
Natural Gas (combined cycle) 811
Hydro (storage) 242
Hydro (pump storage) 590
TOTAL 2303
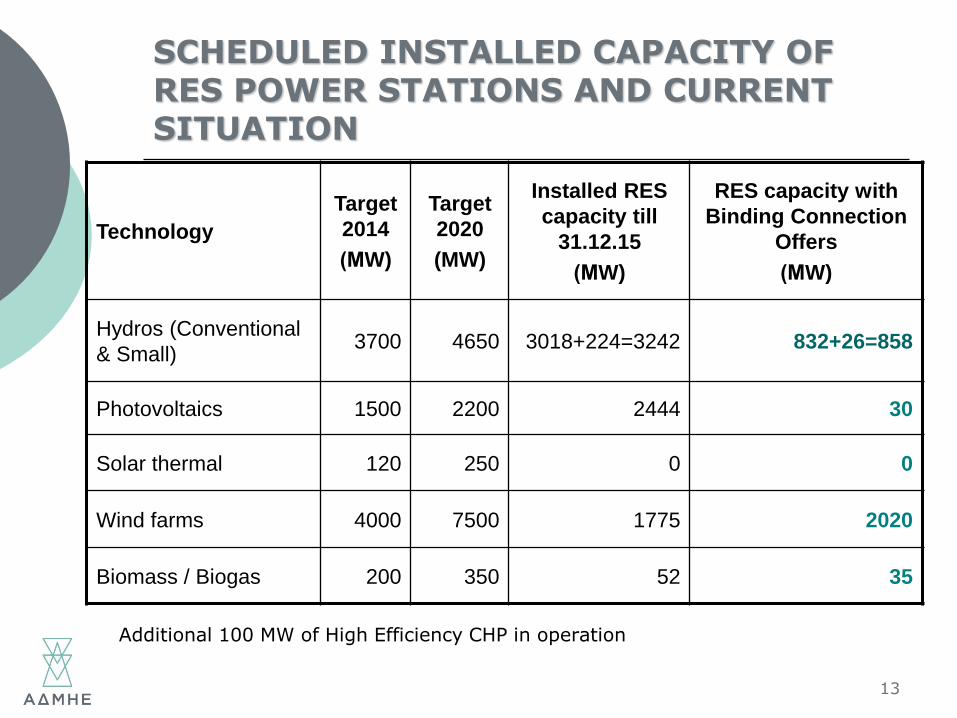
SCHEDULED INSTALLED CAPACITY OF RES POWER STATIONS AND CURRENT SITUATION
13
Technology
Target
2014
(ΜW)
Target
2020
(MW)
Installed RES
capacity till
31.12.15
(ΜW)
RES capacity with
Binding Connection
Offers
(ΜW)
Hydros (Conventional
& Small)3700 4650 3018+224=3242 832+26=858
Photovoltaics 1500 2200 2444 30
Solar thermal 120 250 0 0
Wind farms 4000 7500 1775 2020
Biomass / Biogas 200 350 52 35
Additional 100 MW of High Efficiency CHP in operation
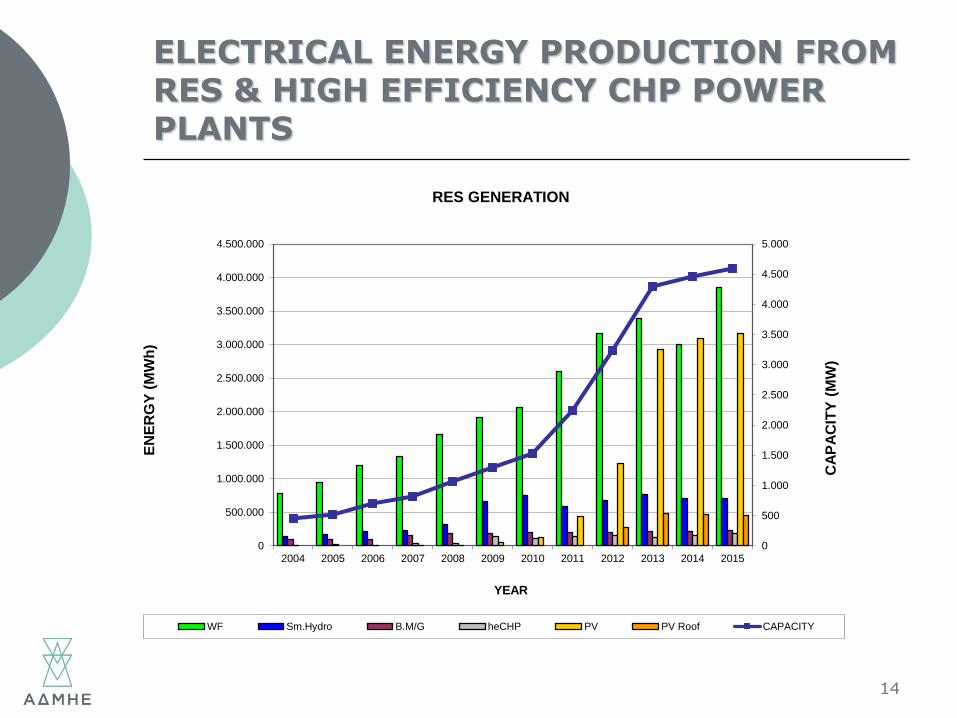
ELECTRICAL ENERGY PRODUCTION FROM RES & HIGH EFFICIENCY CHP POWER PLANTS
14
0
500
1.000
1.500
2.000
2.500
3.000
3.500
4.000
4.500
5.000
0
500.000
1.000.000
1.500.000
2.000.000
2.500.000
3.000.000
3.500.000
4.000.000
4.500.000
2004 2005 2006 2007 2008 2009 2010 2011 2012 2013 2014 2015
CA
PA
CIT
Y (
MW
)
EN
ER
GY
(M
Wh
)
YEAR
RES GENERATION
WF Sm.Hydro B.M/G heCHP PV PV Roof CAPACITY
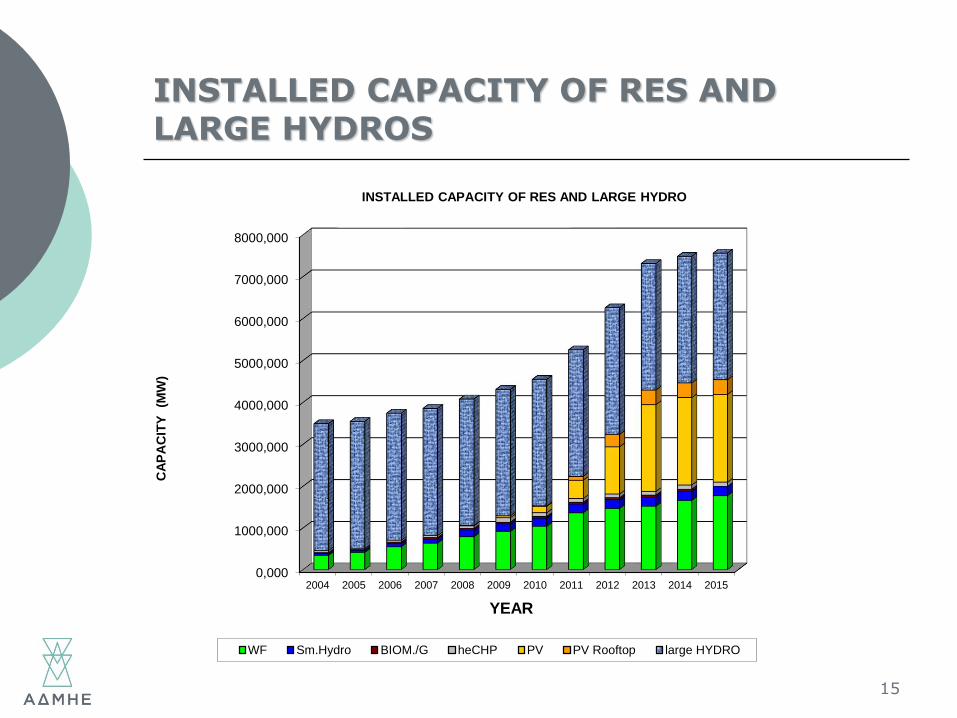
INSTALLED CAPACITY OF RES AND LARGE HYDROS
15
0,000
1000,000
2000,000
3000,000
4000,000
5000,000
6000,000
7000,000
8000,000
2004 2005 2006 2007 2008 2009 2010 2011 2012 2013 2014 2015
CA
PA
CIT
Y
(MW
)
YEAR
INSTALLED CAPACITY OF RES AND LARGE HYDRO
WF Sm.Hydro BIOM./G heCHP PV PV Rooftop large HYDRO
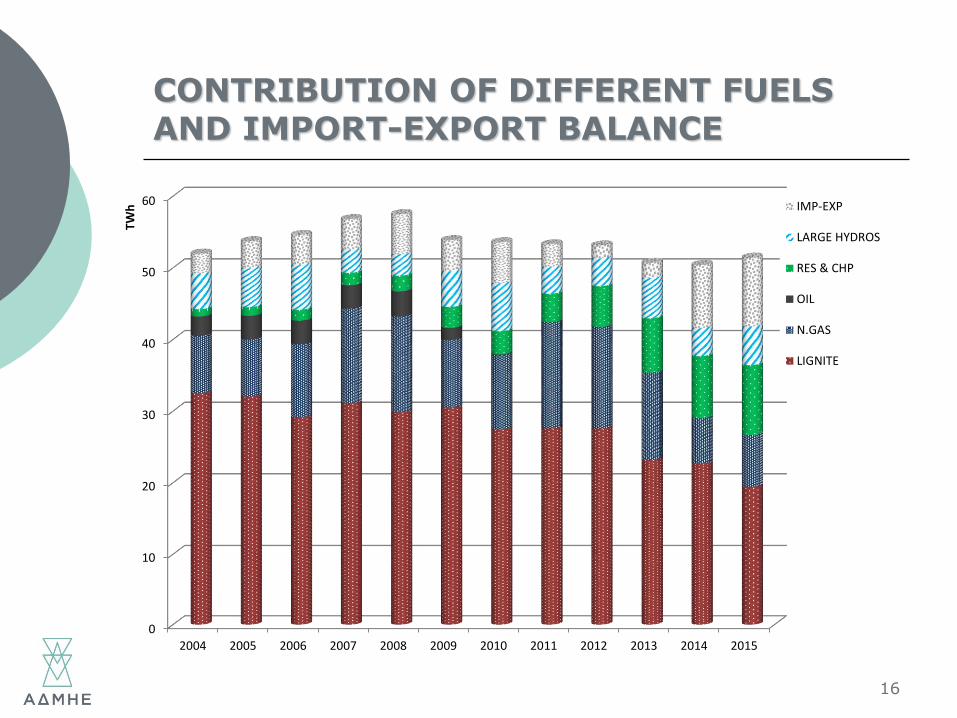
CONTRIBUTION OF DIFFERENT FUELS AND IMPORT-EXPORT BALANCE
16
0
10
20
30
40
50
60
2004 2005 2006 2007 2008 2009 2010 2011 2012 2013 2014 2015
TWh IMP-EXP
LARGE HYDROS
RES & CHP
OIL
N.GAS
LIGNITE
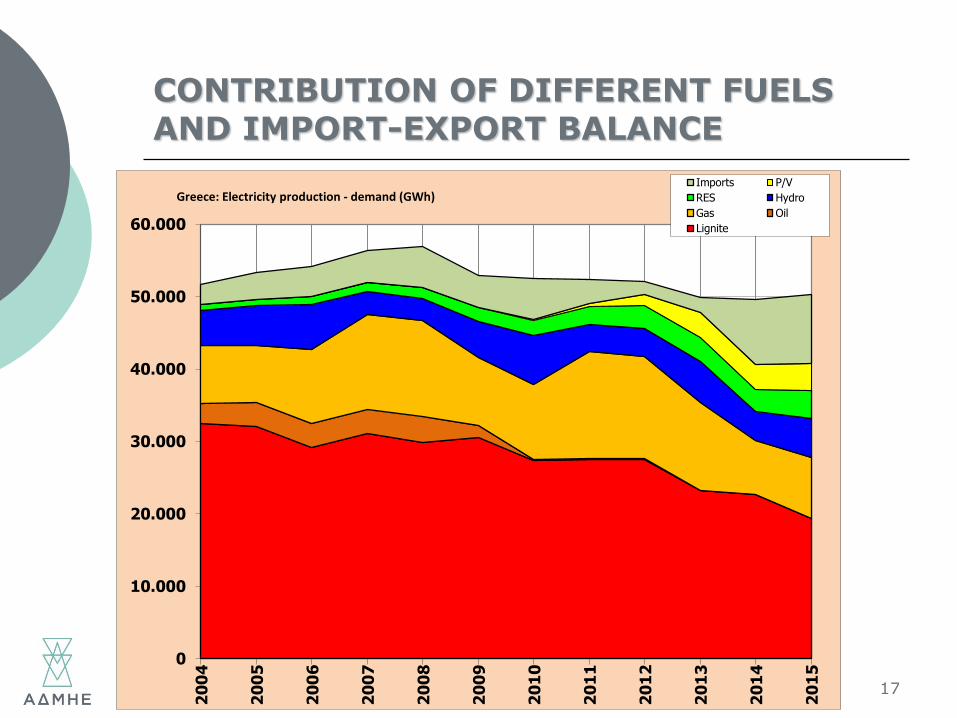
CONTRIBUTION OF DIFFERENT FUELS AND IMPORT-EXPORT BALANCE
17
0
10.000
20.000
30.000
40.000
50.000
60.000
2004
2005
2006
2007
2008
2009
2010
2011
2012
2013
2014
2015
Greece: Electricity production - demand (GWh)Imports P/V
RES Hydro
Gas Oil
Lignite
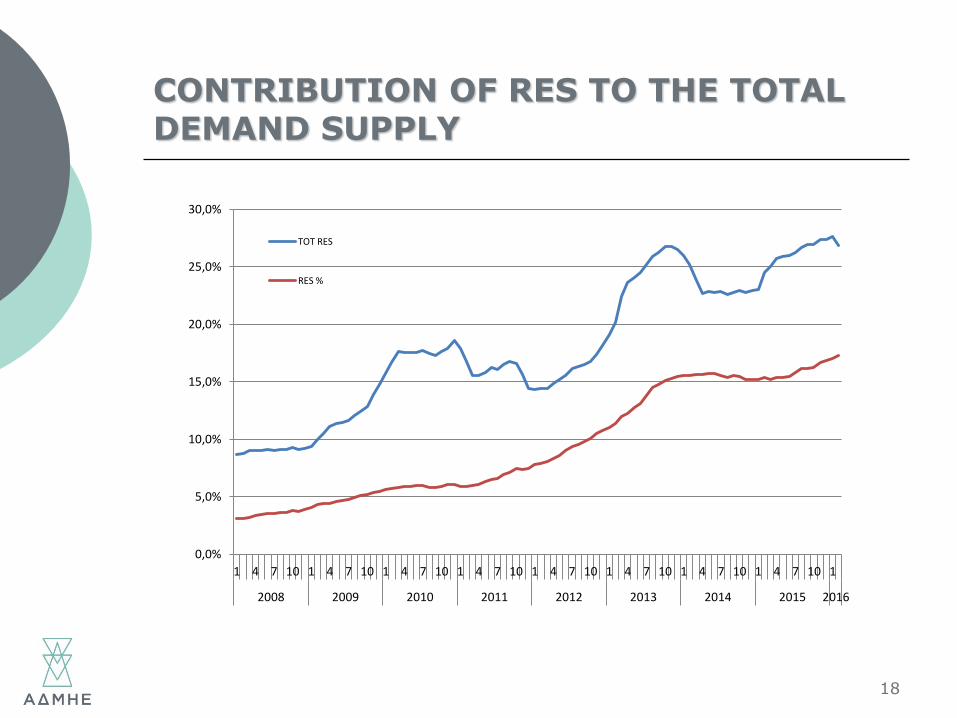
CONTRIBUTION OF RES TO THE TOTAL DEMAND SUPPLY
18
0,0%
5,0%
10,0%
15,0%
20,0%
25,0%
30,0%
1 4 7 10 1 4 7 10 1 4 7 10 1 4 7 10 1 4 7 10 1 4 7 10 1 4 7 10 1 4 7 10 1
2008 2009 2010 2011 2012 2013 2014 2015 2016
TOT RES
RES %
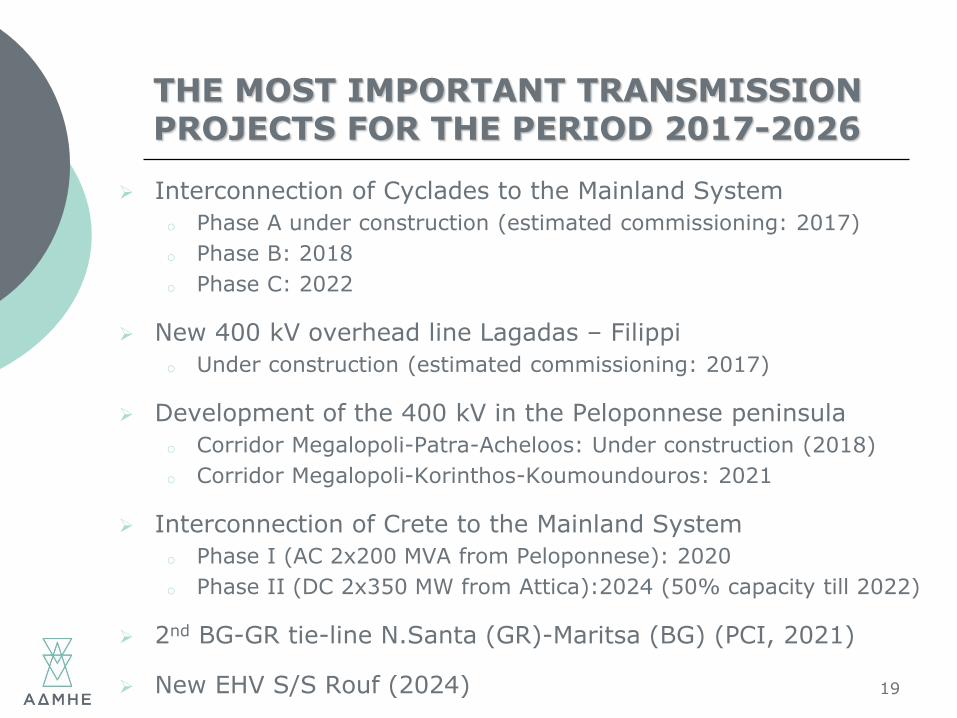
THE MOST IMPORTANT TRANSMISSION PROJECTS FOR THE PERIOD 2017-2026
Interconnection of Cyclades to the Mainland System
o Phase A under construction (estimated commissioning: 2017)
o Phase B: 2018
o Phase C: 2022
New 400 kV overhead line Lagadas – Filippi
o Under construction (estimated commissioning: 2017)
Development of the 400 kV in the Peloponnese peninsula
o Corridor Megalopoli-Patra-Acheloos: Under construction (2018)
o Corridor Megalopoli-Korinthos-Koumoundouros: 2021
Interconnection of Crete to the Mainland System
o Phase I (AC 2x200 MVA from Peloponnese): 2020
o Phase II (DC 2x350 MW from Attica):2024 (50% capacity till 2022)
2nd BG-GR tie-line N.Santa (GR)-Maritsa (BG) (PCI, 2021)
New EHV S/S Rouf (2024) 19
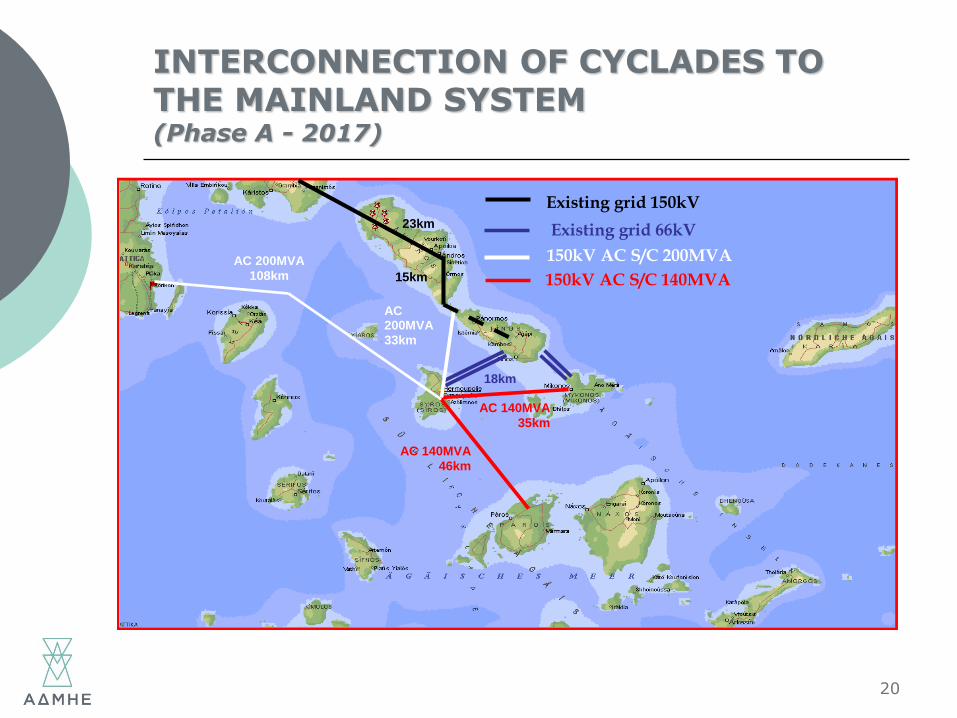
INTERCONNECTION OF CYCLADES TO THE MAINLAND SYSTEM(Phase A - 2017)
20
Existing grid 150kV
15km
23km
AC 200MVA
108km
150kV AC S/C 200MVA 150kV AC S/C 140MVA
AC 200MVA
33km
AC 140MVA
46km
Existing grid 66kV
18km
AC 140MVA
35km
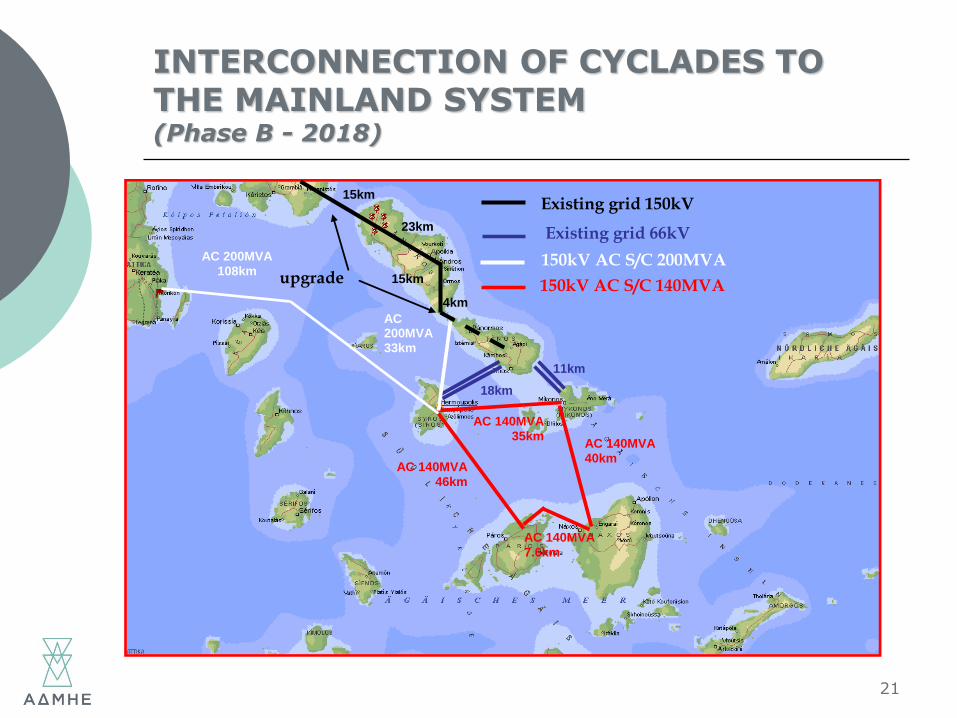
INTERCONNECTION OF CYCLADES TO THE MAINLAND SYSTEM(Phase B - 2018)
21
Existing grid 150kV
15km
23km
15km
AC 200MVA 108km
150kV AC S/C 200MVA 150kV AC S/C 140MVA
AC 200MVA 33km
AC 140MVA
46km
Existing grid 66kV
18km
11km
AC 140MVA 35km
AC 140MVA 40km
AC 140MVA
7.6km
upgrade 4km
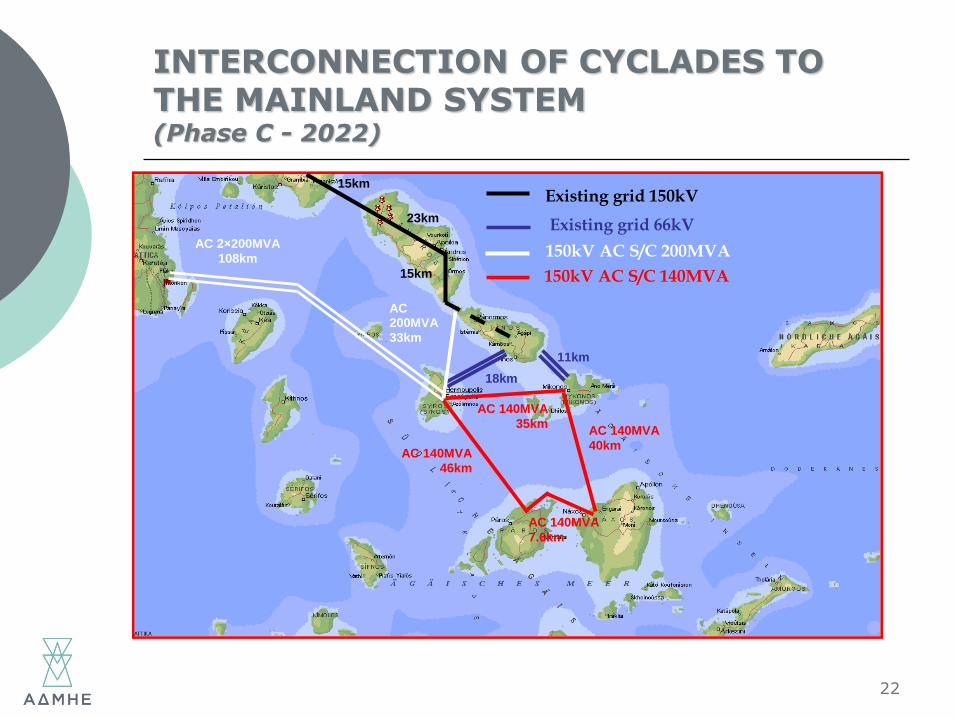
INTERCONNECTION OF CYCLADES TO THE MAINLAND SYSTEM(Phase C - 2022)
22
Existing grid 150kV
15km
23km
AC 2×200MVA
108km 150kV AC S/C 200MVA 150kV AC S/C 140MVA
AC 200MVA 33km
AC 140MVA 46km
Existing grid 66kV
18km
11km
AC 140MVA
35km AC 140MVA
40km
AC 140MVA
7.6km
15km
INTERCONNECTION OF CRETE TO THE MAINLAND TRANSMISSION SYSTEM(crucial parameters)
23
Annual energy consumption ~3ΤWh (~6% of the total National consumption)
An annual surcharge of over 300Μ€ distributed to all consumers
o Local oil power plants of high operation cost, consisting of old power units, with low efficiency, low availability and significant environmental impact
Great difficulties in land purchase for the enhancement of the existing local generation or the development of new plants
Continuous increasing interest for the exploitation of the significant RES potential in Crete
o RES penetration is limited due to significant stability issues likely appear in an isolated power system like that of Crete
INTERCONNECTION OF CRETE TO THE MAINLAND TRANSMISSION SYSTEM(Current challenges)
24
Necessary adaptation to new conditions:
o Directive 2010/75/EC on industrial emissions
o Directive 2015/2193/EC on the limitation of emissions of certain pollutants into the air from medium combustion plants
In the coming years Crete power system will probably face significant and increasing power adequacy issues (taking into account the age of the majority of the existing power units)
The interconnection of Crete becomes «urgent», indicating the implementation time schedule as the most critical parameter for the selection of the appropriate technical solution for the interconnection
BENEFITS FROM THE INTERCONNECTION OF CRETE TO THE MAINLAND TRANSMISSION SYSTEM
25
Increase of the security of supply on the island
Significant savings of fuel costs, with direct effect to the “Public Service” Obligation, which surcharges all national consumers
Significant savings of high investment costs for the development and conversion of local power plants
Better exploitation of the high RES potential (notably the very high wind potential), which is currently very limited due to stability issues in small size autonomous systems
Drastic reduction of the environmental impact caused by the continuous operation of the local power stations, many of which are located in residential areas
Contribution to the reduction (and in long term the elimination) of CO2 pollutants and associated costs
Allows the expansion of the "Energy Market" to the interconnected islands
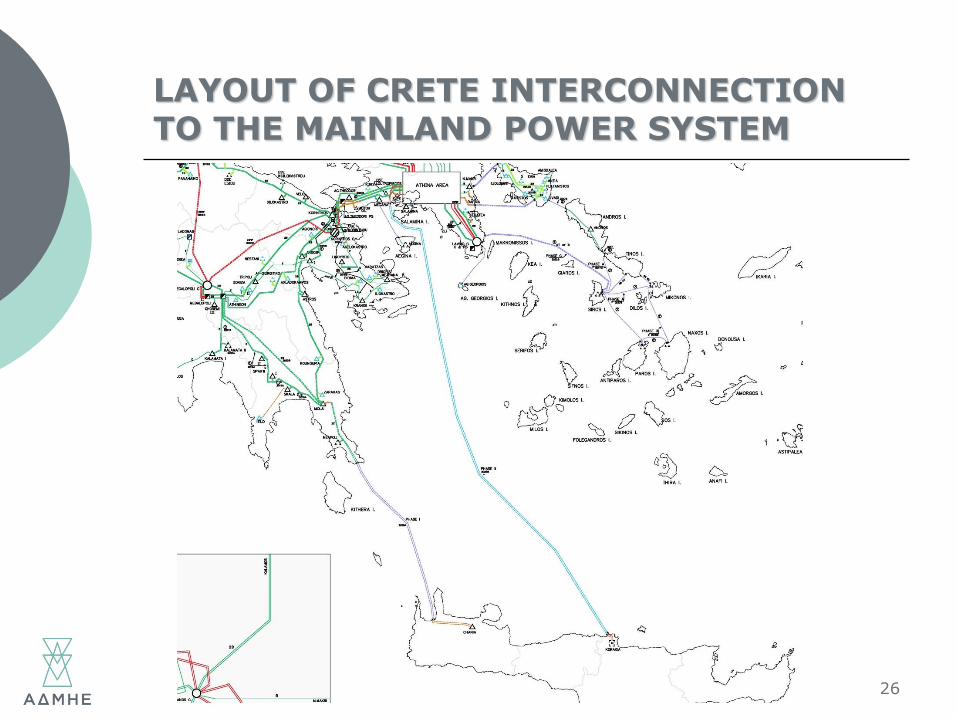
LAYOUT OF CRETE INTERCONNECTION TO THE MAINLAND POWER SYSTEM
26
PHASE I: AC 150kV 2×200MVA INTERCONNECTION CRETE -PELOPONNESE
27
Commissioning date
o The estimated commissioning date (without significant legal or other complications) is by the beginning of 2020 achieve the
target of the most possible fast implementation
Technical assessment: Analysis of steady-state (N and N-1) and dynamic operation in abnormal conditions, for various load and RES scenarios
o The completion of Phase I provides a transmission capacity of 200 ÷ 270 MW from HETS to the System of Crete
o Security of supply level in Crete power system will be significantly high compared to the current conditions: The response to abnormal conditions related to loss of generation is achieved without any need for load shedding
o Drastic reduction of the necessary spinning reserve (of extremely high cost)
o Transmission losses Molai – Chania: ~90÷160 GWh/year
PHASE I: AC 150kV 2×200MVA INTERCONNECTION CRETE -PELOPONNESE
28
Contribution to saving of “Public Service” Obligation
o The contribution of the interconnection to the supply of loads in Crete is estimated to ~1200÷1850 GWh/year (40%÷60% of the total demand in the island) Significant reduction of the operation
cost
Significant savings of high investment costs for the development of new power plants
Enhancement and expansion of 150 kV transmission system in Lakonia
o The necessary projects for the decongestion in the area and for the improvement of the security of supply (new 150 kV S/S in Neapoli and a new 150 kV transmission line for its connection to the System), can be combined with the projects of Phase I of the interconnection of Crete, leading to the simultaneous achievement of multiple targets
PHASE I: AC 150kV 2×200MVA INTERCONNECTION CRETE -PELOPONNESE
29
Decongestion of Peloponnese until the completion of 400kV projects
o Contribution of the absorption of the power generated by the new NG combined cycle unit «Megalopoli V»
Power flow
o First years of operation: Flow direction Peloponnese Crete
o High RES development: Significant restrictions in export capacity in the direction Crete Peloponnese (not eliminated after the completion of 400 kV projects in Peloponnese) need for Phase II
Conclusion
o Cost: ~ 330 Μ€, with extremely short depreciation time
o The current issues in Crete (limited reliability and high production cost) are overcome in a great extend
o Safe cost estimation, avoiding significant technical/environmentalissues compared to a DC solution
PHASE II: DC 2×350MVA INTERCONNECTION CRETE - ATTIKI
30
Commissioning date
o Extended requirements for investigations towards the determination of the optimum path due to objective difficulties related to the geological conditions along the cable laying route path
o Environmental issues
o Probable needs for the development of special technologies(Research & Development)
o The estimated commissioning date (without significant legal or other complications) is by the end of 2024
Cost
o High, with wide range of possible values
o Current estimation: ~700÷1000 Μ€
PHASE II: DC 2×350MVA INTERCONNECTION CRETE - ATTIKI
31
Implementation in two steps:
Laying of two cables and operation with half capacity of the DC link (350 MW) till 2022
o Temporary overcome of the land purchase and granting permissions for the installation of grounding electrode in a lake (lagoon)
Operation in the full capacity of the link (700 MW) till 2024
o Completion of the construction of the lagoon and the installation of the grounding electrode
or
o Additional laying of a medium-voltage cable
HEDNO projects for Intelligent Systems
HEDNO’s strategic projects for the Network modernization and the transition to the new era of "Intelligent Systems":
HEDNO is currently under technical evaluation of the offers for a telemetering system testing 160.000 smart meters in a pilot project. The meters will be installed in commercial and residential areas, both inland and on islands in order to test the meters in different situations.
In addition to this pilot, HEDNO will also spend 5 million euros to set up 27 microgrids on islands and 7,6 million euros to set up energy and local control centers for CRETE and RHODES. To that end 3.000 remote control devices and 19.000 smart meters are currently being tendered.
32
Other HEDNO Projects for modernization of Distribution
HEDNO’s current Business Plan includes investments amounting to 1.25 bln euro within a 5-year period and 12 Strategic Projects that will constitute the primary "vehicle" to drive materialization of the strategic goals.
Among these projects are the following:
Five new state-of-the art Distribution Control Centers
Roll out of Smart metering at a National level.
Island Energy Control Centers providing new management tools and applications
33

Thank you for your attention
34